The pioneer factor OCT4 requires the chromatin remodeller BRG1 to support gene regulatory element function in mouse embryonic stem cells
- University of Oxford, United Kingdom
Figures
Figure 1 with 3 supplements

OCT4 binds distal regulatory sites in mouse embryonic stems cells to shape chromatin accessibility.
(A) Western blot analysis of OCT4cond (ZHBTC4) mouse ESCs before (UNT) and after 24 hr treatment with doxycycline (DOX). (B) Alkaline phosphatase staining of OCT4cond mouse ESCs before (UNT) and after 24 hr DOX treatment. (C) A metaplot of OCT4 ChIP-seq signal in OCT4cond ESCs before (UNT) and after 24 hr DOX treatment at OCT4 peaks (n = 15920). (D) Annotation of OCT4 peaks as promoters or distal regulatory elements using the relative enrichment of promoter-associated H3K4me3 or distal regulatory element-associated H3K4me1. (E) A genomic snapshot of ATAC-seq and OCT4 ChIP-seq signal in OCT4cond ESCs before (UNT) and after 24 hr DOX treatment at the Utf1 locus. The downstream OCT4-bound regulatory element is highlighted in the grey box. (F) A heatmap illustrating OCT4 targets (n = 15920) ranked by their loss of chromatin accessibility (ATAC-seq) after 24 hr DOX treatment of OCT4cond ESCs. Normalised read densities for ATAC-seq and OCT4 ChIP-seq are presented, with a heatmap indicating their annotation as either promoters or distal regulatory elements (right). (G) A metaplot of OCT4cond ATAC-seq signal before (UNT) and after 24 hr DOX treatment at OCT4 binding sites with significant reductions in ATAC-seq signal (OCT4-dependent; n = 11557) and those without significant changes (OCT4-independent; n = 4362). Tn5 control represents transposition of purified genomic DNA to control for potential sequence bias. (H) As in (G), profiling the changes in nucleosome occupancy before (UNT) and after (DOX) OCT4 depletion. Nucleosome signal was generated using the NucleoATAC package. (I) Piecharts identifying the proportion of OCT4-bound distal regulatory elements (left) or OCT4-bound promoters (right) that display significant changes in chromatin accessibility as measured by ATAC-seq. Changes were deemed to be significant with FDR < 0.05 and a fold change greater than 1.5-fold. (J) A metaplot depicting the OCT4cond ATAC-seq signal before (UNT) and after (DOX) treatment at the 25% of OCT4 peaks with the greatest changes in ATAC-seq signal following OCT4 depletion. (K) Gene ontology analysis for genes closest to OCT4 target sites depicted in (J). This reveals an enrichment for the pluripotency expression network (left) and biological processes associated with developmental gene regulation (right).
Figure 1—figure supplement 1
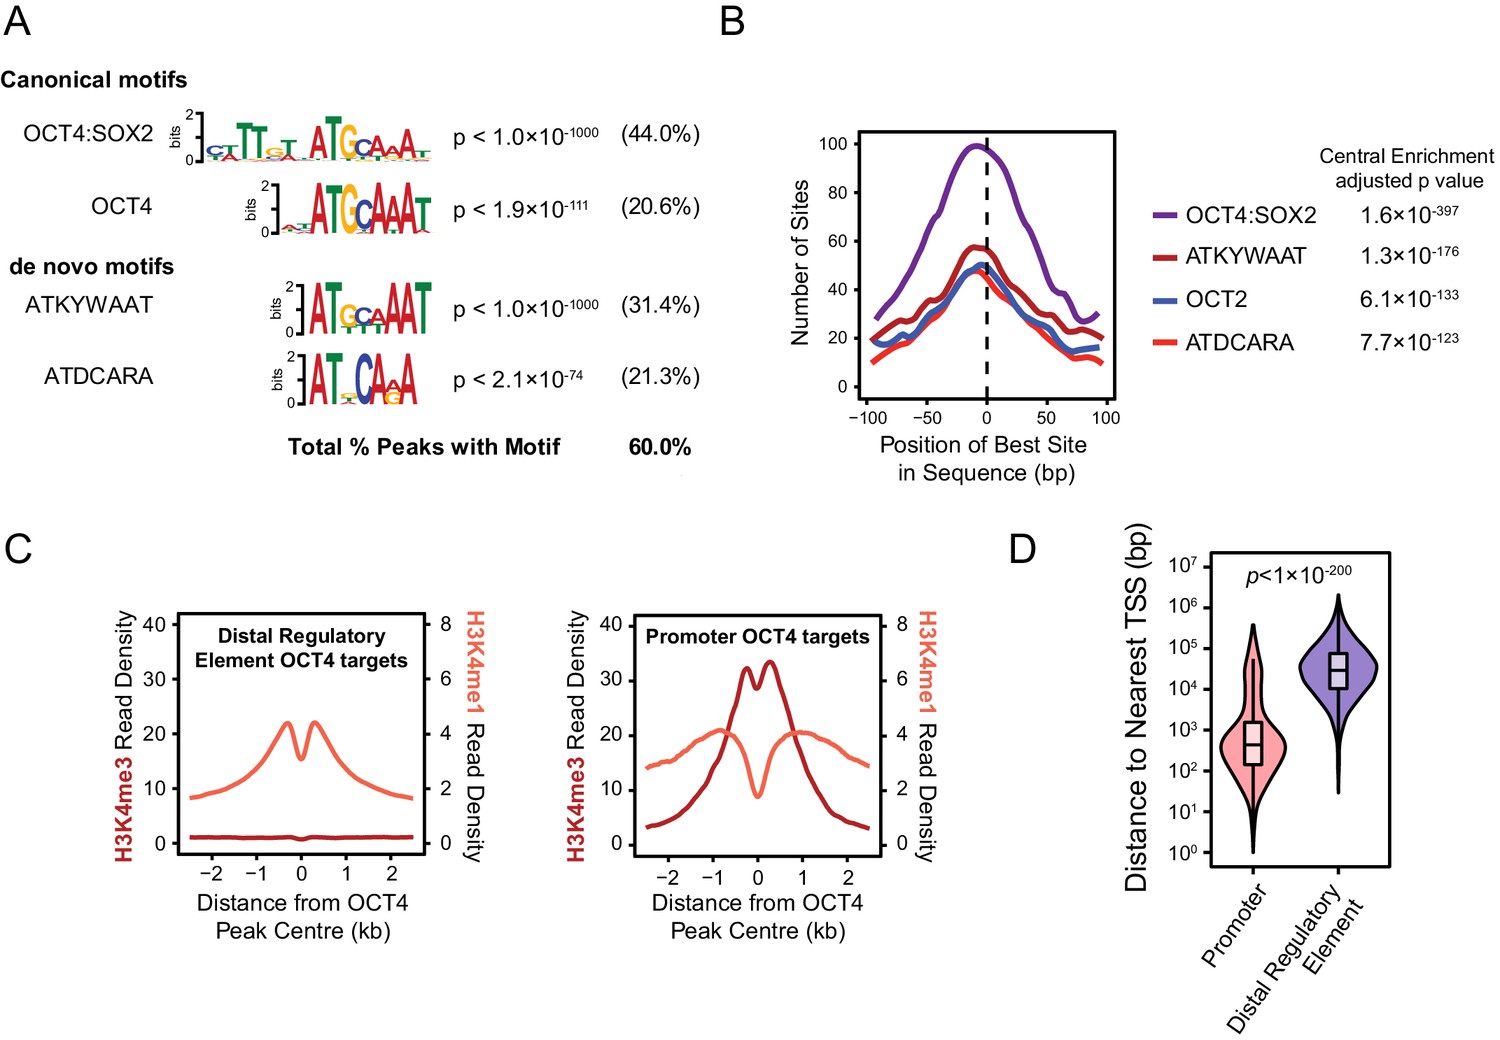
Annotation and characterisation of OCT4 binding sites in OCT4cond ESCs.
(A) Motif enrichment analysis for canonical motif sequences (top) or de novo motif sequences (bottom) reveals high enrichment for OCT4 (POU5F1) and similar motif sequences in the OCT4cond OCT4 binding sites (n = 15920). % reflects the percentage of OCT4 peaks identified to contain each motif sequence. (B) Central enrichment analysis performed by CentriMO reveals that canonical and de novo OCT4 motifs are centrally enriched at OCT4 peak intervals. (C) A metaplot of H3K4me1 and H3K4me3 at OCT4 binding sites annotated as distal regulatory elements or promoters. (D) A violin plot comparing the distance from OCT4 binding sites annotated as distal regulatory elements or promoters to nearest refGene TSS. p denotes significance value by Wilcoxon ranked-sign test.
Figure 1—figure supplement 2

Changes in chromatin accessibility at OCT4-bound sites following depletion of OCT4 in ESCs.
(A) Genomic snapshots of OCT4-dependent chromatin accessibility (ATAC-seq) before (UNT) and after (DOX) OCT4 depletion. Distal OCT4 binding sites are highlighted in grey boxes. (B) Genomic snapshot of OCT4-independent chromatin accessibility at OCT4-bound promoter.
Figure 1—figure supplement 3
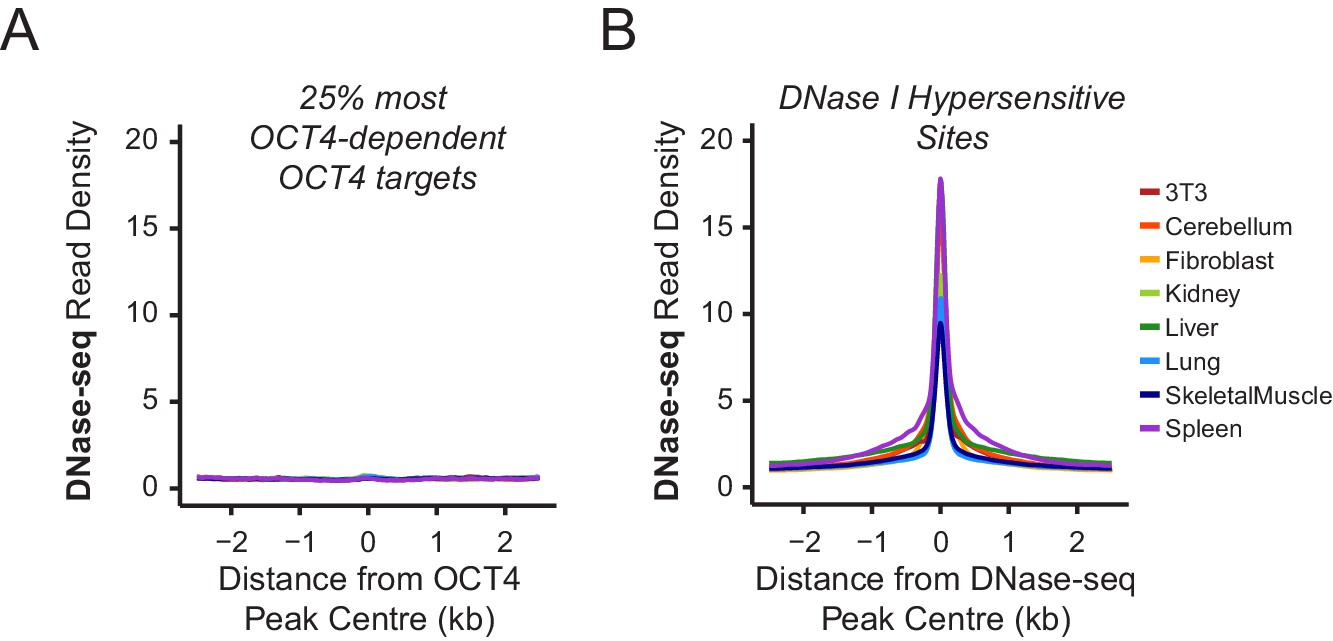
Chromatin accessibility profiling at OCT4 binding sites in somatic cell lines or tissues.
(A) A metaplot of ENCODE DNase-seq profiles for eight mouse cell lines or tissues (Yue et al., 2014) at OCT4 targets most dependent upon OCT4 for normal chromatin accessibility (25% most affected in OCT4cond ESCs; as in Figure 1J). This reveals that these sites are completely inaccessible in somatic cell lines or tissues which lack OCT4 expression. (B) A metaplot analysis of ENCODE DNase-seq data in (A) profiled at DNase I hypersensitive sites identified from each cell line/tissue.
Figure 2 with 1 supplement
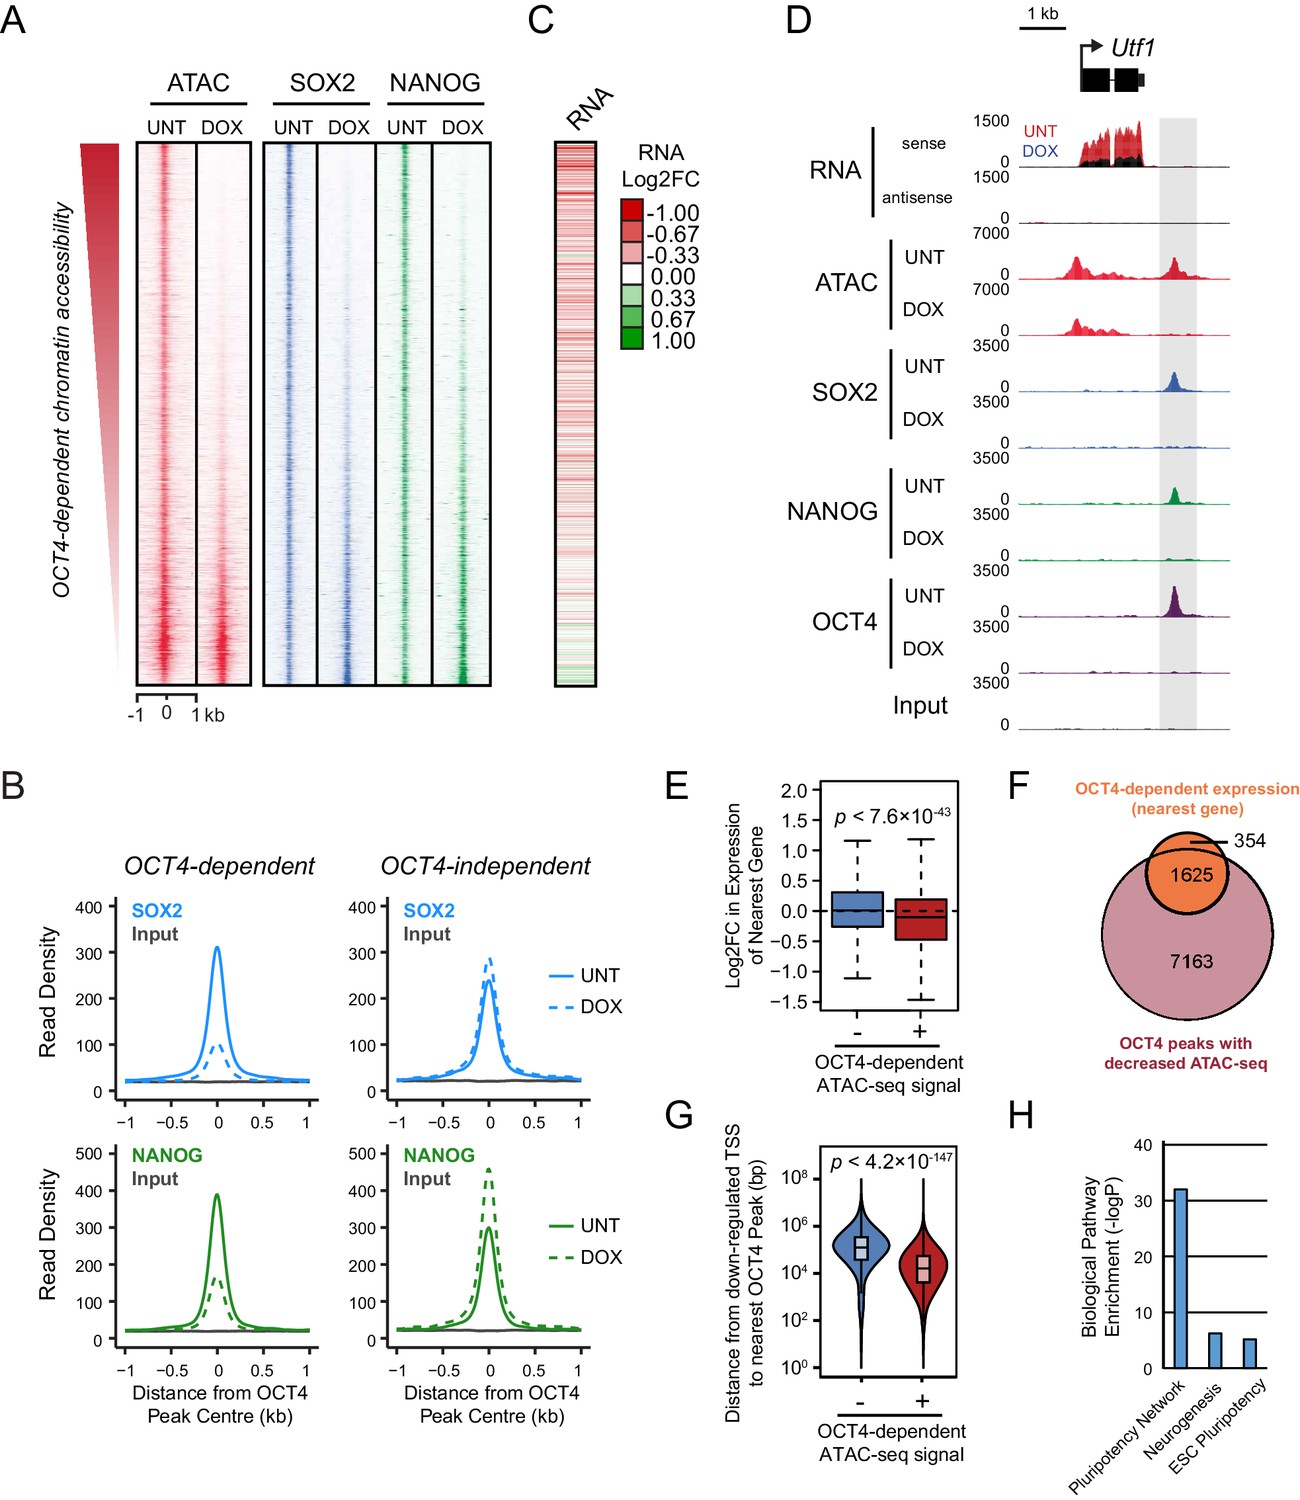
Loss of OCT4 leads to reduced pluripotency-associated transcription factor binding and expression of nearby genes.
(A) A heatmap illustrating SOX2 and NANOG ChIP-seq at OCT4 targets (n = 15920) ranked by their loss of chromatin accessibility (ATAC-seq) after 24 hr DOX treatment of OCT4cond ESCs, as in Figure 1F. (B) A metaplot of OCT4cond SOX2 and NANOG ChIP-seq signal before (UNT) and after 24 hr DOX treatment at OCT4 binding sites with significant reductions in ATAC-seq signal (OCT4-dependent; n = 11557) and those without significant changes (OCT4-independent; n = 4362). (C) A heatmap of the log2 fold change in RNA-seq signal of the closest gene to OCT4 target sites depicted in (A), following 24 hr DOX treatment of the OCT4cond ESCs. (D) A genomic snapshot of Utf1, which is decreased in expression following loss of OCT4. The distal OCT4 target site is highlighted by a grey box. (E) Comparison of log2 fold change (log2FC) in RNA-seq signal for genes neighbouring OCT4 target sites that rely on OCT4 for ATAC-seq signal (OCT4-dependent; n = 11557) or those that do not (OCT4-independent; n = 4362). (F) A Venn diagram comparing the OCT4 binding sites for which the nearest gene has significantly reduced expression after OCT4 ablation (orange; n = 1979) and the OCT4 targets with significant reductions in chromatin accessibility (red; n = 8788). Only OCT4 target sites for which the nearest gene has sufficient RNA-seq coverage are included. (G) A violin plot comparing the distance from OCT4 binding sites with OCT4-dependent (n = 11557) or OCT4-independent (n = 4362) chromatin accessibility to nearest TSS with significant reductions in RNA-seq following 24 hr DOX treatment of the OCT4cond ESCs (n = 1430). (H) Gene ontology analysis for genes down-regulated after loss of OCT4 (n = 1430) reveals enrichment of the pluripotency transcriptional network.
Figure 2—figure supplement 1
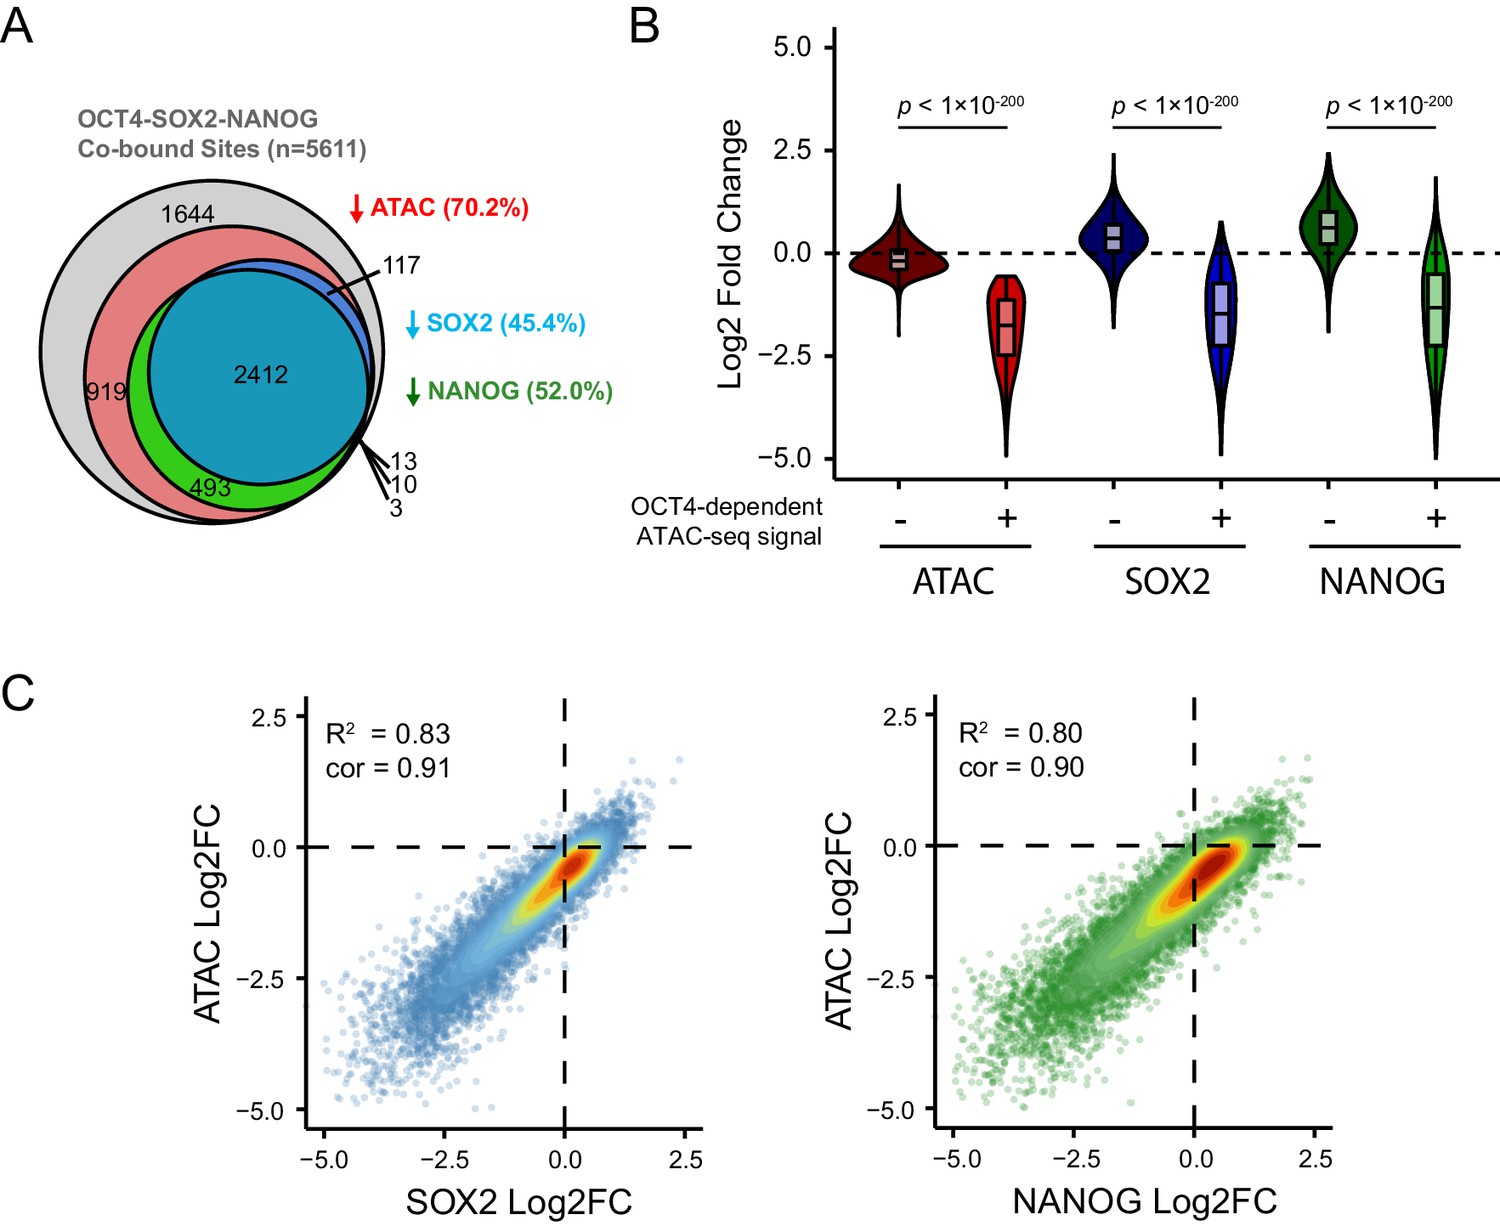
Loss of SOX2 and NANOG is highly correlated with reductions in chromatin accessibility at OCT4-SOX2-NANOG targets.
(A) A Venn diagram depicting the relationship between significant reductions in ATAC-seq and SOX2/NANOG ChIP-seq signal at OCT4-SOX2-NANOG co-bound peaks (n = 5611). % denotes percentage of OCT4-SOX2-NANOG peaks with significant reduction for each factor or assay. (B) A violin plot comparing the log2 fold change in SOX2 and NANOG ChIP-seq signal after depletion of OCT4 between OCT4-SOX2-NANOG co-bound peaks with OCT4-dependent (n = 3941) or OCT4-independent (n = 1644) chromatin accessibility. (C) Scatterplots depicting log2 fold changes of SOX2 or NANOG against the log2 fold change in chromatin accessibility (measured by ATAC-seq) at OCT4-SOX2-NANOG co-bound targets (n = 5611) in OCT4cond ESCs after 24 hr DOX treatment.
Figure 3 with 1 supplement
The chromatin remodelling enzyme BRG1 is required to create accessible chromatin at OCT4 target sites.
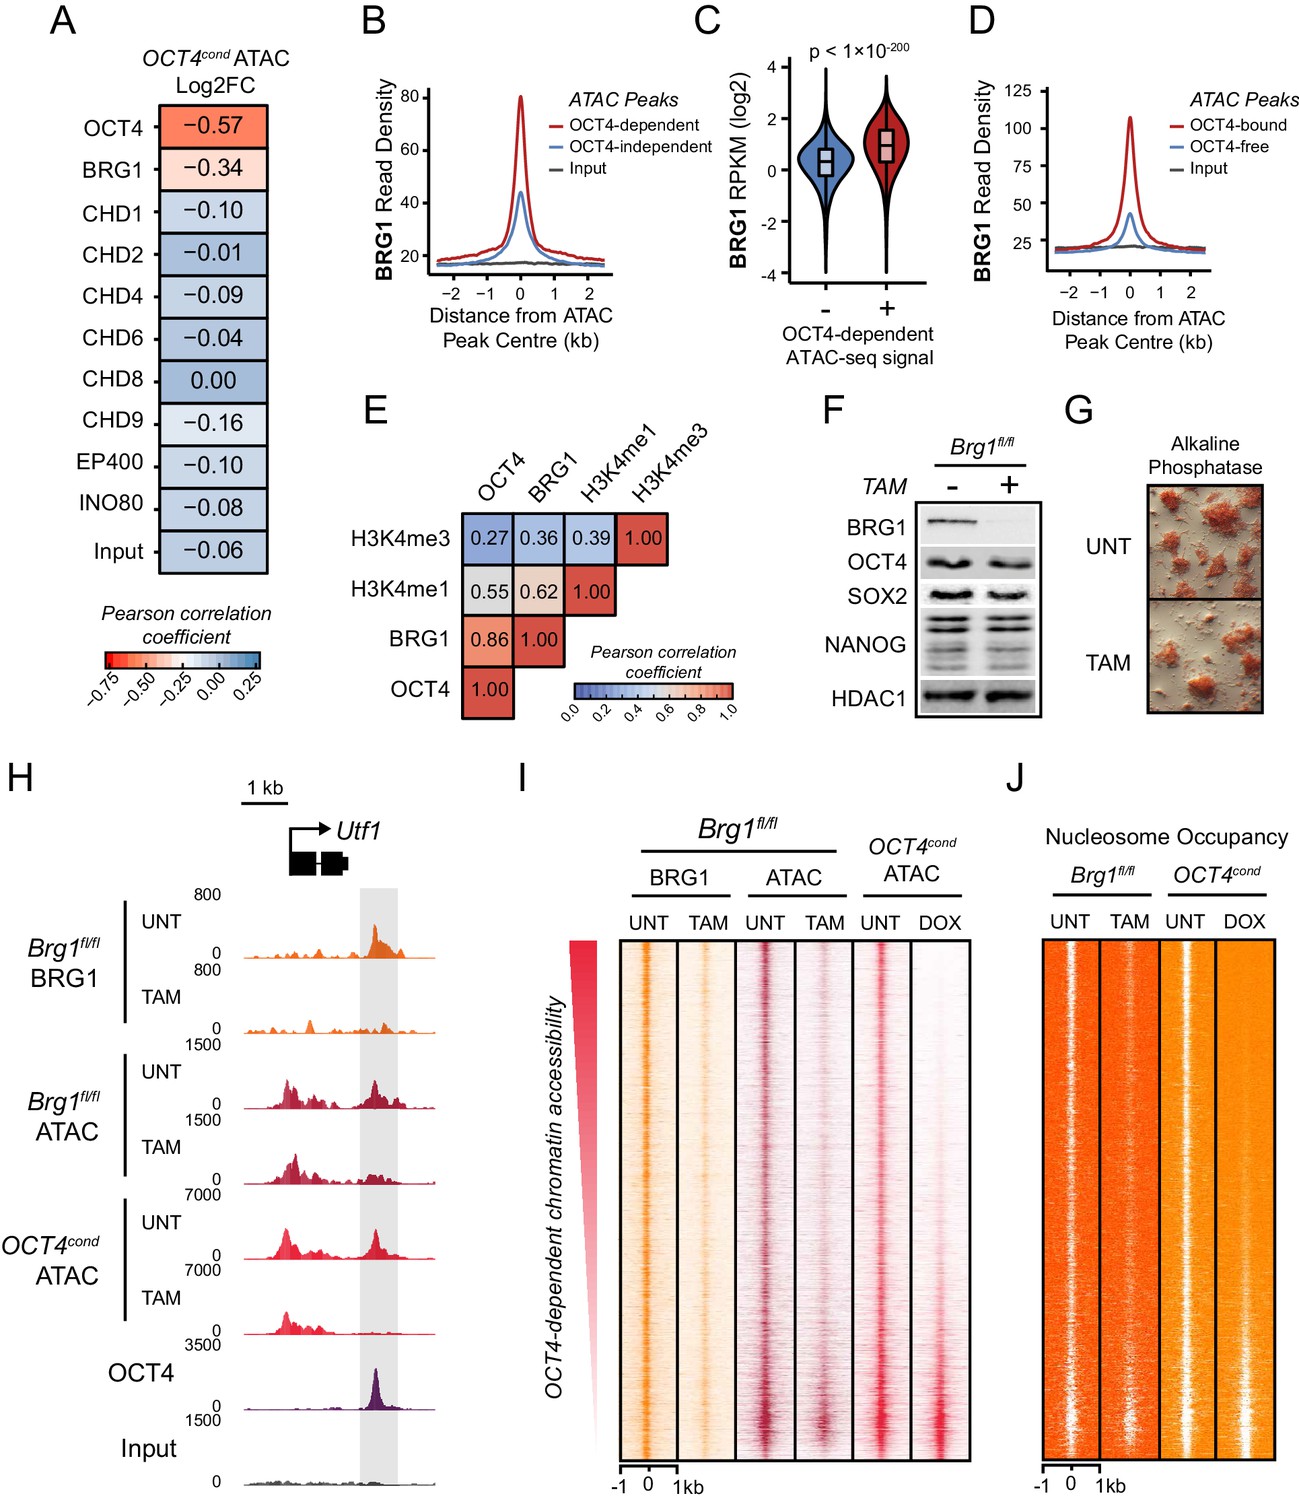
(A) A Pearson correlation matrix comparing log2 fold change in ATAC-seq signal in OCT4-depleted cells with wild type ESC ChIP-seq signal for nine chromatin remodellers at wild type ATAC hypersensitive peaks (n = 76,642). (B) A metaplot of BRG1 ChIP-seq signal at ATAC hypersensitive peaks with (OCT4-dependent) or without (OCT4-independent) significant reduction in ATAC-seq signal following removal of OCT4. (C) A violin plot quantifying and comparing BRG1 ChIP-seq reads per kilobase per million (RPKM) at OCT4-dependent or OCT4-independent ATAC-seq peaks depicted in (B). (D) A metaplot of BRG1 ChIP-seq signal at OCT4-bound or OCT4-free ATAC-seq peaks. (E) Genome-wide correlation of OCT4, BRG1, H3K4me1 and H3K4me3 in 2 kb windows reveals a high degree of co-localization between OCT4 and BRG1. (F) Western blot analysis for the indicated proteins in Brg1fl/fl mouse ESCs before (UNT) and after 72 hr tamoxifen (TAM) treatment. (G) Alkaline phosphatase staining of Brg1fl/fl ESCs before (UNT) and after 72 hr TAM treatment. (H) A genomic snapshot of BRG1 ChIP-seq and ATAC-seq in Brg1fl/fl ESCs before (UNT) and after 72 hr TAM treatment at the distal OCT4 target site downstream of Utf1 (highlighted in grey). The OCT4cond ATAC-seq is included for comparison and reveals a co-dependency on OCT4 and BRG1 for normal chromatin accessibility. (I) A heat map of BRG1 ChIP-seq and ATAC-seq at OCT4 target sites (n = 15920) in Brg1fl/fl ESCs before (UNT) and after 72 hr TAM treatment. Sites are ranked by loss of ATAC-seq signal following removal of OCT4, as in Figure 1F, and the OCT4cond ATAC-seq is included for comparison. (J) As in (I), changes in nucleosome occupancy before (UNT) and after (TAM) BRG1 depletion are plotted based on nucleosome signal derived from the NucleoATAC package.
Figure 3—figure supplement 1
OCT4 target sites require BRG1 to maintain chromatin accessibility.
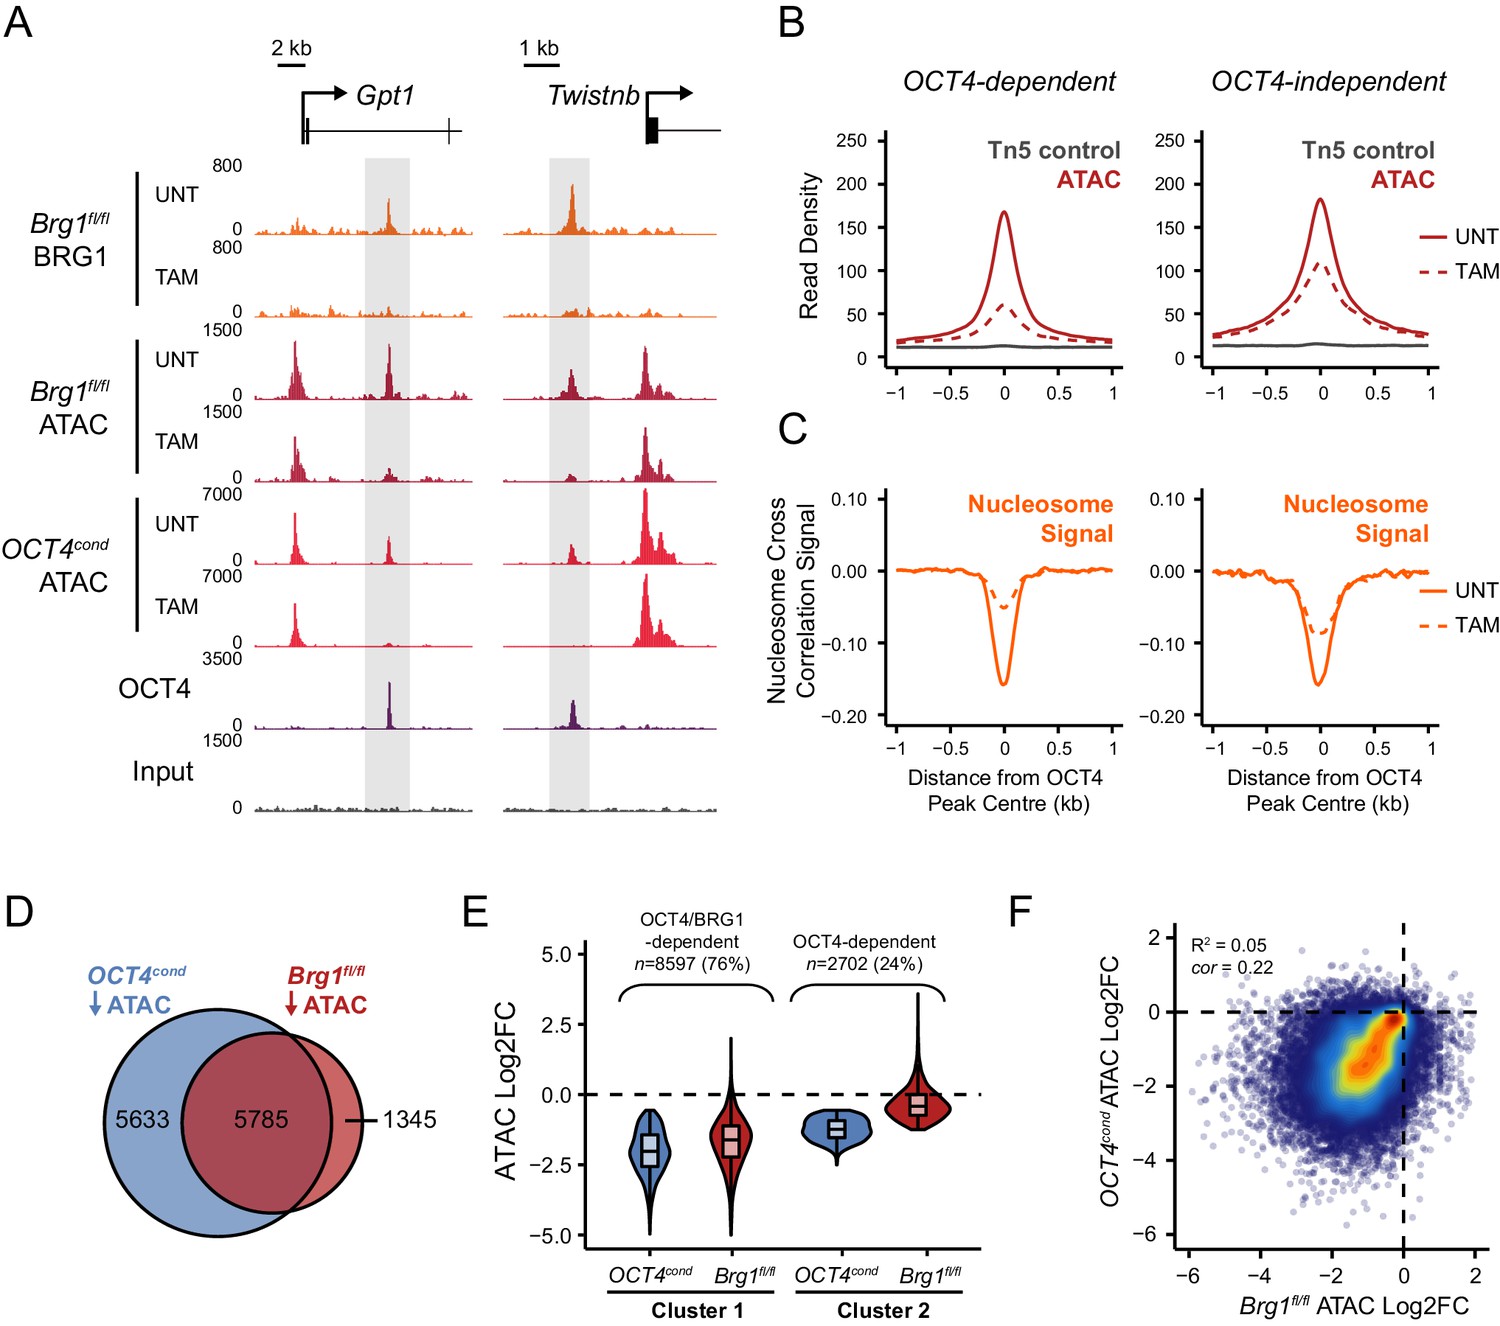
(A) Genomic snapshots of BRG1 ChIP-seq and ATAC-seq in Brg1fl/fl ESCs before (UNT) and after 72 hr TAM treatment at two distal OCT4 target sites (highlighted in grey). The OCT4cond ATAC-seq is included for comparison and reveals dependency on both OCT4 and BRG1 for chromatin accessibility. (B) A metaplot of Brg1fl/fl ATAC-seq signal before (UNT) and after 72 hr TAM treatment at OCT4 binding sites that rely upon OCT4 for chromatin accessibility (OCT4-dependent; n = 11557) and those that do not (OCT4-independent; n = 4362), as in Figure 1G. Tn5 control represents transposition of purified genomic DNA to control for potential sequence bias. (C) Same as in (B), but profiling the changes in nucleosome occupancy before (UNT) and after (TAM) BRG1 depletion. Nucleosome signal was generated using the NucleoATAC package. (D) Venn diagram overlap of OCT4 targets which significantly lose ATAC-seq signal (FDR < 0.05; fold change > 1.5) following deletion of OCT4 (OCT4cond) or BRG1 (Brg1fl/fl). (E) K-means clustering of OCT4 binding sites that significantly lose ATAC-seq signal following deletion of OCT4 (OCT4-dependent; n = 11557) based on changes in Brg1fl/fl ATAC-seq signal. (F) Scatterplots of the changes in OCT4cond and Brg1fl/fl ATAC-seq at OCT4 target sites. R2 represents linear regression score, and cor reflects Pearson correlation coefficient.
Figure 4
OCT4 is required for normal BRG1 chromatin occupancy at OCT4-bound regulatory elements.
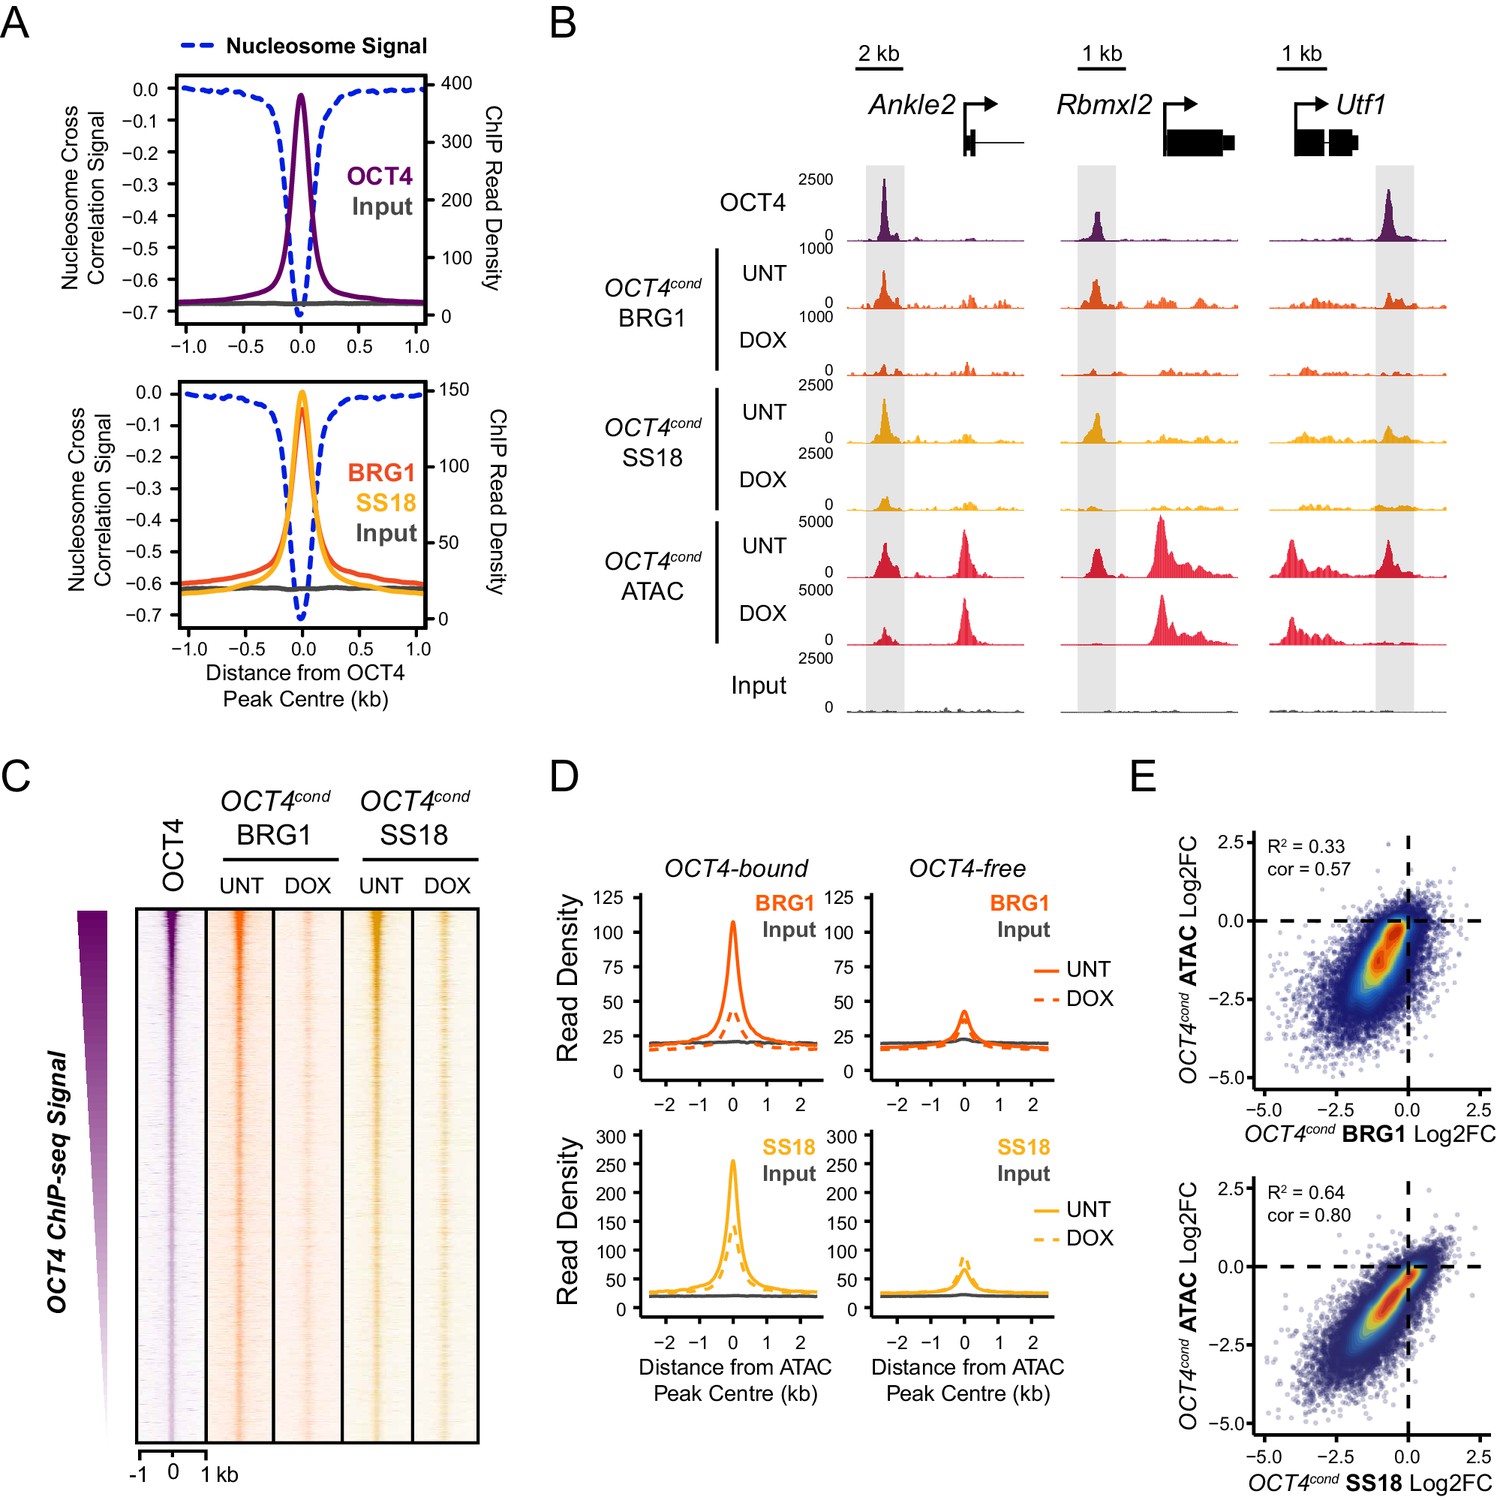
(A) A high resolution metaplot illustrating nucleosome occupancy, OCT4, BRG1 and BRG1-associated factor SS18 at OCT4 peaks (n = 15920; 10 bp windows) demonstrates that OCT4 and BRG1/BAF signal co-localises to the nucleosome-depleted region at OCT4 peaks. (B) Genomic snapshots of BRG1 and SS18 ChIP-seq in OCT4cond before (UNT) and after 24 hr doxycycline (DOX) treatment reveals loss of BRG1 and SS18 occupancy at distal OCT4 targets (highlighted in grey) following OCT4 removal. (C) A heatmap of OCT4 peaks (n = 15920) illustrating enrichment of BRG1 and SS18 at OCT4 target sites in wild type cells and subsequent loss of BRG1 following removal of OCT4. (D) A metaplot of BRG1 and SS18 ChIP-seq signal at ATAC hypersensitive sites with (OCT4-bound) or without (OCT4-free) OCT4 before and after deletion of OCT4. (E) A scatterplot comparing the changes in BRG1 and SS18 occupancy with the changes in chromatin accessibility (ATAC-seq) at OCT4 peaks after deletion of OCT4. R2 represents linear regression score, and cor reflects Pearson correlation coefficient.
Figure 5 with 4 supplements
BRG1 supports pluripotency-associated transcription factor binding to functionally mature distal gene regulatory elements.
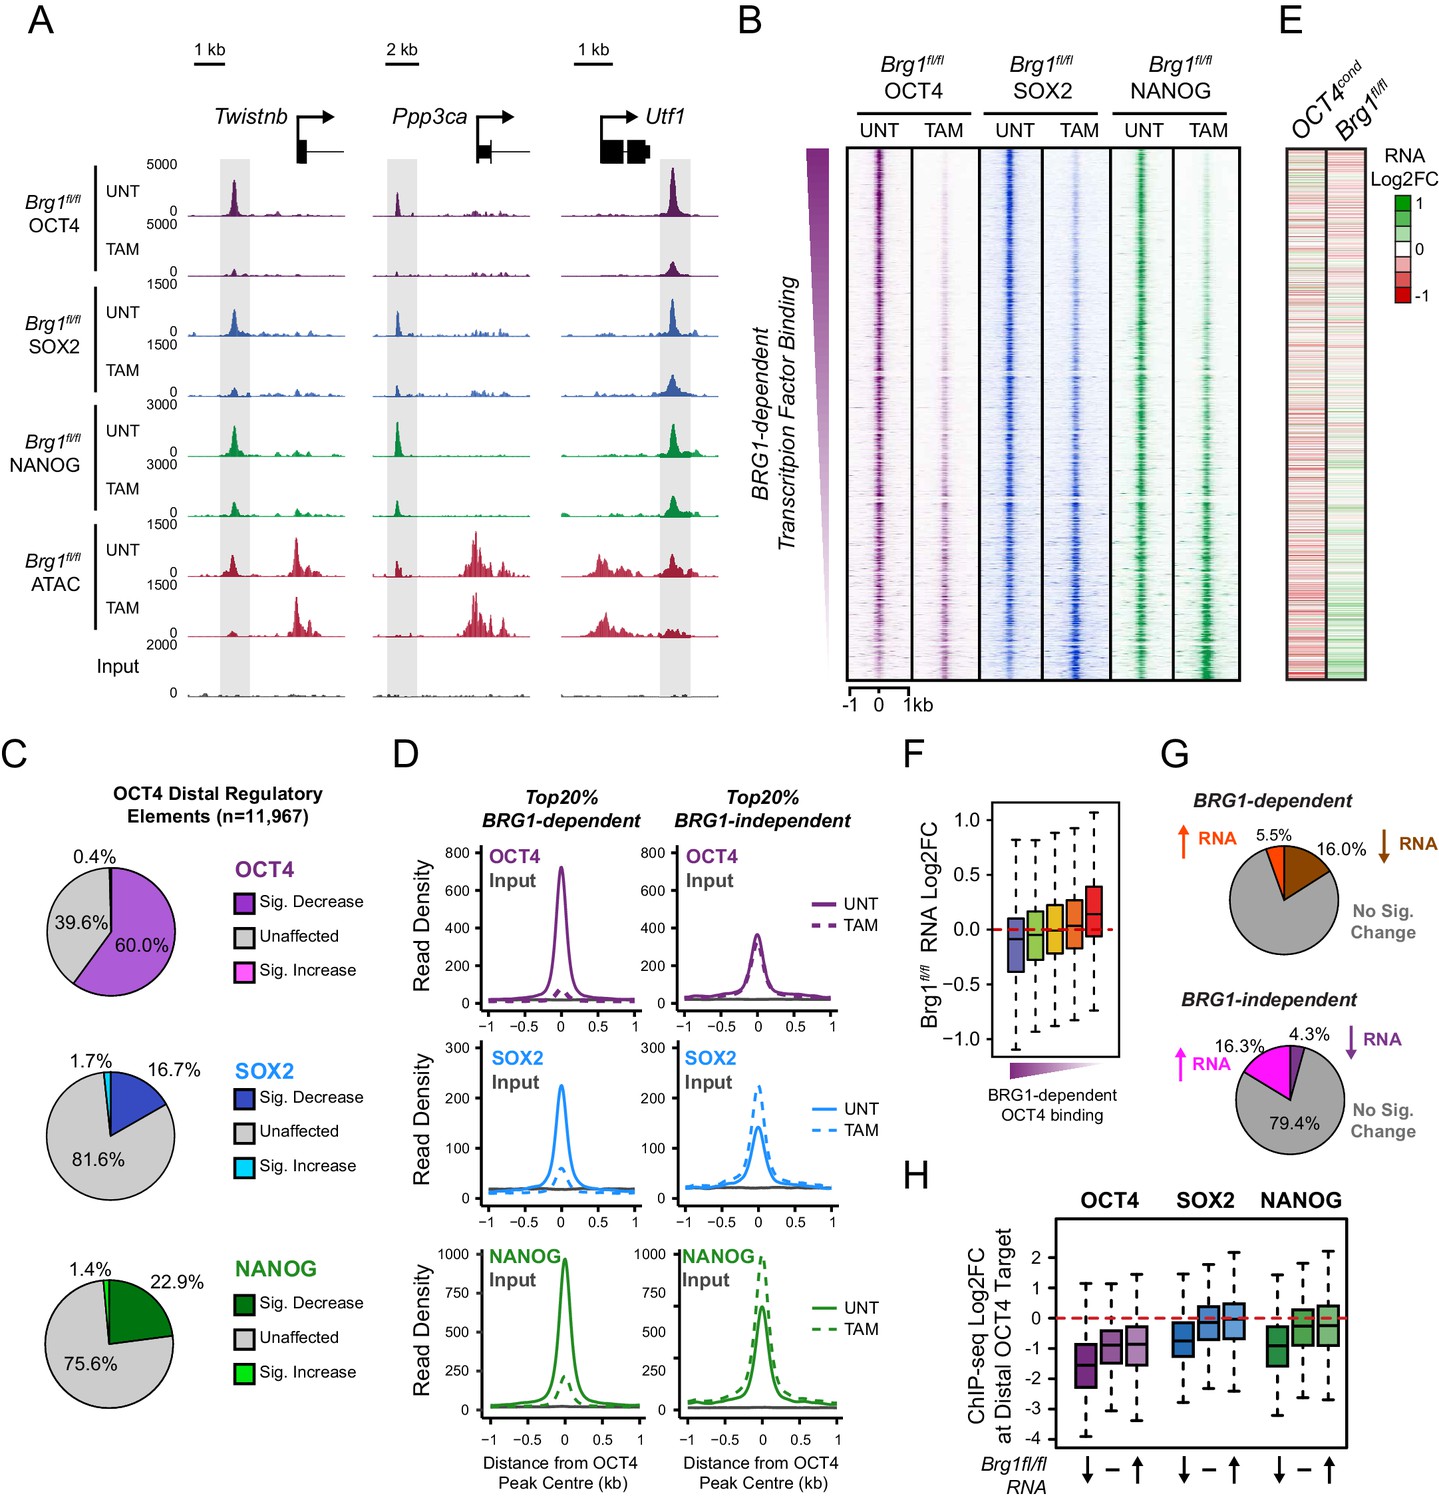
(A) Genomic snapshots illustrating OCT4, SOX2 and NANOG ChIP-seq signal in Brg1fl/fl ESCs before (UNT) and after tamoxifen (TAM) treatment for 72 hr. Three examples of distal OCT4 targets are depicted, with affected sites highlighted in grey. (B) A heatmap analysis of OCT4, SOX2 and NANOG ChIP-seq signal at distal OCT4 targets (n = 11967) ranked by their relative change in OCT4 ChIP-seq after deletion of BRG1. (C) Piecharts depicting the significant changes in OCT4, SOX2 and NANOG ChIP-seq signal at distal OCT4 target sites, identified using the DiffBind package. Changes were deemed significant with FDR < 0.05 and a change greater than 1.5-fold. (D) Metaplot analysis of OCT4, SOX2 and NANOG binding at distal OCT4 target sites that are the most (20% most affected; BRG1-dependent) and the least (20% least affected; BRG1-independent) dependent on BRG1 for normal OCT4 binding. (E) A heatmap illustrating the changes in gene expression (log2 fold change in RNA-seq) for genes neighbouring distal OCT4 targets. Genes are sorted according to the change in OCT4 occupancy at neighbouring distal OCT4 target sites following BRG1 removal, as in (B). Gene expression changes for OCT4-depleted (OCT4cond) or BRG1-depleted (Brg1fl/fl) ESCs relative to wildtype ESCs are shown. (F) Quantitation of log2 fold change (log2FC) in Brg1fl/fl RNA-seq signal for genes neighbouring distal OCT4 target sites grouped into quintiles based on the change in OCT4 binding at neighbouring distal OCT4 target sites following removal of BRG1, as in (B). (G) Comparison of significant gene expression changes for genes neighbouring distal OCT4 target sites that show the largest (20% most affected; BRG1-dependent) and least (20% least affected; BRG1-independent) reductions in OCT4 ChIP-seq signal following BRG1 removal. Changes were deemed significant with FDR < 0.05 and a change greater than 1.5-fold, using DESeq2. (H) Quantitation of log2 fold change (log2FC) of OCT4, SOX2 and NANOG ChIP-seq signal at distal OCT4 targets in proximity to OCT4-dependent genes with decreased (↓; n = 468), unchanged (-; n = 639), or increased (↑; n = 816) RNA-seq signal after deletion of BRG1 (as identified in Figure 5—figure supplement 3B).
Figure 5—figure supplement 1
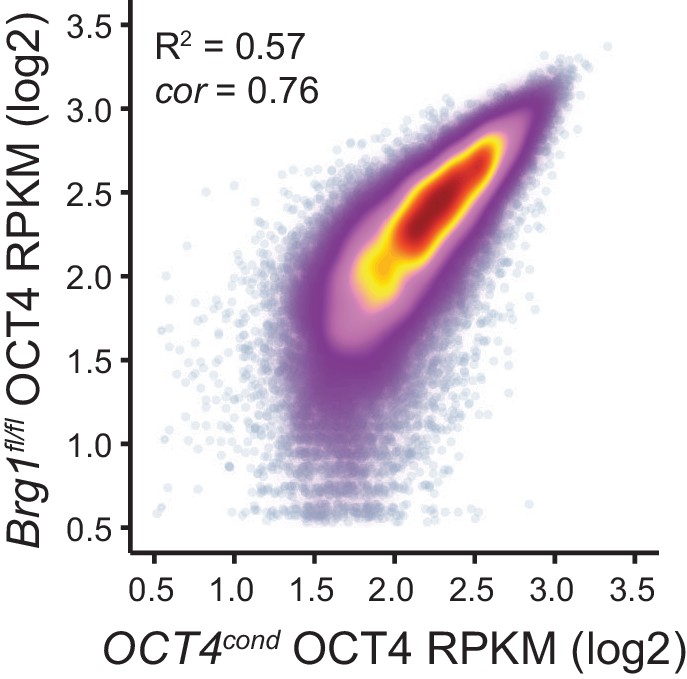
Comparison of wild type OCT4 ChIP-seq signal between OCT4cond and Brg1fl/fl ESCs.
Scatterplot analysis of reads per kilobase per million (RPKM) for untreated (wild type) OCT4 ChIP-seq in OCT4cond and Brg1fl/fl ESCs.
Figure 5—figure supplement 2
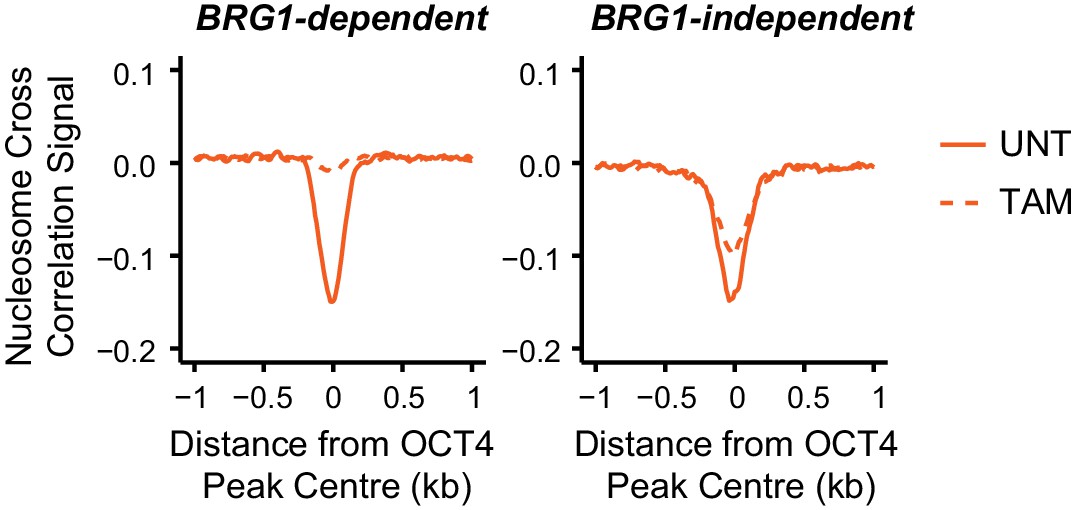
Nucleosome occupancy changes in Brg1fl/fl ESCs at distal OCT4 target sites.
Metaplot analysis of nucleosome occupancy signal at distal OCT4 target sites that are the most (20% most affected; BRG1-dependent) and the least (20% least affected; BRG1-independent) dependent on BRG1 for OCT4 binding (as in Figure 5D).
Figure 5—figure supplement 3

Transcriptional regulation of OCT4-dependent target genes by BRG1.
(A) Venn diagrams depicting the overlap between genes with significant reductions in RNA-seq following OCT4-depletion in the OCT4cond ESCs (OCT4-dependent) and genes with significant decreases or increases in RNA-seq following BRG1-depletion in the Brg1fl/fl ESCs. DESeq2 was used to identify significant changes (FDR < 0.05 and fold change > 1.5 fold). (B) K-means clustering of OCT4-dependent genes based on changes in Brg1fl/fl RNA-seq signal. Clusters were organized into three groups to reflect the direction of gene expression change following removal of BRG1. (C) Boxplot quantitation of log2 fold change in Brg1fl/fl RNA-seq signal following removal of BRG1 for the three groups of OCT4-dependent genes identified in (B) illustrates the utility of the clustering approach.
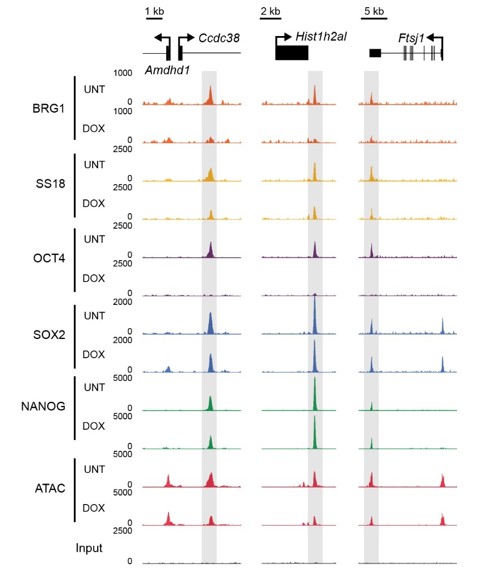
Figure 5—figure supplement 4
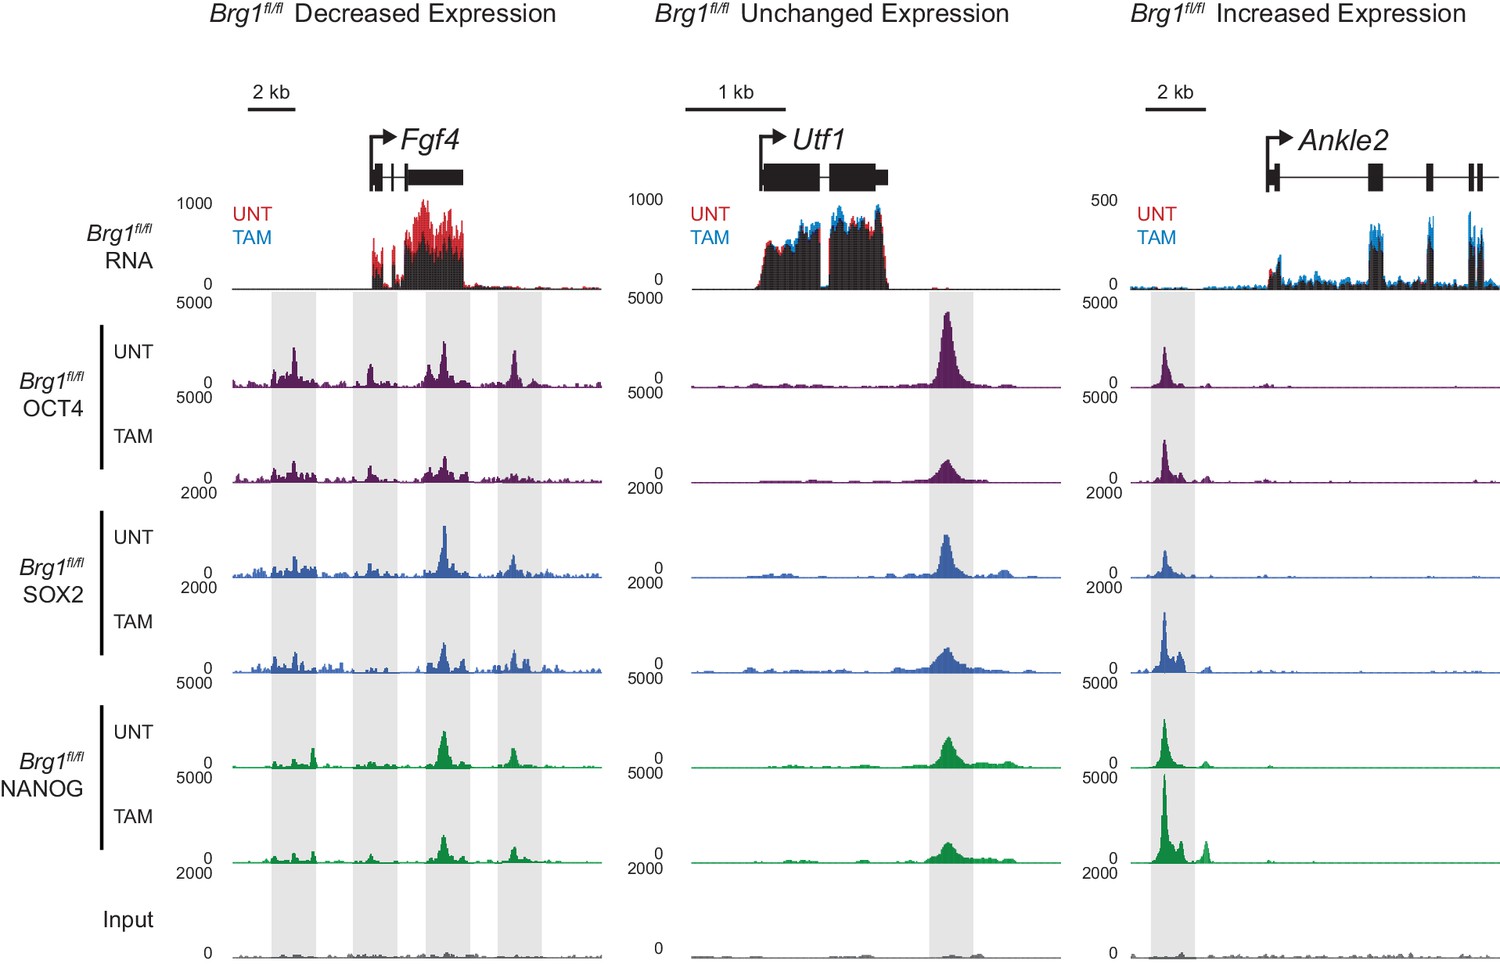
Changes in gene expression following depletion of BRG1 in Brg1fl/fl ESCs are associated with altered transcription factor binding.
Genomic snapshots of three genes associated with OCT4 binding sites that experience either decreased (Fgf4), unchanged (Utf1) or increased (Ankle2) RNA-seq signal following depletion of BRG1 in Brg1fl/fl ESCs. OCT4 binding sites are highlighted in grey.
Figure 6 with 1 supplement
BRG1-dependency reveals distinct modes of OCT4 function of distal regulatory elements during reprogramming and development.
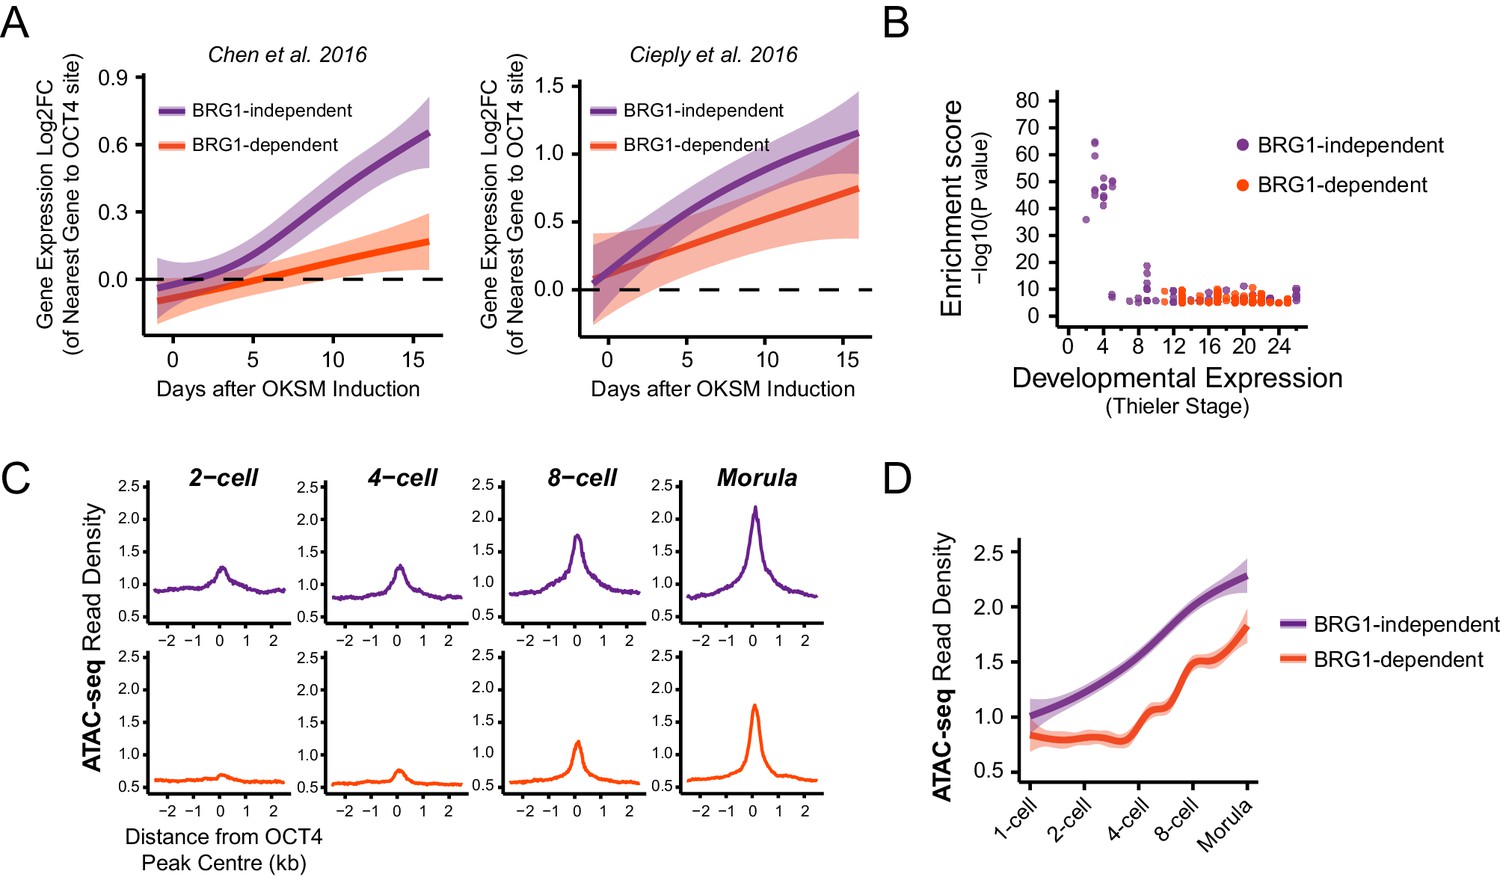
(A) A time course of gene expression changes (log2 fold change) during OKSM-mediated reprogramming of mouse embryonic fibroblasts to iPSCs (Chen et al., 2016; Cieply et al., 2016). The expression changes of OCT4-dependent genes neighbouring the 20% of distal OCT4 targets that were most dependent upon BRG1 for normal OCT4 binding (BRG1-dependent) or the 20% of distal OCT4 targets that were least dependent (BRG1-independent) following BRG1 removal were quantified and visualised as a smoothed trendline ±95% confidence interval. (B) Genomic Regions Enrichment of Annotations Tool (GREAT) annotation of BRG1-dependent and BRG1-independent distal OCT4 targets. Plotted are the enrichment (-log10(P Value)) against the MGI Expression profile, or Thieler development stage, for genes neighbouring distal OCT4 targets. BRG1-independent sites are strongly enriched for gene expression profiles consistent with very early embryonic stages. (C) Metaplot profiles of ATAC-seq signal during early mouse embryonic development (Wu et al., 2016) at BRG1-independent (upper) and BRG1-dependent (lower) distal OCT4 target sites. BRG1-independent sites gain accessibility earlier than BRG1-dependent sites. (D) A quantitation of ATAC-seq read density at distal OCT4 targets depicted in (C) during early embryonic development plotted as a smoothed trendline ±95% confidence interval.
Figure 6—figure supplement 1
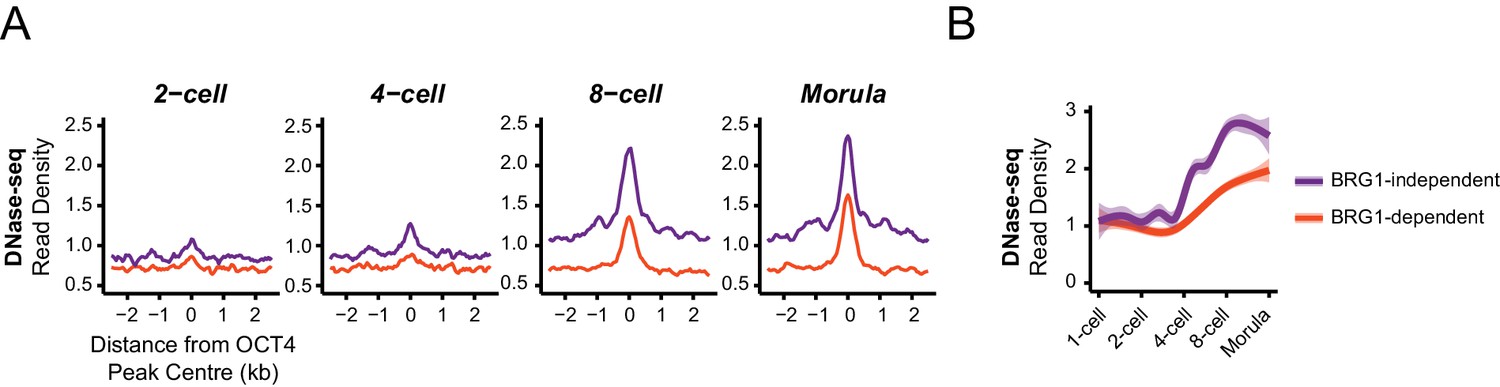
BRG1-dependent and BRG1-independent OCT4 binding at distal regulatory elements is associated with distinct developmental timing of chromatin accessibility.
(A) Metaplot profiles of DNase-seq signal during early embryonic development (Lu et al., 2016)at BRG1-independent and BRG1-dependent distal OCT4 targets identified in Brg1fl/fl ESCs. BRG1-independent sites gain accessibility earlier than BRG1-dependent sites. (B) A quantitation of DNase-seq read density at distal OCT4 targets depicted in (A) during early embryonic development depicted as a smoothed trendline ± 95% confidence interval.
Author response image 1
BRG1/BAF occupancy relies upon OCT4 but not SOX2 and NANOG binding.
Genomic snapshots of OCT4 targets that retain SOX2 and NANOG binding in the absence of OCT4, but lose BRG1 and SS18 ChIP-seq signal.
Download links
A two-part list of links to download the article, or parts of the article, in various formats.
Downloads (link to download the article as PDF)
Open citations (links to open the citations from this article in various online reference manager services)
Cite this article (links to download the citations from this article in formats compatible with various reference manager tools)
The pioneer factor OCT4 requires the chromatin remodeller BRG1 to support gene regulatory element function in mouse embryonic stem cells
eLife 6:e22631.
https://doi.org/10.7554/eLife.22631


