Evolution of substrate specificity in a retained enzyme driven by gene loss
- Unidad de Genómica Avanzada (Langebio), Cinvestav-IPN, Mexico
- Argonne National Laboratory, United States
- Computation Institute, Chicago
- University of Texas Health Science Center, United States
- Cinvestav-IPN, Mexico
- University of Chicago, United States
Figures
Figure 1
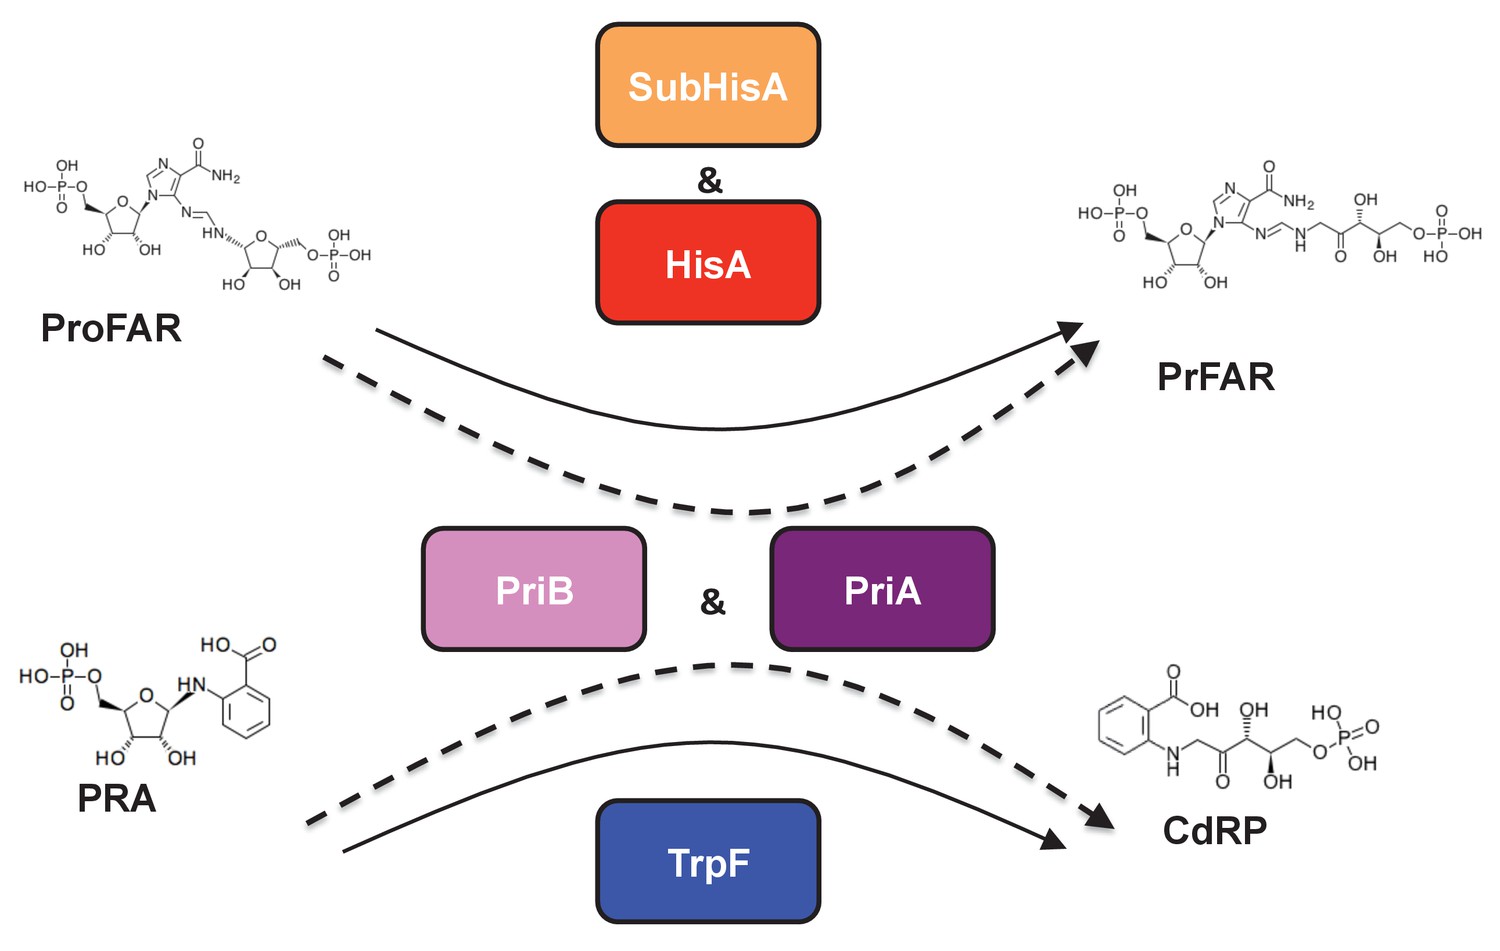
(βα)8 barrel isomerases at which L-tryptophan and L-histidine biosynthesis converge.
Selected L-tryptophan (blue) and L-histidine (red) biosynthetic enzymes are shown. The committed reaction catalyzed by PriA and PriB, or phosporibosyl isomerase A or B in Actinobacteria (dashed arrows), is independently catalyzed by the enzymes TrpF or PRA isomerase, and HisA or ProFAR isomerase (standard arrows) in most bacteria. Furthermore, the SubHisA enzyme, resulting from divergent evolution after an event of HGT and positive selection in certain Corynebacterium species, is also shown.
Figure 2
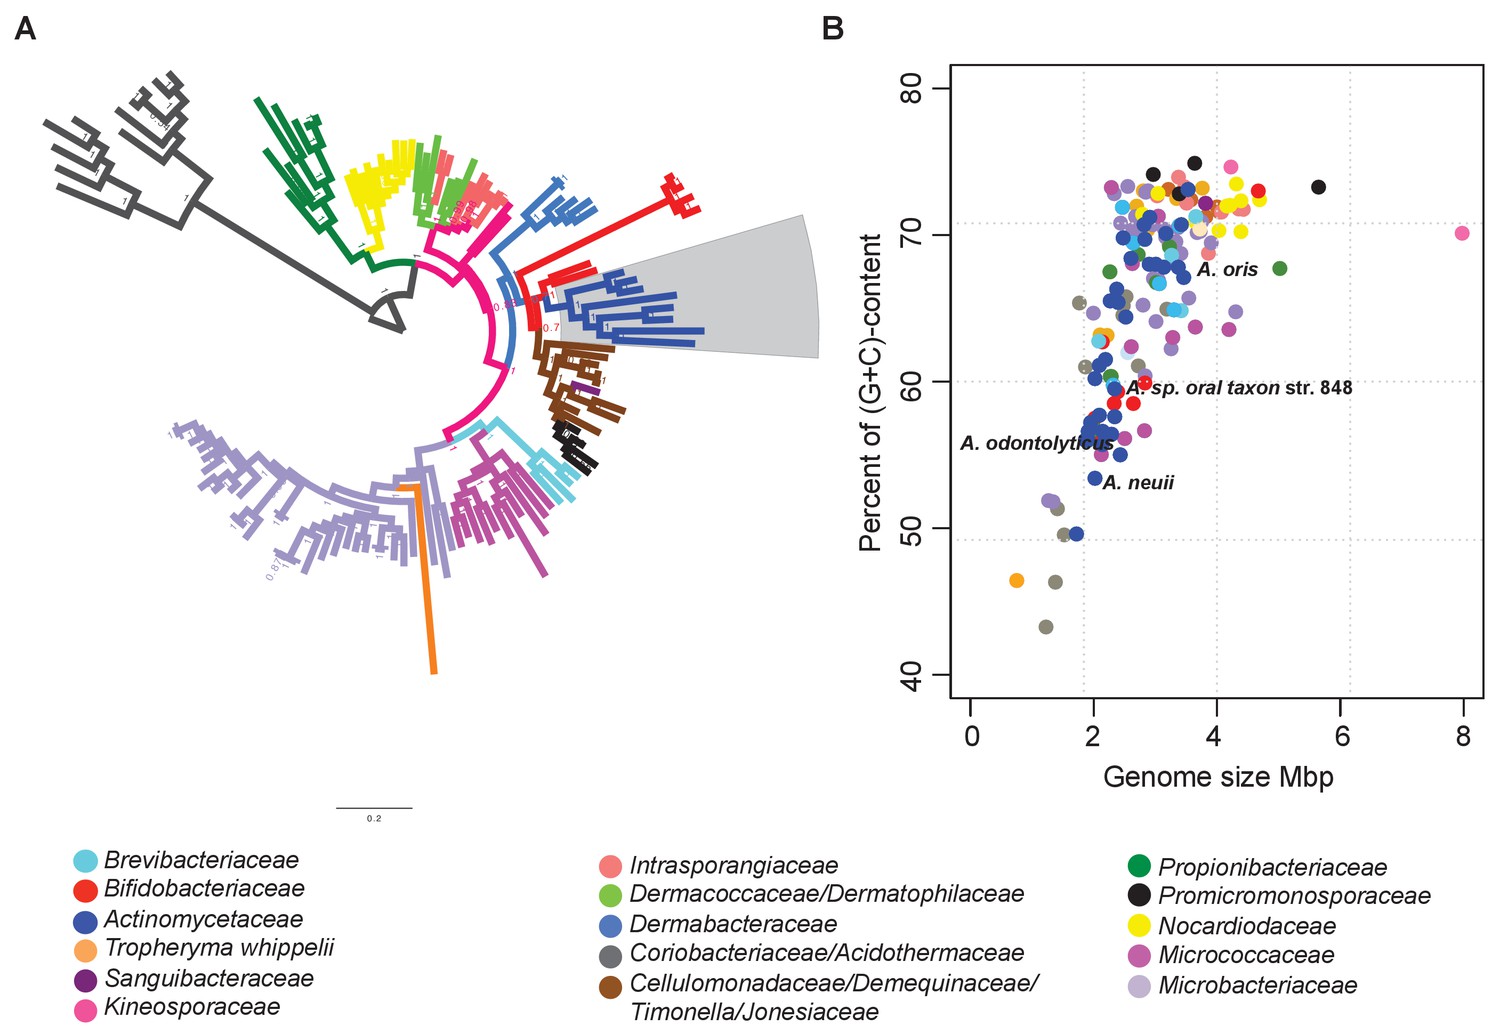
Identification of reduced genomes in Actinobacteria.
(A) Protein-based phylogeny of 133 representative deep-branching Actinobacteria using Bayesian reconstruction. The tree shows a clade with the family Bifidobacteriaceae as the root of the families Dermabacteraceae, Cellulomonadaceae, Demequinaceae, Jonesiaceae, Promicromonosporaceae and Actinomycetaceae, shown in blue and highlighted with a grey box. (B) Relationship between genome size and percentage of (G+C) content. The color key used for taxonomic associations is provided at the bottom, and it is the same for both panels.
-
Figure 2—source data 1
Actinobacterial genome sequences from early-diverging families used in this study.
- https://doi.org/10.7554/eLife.22679.004
-
Figure 2—source data 2
Conserved orthologs in early-diverging actinobacterial families used for phylogenetic reconstruction.
- https://doi.org/10.7554/eLife.22679.005
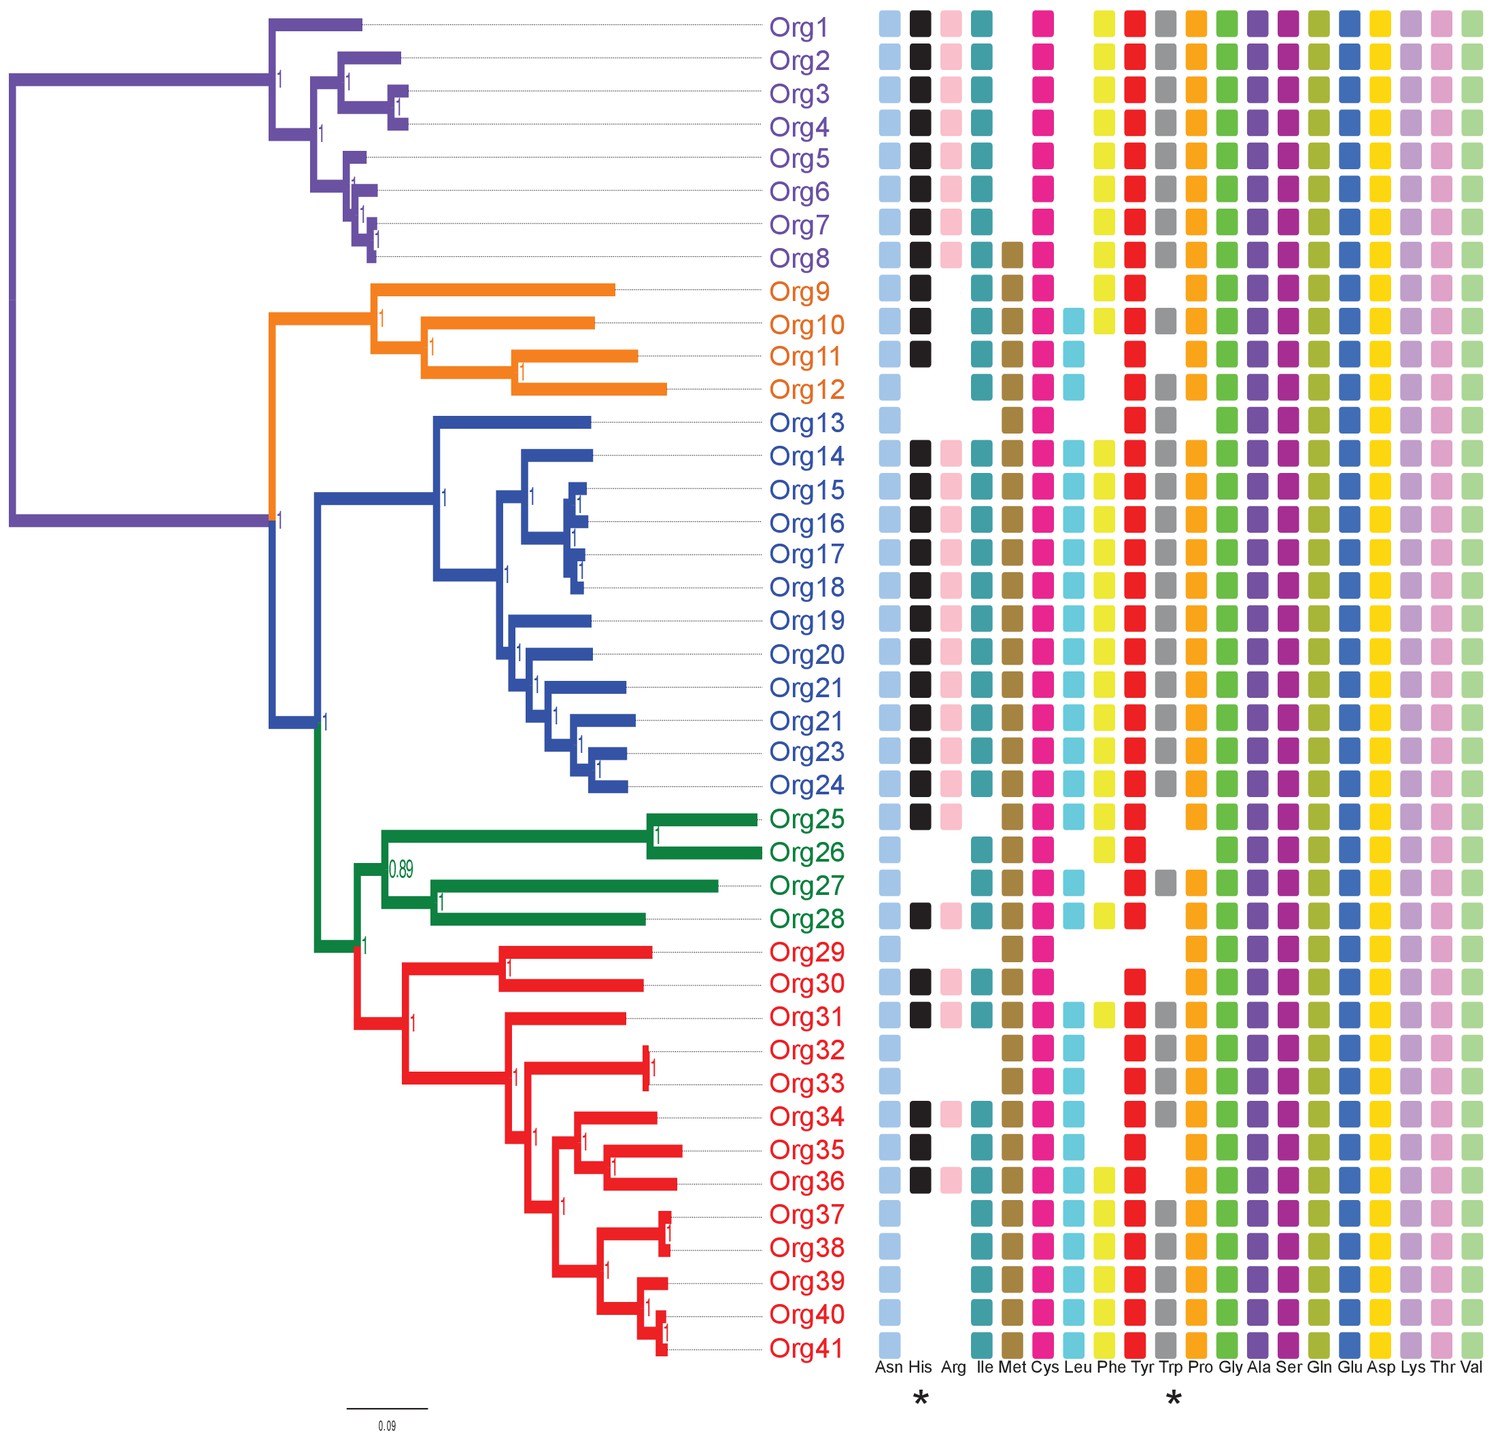
Figure 3 with 2 supplements

Concatenated phylogenetic tree of the family Actinomycetaceae and occurrence of L-histidine and L-tryptophan biosynthetic genes.
The tree was constructed using 205 single-copy conserved proteins using Bayesian methods. Only posterior probabilities are shown but significant bootstrap values close to 100 using maximum likelihood were also calculated (Figure 3—figure supplement 1). A new classification of the family, into four major groups, is proposed: lineage I (orange); lineage II (blue); lineage III, (green); and lineage IV (red). Based in the species phylogenetic tree of Figure 2A, we selected as out-group the genus Bifidobacterium. Occurrence of L-histidine (His, black) and L-tryptophan (Trp, grey) biosynthetic genes as revealed by standard genome annotation using RAST is shown next to the tree. Each square represents a complete pathway including all expected genes (10 and 7 for the his and trp genes respectively) up to 90%. The only missing his gene refers to the enzyme histidinol-phosphatase (EC 3.1.3.15), which belongs to a broad enzyme family difficult to annotate.
-
Figure 3—source data 1
Genome sequences of the family Actinomycetaceae and the genus Bifidobacterium used in this study.
- https://doi.org/10.7554/eLife.22679.007
-
Figure 3—source data 2
Conserved orthologs between the family Actinomycetaceae and the genus Bifidobacterium and best fit model used to construct the phylogenetic tree with Mr.Bayes.
- https://doi.org/10.7554/eLife.22679.008
Figure 3—figure supplement 1
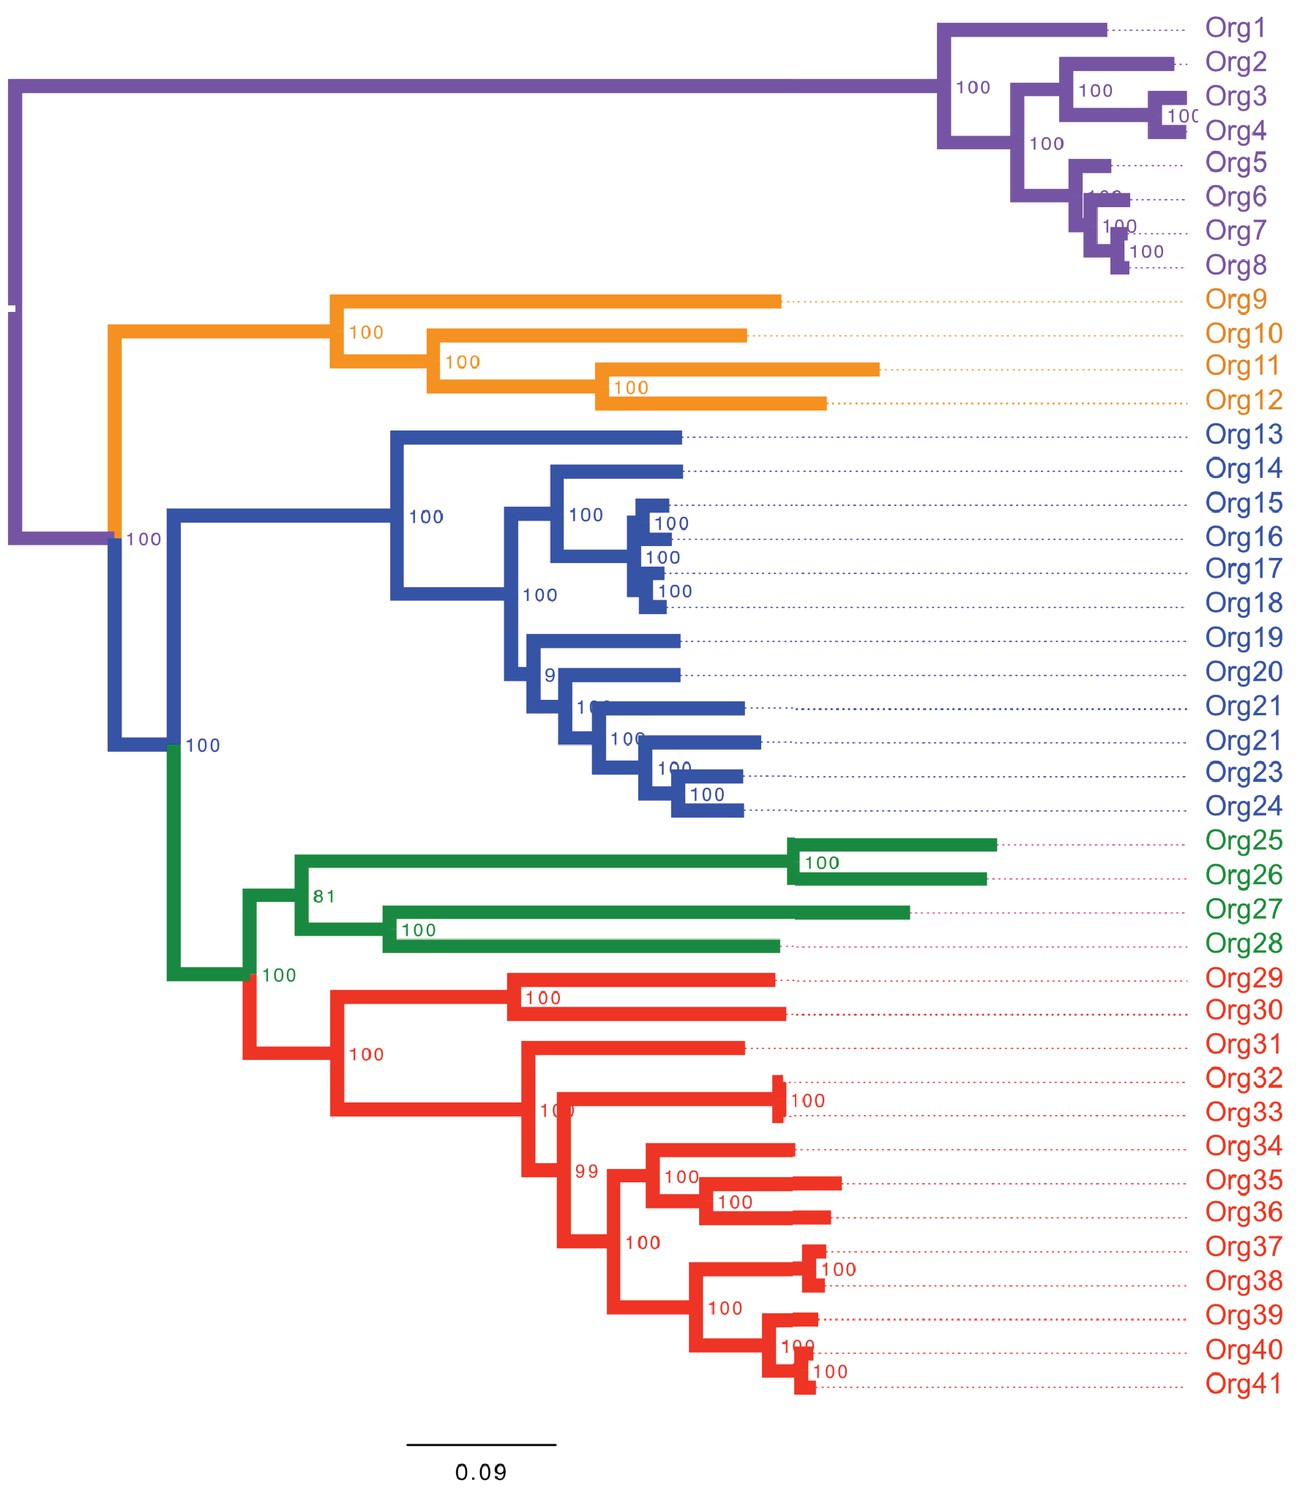
Concatenated phylogenetic tree of the family Actinomycetaceae using maximum likelihood.
The phylogenetic tree shows four major groups: lineage I (orange clade), lineage II (blue clade), lineage III (green clade) and lineage IV (red clade). Bootstrap values are shown. Representative sequences from the closely related genus Bifidobacterium were used as out-group (purple clade). Name nomenclature of organisms used in the text is provided. Both phylogenetic trees using different algorithms supported the taxonomic relationships between the selected taxa.
Figure 3—figure supplement 2
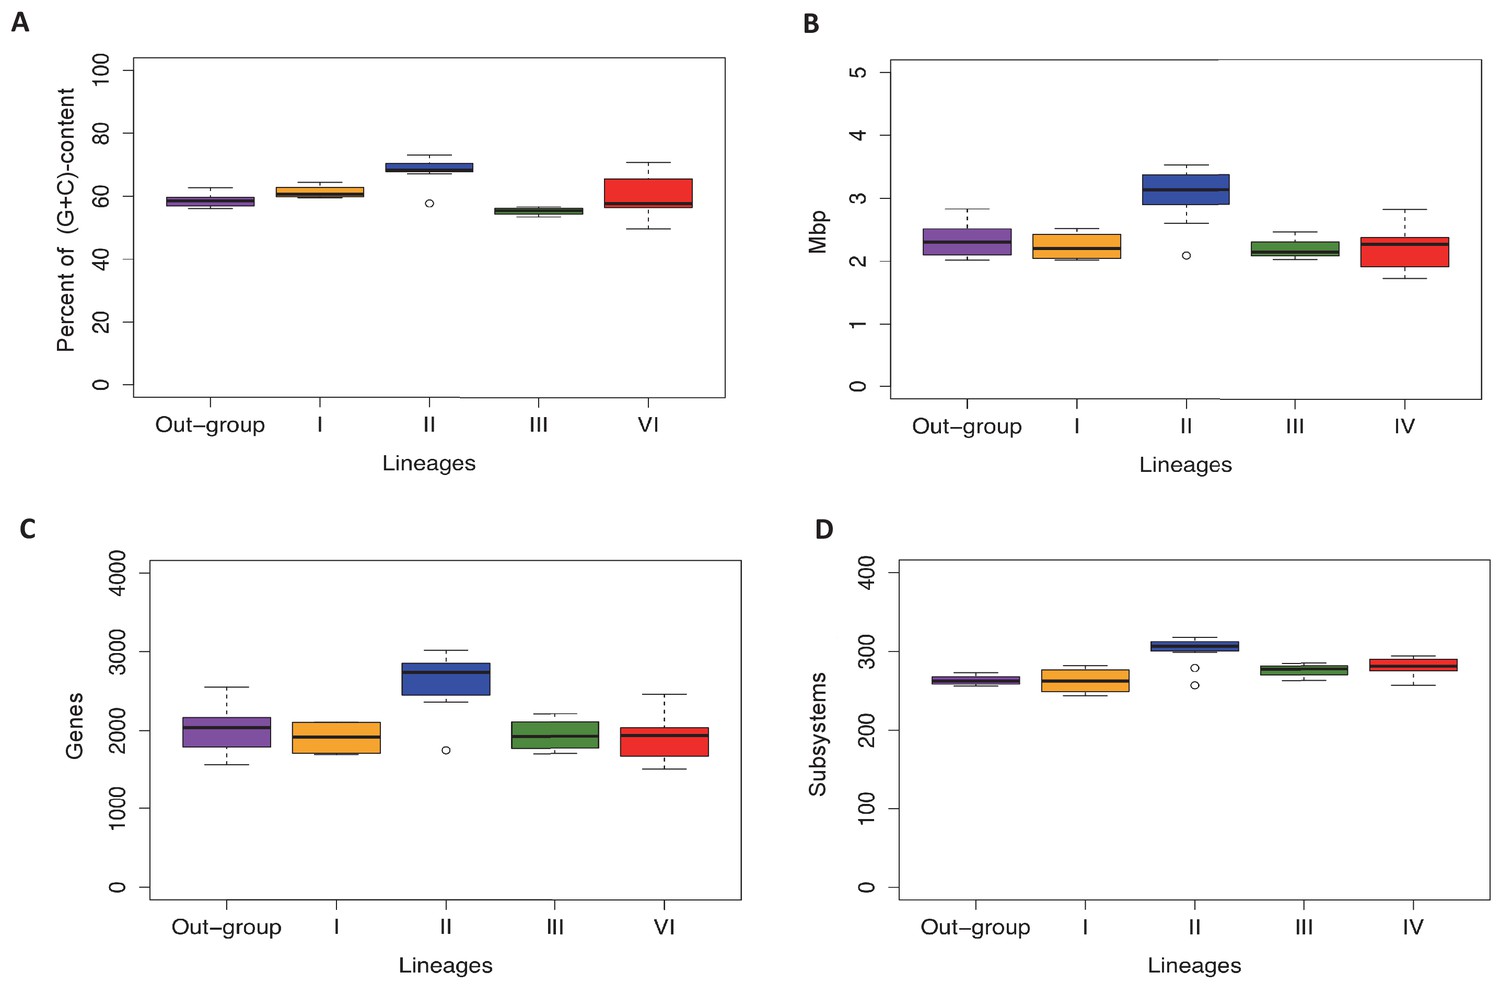
Lineage-specific genomic features of the familiy Actinomycetaceae.
Lineages and the out-group are as defined in the text. A. Percentage of (G+C)-content in whole genomes, where each point in the box-plot represent a genome. B. Genome size (Mbp), where each point in the box-plot represents a genome. C. Number of coding sequences, where each point in the box-plot represents a CDS. D. Number of subsystems based in RASTtk annotation, where each point represents a subsystem. The median is highlighted with a black line. All the box-plots were created with R package.
-
Figure 3—figure supplement 2—source data 1
Statistical analysis of the genomic differences between Lineage II and IV.
- https://doi.org/10.7554/eLife.22679.011
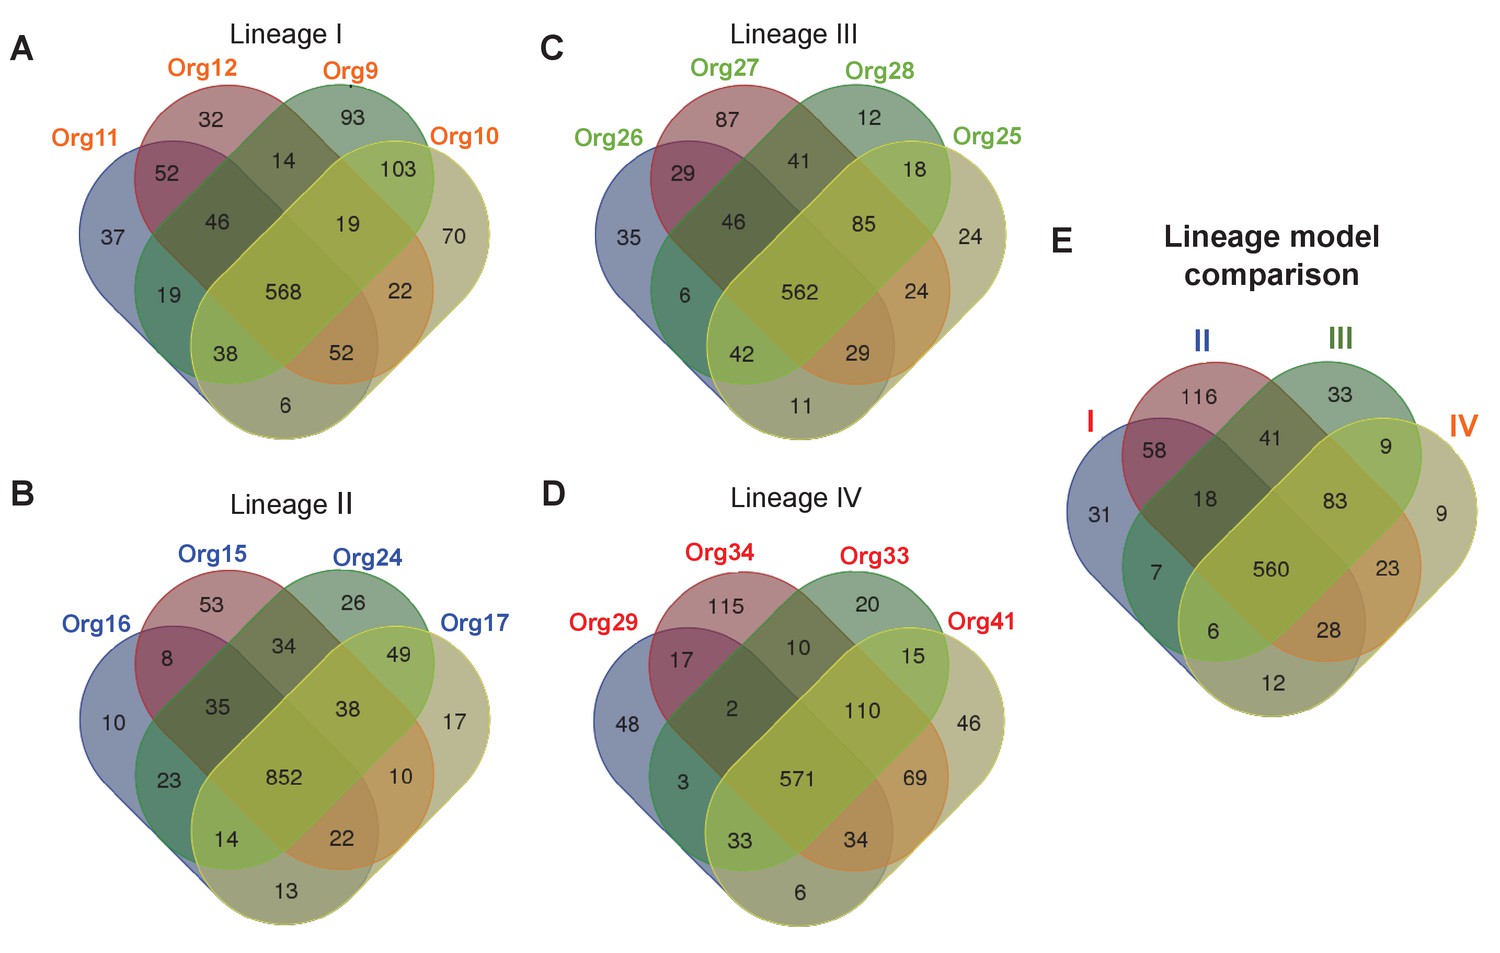
Figure 4 with 1 supplement
Metabolic diversity amongst the genomic lineages of the genus Actinomyces.
The Venn diagrams show the overlap in gene-associated reactions included in models of genomes of lineage I (A), lineage II (B), lineage III (C), and lineage IV (D). The diagrams for lineages I and III show the overlap of all models in these lineages, while the lineage II and IV diagrams show the overlap of a subset of models sampled based on their metabolic diversity. Overlap in gene-associated reaction content for each of the core lineage models (E), which are comprised of conserved reactions present in at least 75% of the models in each lineage, is also shown.
-
Figure 4—source data 1
Model overview.
- https://doi.org/10.7554/eLife.22679.013
-
Figure 4—source data 2
Model reactions.
- https://doi.org/10.7554/eLife.22679.014
-
Figure 4—source data 3
Predicted minimal media.
- https://doi.org/10.7554/eLife.22679.015
Figure 4—figure supplement 1
Phylogenetic projection of amino acid biosynthetic pathways throughout the family Actinomycetaceae as confirmed after genome-scale metabolic modeling.
The tree is the same as in Figure 3, but without the names of organisms to facilitate visual inspection. Occurrence of amino acid biosynthetic pathways, denoted with standard nomenclature, is shown. Each square represents a complete pathway including all expected genes up to 90%. His and Trp pathways are highlighted with an asterisk.
Figure 5

Phylogenetic reconstruction of PriA and coevolution with L-histidine and L-tryptophan biosynthesis.
(A) Analysis of the occurrence of his and trp biosynthetic genes (priA is included in both pathways), marked as absent (white) or present (gray), using the phylogenomics species tree of Figure 3 as a map (same color code). The missing his gene, when almost the entire pathway is present, refers to the enzyme histidinol-phosphatase (EC 3.1.3.15), which belongs to a broad enzyme family difficult to annotate. (B) Same gene occurrence analysis using the PriA phylogenetic tree as a map. Three evolutionary scenarios where PriA is coevolving with the occurrence of his and trp genes, and in agreement with the intensity of purifying selection (Table 1, gradient shown in the left-hand side of the panel), are marked as H1 (purple), H2 (orange), and H3 (yellow). The same color code as in Figure 3 is used, and the selected enzymes that were biochemically characterized are underlined.
-
Figure 5—source data 1
Occurrence of L-Histidine and L-Tryptophan biosynthetic enzymes throughout the family Actinomycetaceae and the genus Bifidobacterium.
- https://doi.org/10.7554/eLife.22679.018
Figure 6
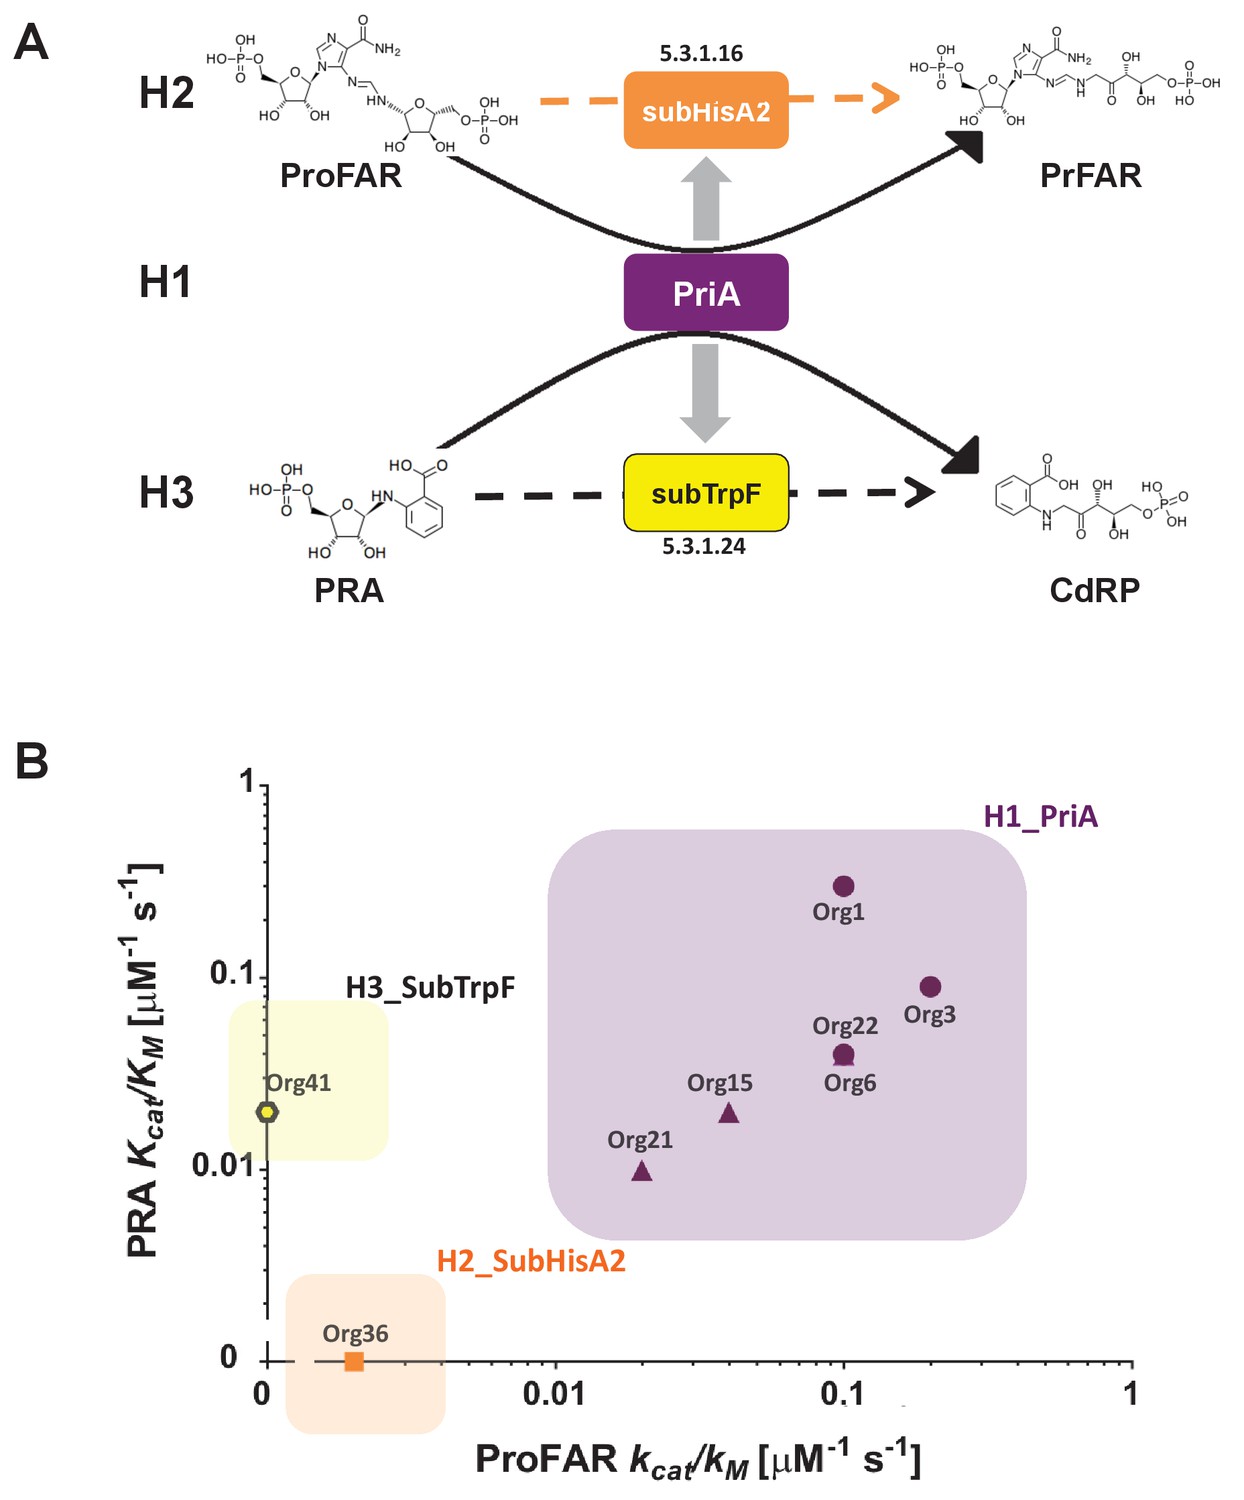
Evolutionary hypotheses and steady-state enzyme kinetics of PriA homologs.
(A) Evolutionary hypothesis (H1, H2 and H3) with functional implications leading to PriA enzyme subfamilies, expressed as biochemical conversions, as obtained from Figure 5. (B) Comparison of the catalytic efficiencies (kcat/KM) of selected enzymes from different scenarios, including the three postulated evolutionary hypotheses. Values for ProFAR (x axis) and PRA (y axis) isomerase activities, expressed as log10, are compared. Data from PriAs of Bifidobacterium (purple circle), PriA from H1 (purple triangle), SubHisA2 from H2 (orange), and SubTrpF from H3 (yellow pentagon) is included.
Figure 7
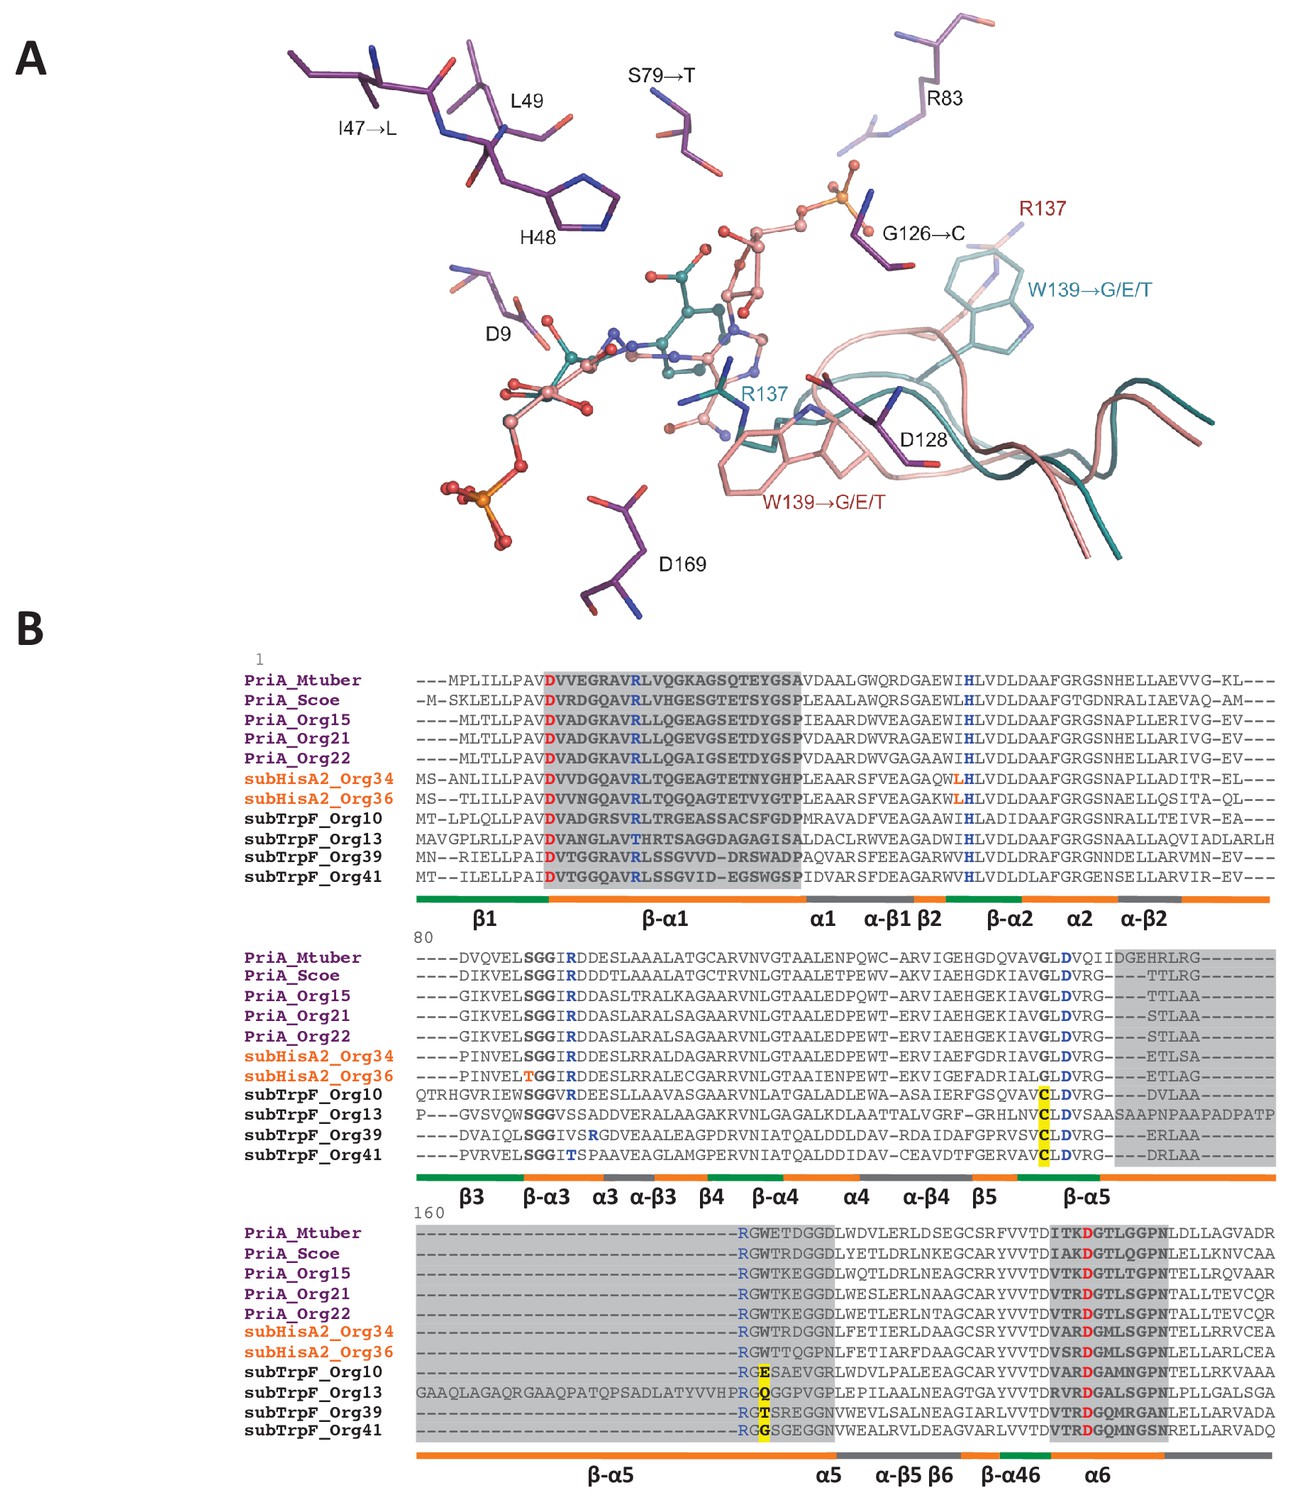
PriA from Org15_A. urogenitalis active site and sequence alignment of PriA sub-families.
(A) The structure of PriA from A. urogenitalis (purple, PDB: 4X2R) superimposed with PriA from M. tuberculosis in a complex with rCdRP (cyan, PDB: 2Y85) and PrFAR (pink, PDB: 2Y88) is used to illustrate the position of the respective substrates. The catalytic residues and those critical for divergence into SubHisA2 or SubTrpF are shown. Since the loop contributing Trp139 and Arg137 is mostly disordered, and Arg137 itself does not adopt substrate binding-relevant position in the structure from A. urogenitalis, only the equivalent elements from the M. tuberculosis homolog are shown. (B) Multiple sequence alignment of PriA (purple), SubHisA2 (red) and SubTrpF (bold) sequences. Catalytic residues, Asp9 and Asp169, are marked in red. PRA and ProFAR binding residues are shown in blue. SubHisA2 and SubTrpF loss-of-function residues are framed. The secondary structure is shown below the sequences. Loops are shown in orange, α helixes are shown in gray and β sheets are shown in green. Sequence corresponding to loops 1, 5, and six is highlighted in gray. List of Tables provided as Source Data.
-
Figure 7—source data 1
X-ray crystalographic data processing and refinement statistics for PriA_Org15.
- https://doi.org/10.7554/eLife.22679.023
Tables
Table 1
Selective pressures in PriA homologs from H1, H2 and H3 hypotheses.
| Hypothesis | dN/ds | dN | ds |
|---|---|---|---|
| H1 | 0.0636 | 0.3151 | 4.9559 |
| H2 | 0.0901 | 1.8687 | 20.736 |
| H3 | 0.1459 | 1.8703 | 12.8227 |
Table 2
Biochemical characterization of PriA, SubHisA2 and SubTrpF homologs.
| Enzymes | In vivo activity | In vitro activity * | ||||||
|---|---|---|---|---|---|---|---|---|
| ProFAR isomerase (HisA) | PRA isomerase (TrpF) | |||||||
| HisA | TrpF | KM (µM) | kcat (s−1) | kcat/KM (s−1µM−1) | KM (µM) | kcat (s−1) | kcat/KM (s−1µM−1) | |
| PriA_Org3_B. longum | + | + | 2.7 ± 0.5 | 0.4 ± 0.1 | 0.1 | 6.1 ± 0.1 | 2.1 ± 0.5 | 0.3 |
| PriA_Org1_B. gallicum | + | + | 1.7 ± 0.3 | 0.3 ± 0.1 | 0.2 | 40 ± 9 | 3.5 ± 0.1 | 0.09 |
| PriA_Org6_B. adolescentis | + | + | 17 ± 4.3 | 2.3 ± 0.01 | 0.1 | 21 ± 5 | 0.9 ± 0.2 | 0.04 |
| PriA_Org15_A. urogenitalis | + | + | 4.0 ± 0.9 | 0.2 ± 0.03 | 0.04 | 23 ± 6.5 | 0.5 ± 0.05 | 0.02 |
| PriA_Org22_A. sp. oral taxon 171 | + | + | 3 ± 0.3 | 0.3 ± 0.09 | 0.1 | 8 ± 2 | 0.4 ± 0.1 | 0.04 |
| PriA_Org21_A. oris MG-1 | + | + | 10 ± 2 | 0.2 ± 0.09 | 0.02 | 30 ± 7 | 0.3 ± 0.03 | 0.01 |
| SubHisA2_Org34_A. vaccimaxillae | + | + | ||||||
| SubHisA2_Org36_A. cardiffensis | + | + | 56 ± 17 | 0.14 ± 0.05 | 0.002 | n.d. | n.d. | n.d. |
| SubTrpF_Org10_A. sp. oral taxon 848 | − | + | n.d. | n.d. | n.d. | n.d. | n.d. | 0.0001 |
| SubTrpF_Org13_A. graevenitzii | − | + | ||||||
| SubTrpF_Org39_A. sp. oral taxon 180 | − | + | ||||||
| SubTrpF_Org41_A. odontolyticus | − | + | n.d. | n.d. | n.d. | 8.5 ± 0.9 | 0.15 ± 0.06 | 0.02 |
-
* Each data point comes from at least three independent determinations using freshly purified enzyme. n.d., activity not detected, even using active-site saturation conditions. Empty entries reflect our inability to properly express and/or solubilize these proteins. The detection limits for the PRA and ProFAR isomerase assay used in the present study are 0.0001 μM−1s−1 and 0.001 μM−1s−1, respectively (Noda-García et al., 2013; Verduzco-Castro et al., 2016; Noda-García et al., 2010).
Additional files
-
Supplementary file 1
Genome analysis of the priA minus Actinomyces oris mutant.
- https://doi.org/10.7554/eLife.22679.024
-
Supplementary file 2
Predicted affinities for PRA and ProFAR.
- https://doi.org/10.7554/eLife.22679.025
-
Supplementary file 3
Primers used in this study.
- https://doi.org/10.7554/eLife.22679.026
Download links
A two-part list of links to download the article, or parts of the article, in various formats.
Downloads (link to download the article as PDF)
Open citations (links to open the citations from this article in various online reference manager services)
Cite this article (links to download the citations from this article in formats compatible with various reference manager tools)
Evolution of substrate specificity in a retained enzyme driven by gene loss
eLife 6:e22679.
https://doi.org/10.7554/eLife.22679


