Transient inflammatory response mediated by interleukin-1β is required for proper regeneration in zebrafish fin fold
- Tokyo Institute of Technology, Japan
- School of Medical Sciences, University of Auckland, New Zealand
- SOKENDAI (The Graduate University for Advanced Studies), Japan
Figures
Figure 1

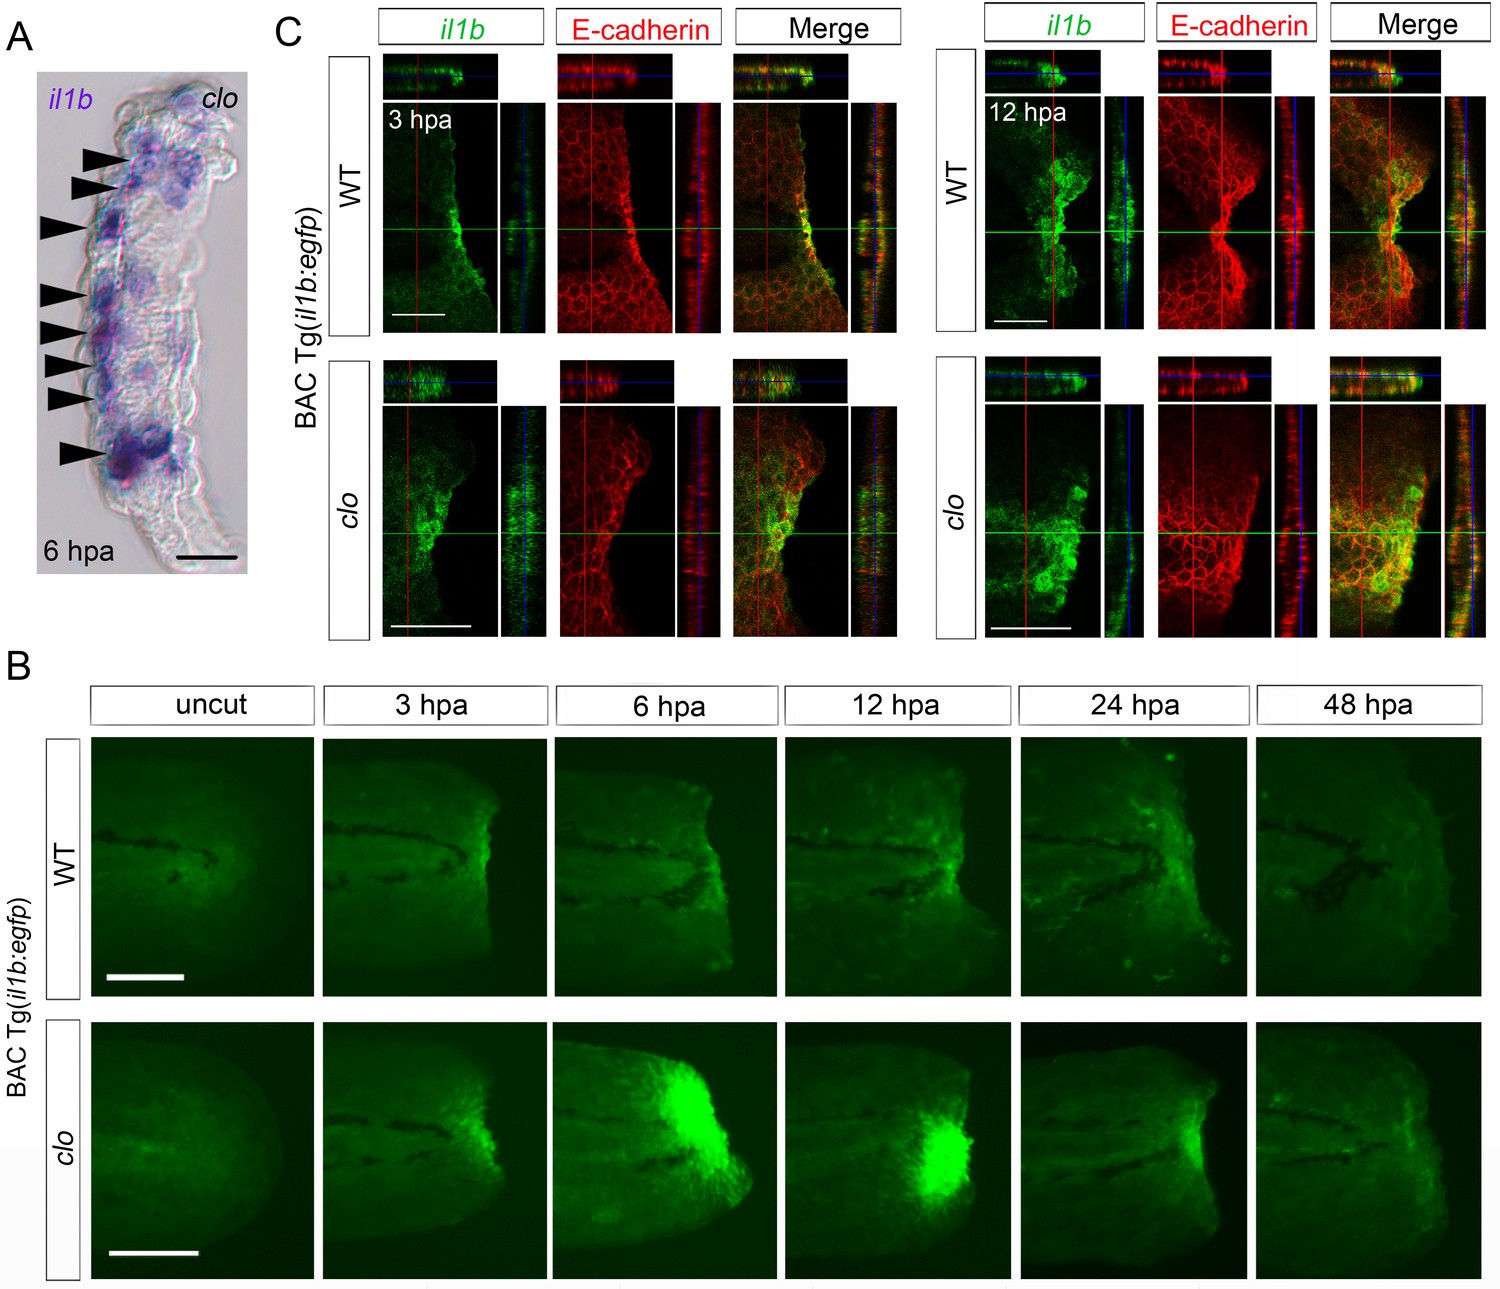
Prolonged activation of il1b expression in the clo mutant after fin fold amputation.
(A) Transcriptome analysis of posterior fin fold tissues from uncut WT, amputated WT, and amputated clo mutant at 6 hpa. The ordinate, final RPKM, indicates the reads per kilobase of exon model per million mapped reads. Expression of regeneration-induced genes such as fn1b, junba, junbb, mmp9, and fgf20a was upregulated in the clo mutant. Notably, expression of inflammation-related genes such as il1b, tnf1b, and ptgs2a was highly upregulated in the amputated clo mutant. (B) RT-PCR analysis of il1b expression in WT and clo larvae at 3, 6, and 12 hpa. actb1: actinb1. (C) ISH analysis of il1b expression at corresponding stages of regeneration in WT and clo. Arrowheads indicate myeloid-like cells expressing il1b. Scale bars, 25 μm. (D) Quantification of il1b expression. The level of il1b expression was divided into four groups according to the ISH signal; the numbers in the bars indicate the ratios of the respective groups. Data are the sum of three experiments (total n > 13 for each sample). The data suggest that il1b expression extended into later stages in clo than in WT. (E) ISH analysis of il1b expression after LPS injection. Phenol red: negative control containing only phenol red; hpi: hours post injection. Scale bars, 200 μm.
-
Figure 1—source data 1
il1b expression at respective time points after fin fold amputation.
The table shows the numbers of larvae used for evaluating the il1b expression levels in WT or clo mutant at respective time points after fin fold amputation.
- https://doi.org/10.7554/eLife.22716.004
Figure 2 with 1 supplement
Spatiotemporal expression of il1b during fin fold regeneration.
(A) Tissue cryosection of an amputated clo fin fold in which il1b expression was detected using ISH analysis. Arrowheads indicate the epidermal cells expressing il1b. Scale bar, 10 μm. (B) Live imaging of il1b expression in the Tg(il1b:egfp) line in WT and clo mutant at corresponding stages of regeneration. As in the case of il1b expression observed in ISH analysis (Figure 1C), EGFP fluorescence of the Tg(il1b:EGFP) was strongly upregulated in the clo mutant. The EGFP fluorescence in WT decreased more slowly than did the il1b mRNA signal, because of the comparatively longer half-life of the protein EGFP. Scale bars, 100 μm. (C) Immunofluorescence detection of EGFP and E-cadherin in Tg(il1b:EGFP) at 3 and 12 hpa. Confocal longitudinal and transverse optical sections are shown at the top and right side, respectively. Vertical and horizontal red and green lines indicate the approximate sites of the optical sections. Scale bars, 50 μm.
Figure 2—figure supplement 1
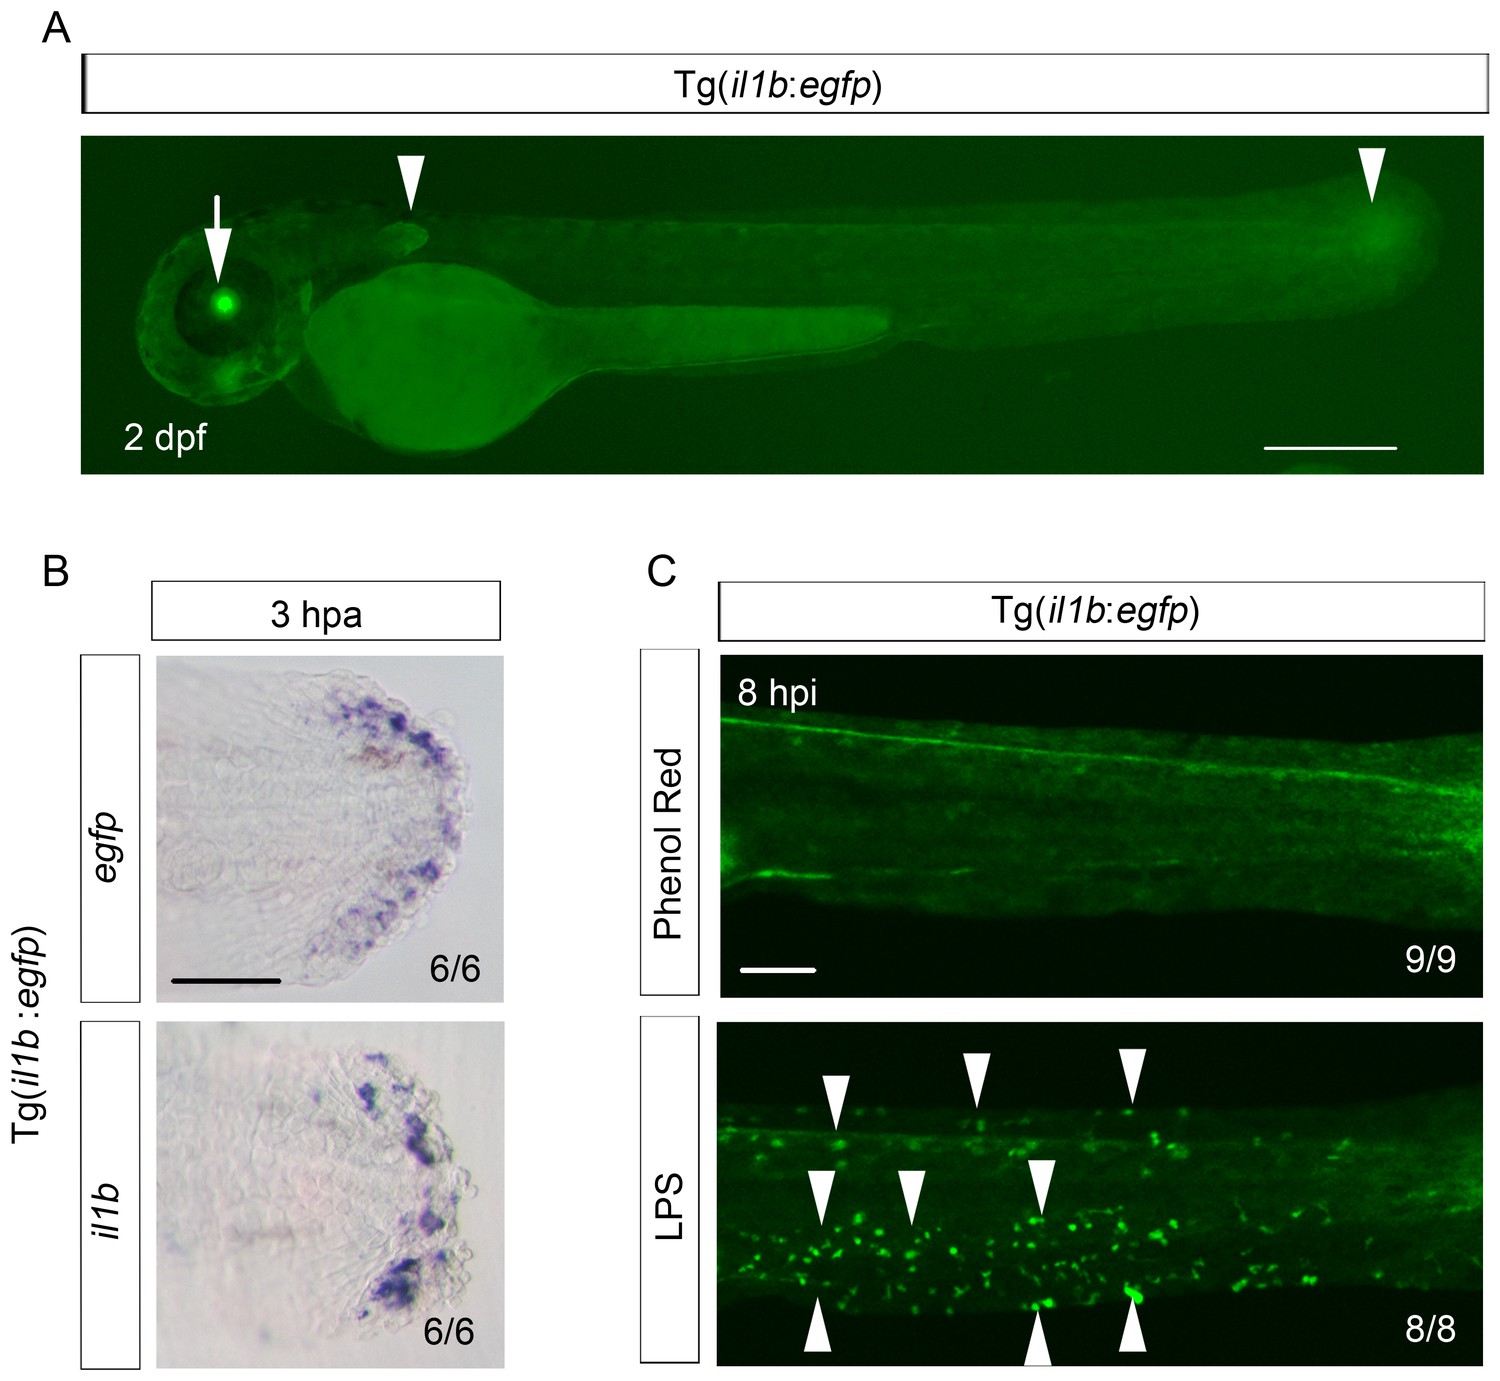
Reproduction of il1b expression in the Tg(il1b:egfp) line.
(A) EGFP expression in Tg(il1b:egfp) at 2 dpa. Arrowheads, EGFP expression in the pectoral fins and the posterior tip of the notochord. Arrow, EGFP expression in the lens by crystalline alpha A:egfp inserted in the Tol2 vector. Scale bar, 300 μm. (B) ISH analysis of egfp and endogenous il1b expression in Tg(il1b:egfp). The two genes were expressed in the same pattern. Scale bar, 50 μm. (C) EGFP fluorescence in Tg(il1b:egfp) after injection of LPS or control solution containing phenol red. Arrowheads indicate some of the EGFP-positive myeloid cells in LPS-injected larvae at 2 dpf; hpi: hours post injection. Scale bar, 100 μm.
Figure 3 with 1 supplement

il1b knockdown or Dex treatment rescued the clo from apoptosis.
(A) Simultaneous detection of apoptosis by TdT-mediated dUTP nick end labeling (TUNEL) and the il1b-expressing cell at 12 hpa in the clo mutant carrying the transgene il1b:egfp. Most of the TUNEL-positive cells were detected in close association with the il1b-expressing epithelial cells. Vertical and horizontal lines indicate the approximate sites of the optical sections. Scale bar, 100 μm. (B) RT-PCR analysis of il1b and actinb1 expression in zebrafish larvae injected with il1b MO. The il1b MO was targeted to the splice donor site. Arrowhead indicates the aberrant transcript. (C) TUNEL analysis in amputated WT or clo larvae (12 hpa) after il1b knockdown. Injection of il1b MO substantially reduced the apoptosis of regenerative cells in the clo mutant, whereas the apoptosis was unaffected by std MO. Scale bars, 50 μm. (D) Quantification of TUNEL staining in the areas bracketed in (C). (E) ISH analysis of il1b expression at 3 hpa in larvae treated with Dex. DMSO: dimethyl sulfoxide, used as the vehicle. Dex treatment abolished il1b expression. Scale bar, 50 μm. (F) TUNEL staining in the amputated fin fold at 12 hpa in Dex-treated WT and clo larvae. Scale bars, 50 μm. (G) Quantification of TUNEL staining in the areas bracketed in (F). In (D) and (G), data are presented as means ± SEM. Student’s t test, **p<0.01; ***p<0.001; N.S., not significant (p=0.172).
Figure 3—figure supplement 1
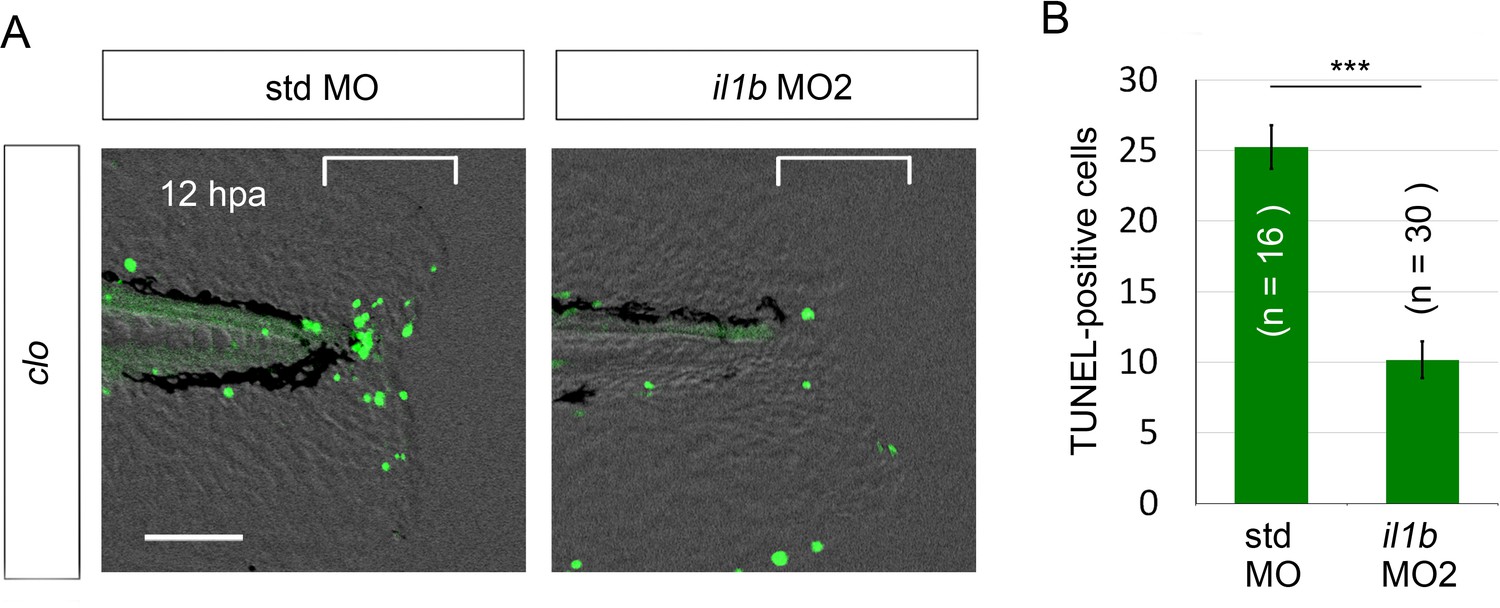
Rescue from apoptosis by il1b MO2.
(A) TUNEL analysis of amputated clo larvae that were injected with il1b MO2. The il1b MO2 rescued the regenerative cells from apoptosis in the clo mutant, whereas the apoptosis was unaffected by std MO. Scale bars, 50 μm. (B) Quantification of TUNEL-positive cells in the areas bracketed in (A). Data are presented as means ± SEM. Student’s t test, ***p<0.001.
Figure 4 with 1 supplement

Macrophages are responsible for survival of regenerative cells.
(A) ISH analysis of lcp1 expression, a macrophage marker, during fin fold regeneration in WT. Scale bar, 50 μm. (B) ISH analysis of mpx expression, a neutrophil marker, during fin fold regeneration in WT. Scale bar, 50 μm. (C) TUNEL analysis in the amputated fin fold at 12 hpa after injection of spi1b, csf3r, and irf8 MOs. Injection of spi1b MO and irf8 MO markedly increased apoptosis of regenerative cells. Scale bar, 100 μm. (D) Quantification of TUNEL-positive cells in the areas bracketed in (A). In (B), data are presented as means ± SEM. Student’s t test, ***p<0.001; N.S., not significant (p=0.981).
Figure 4—figure supplement 1
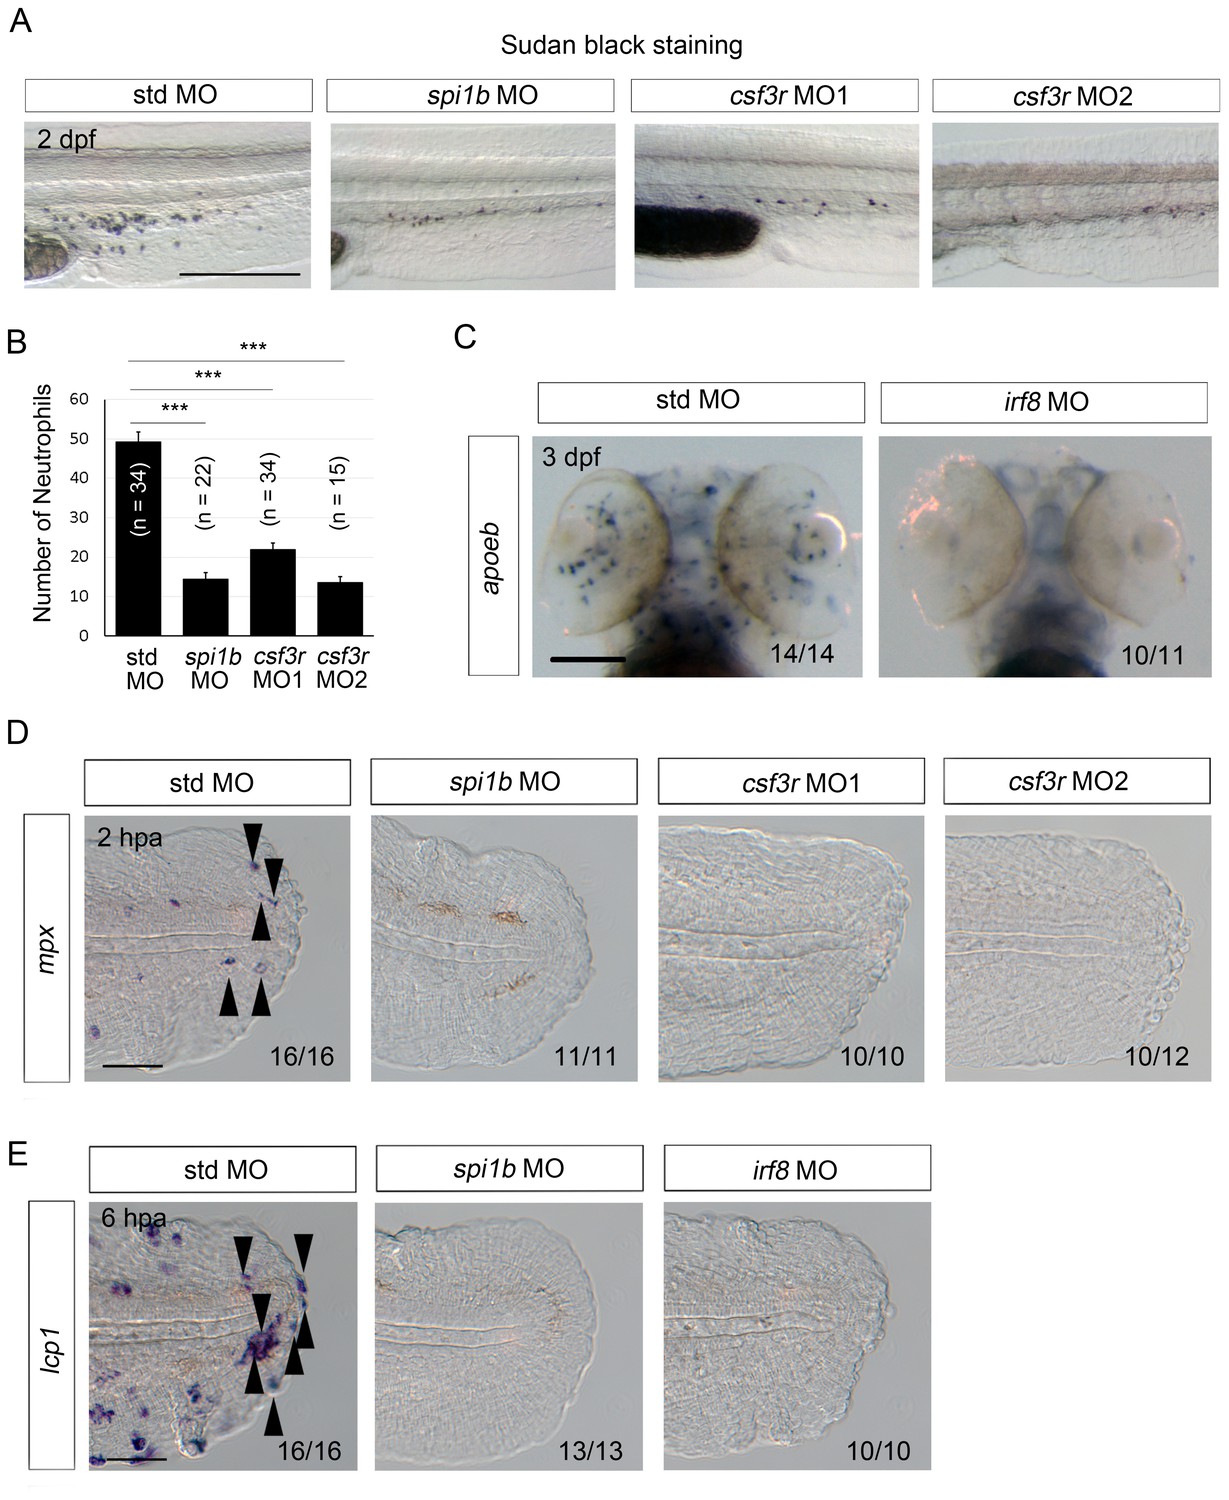
Efficacy of MO-mediated macrophage and/or neutrophil depletion.
(A) Sudan Black staining in std, spi1b, and csf3r morphants. Scale bar, 300 μm. Knockdowns by the spi1b and csf3r MOs decreased the number of neutrophils. (B) Quantification of Sudan Black staining (A; posterior to the yolk extension). Data are presented as means ± SEM. Student’s t test, ***p<0.001. (C) Analysis of apoeb expression in std and irf8 morphants. The irf8 MO inhibited differentiation of glial cells marked by apoeb. Scale bar, 100 μm. (D) ISH analysis of mpx expression, a neutrophil marker, at 2 hpa in amputated fin fold of larvae injected with std, spi1b, or csf3r MOs. mpx-positive cells were not detected in the spi1b or csf3r morphants. Arrowheads indicate representative neutrophils. Scale bar, 25 μm. (E) ISH analysis of lcp1, a macrophage marker, at 6 hpa in amputated fin fold of larvae injected with std, spi1b, or irf8 MOs. Arrowheads indicate representative macrophages which have migrated to the injured site. lcp1-positive macrophages are rarely observed in amputated fin fold of the spi1b or irf8 morphants. Scale bar, 25 μm.
Figure 5

Prolonged il1b expression and apoptosis are induced by macrophage loss during fin fold regeneration.
(A) ISH analysis of il1b expression in spi1b, csf3r, and irf8 morphants. The spi1b and irf8 morphants displayed prolonged il1b expression at 6 hpa. Scale bar, 50 μm. (B) Quantification of il1b expression detected using ISH analysis in (A). The level of il1b expression was evaluated as in Figure 1D. Data are the sum of two experiments (total n > 16 for each MO). (C) TUNEL analysis of the amputated fin fold at 12 hpa after il1b knockdown or Dex treatment in larvae in which macrophages were depleted using the spi1b or irf8 MO. Scale bar, 100 μm. Apoptosis caused by spi1b and irf8 MOs was rescued by il1b MO administration or Dex treatment. (D) Quantification of TUNEL staining in the spi1b morphants (C; bracketed areas). (E) Quantification of TUNEL staining in the irf8 morphants in (C). In (D) and (E), data are presented as means ± SEM. Student’s t test, ***p<0.001.
-
Figure 5—source data 1
il1b expression in larvae injected with std, spi1b, csf3r, or irf8 MOs.
The table shows the numbers of larvae used for evaluating the il1b expression levels in larvae that were injected with respective MOs.
- https://doi.org/10.7554/eLife.22716.013
Figure 6 with 1 supplement
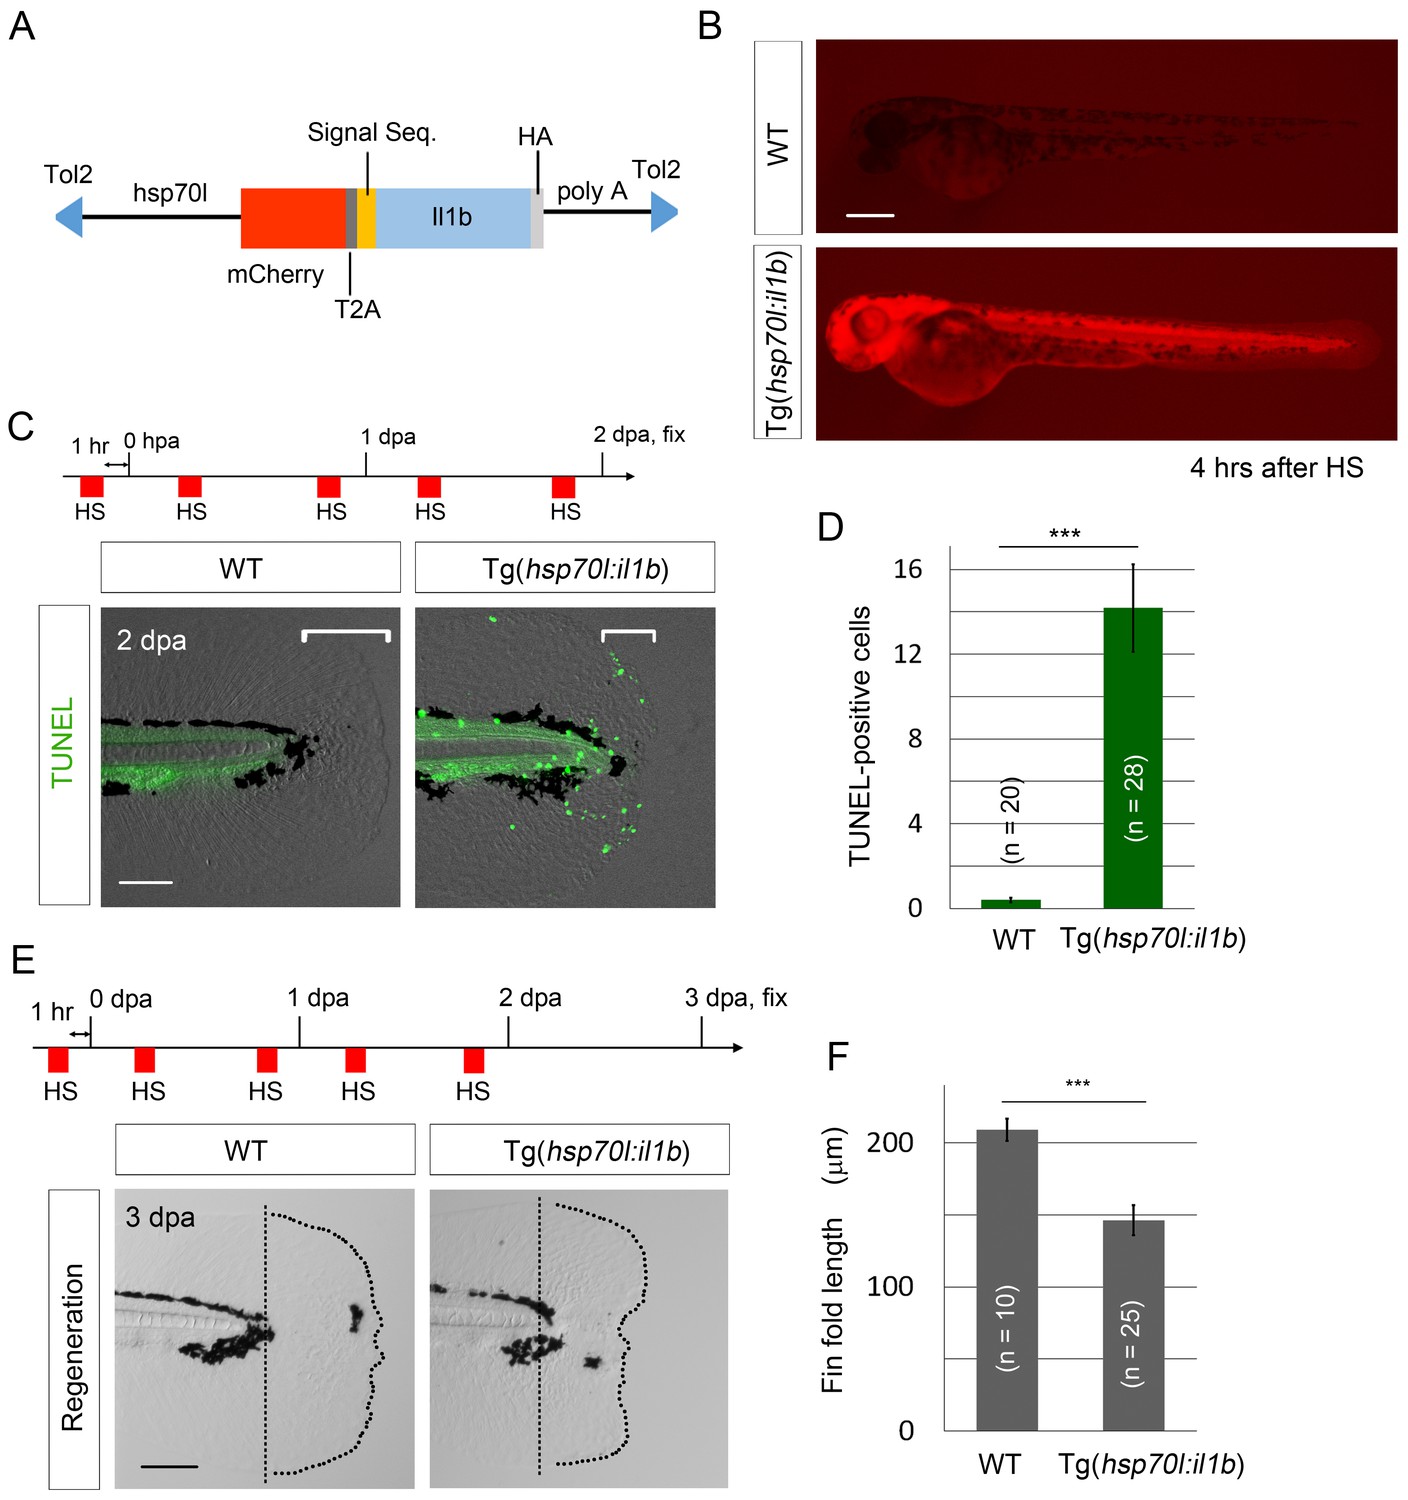
il1b overexpression induces aberrant apoptosis.
(A) A schematic diagram of the construct used; in this construct, the zebrafish heat shock protein 70l promoter drives the expression of mCherry and il1b harboring a signal sequence. (B) mCherry fluorescence in Tg(hsp70l:il1b) at 4 hr after heat shock. WT, sibling WT. Scale bar, 250 μm. (C) TUNEL analysis in the amputated fin fold of Tg(hsp70l:il1b) at 2 dpa. The diagram depicts the experimental procedure. HS, heat shock. Scale bar, 100 μm. (D) Quantification of TUNEL staining in (C). (E) Fin fold regeneration in Tg(hsp70l:il1b) and sibling WT larvae. Dotted lines indicate amputation planes and fin fold outlines. Scale bar, 100 μm. (F) Quantification of the length of the regenerate (length posterior to the amputation plane; shown in (E)). In (D) and (F), data are presented as means ± SEM. Student’s t test, ***p<0.001.
Figure 6—figure supplement 1
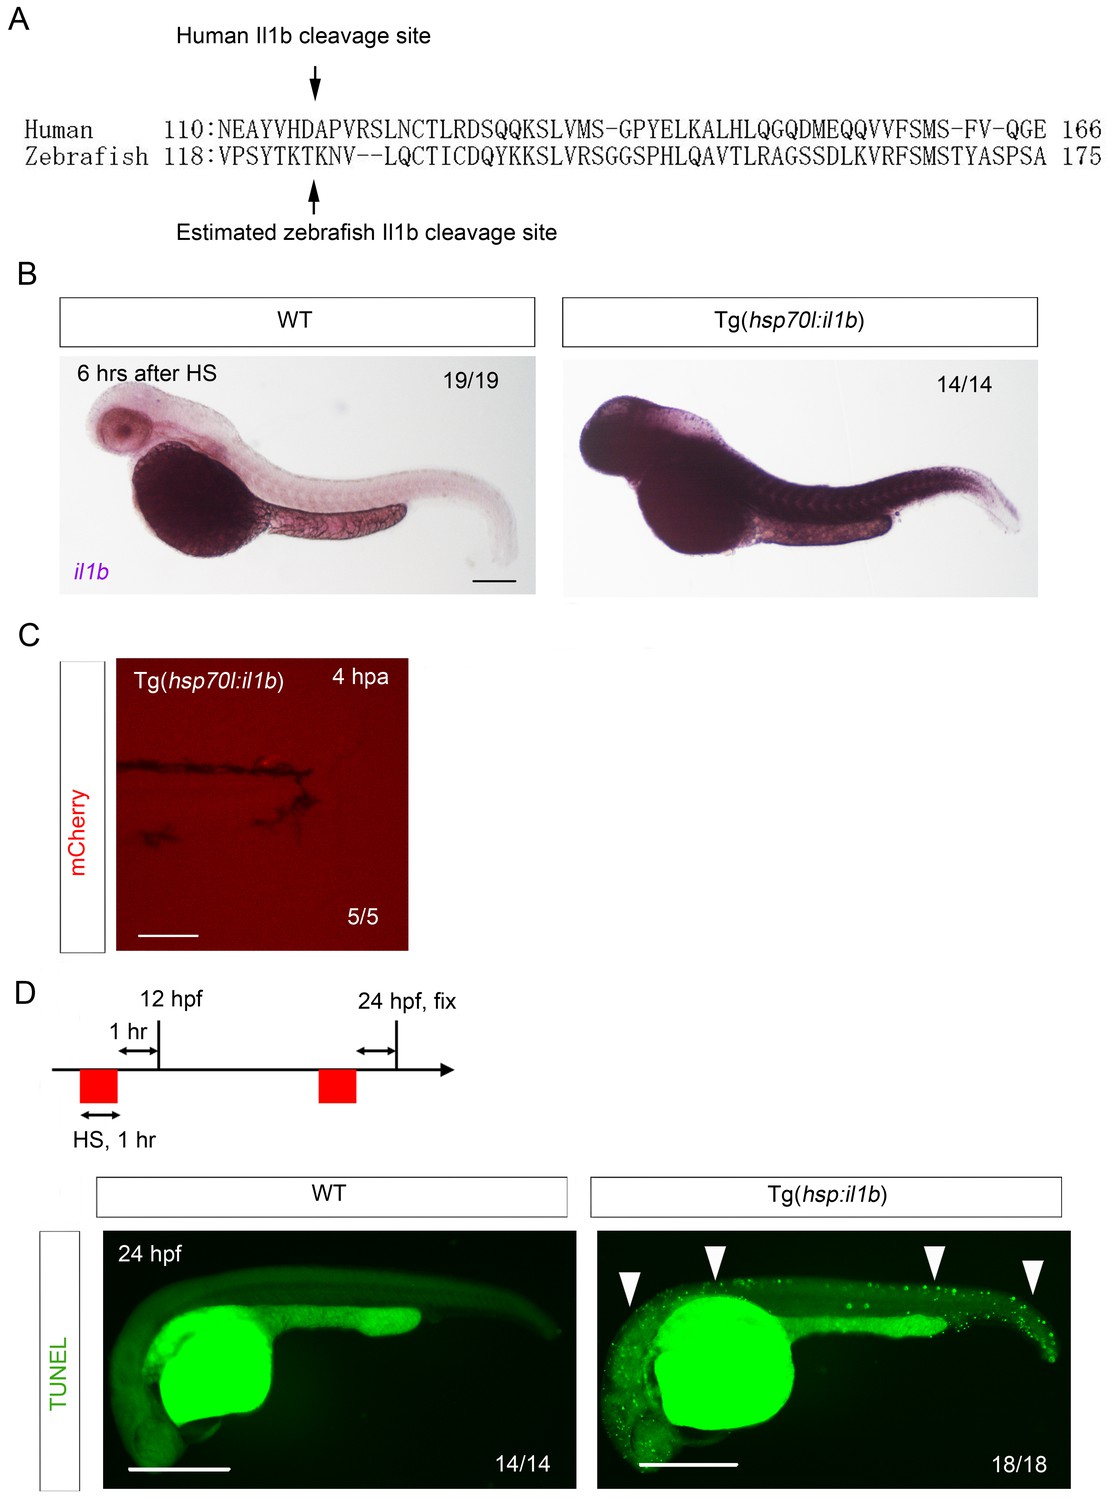
Generation of Tg(hsp:il1b).
(A) Comparison of zebrafish Il1b and human IL-1β amino acid sequences. Arrows indicate the human IL-1β cleavage site (D116) and the estimated zebrafish Il1b cleavage site (T124). (B) ISH analysis of il1b expression in Tg(hsp70l:il1b) at 6 hr after heat shock (HS). HS induced systemic il1b expression. Scale bar, 250 μm. (C) Absence of mCherry induction by fin fold amputation in the Tg(hsp70l:il1b). A stress caused by fin fold amputation did not induce mCherry expression. Scale bar, 100 μm. (D) TUNEL analysis of Tg(hsp70l:il1b) at 24 hpf after induction of il1b overexpression. The diagram depicts the experimental procedure. Scale bar, 500 μm.
Figure 7 with 1 supplement
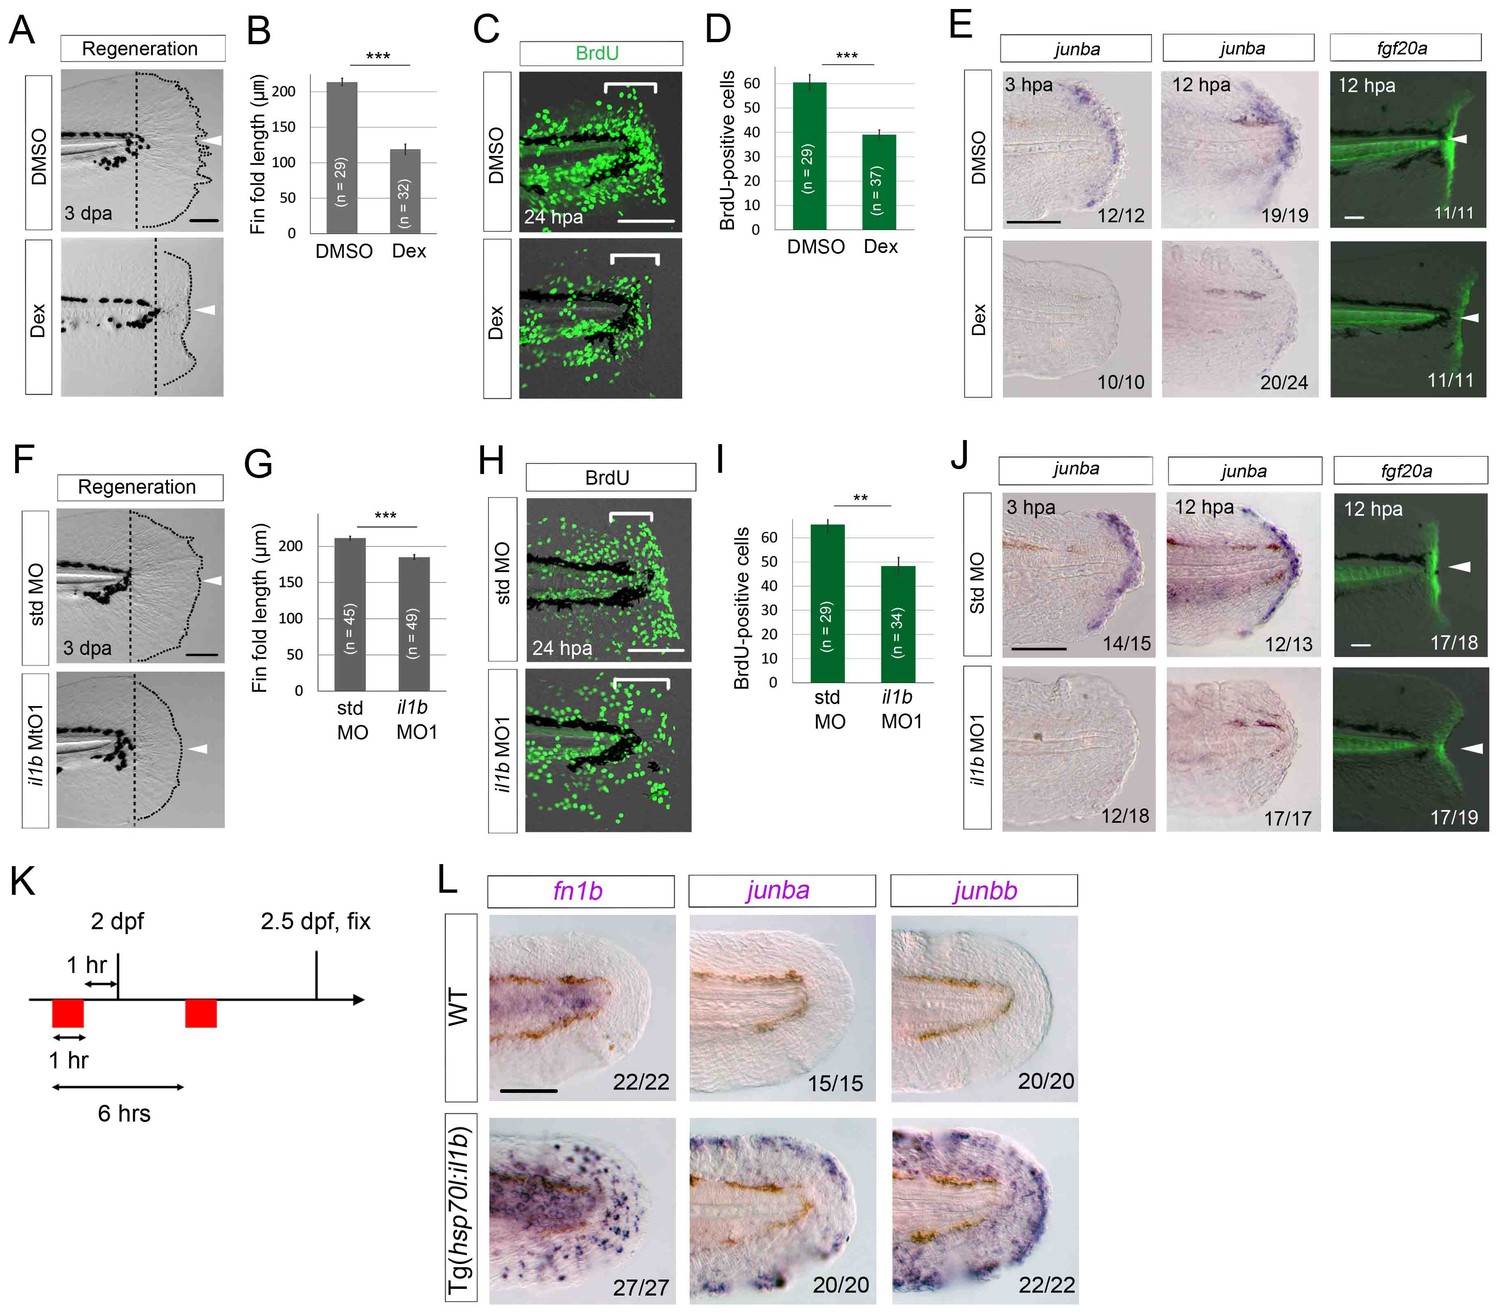
Il1b-mediated inflammation is required for normal regeneration.
(A) Fin fold regeneration in WT larvae treated with Dex. Regeneration was retarded following treatment with Dex but not vehicle DMSO (arrowheads). Scale bar, 100 μm. (B) Quantification for (A) (posterior to the notochord). (C) BrdU incorporation in larvae treated with DMSO or Dex. BrdU labeling, 0–24 hpa. Scale bar, 50 μm. (D) Quantification for (C) (bracketed areas). BrdU-positive cells were significantly reduced following Dex treatment. (E) Detection of junba expression using ISH and fgf20a expression using the HGn21A enhancer-trap line (Shibata et al., 2016) in DMSO- or Dex-treated larvae. The expression of junba and fgf20a was also significantly downregulated following Dex treatment. Arrowheads indicate EGFP expression at amputation sites. Scale bars, 50 μm (F) Fin fold regeneration in larvae injected with std or il1b MO. The knockdown of il1b reduced fin fold regeneration. Scale bar, 100 μm. (G) Quantification for (F) (posterior to the notochord). (H) BrdU incorporation in larvae injected with std or il1b MO. BrdU labeling, 0–24 hpa. Scale bar, 50 μm. (I) Quantification for (H) (bracketed areas). (J) Detection of junba expression using ISH and fgf20a expression using the HGn21A line in larvae injected with std or il1b MO. The expression of junba and fgf20a was downregulated following il1b knockdown as in the Dex-treated larvae. Arrowheads indicate EGFP expression atamputation sites. Scale bars, 50 μm. (K) Schematic of the procedure of il1b overexpression in uninjured WT larvae. Heat shock was applied twice before fixation. (L) ISH analysis of fn1b, junba, and junbb in WT and Tg(hsp70l:il1b). il1b overexpression stimulated ectopic expression of regeneration-induced genes in uninjured larvae. Scale bar, 50 μm. In (A) and (F), dotted lines indicate amputation planes and fin fold outlines. In (B), (D), (G), and (I), data are presented as means ± SEM. Student’s t test, **p<0.01; ***p<0.001.
Figure 7—figure supplement 1
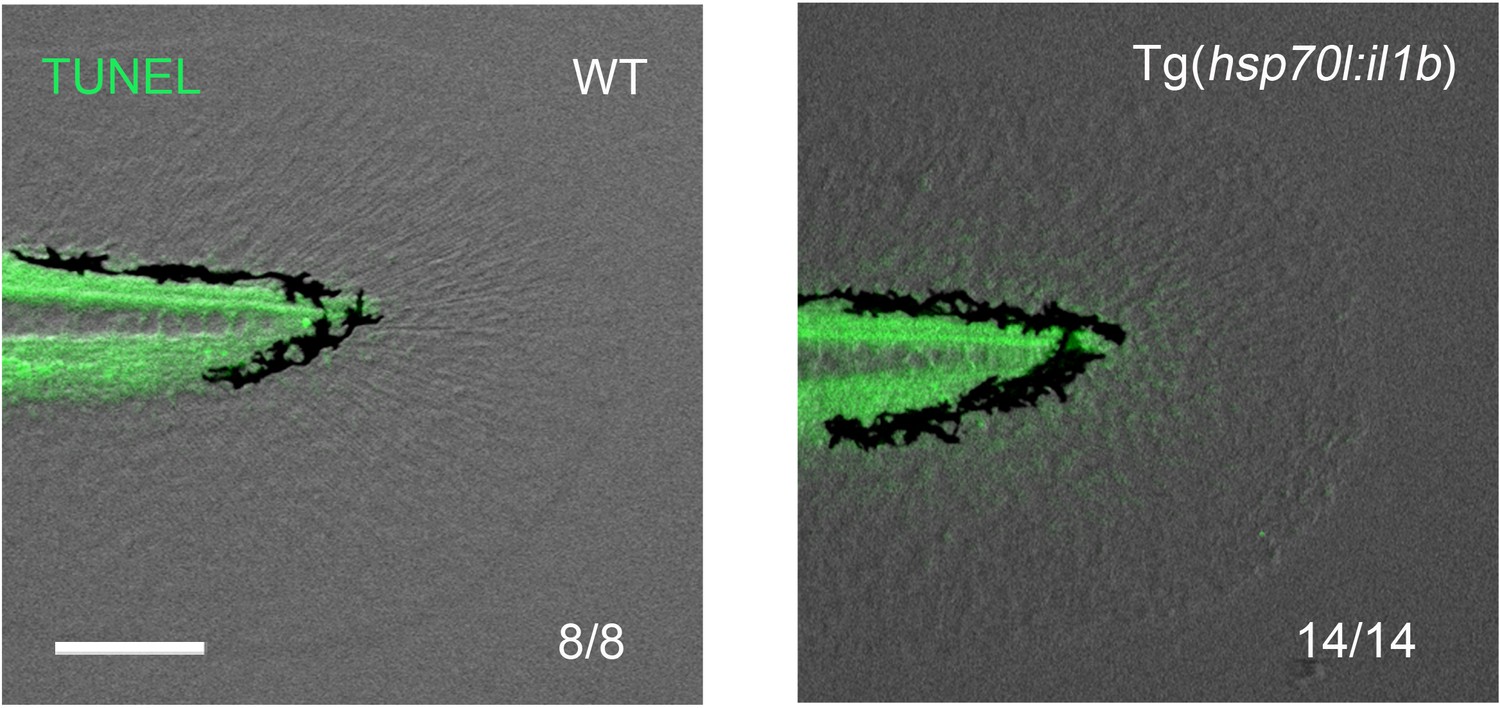
Absence of apoptosis after two HS inductions in the Tg(hsp70l:il1b).
TUNEL analysis after two HS inductions of il1b overexpression (Figure 6K). At this stage, apoptosis has not been induced. Scale bar, 100 μm.
Figure 8
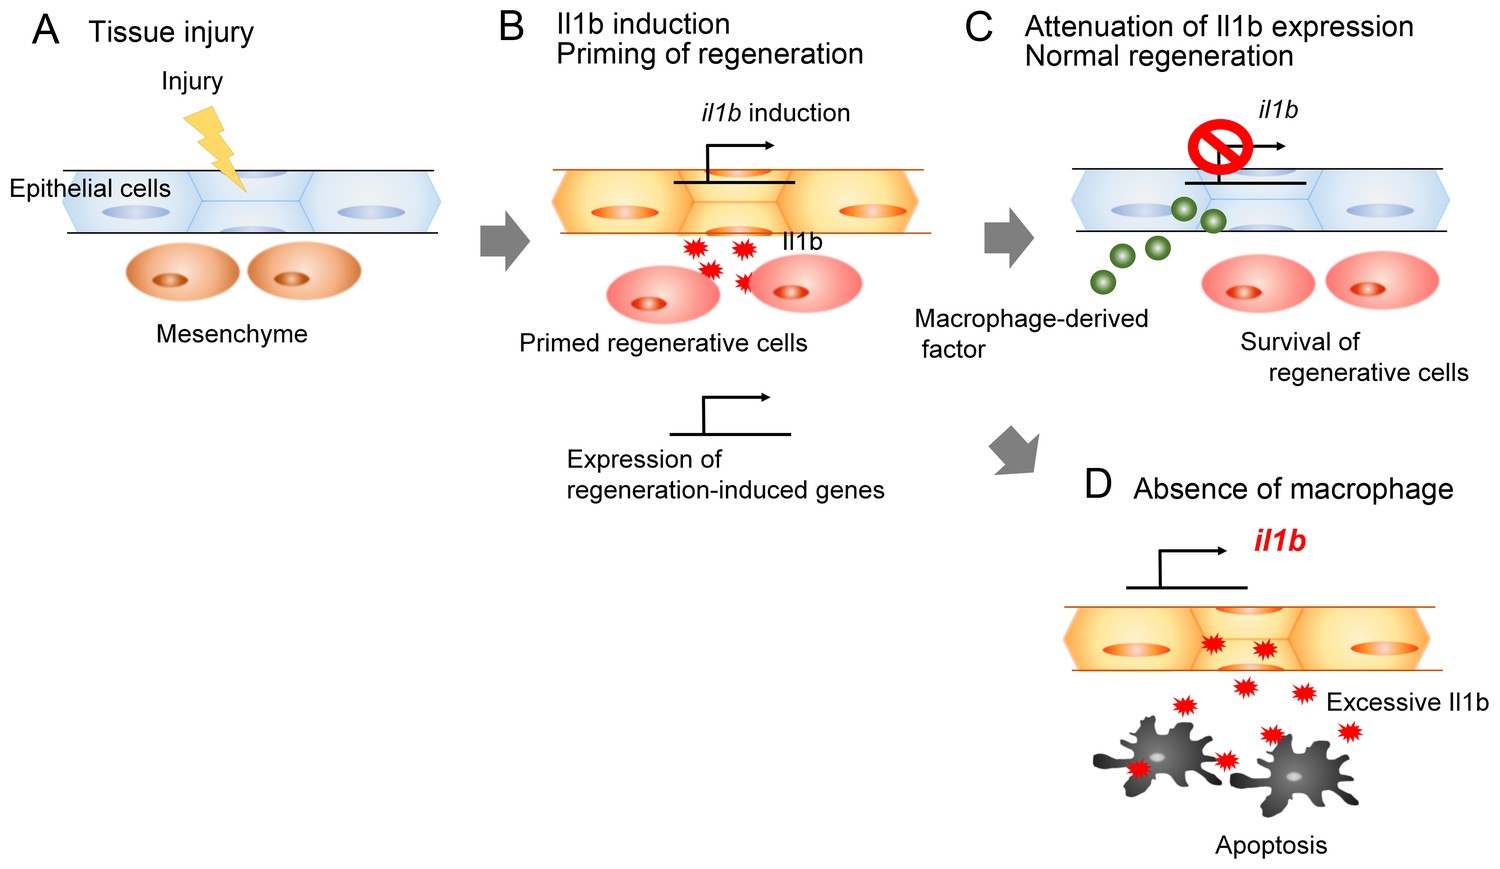
Schematic of the role of Il1b and macrophages during fin fold regeneration.
(A and B) Tissue injury induces il1b expression in epithelial cells. The Il1b acts on the surrounding cells to prime them for regeneration by triggering expression of regeneration-induced genes such as fn1b, junba, junbb, and fgf20a. (C) The macrophage-derived factor subsequently attenuates il1b expression during normal regeneration. (D) In the absence of macrophages, apoptosis is induced in the primed regenerative cells. Thus, the Il1b function is a double-edged sword in tissue regeneration.
Videos
Video 1
Time-lapse imaging of EGFP fluorescence in Tg(il1b:egfp) from 1 to 11 hpa.
Images were acquired once every 15 min. The epidermal cells at the injury site and the migrating cells, which are considered to be myeloid cells, expressed EGFP.
Additional files
-
Supplementary file 1
The list of transcripts that are upregulated or downregulated in the amputated fin fold of the clo mutant.
The table of upregulated genes shows the list of transcripts whose final RPKMs of the amputated clo mutant at 6 hpa are more than two times than those of the amputated WT. The table of downregulated genes shows the list of top 100 transcripts whose final RPKMs of the amputated clo mutant at 6 hpa are downregulated compared with those of amputated WT. Transcripts with low expression in the clo mutant (final RPKM <4) were excluded. Final RPKM, the reads per kilobase of exon model per million mapped reads. Transcripts that are shown in Figure 1A are highlighted.
- https://doi.org/10.7554/eLife.22716.019
Download links
A two-part list of links to download the article, or parts of the article, in various formats.
Downloads (link to download the article as PDF)
Open citations (links to open the citations from this article in various online reference manager services)
Cite this article (links to download the citations from this article in formats compatible with various reference manager tools)
Transient inflammatory response mediated by interleukin-1β is required for proper regeneration in zebrafish fin fold
eLife 6:e22716.
https://doi.org/10.7554/eLife.22716


