A multi-scale model for hair follicles reveals heterogeneous domains driving rapid spatiotemporal hair growth patterning
- University of California, United States
- Kyungpook National University, Korea
- Biomedical Research Institute, Kyungpook National University Hospital
- Kyungpook National University Hospital
- College of Biological Sciences, China Agricultural University, China
- The First Affiliated Hospital, Sun Yat-sen University, China
- Keimyung University, Korea
- The University of Queensland, Australia
- University of Southern California, United States
- Medical Sciences Program, Indiana University School of Medicine, United States
- CeNT, University of Warsaw, Poland
Figures
Figure 1
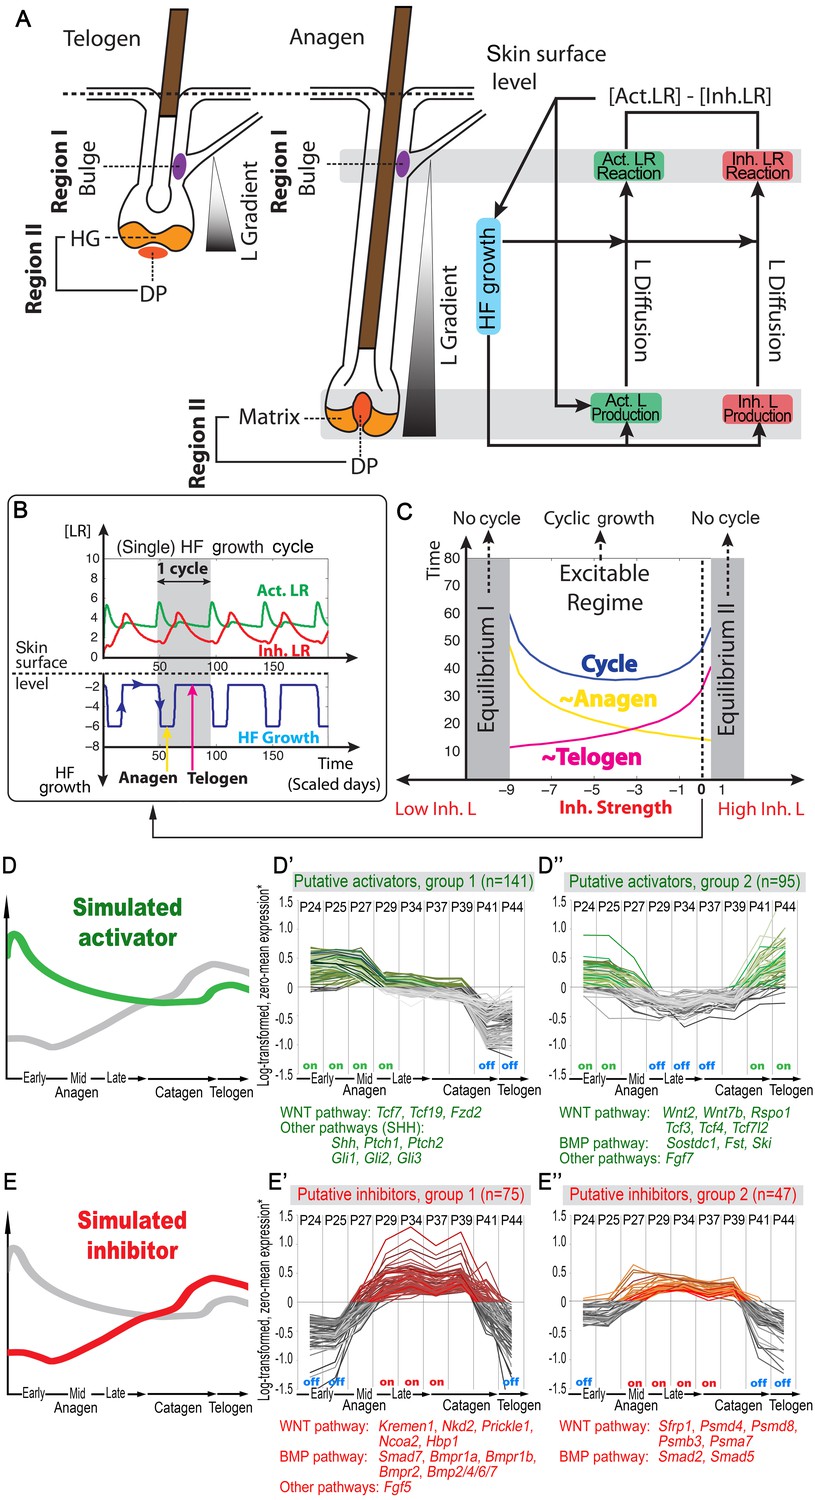
Model recapitulates hair cycling and its associated activator and inhibitor signaling dynamics.
(A) Schematic depiction of HF growth dynamics during telogen and anagen. Telogen and anagen HFs are shown on the left and in the center, respectively. In both hair cycle phases, Region I (purple) represents bulge and Region II (orange) represents DP with HG during telogen phase, and DP with matrix during anagen phase. On the right, schematic drawing of diffusive activator (Act. L. in green) and inhibitor (Inh. L. in red) interactions with their corresponding receptors (Act. R and Inh. R, not depicted) that form ligand-bond-receptors (Act. LR and Inh. LR) and their coupling with physical growth of the HF (blue) is shown. (B) Typical noise-free dynamics of the activator (green) and inhibitor (red) and cyclic HF growth (blue) are shown. X-axis is time in simulated days. Y-axis for activator and inhibitor shows simulated signaling levels, and for HF growth – simulated length of the HF. Grey area demarcates one modeled hair growth cycle. (C) The duration of ~anagen and ~telogen phases as the function of inhibitor signaling strengths. X-axis shows modeled inhibitor levels with ‘0’ being an arbitrary baseline levels. Y-axis shows time in simulated days. Upon stronger inhibitory signaling (high Inh. L level) ~anagen shortens (yellow) and ~telogen lengthens (purple). The entire cycle (blue) becomes longer either with stronger or weaker inhibitory signaling. When inhibitory signaling becomes either very strong or very weak, the excitability of the system breaks down and HFs equilibrate in one state (grey regions). Also see Appendix 2—tables 1, 2 and 4. (D–E’’) A total of 236 putative activator genes (green) and 122 putative inhibitor genes (red) available from a whole skin microarray dataset were identified to recapitulate temporal dynamics of the simulated activator (D) and inhibitor (E), respectively. Multiple WNT pathway members are in the putative activator gene set (D’, D’’), while BMP pathway members are among the putative inhibitor genes (E’, E’’). See gene list in Dataset 1. For all genes log-transformed, zero-mean expression profile values were calculated using colorimetric ratio-scale algorithm as reported in (Lin et al., 2009).
Figure 2
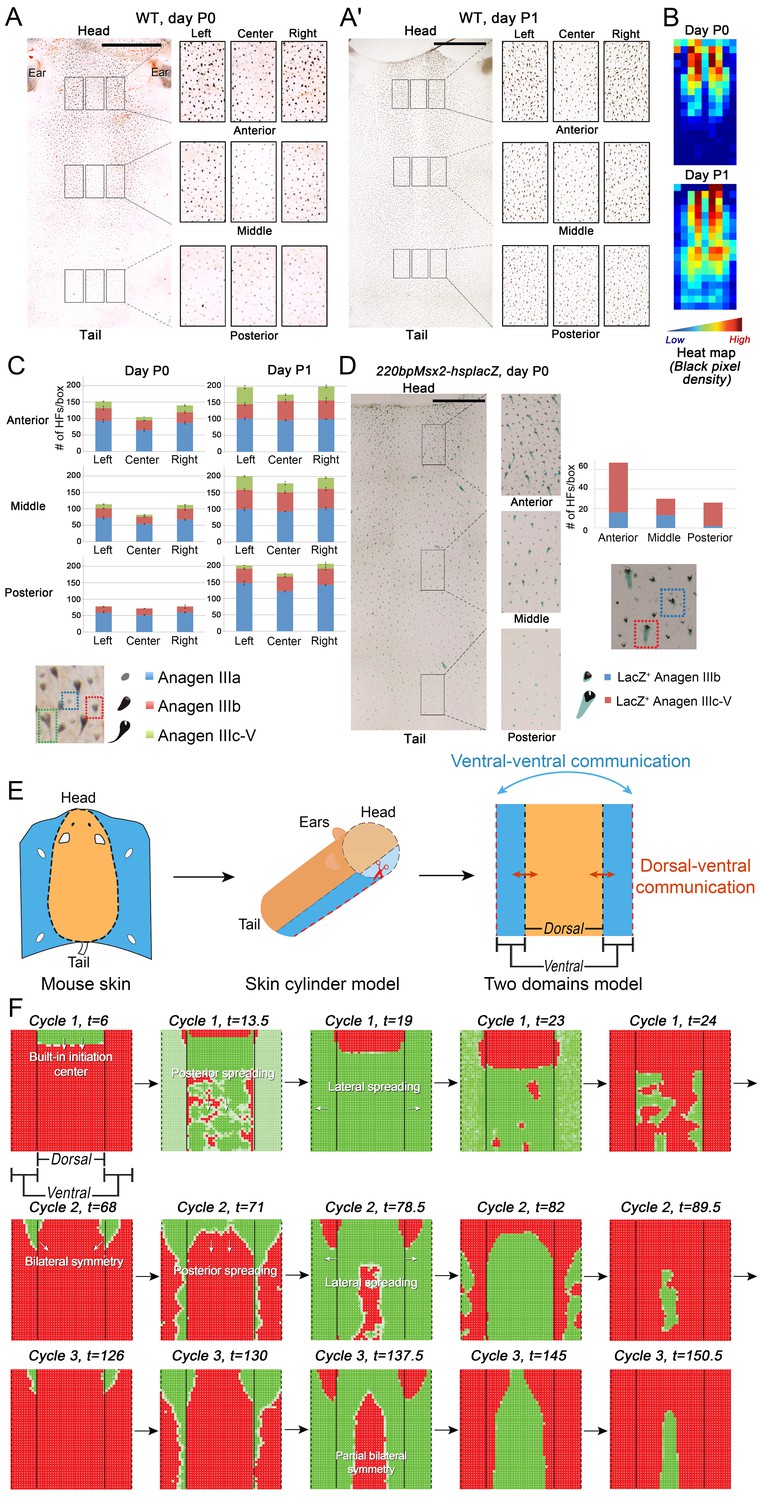
Spatiotemporal patterning of early hair cycles.
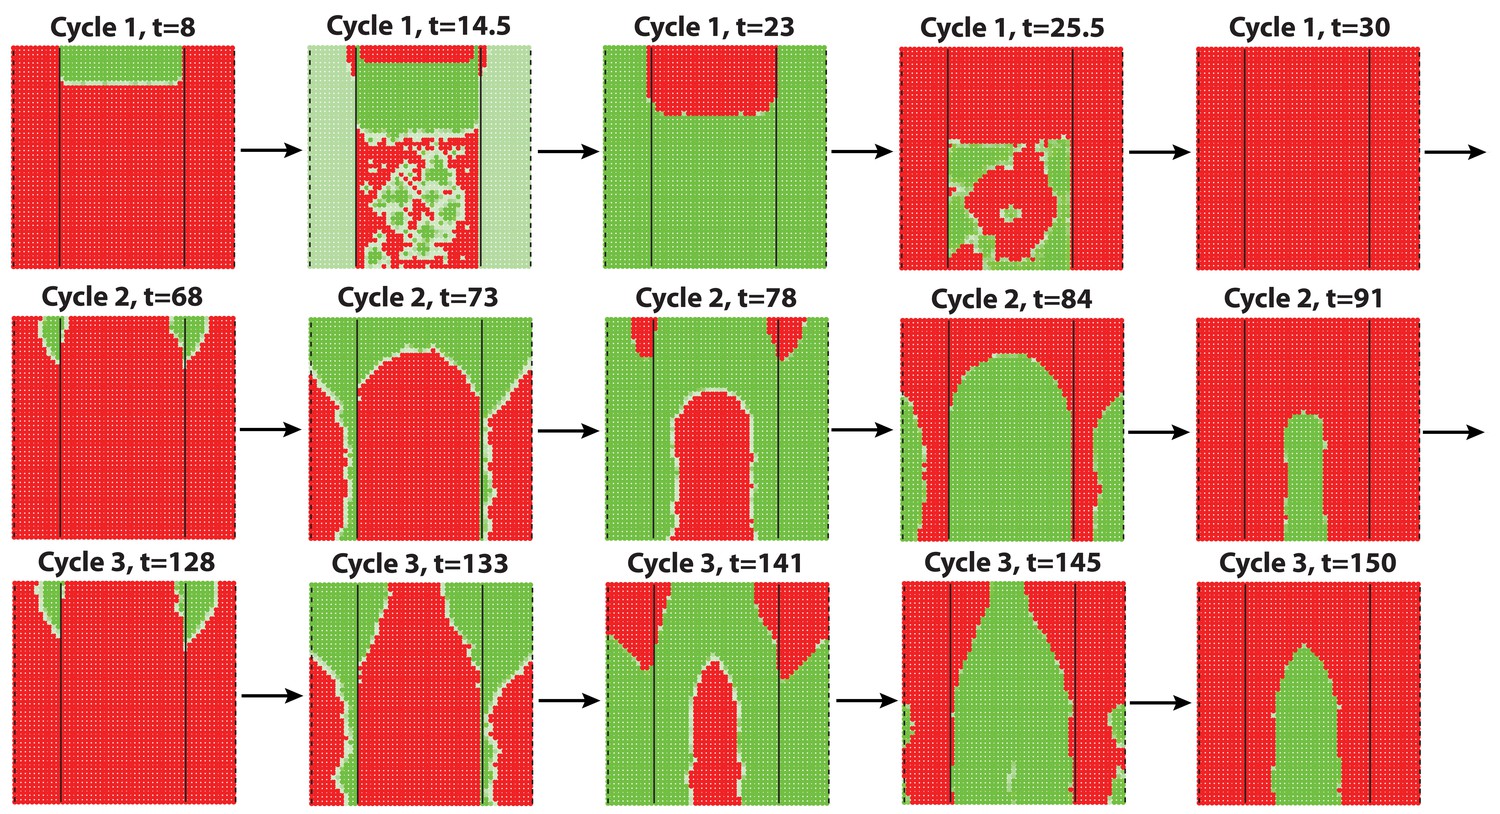
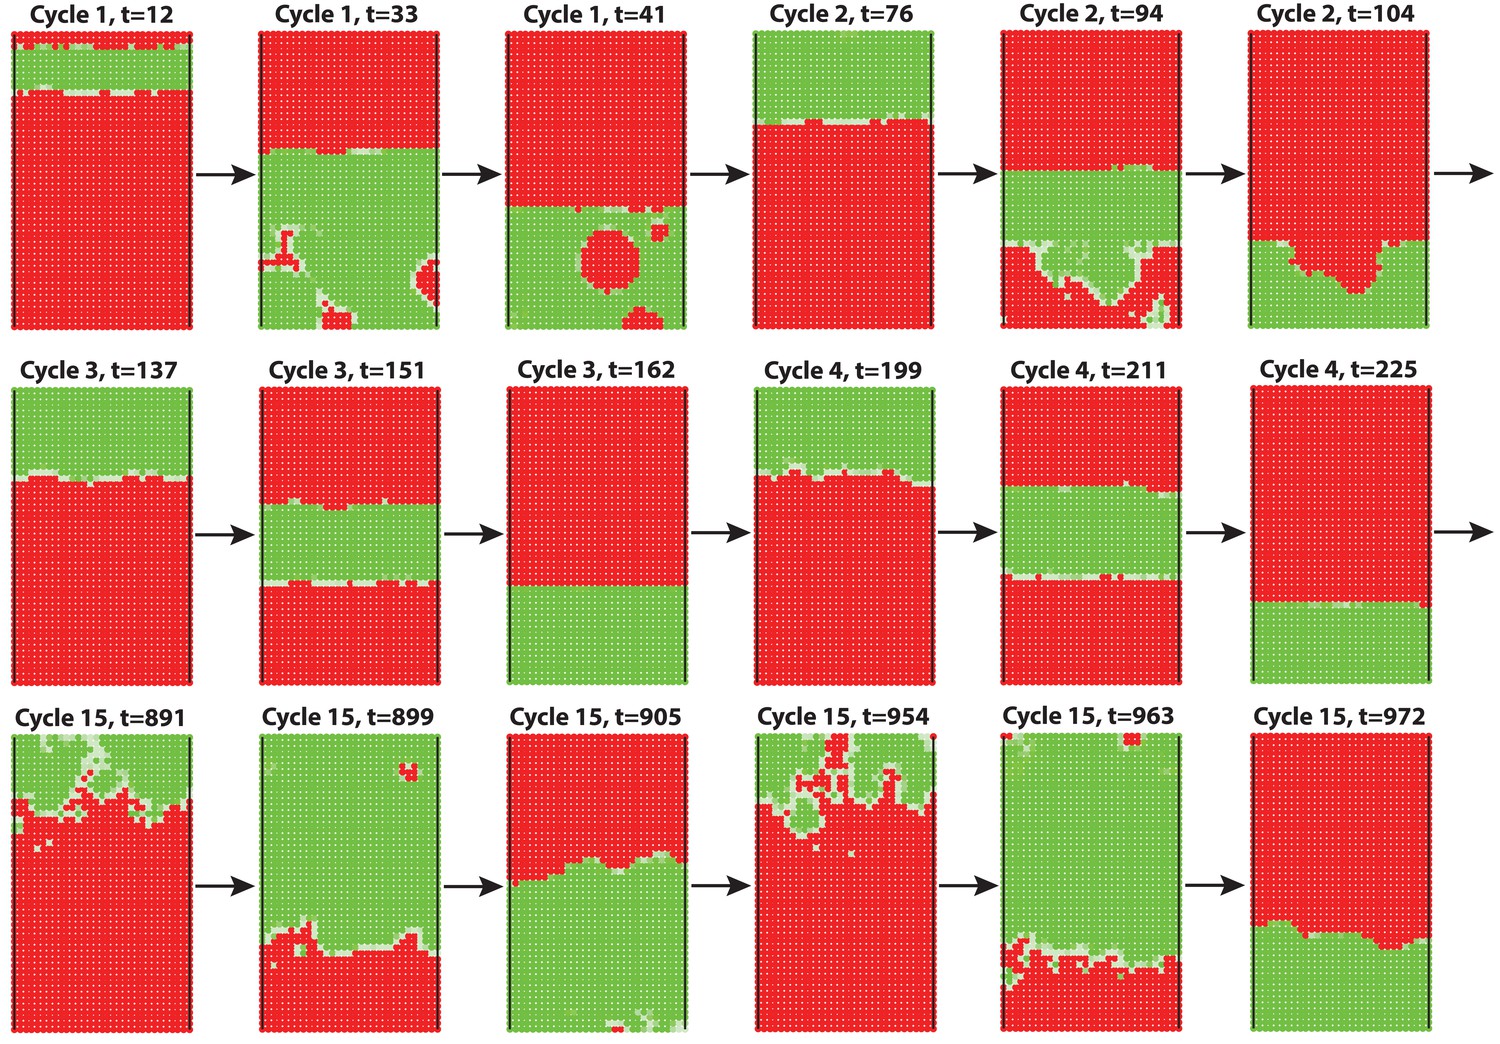
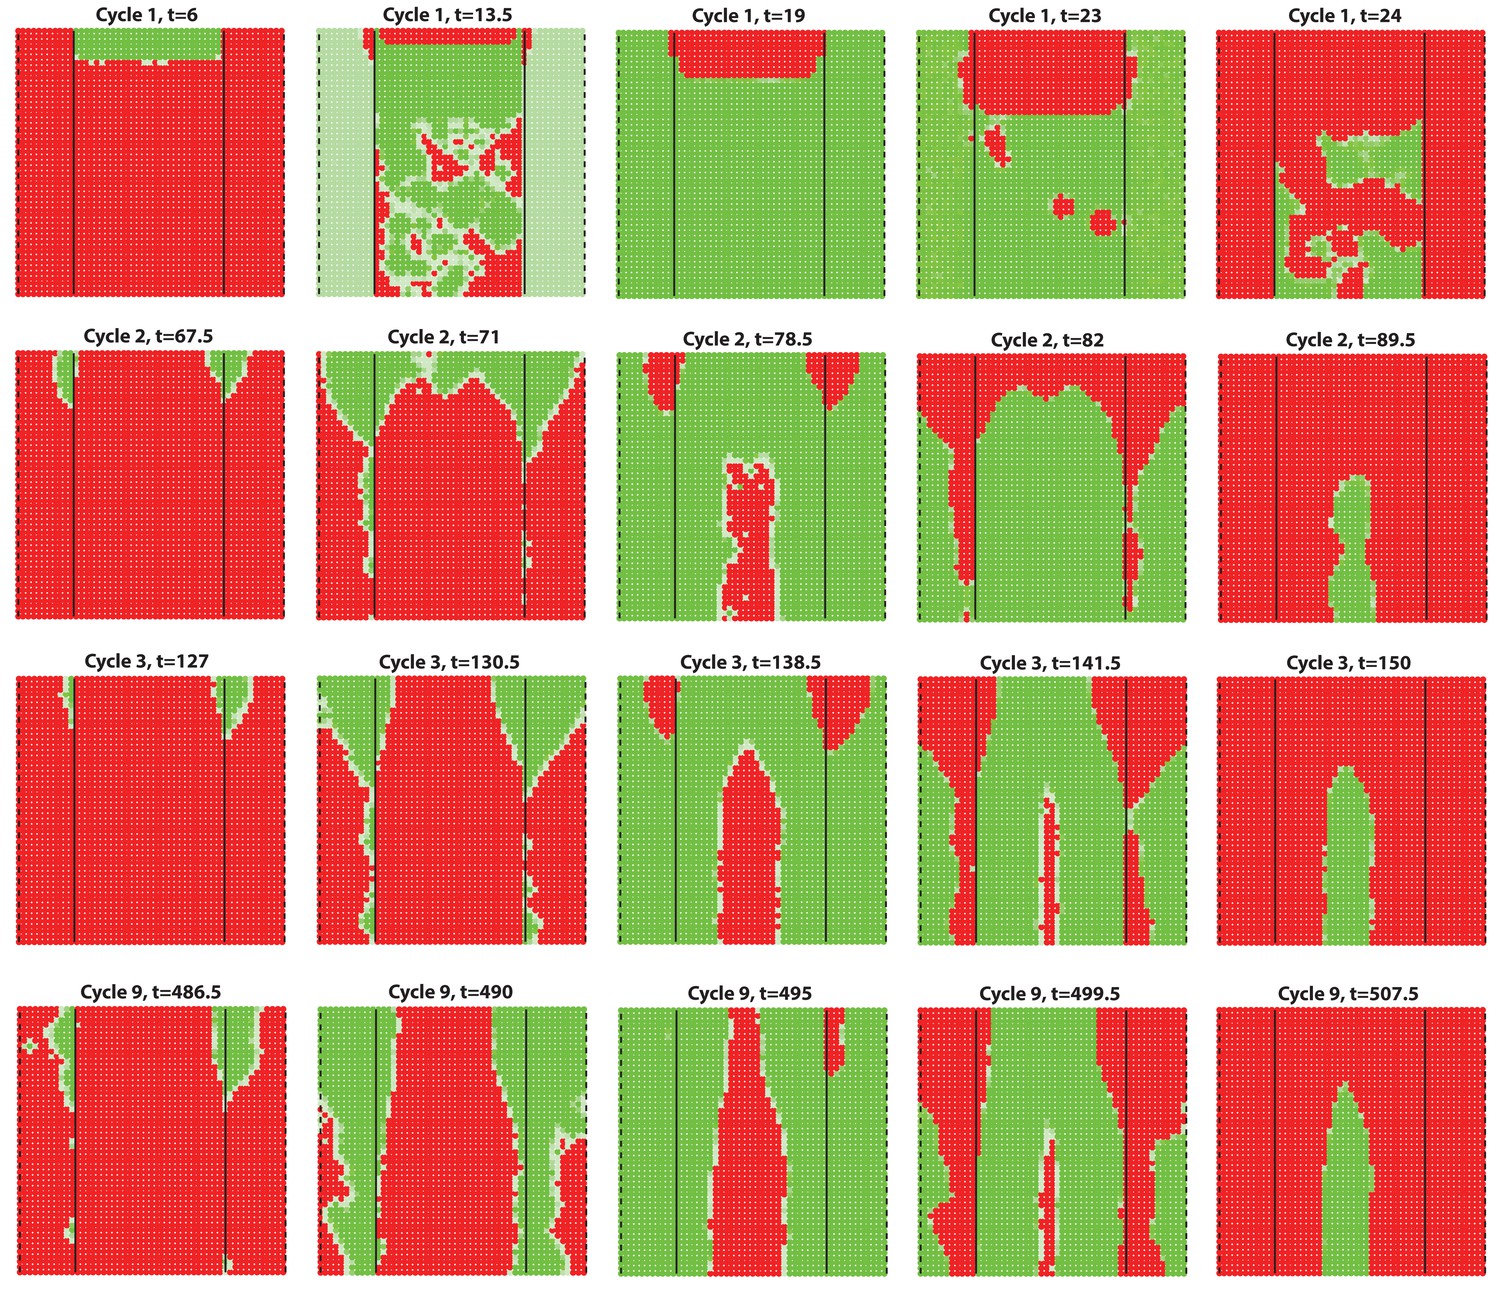
(A–D) Analysis of the whole mount dorsal skin samples from P0 (n = 3) (A) and P1 WT mice (n = 3) (A’) reveals subtle head-to-tail and lateral-to-medial hair cycle asynchronies. Asynchronies were inferred from examining the size of pigmented HFs. Larger HFs result from earlier anagen onset. (B) Heatmaps of skin samples from A and A’ built based on black pixel density (reflecting pigmented anagen HFs). (C) Quantification of anagen HFs at different phases confirms head-to-tail pattern asynchrony. Morphological definition of anagen phases used for this analysis is provided at the bottom on the panel. (D) Analysis of the whole mount dorsal skin samples from P0 220bpMsx2-hsplacZ mice, where lacZ reporter activates in anagen HFs starting from phase IIIb, confirms head-to-tail asynchrony. (E, F) Modeling rapid hair growth pattern evolution in the context of two heterogeneous domains. (E) Schematic depiction of the modeling conditions with central Dorsal domain flanked by two lateral Ventral sub-domains with coupling between Dorsal and Ventral HFs. (F) Compared to Dorsal domain HFs, Ventral domain HFs were assigned with higher levels of total available activator and inhibitor receptors, allowing shorter ~anagen and ~telogen duration. Furthermore, hair cycle asynchrony was introduced into Dorsal domain to model the initial head-to-tail asynchrony. In simulations, interactions between HFs across domain boundaries result in bilateral symmetry during the second cycle (simulated time t68-78.5). Also, initial asynchrony breaks down in the cycle 3 (t130), and partial bilateral symmetry maintains into the late cycles (see Appendix 2—video 4). Scale bars: A, A’, D – 5 mm. Images on A, A’ and D are composites.
Figure 3
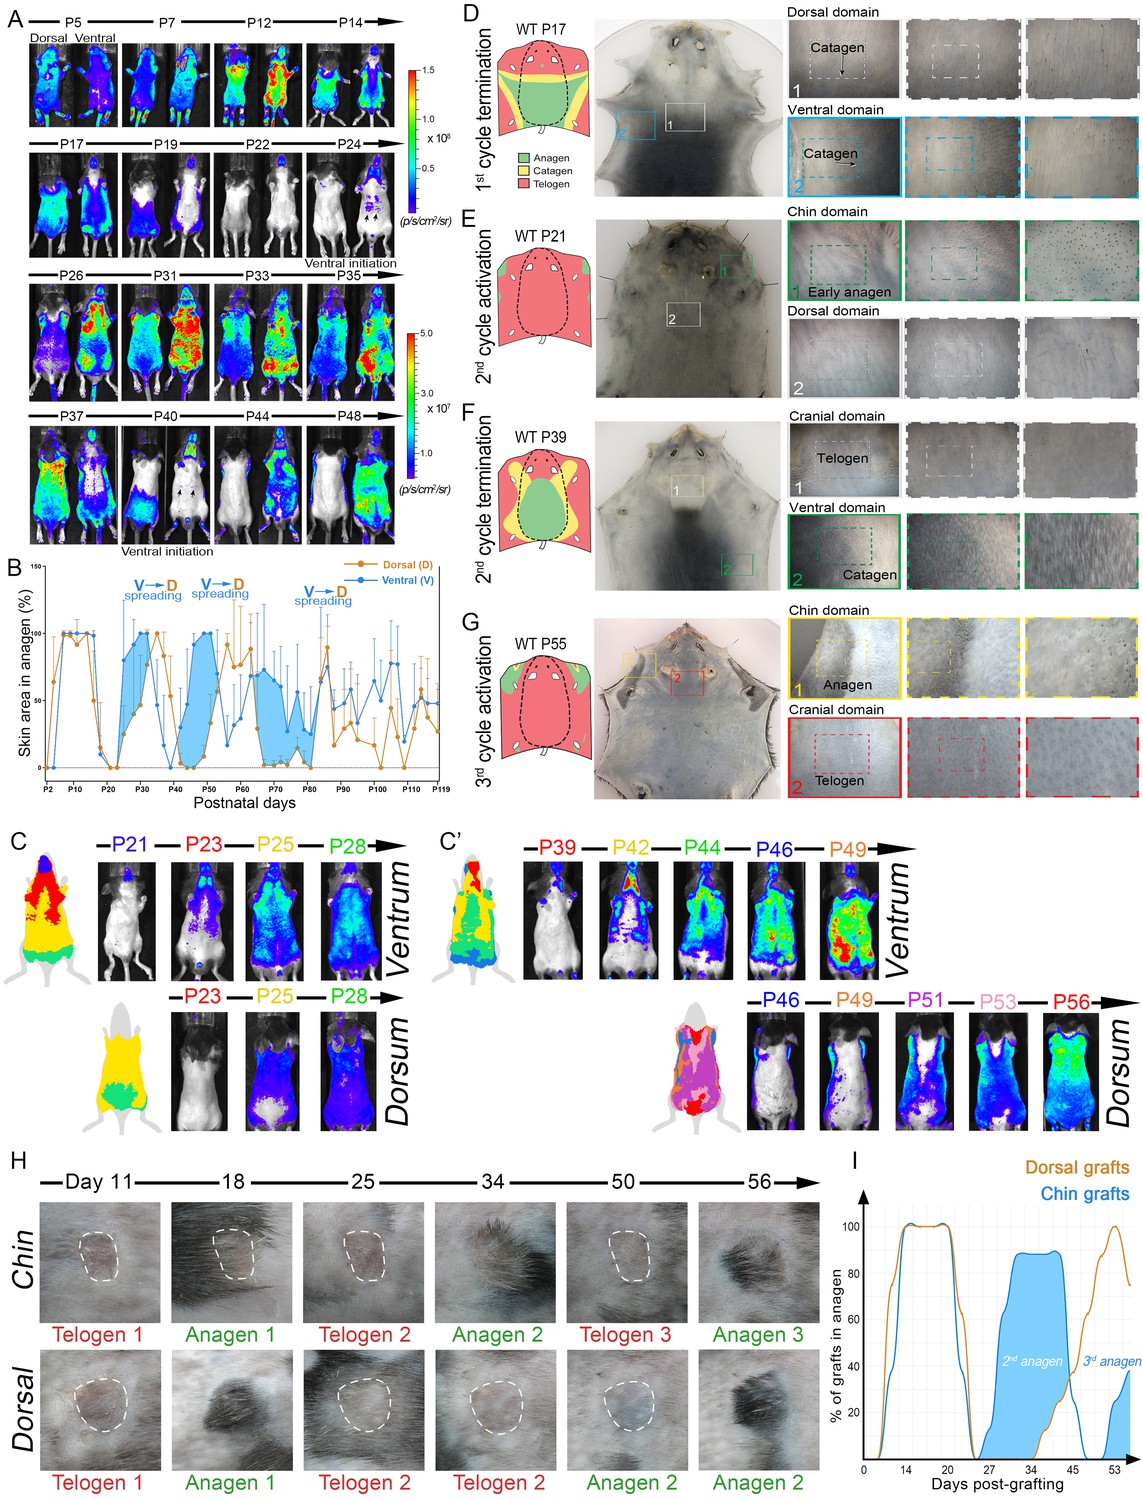
Dorsal-ventral HF interactions produce bilateral symmetry.
(A) Time-lapse bioluminescence in dorsal and ventral skin of the representative Flash mouse between days P5-P48. Bioluminescent signal is color-coded according to the colorimetric scale on the right. (B) Combined temporal dynamics (from 6 Flash mice) of the bioluminescent signal-based anagen measurements over four hair cycles (days P5-P119). Dorsal skin dynamics are in brown and ventral skin dynamics are in blue. Prominent temporal advancement of ventral over dorsal anagen initiation can be seen during second, third and fourth cycles (light blue areas). This advancement is accompanied by dominant ventral-to-dorsal anagen wave spreading. (C, C’) Mapping of Flash-based anagen reveals ventral-to-dorsal hair growth wave propagation and bilateral pattern symmetry. New anagen areas for each time point are color-coded. Second anagen initiation is shown on panel C, and third anagen initiation on panel C’. Also see Appendix 1—figure 6. (D–G) Hair growth distribution patterns on P17 (D), P21 (E), P39 (F) and P55 (G). Three mice were analyzed at each time point. Inverted whole mount skin samples from representative mice are shown. Schematic pattern maps are provided with color-coded anagen (green), catagen (yellow) and telogen (red) regions. Also see Appendix 1—figures 7–12. (H, I) HF cycling dynamics in chin skin grafts remain faster compared to dorsal skin grafts. After transplantation, first anagen initiated similarly in both chin and dorsal skin grafts, however, second anagen initiated significantly faster in chin grafts. Representative chin and dorsal skin grafts are shown on (H). Combined temporal dynamics of skin grafts in anagen and telogen are shown on (I). Dorsal graft dynamics are in brown and chin graft dynamics are in blue. Temporal advancement of chin over dorsal second anagen initiation is highlighted with light blue color. Also see Appendix 1—figure 13.
Figure 4
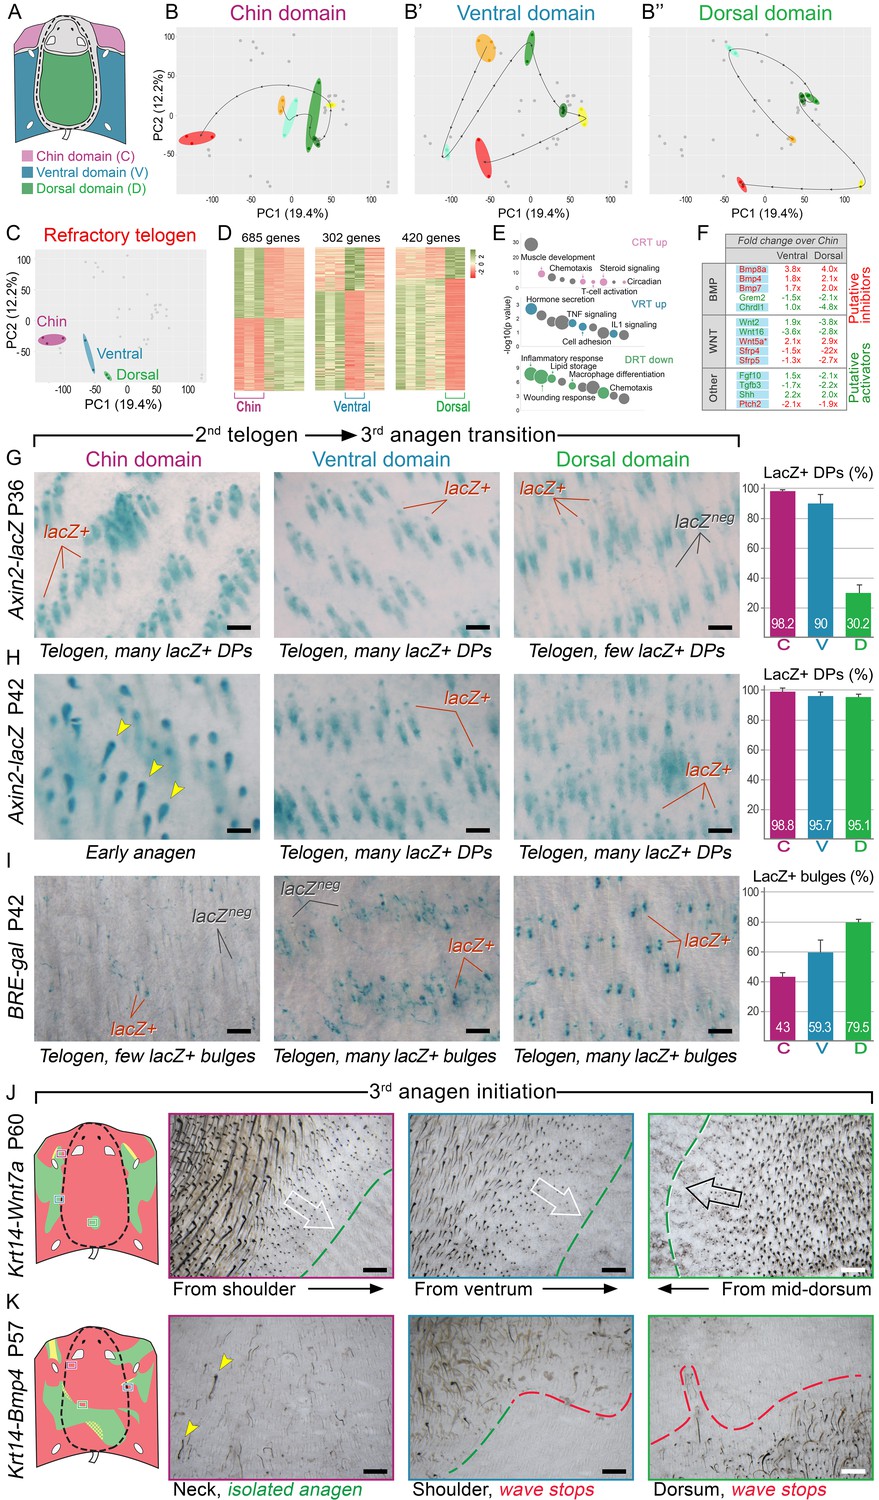
BMP and WNT signaling differences underlie regionally specific telogen phase duration.
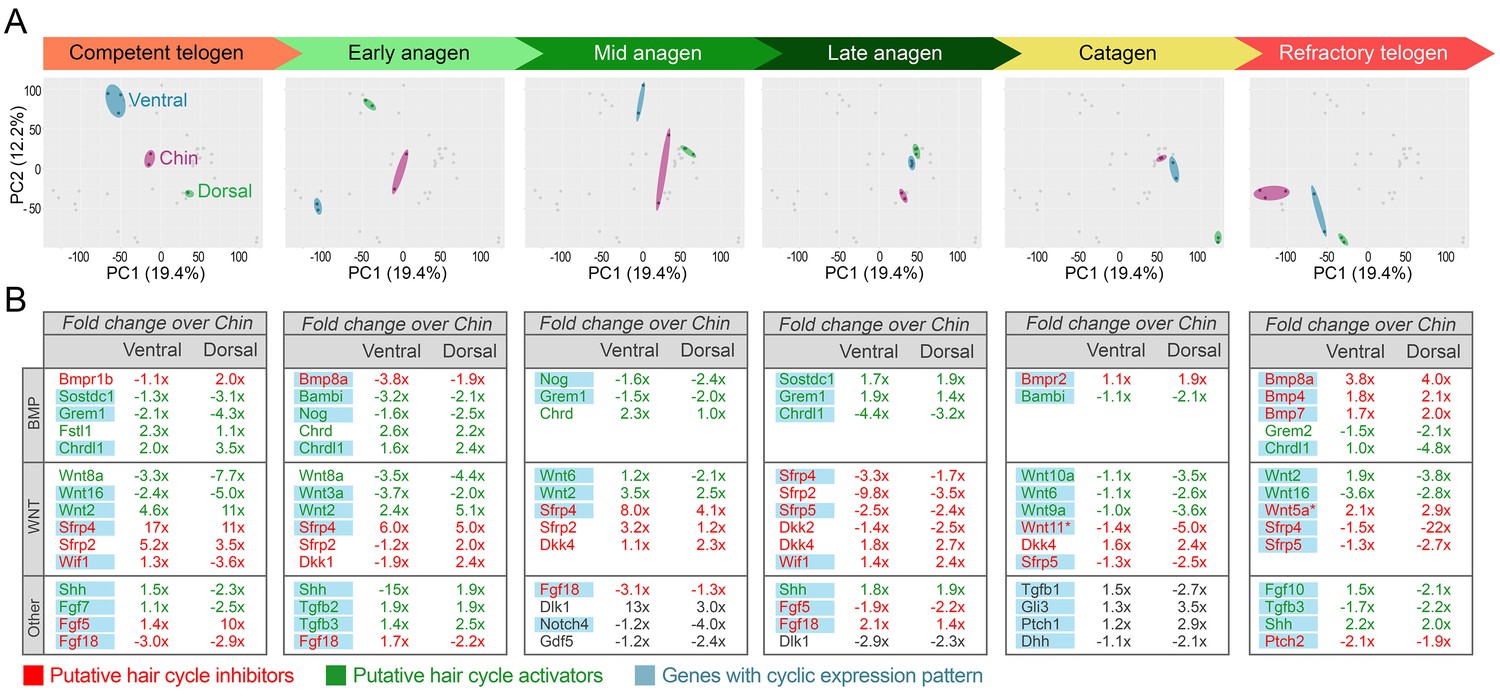
(A–B’’) PCA analysis reveals largely non-overlapping transcriptomic trajectories across six hair cycle stages in chin (B), ventral (B’) and dorsal domains (B’’). Combined, deconstructed PCA plots are shown with all data points marked as grey dots and domain-specific data points outlined and color-coded. Color-coding is based on the hair cycle timeline from Appendix 1—figure 14A; transcriptomic trajectories are drawn with dark lines. (C) Deconstructed PCA plot for refractory (early second) telogen is shown with domain-specific data points highlighted and color-coded based on the schematic drawing on A. (D–F) Analysis of refractory telogen data identified 1407 differentially expressed genes across the three domains (D), with each domain showing enrichment for distinct gene ontologies (E). Multiple putative hair cycle activator and inhibitor genes show domain-specific differential expression (F). Putative activators are in green and putative inhibitors are in red. For each gene, relative fold changes for ventral over chin and dorsal over chin expression levels are indicated. Genes that show cyclic expression patterns are highlighted with blue. See additional expression data analysis on Appendix 1—figures 14–19 and in Dataset 2. Asterisk marks non-canonical WNT ligand. (G, H) Analysis of Axin2-lacZ skin during second telogen reveals faster activation of WNT signaling in chin and ventral HFs over dorsal HFs. At P36 majority of HFs in chin and ventral skin have WNT-active DPs. In dorsal skin, the number of HFs with WNT-active DPs is low at P36, but increases by P42. (I) Analysis of P42 BRE-gal skin shows that many more dorsal HFs have BMP-active bulges as compared to chin and ventral HFs. Also see Appendix 1—figure 22. (J) Overexpression of Wnt7a results in disruption of ventral-to-dorsal hair growth wave dominance and spontaneous anagen appears in the dorsal domain at P60. (K) Overexpression of Bmp4 results in stalled ventral-to-dorsal hair growth wave spreading and patchy, asymmetric hair growth at P57. Scale bars: G-I – 200 um, J-K – 500 um.
Figure 5

Ear skin shows hyper-refractory properties with telogen arrested HFs.
(A–C) Morphogenesis and physiological cycling of ear HFs. (A) Analysis of ear tissue histology shows that developing HFs first appear on day P4, and progress toward mature anagen by P7. They enter catagen around P15 and first telogen by P17 (based on three mice for each time point). (B, C) Whole mount ear skin analyses show that ear HFs fail to enter second coordinated anagen and, instead, remain in an extended telogen. Seldom, isolated anagen HFs can be found (see P95 sample on B). Data are based on three mice for each time point. (D) HFs along medial side of the ear re-enter anagen after plucking (also see Appendix 1—figure 25). Experiment is based on five mice for each time point analyzed. Representative ear skin image and accompanying heatmap is shown. Heatmap criteria are shown at the bottom. (E) Unlike in dorsal skin (see Appendix 1—figure 27A), ear HFs poorly respond to topical SAG treatment. Anagen induction is limited to the medial edge of the ear. (F) Unlike in dorsal skin (see Appendix 1—figure 27B), ear HFs fail to re-enter anagen in response to topical cyclosporin A treatment. Experiments on E and F are based on three mice for each time point analyzed. Representative ear skin images and accompanying heatmaps are shown. Scale bars: A – 100 um.
Figure 6
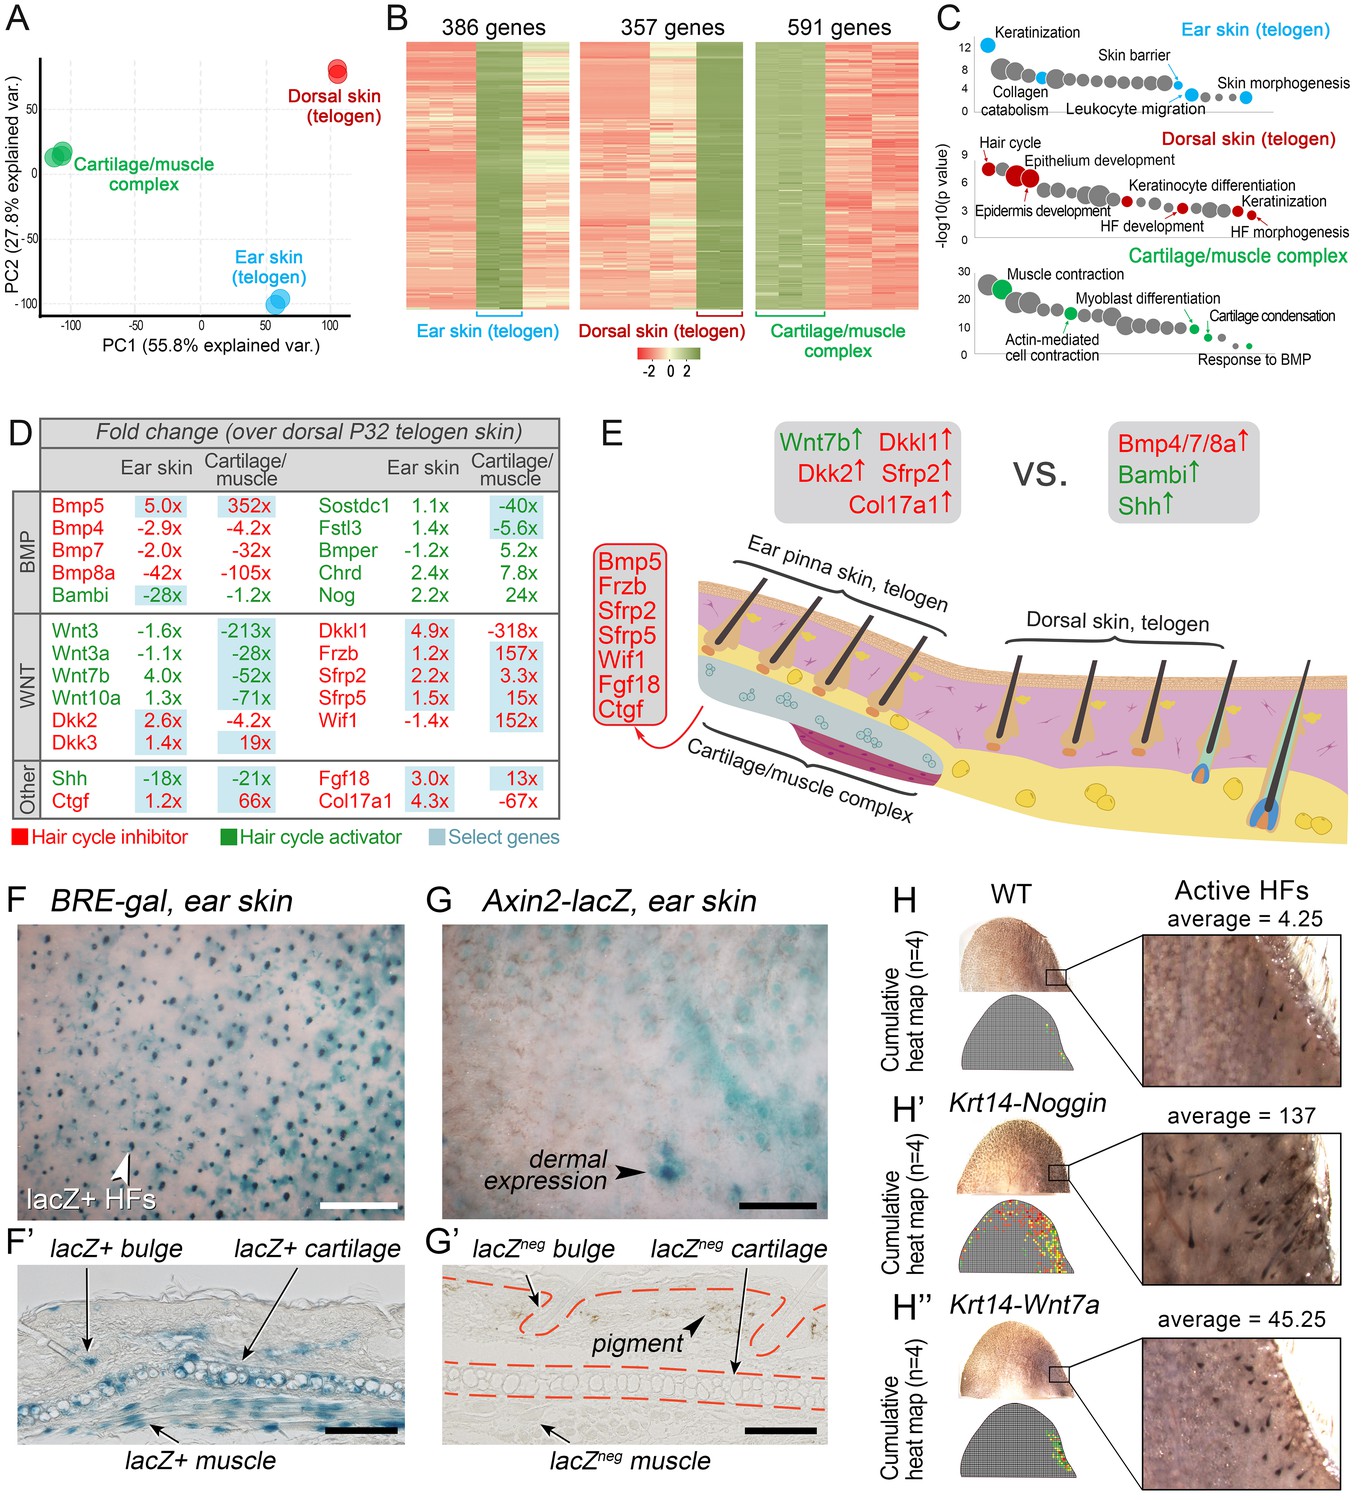
WNT and BMP signalings modulate ear HF hyper-refractory state.
(A–C) Transcriptomes of first telogen ear skin, first telogen dorsal skin and ear cartilage/muscle complex are distinct, as revealed by PCA analysis (A). They contain 1334 differentially expressed genes (B), spanning distinct gene ontologies (C). (D, E) These tissues show differential expression of multiple ligands and antagonists for several major signaling pathways, prominently WNT and BMP. Putative activators are in green and putative inhibitors are in red. For each gene, relative fold changes for ear skin over dorsal skin and cartilage/muscle complex over dorsal skin expression levels are indicated. Select genes are highlighted. (F, F’) BRE-gal reporter reveals high BMP activity in telogen ear HFs and in the adjacent cartilage/muscle complex (n = 8). (G, G’) Axin2-lacZ reporter reveals near absence of WNT activity in ear HFs and cartilage/muscle complex. Seldom, sites of dermal reporter activity can be found (n = 8). (H–H’’) Compared to wild type mice (n = 4) (H), ears of Krt14-Noggin (n = 4) (H’) and Krt14-Wnt7a mice (n = 4) (H’’) show prominent increases in spontaneous anagen frequency. Cumulative heatmaps from four individual ear samples are shown. Also see Appendix 1—figure 28. Scale bars: F, G – 500 um; F’, G’ – 100 um.
Figure 7
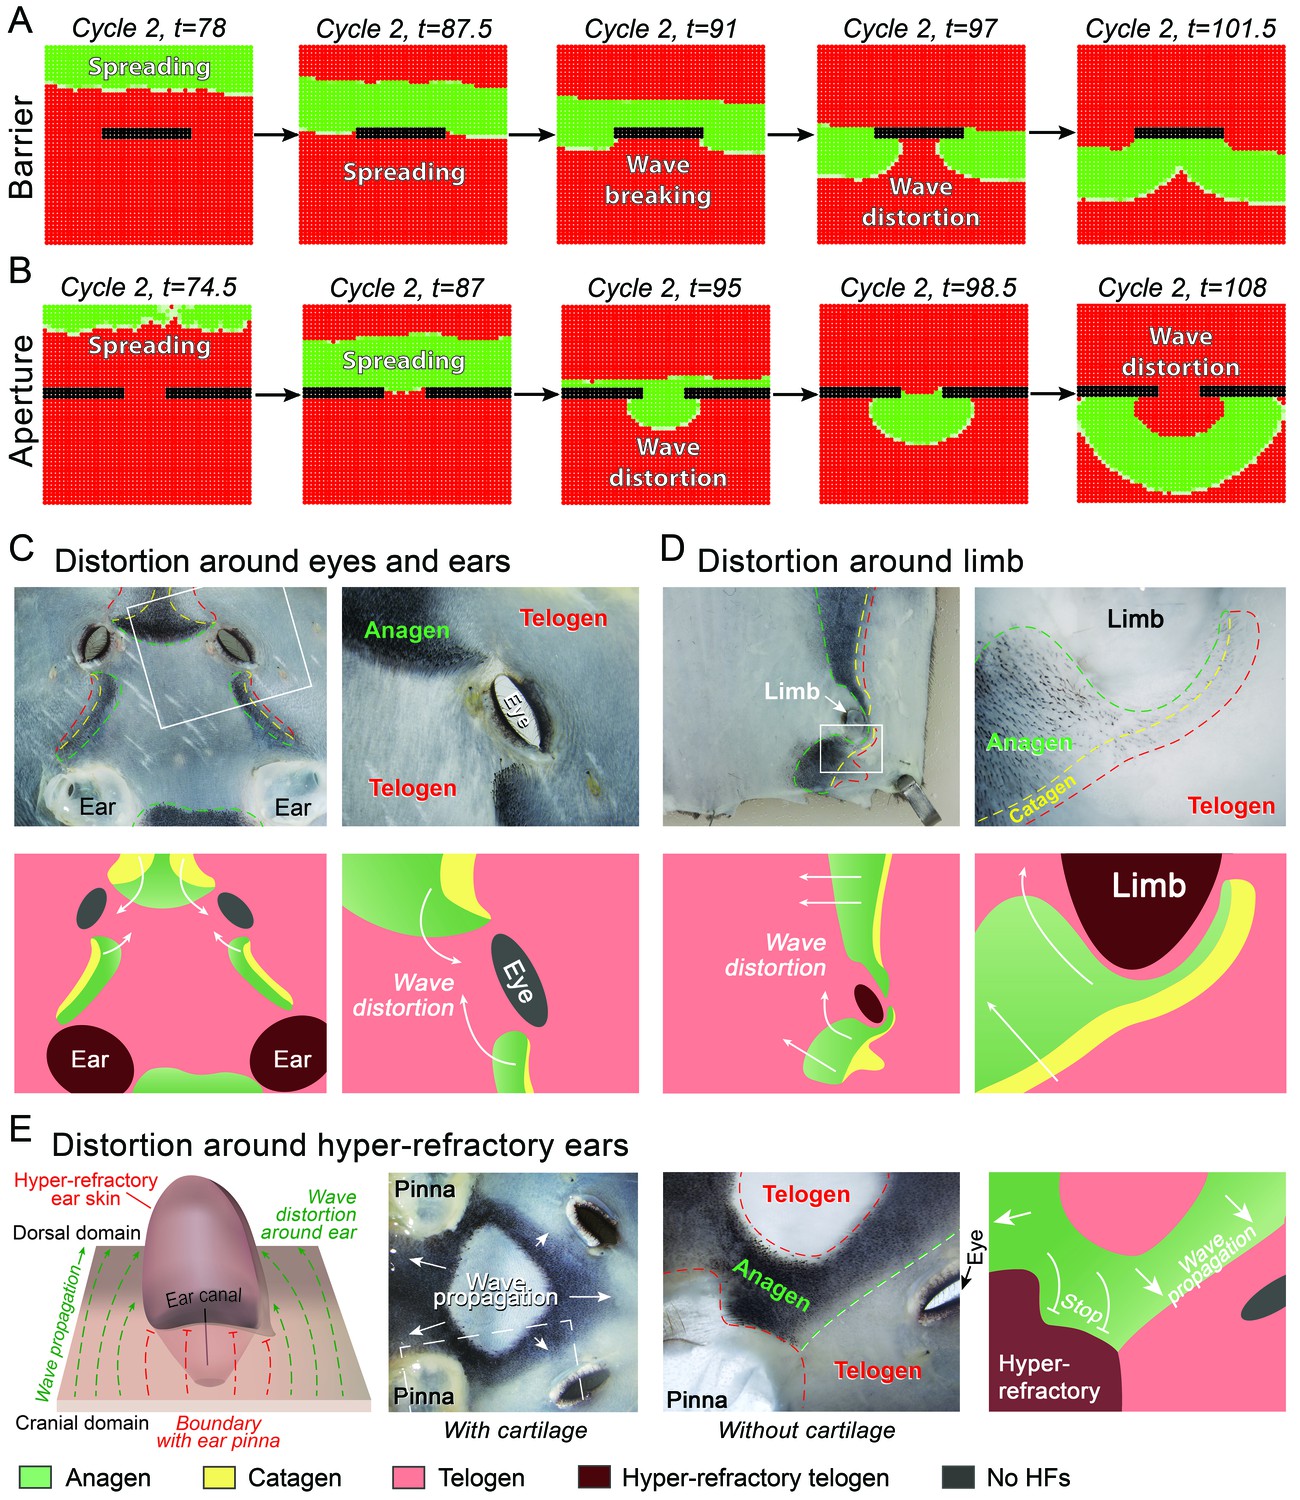
Hair growth waves distort at the non-propagating boundaries.
(A, B) Introduction of a non-propagating barrier (A) or an aperture (B) into the model produces simulations with distorted anagen spreading wave front (green). (C, E) Distortions in the geometry of hair growth waves are commonly seen in the head region at the boundaries with the hyper-refractory ears and eyelids, the physical breaks in the skin. Seldom, similar distorted patterns can be seen around limb skin (D). Hair growth patterns on C-E are accompanied by color-coded schematic drawings. Colors are defined at the bottom. Hair growth distortion patterns shown were documented in ten mice each.
Appendix 1—figure 1
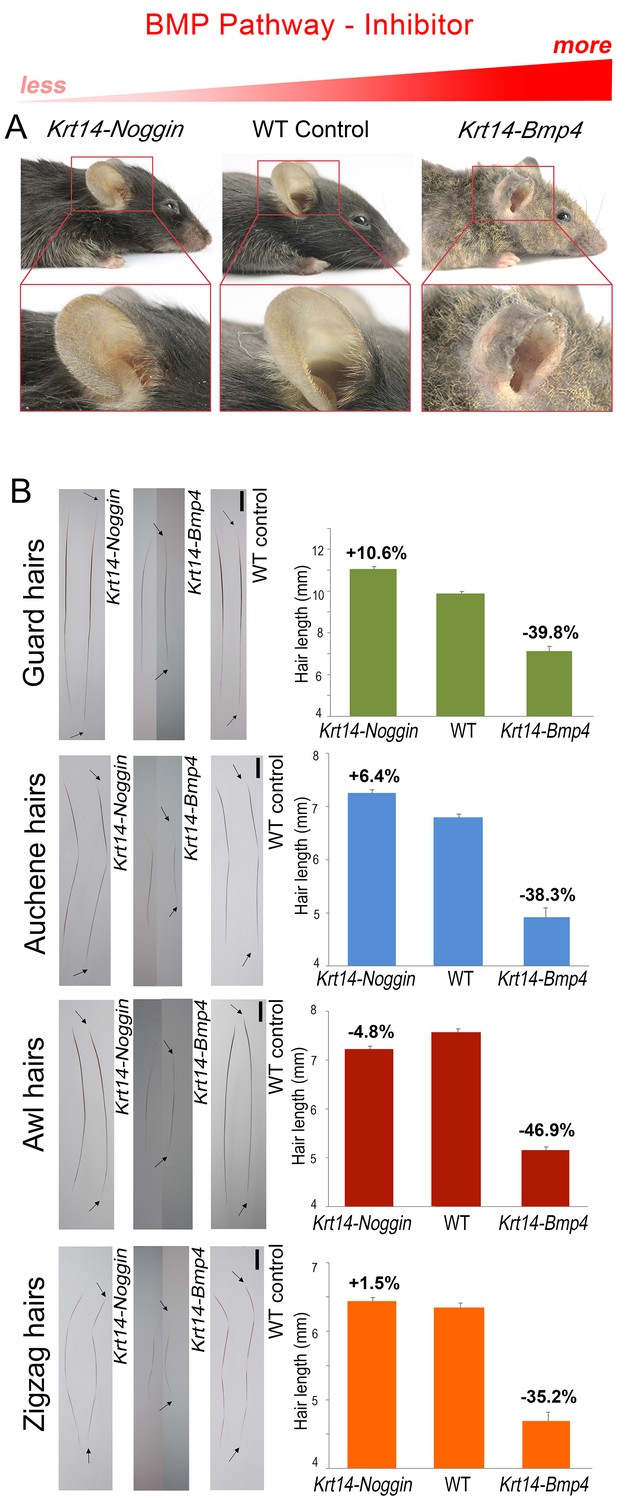
BMP changes affect hair length.
Grossly, Krt14-Noggin mice display longer than normal pelage (A). In contrast, Krt14-Bmp4 mice display generalized pelage shortening. Also see Appendix 1—figure 2. (B) Compared to control, hairs are longer in Krt14-Noggin and shorter in Krt14-Bmp4 mutants. Krt14-Noggin hairs lengthen by up to ~12%, while Krt14-Bmp4 hairs shorten by 35–46%. Arrows mark hair ends. Scale bars: B – 1 mm. Images on B are composites.
Appendix 1—figure 2

Changes in BMP signaling result in morphological pelage length defects.
Compared to control, Krt14-Noggin mice display generalized increase in pelage length, prominently on the tail and paws. Note fused paws, short digits, lack of claws and polydactyly, phenotypes that were reported previously. Krt14-Bmp4 mice display visibly short pelage, patches of prominent thinning on the trunk, as well as short hairs on the tail and paws. Also note other paw defects, longer digits and long, curved claws.
Appendix 1—figure 3

BMP modulates anagen phase duration.
Repression and activation of inhibitory BMP leads to increased and decreased anagen duration, respectively. Histologically, day P19 Krt14-Noggin mice display delayed (A), while day P15 Krt14-Bmp4 mice show premature anagen termination (B). Scale bars: A, B – 1 mm (whole mount) and 200 um (histology).
Appendix 1—figure 4
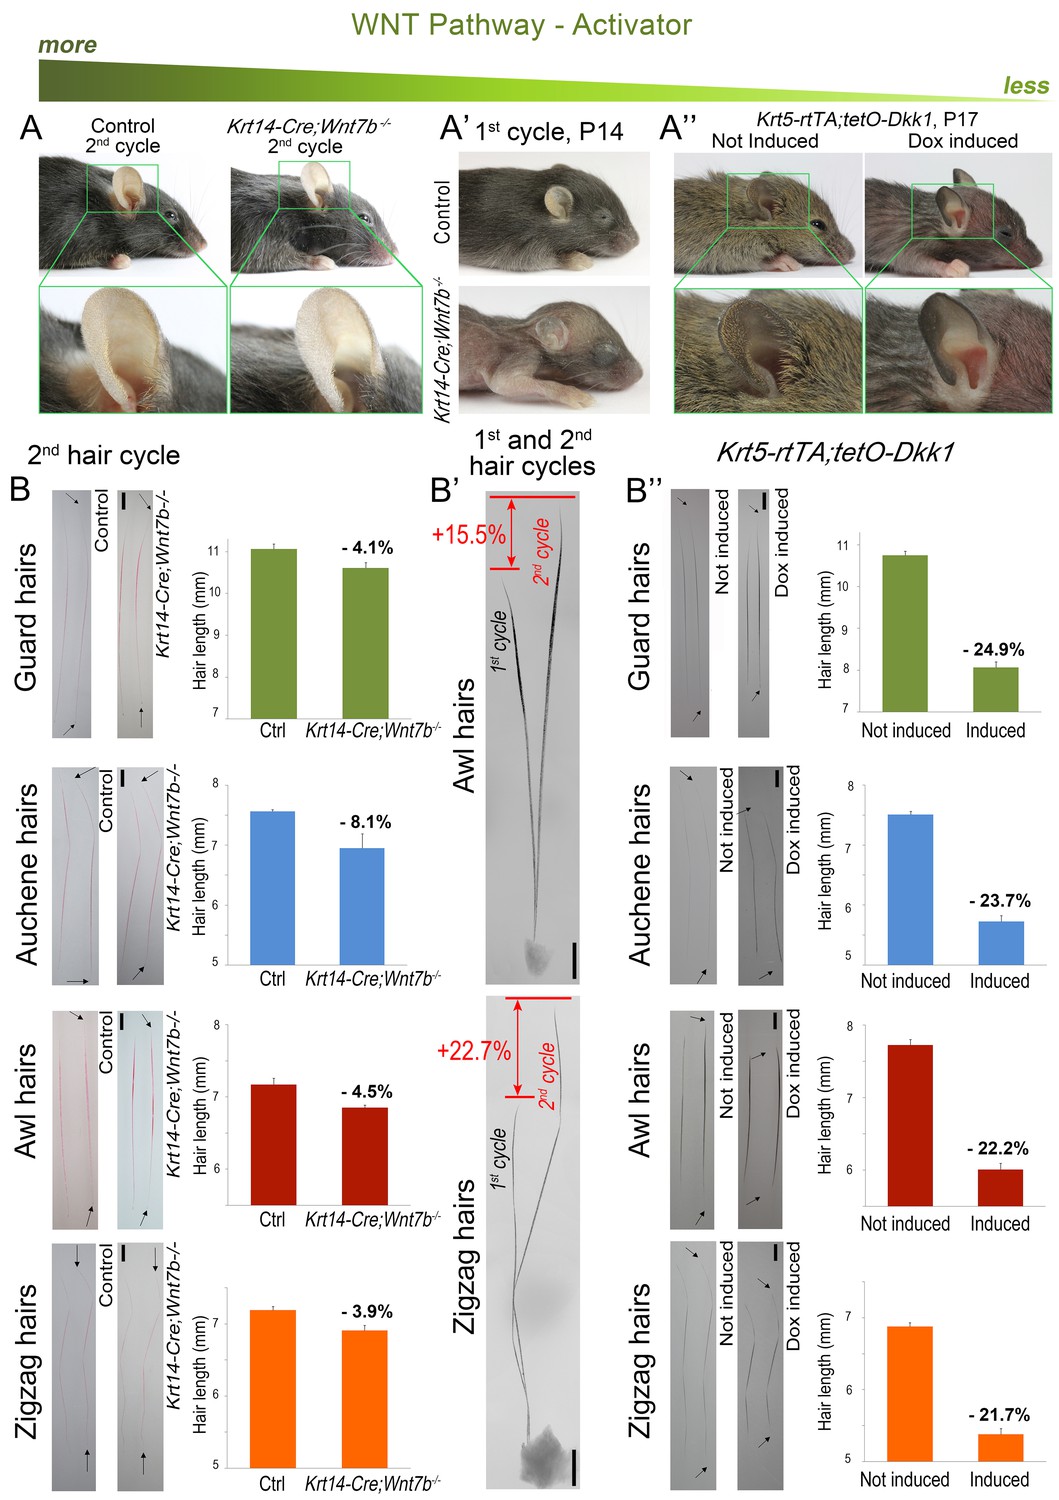
Downregulation of WNT leads to hair length shortening.
Krt14-Cre;Wnt7bfl/fl mice display prominent pelage shortening during the first cycle (A’), which then becomes largely restored during the second cycle (A). Indeed, second cycle hairs in the same mutant HFs are ~15–23% longer than first cycle hairs (B’). Note that hairs on B) were dyed red. In Krt5-rtTA;tetO-Dkk1 mice, induction of Dkk1 results in prominent pelage shortening (A’’) and individual hair shorten by 22–25% as compared to non-induced control (B’’). Scale bars: B-B’’ – 1 mm. Images on B-B’’ are composites.
Appendix 1—figure 5
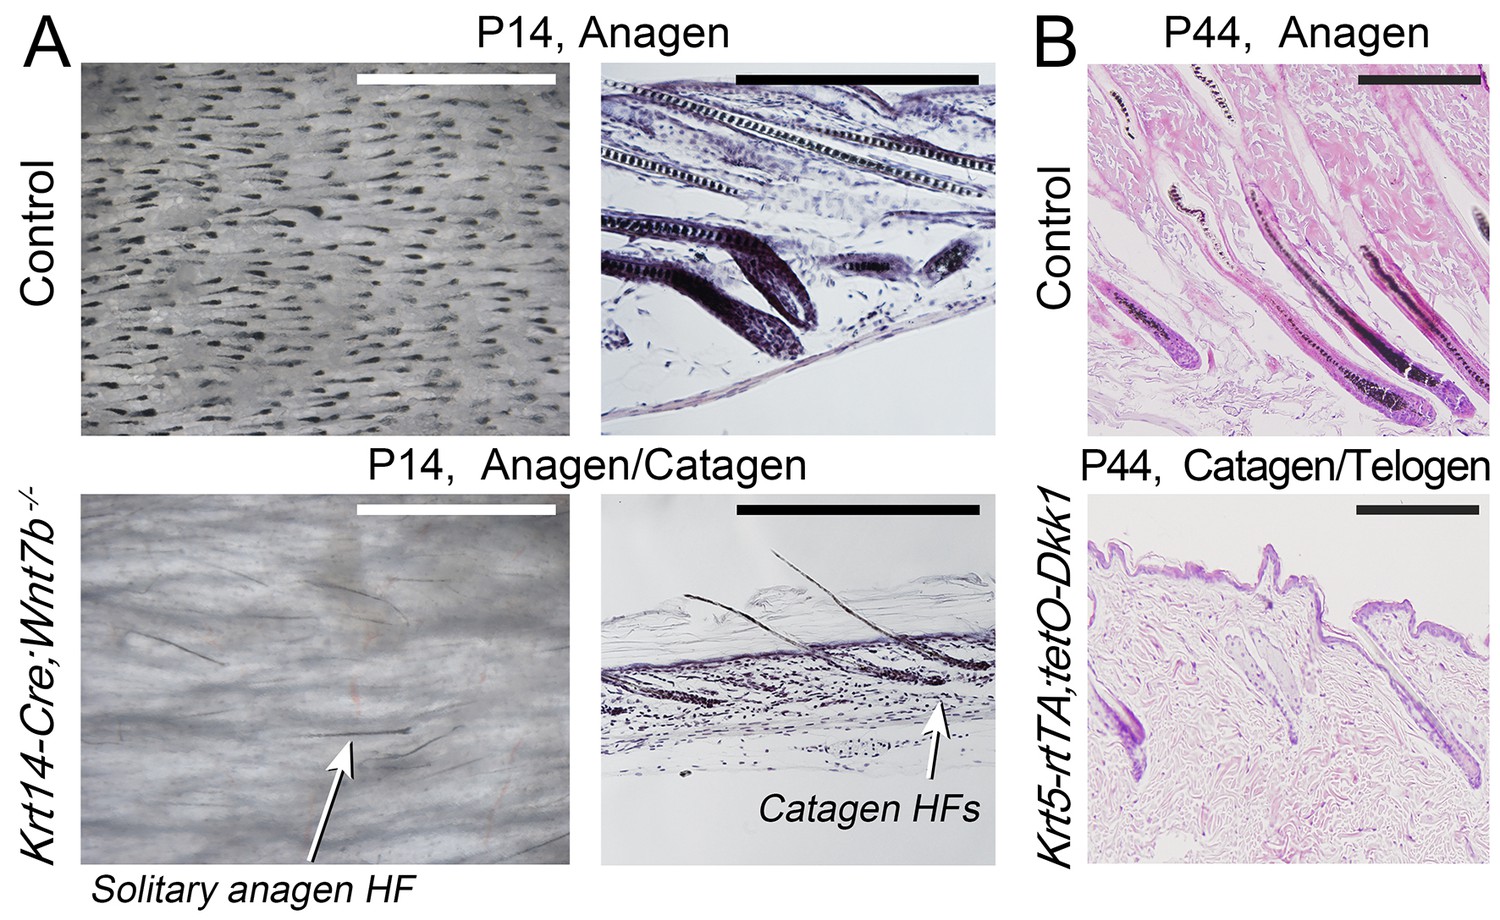
Downregulation of WNT leads to decreased anagen phase duration.
Histologically, day P14 Krt14-Cre;Wnt7bfl/fl mice (A) and induced day P44 Krt5-rtTA;tetO-Dkk1 mice (B) display premature anagen termination. Scale bars: A – 1 mm (whole mount), A, B – 200 um (histology).
Appendix 1—figure 6
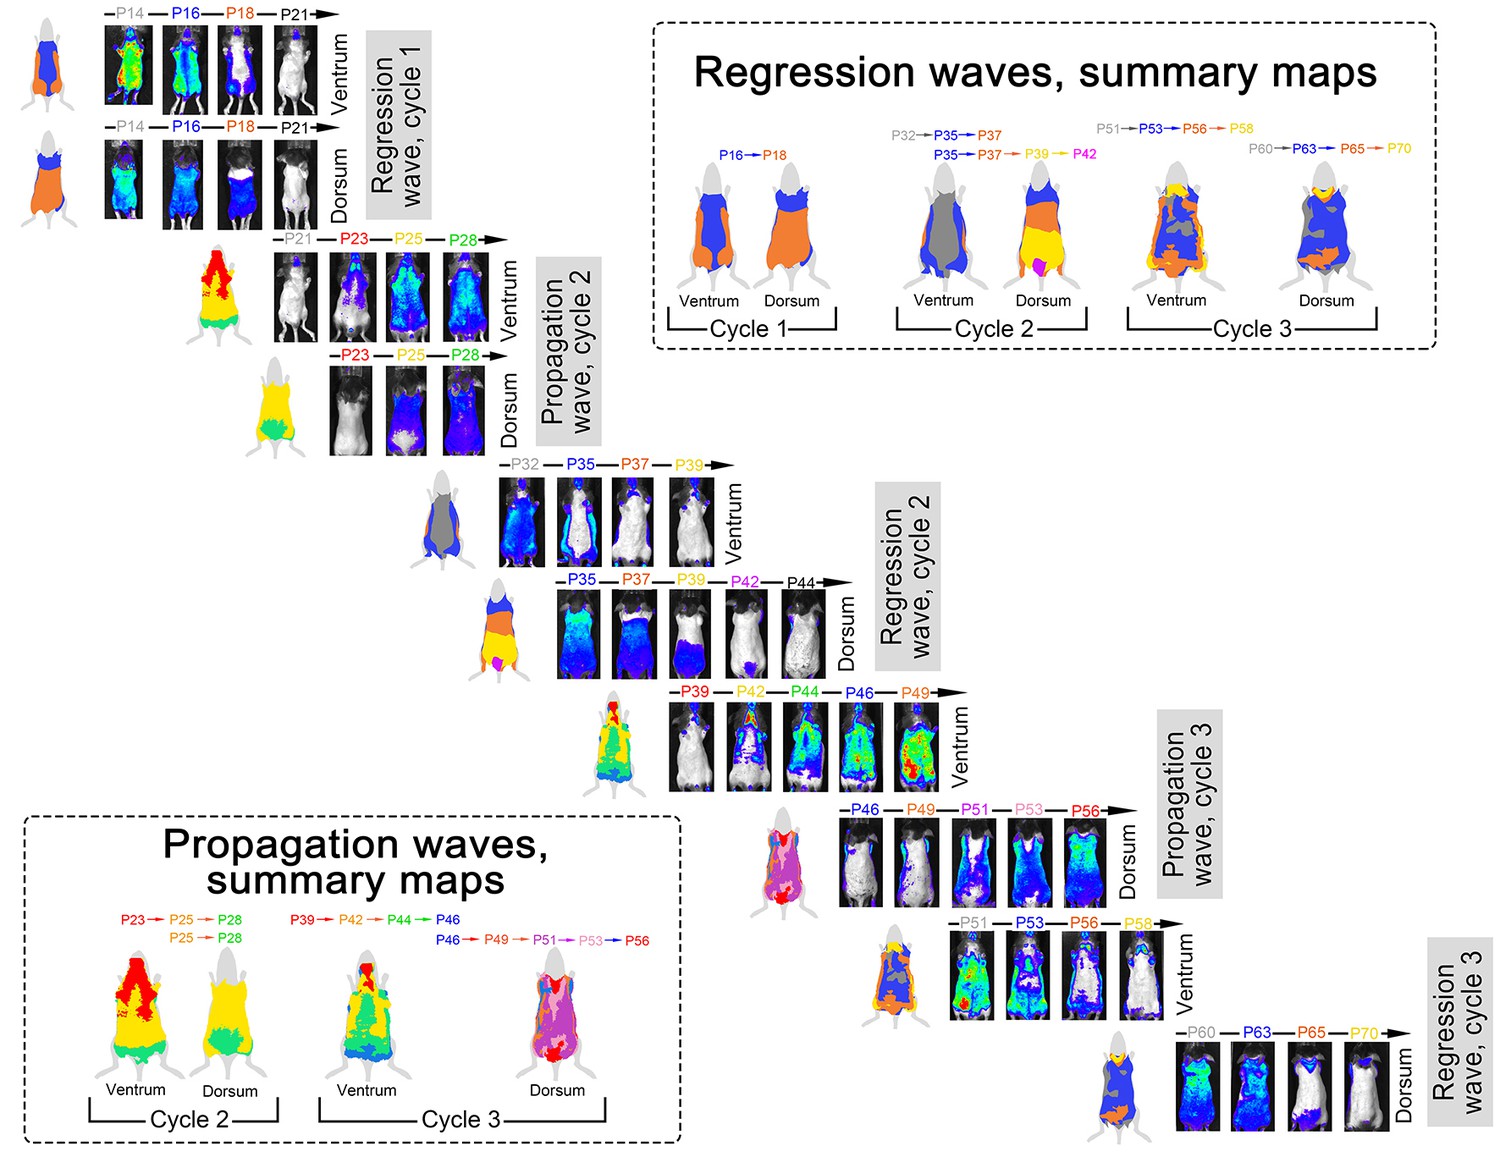
Spatial luminescence signal mapping across hair cycles.
Spatial maps of the luminescence signal in individual Flash mouse across three consecutive hair cycles are shown. Luminescence signal is represented as a ‘heatmap’ ranging from low (blue) to strong (red). For each time point, both ventral and dorsal views of the animal are provided. Images are grouped into two types of sets: (i) ‘propagation waves’, which show telogen-to-anagen wave spreading and (ii) ‘regression waves’, which show anagen-to-catagen-to-telogen wave spreading. During each hair cycle, both propagation and regression waves demonstrate notable temporal phase advancement in the ventral as compared to dorsal skin. Also see main Figure 3.
Appendix 1—figure 7
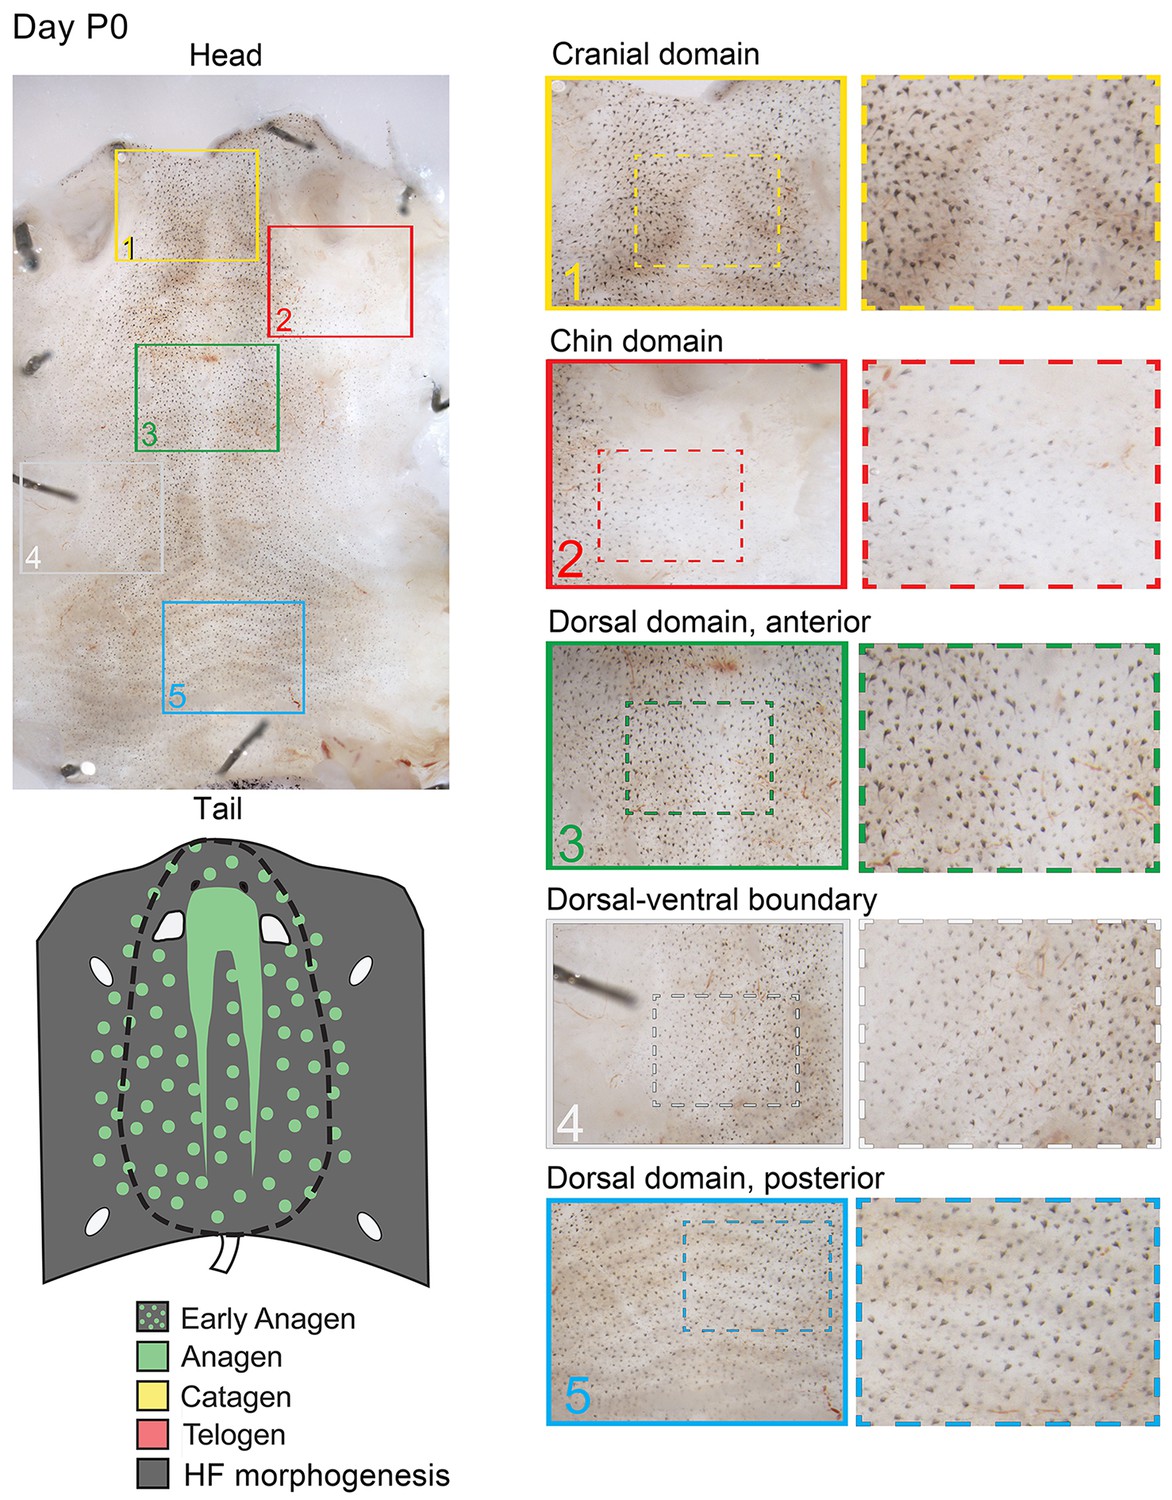
Distribution of the hair cycle stages in P0 mouse skin.
Day P0 skin displays prominent spatial distribution of anagen HFs (based on macroscopic evaluation of HF pigmentation). Prominent patterning features at this stage include: (a) head-to-tail anagen phase advancement in the dorsal skin (compare insert 1 with insert 5) and (b) dorsal-to-ventral anagen phase advancement reflective of the temporary delayed HF morphogenesis in the ventral skin (compare insert 2 and 4 with inserts 1 and 3). See main Figure 2A–2D for further details.
Appendix 1—figure 8
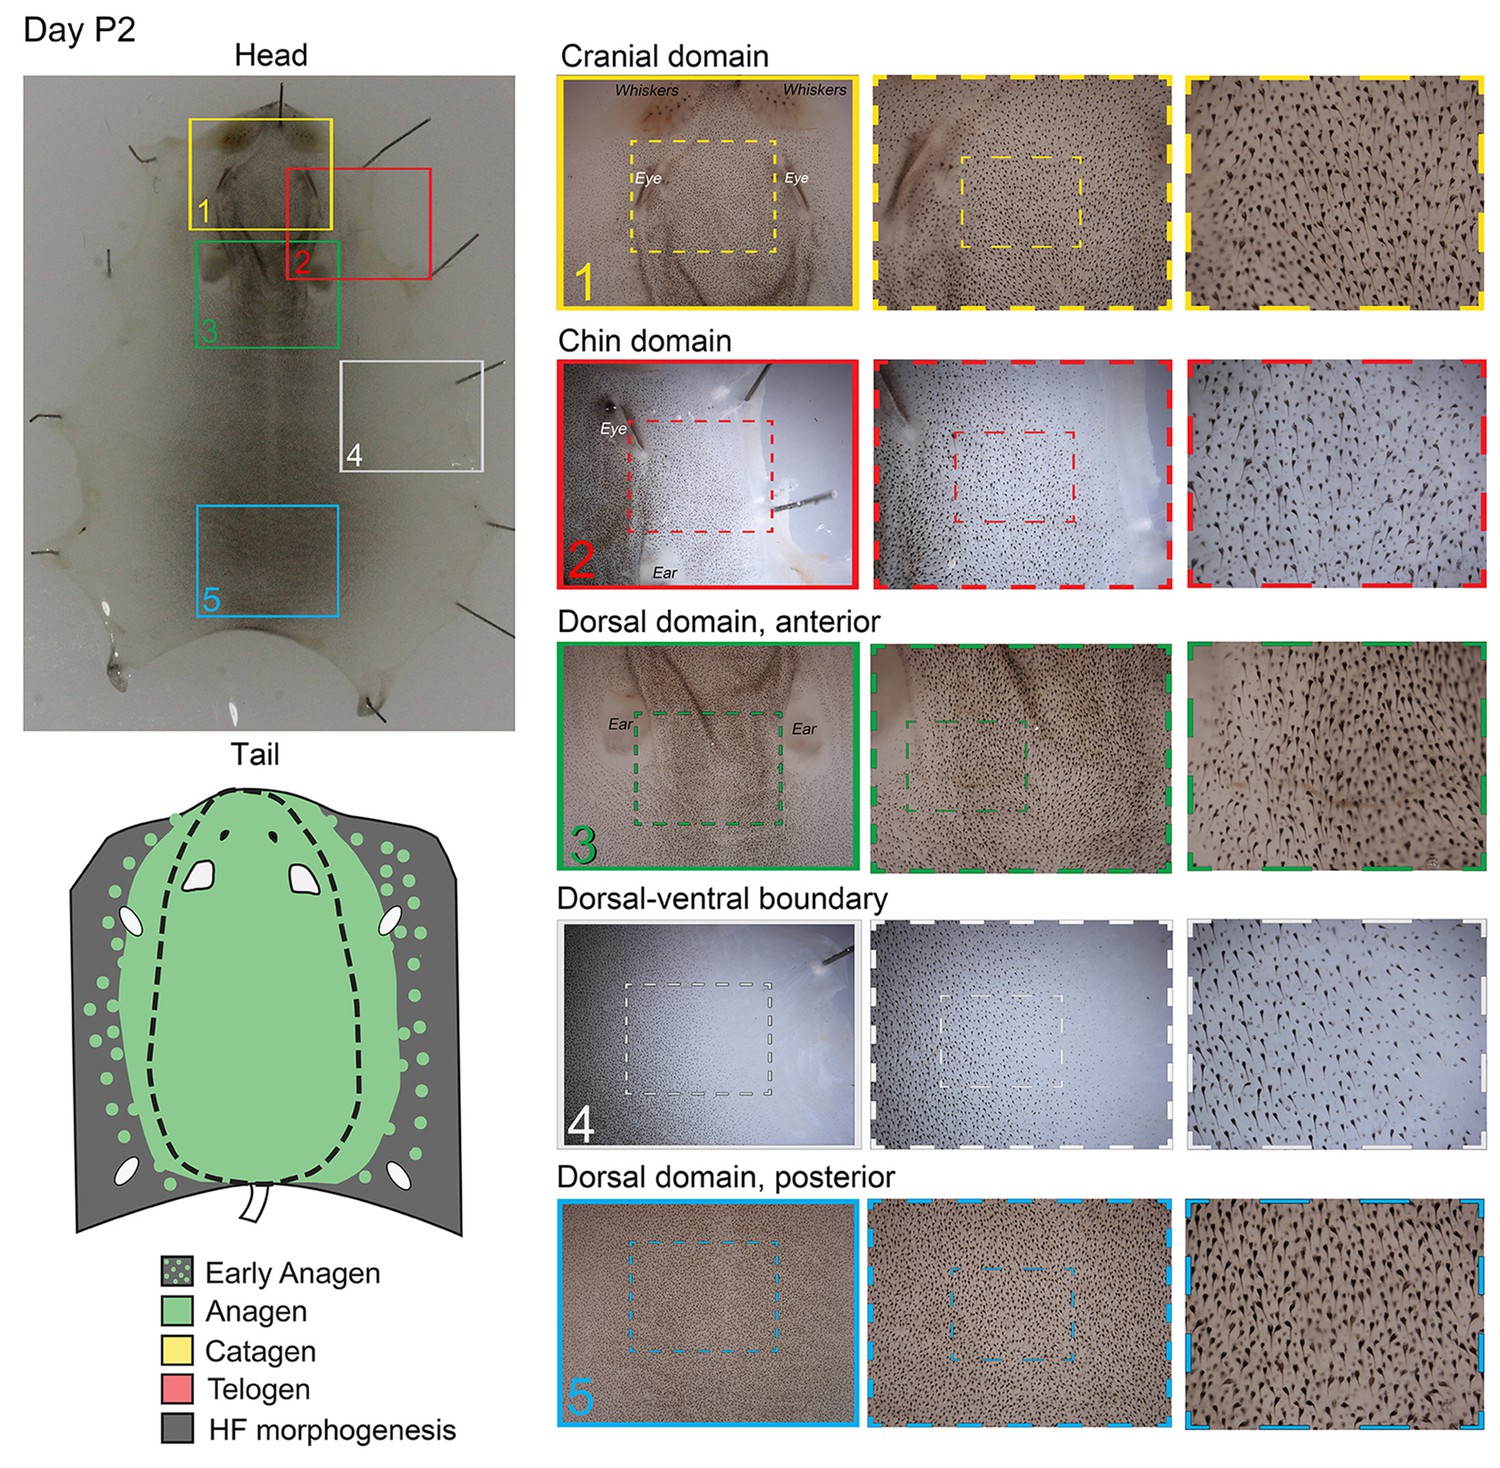
Distribution of the hair cycle stages in P2 mouse skin.
On day P2, initial head-to-tail hair cycle asynchrony in the dorsal skin becomes less prominent, while dorsal-to-ventral hair cycle asynchrony is maintained (inserts 2 and 4).
Appendix 1—figure 9
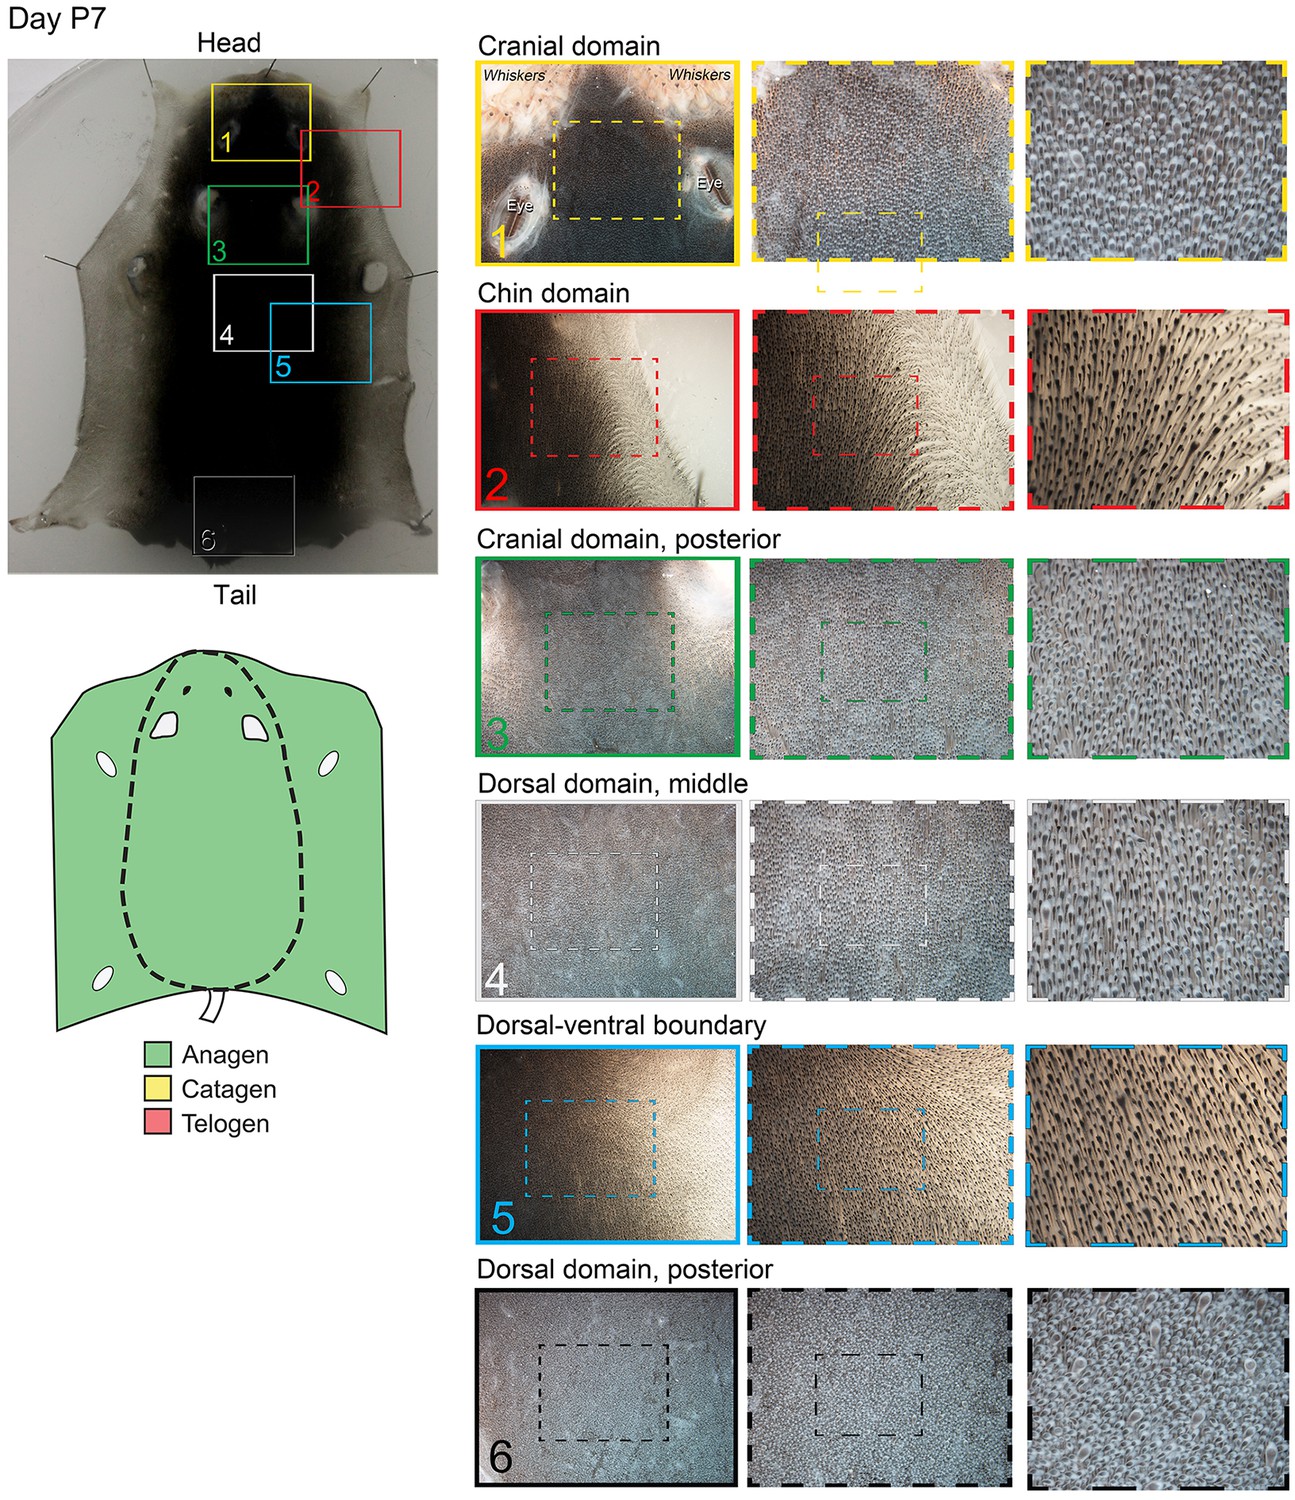
Distribution of the hair cycle stages in P7 mouse skin.
By day P7, HFs in both dorsal and ventral skin are in mature anagen.
Appendix 1—figure 10
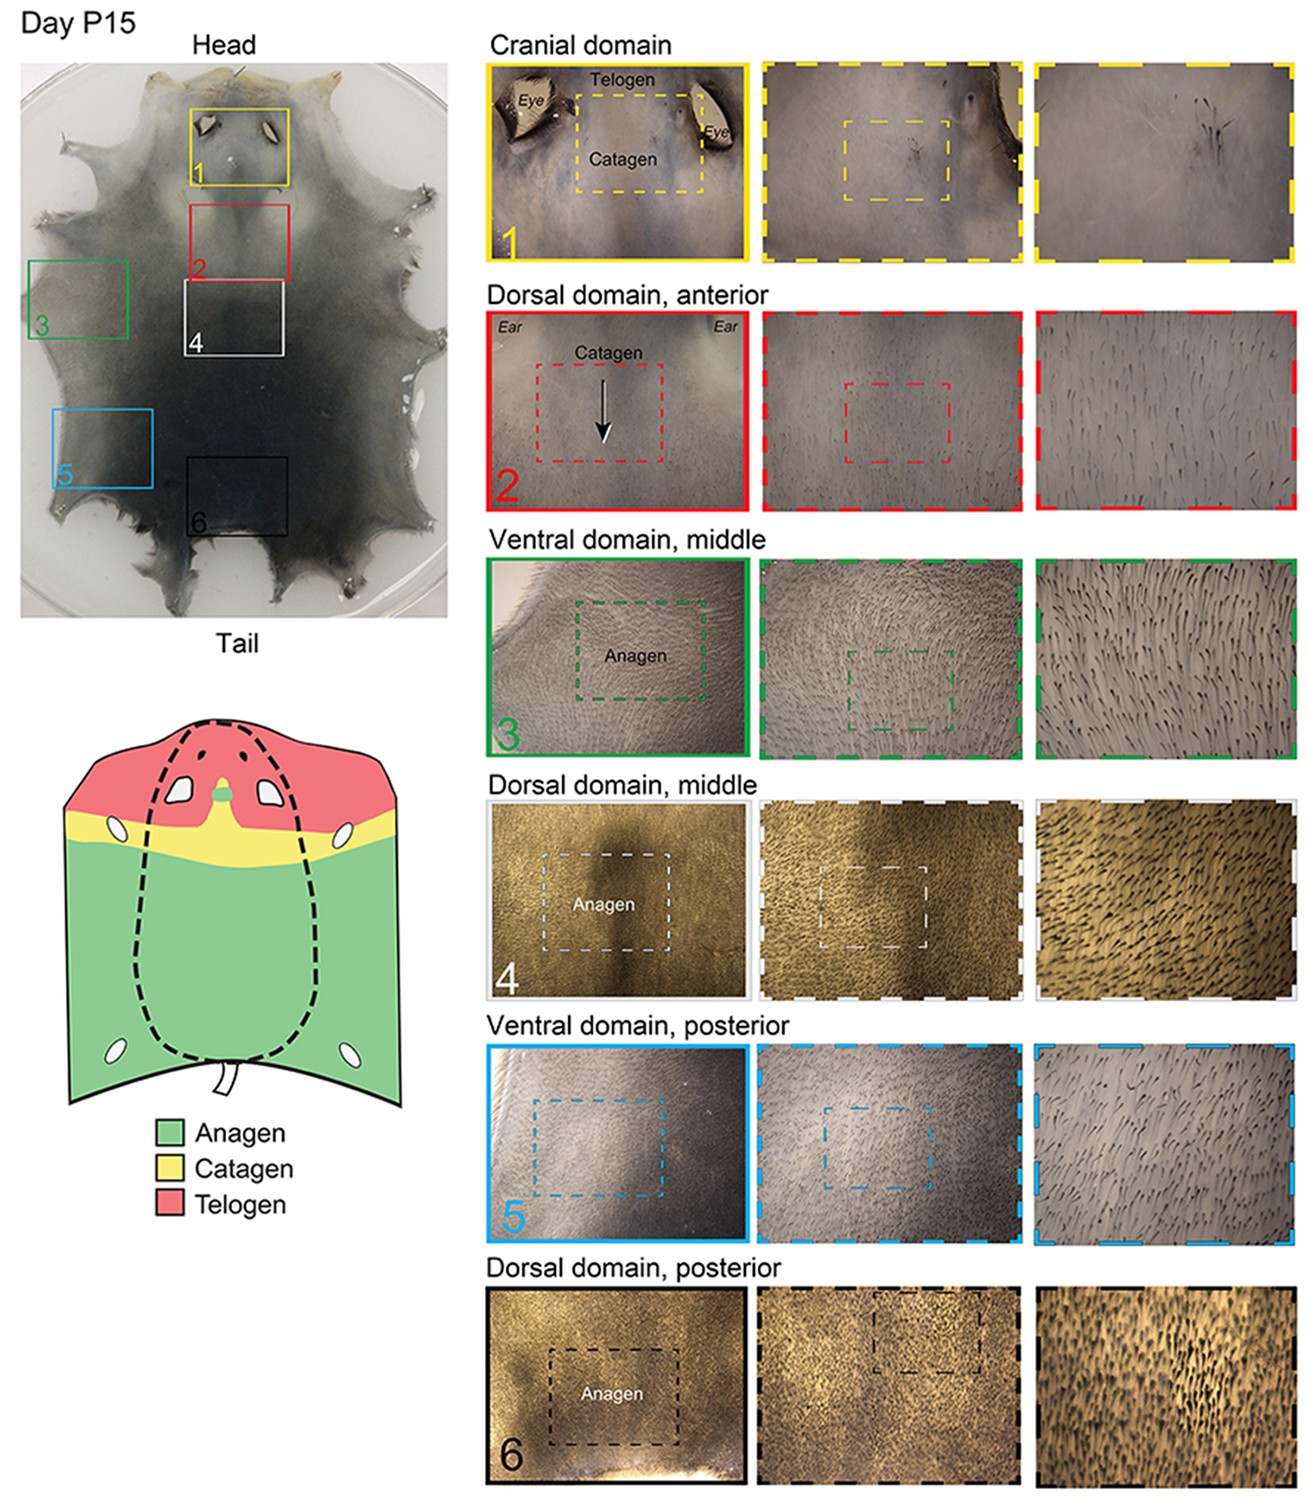
Distribution of hair cycle stages in P15 mouse skin.
By day P15, HFs in the chin domain and most of the cranial domain undergo catagen-to-telogen transition, whereas HFs in the dorsal and ventral domains are in anagen. At this time, mouse-to-mouse pattern variability starts to become prominent, with more or less (as compared to the example pattern shown here) of the chin and cranial domains having transitioned to telogen.
Appendix 1—figure 11
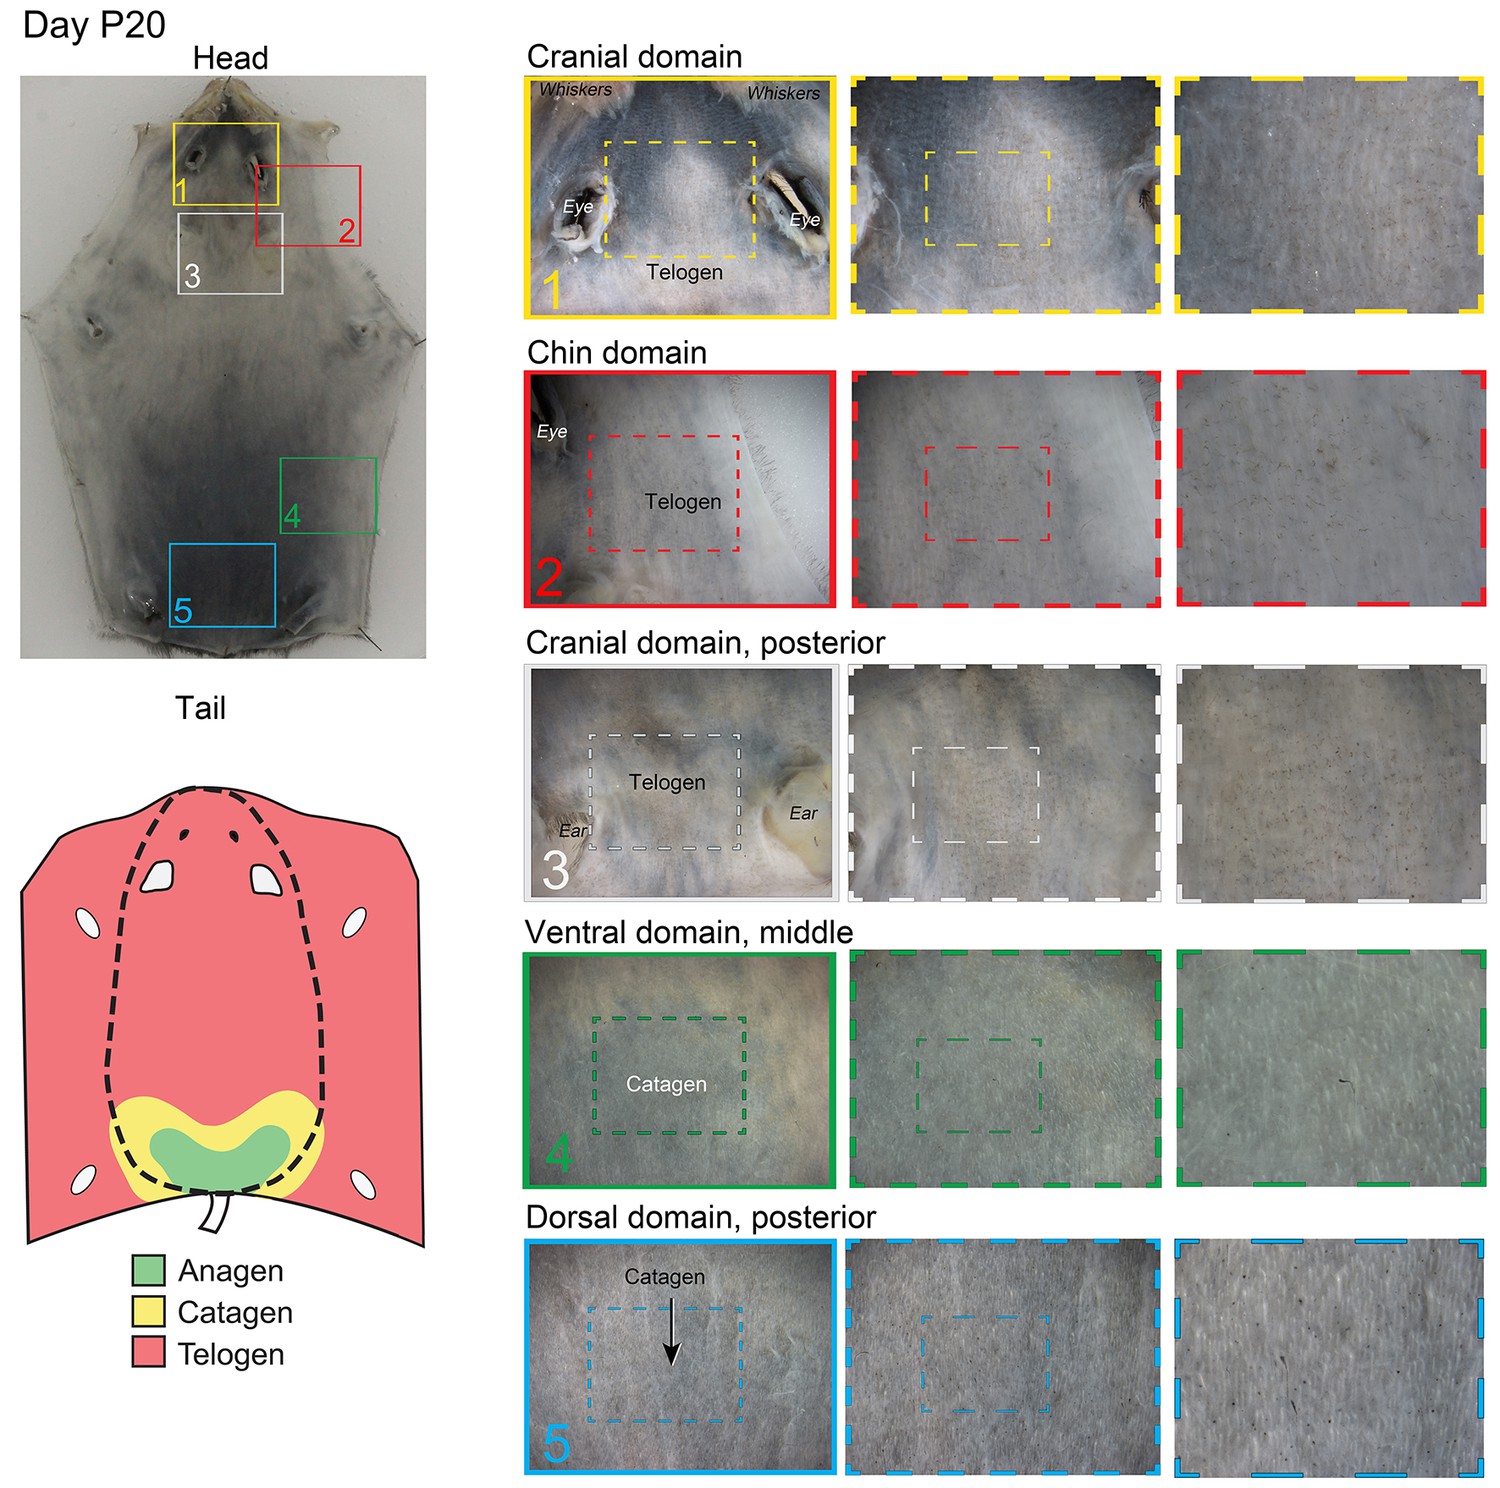
Distribution of the hair cycle stages in P20 mouse skin.
By day P20, all but the most posterior portion of the dorsal domain HFs (insert 5) progressed into the first telogen.
Appendix 1—figure 12
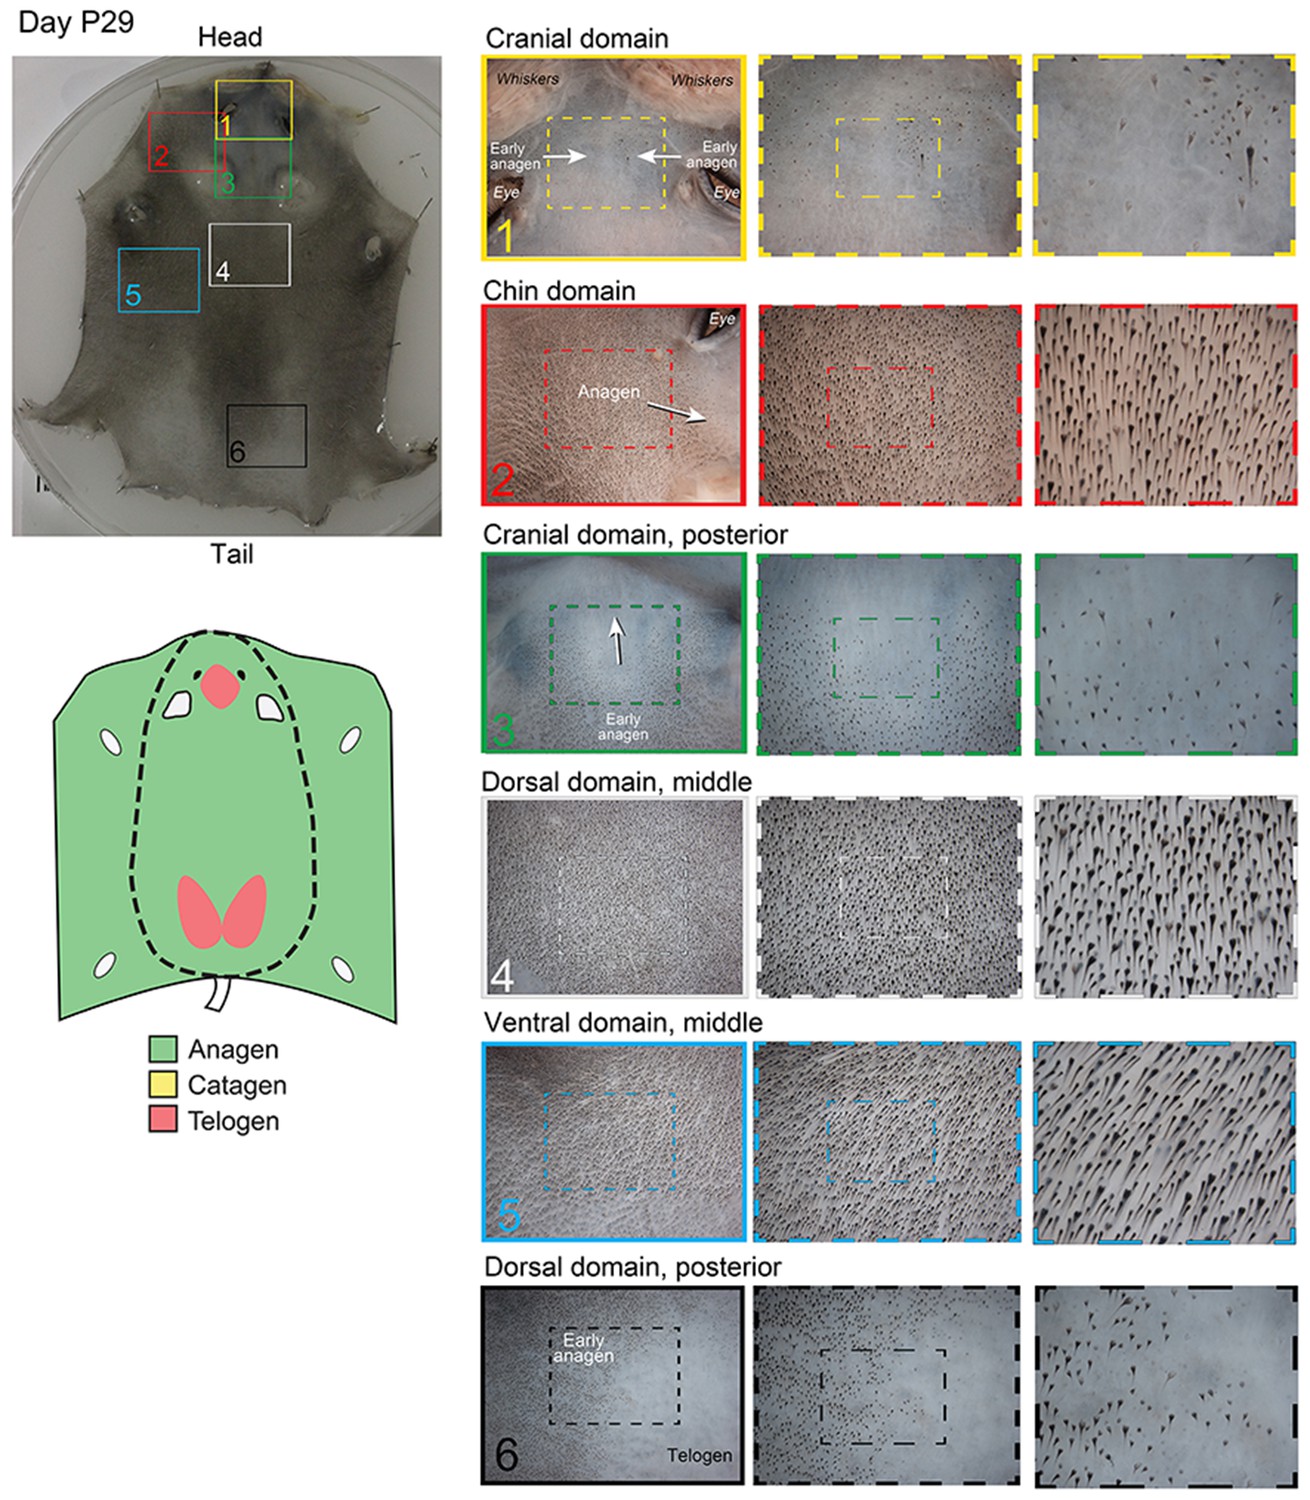
Distribution of the hair cycle stages in P29 mouse skin.
By day P29, all ventral and most of the dorsal skin is in second anagen. One prominent exception is the cranial domain, situated in the space between eyes and ears, which at this time is still in the first telogen (insert 1). In some cases (as in the skin sample shown here), small regions of skin in the most posterior portion of the dorsal domain are also in the first telogen (insert 6).
Appendix 1—figure 13
Hair growth cycle dynamics in skin grafts.
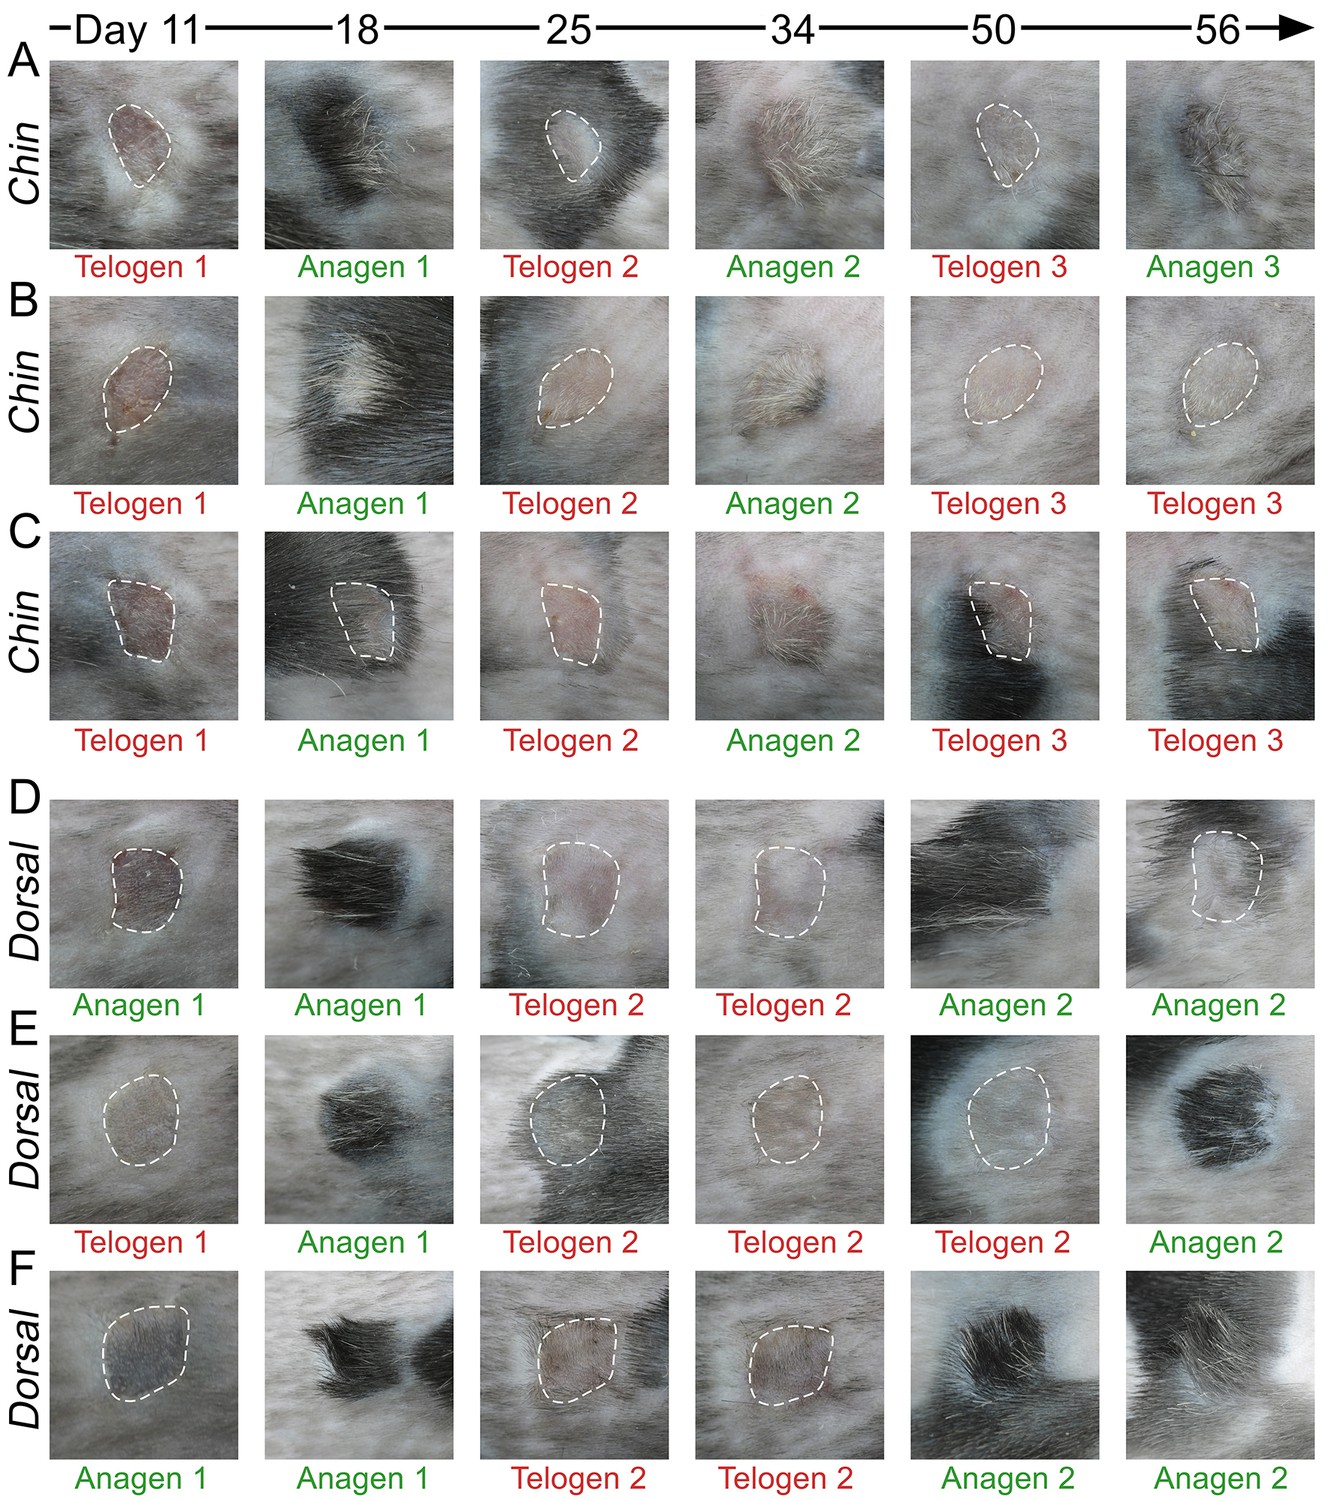
Upon grafting onto the dorsum of pigmented SCID host mice, WT chin skin grafts (A–C) cycle faster compared to WT dorsal skin grafts (D–F). While first post-transplantation anagen starts similarly in both graft types, second anagen starts substantially faster in chin grafts. Grafts in telogen are outlined.
Appendix 1—figure 14
Domain-specific transcriptomic dynamics during hair cycle.
(A) PCA analysis reveals largely non-overlapping transcriptomic trajectories across six hair cycle stages in chin (purple), ventral (blue) and dorsal domains (green). Deconstructed PCA plots are shown with all data points marked as grey dots and domain-specific data points highlighted for each of the six hair cycle stages. (B) Multiple putative hair cycle activator and inhibitor genes show domain-specific differential expression at each hair cycle stage. Putative activators are in green and putative inhibitors are in red. For each gene, relative fold changes for ventral over chin and dorsal over chin expression levels are indicated. Genes that show cyclic expression patterns are highlighted in blue.
Appendix 1—figure 15
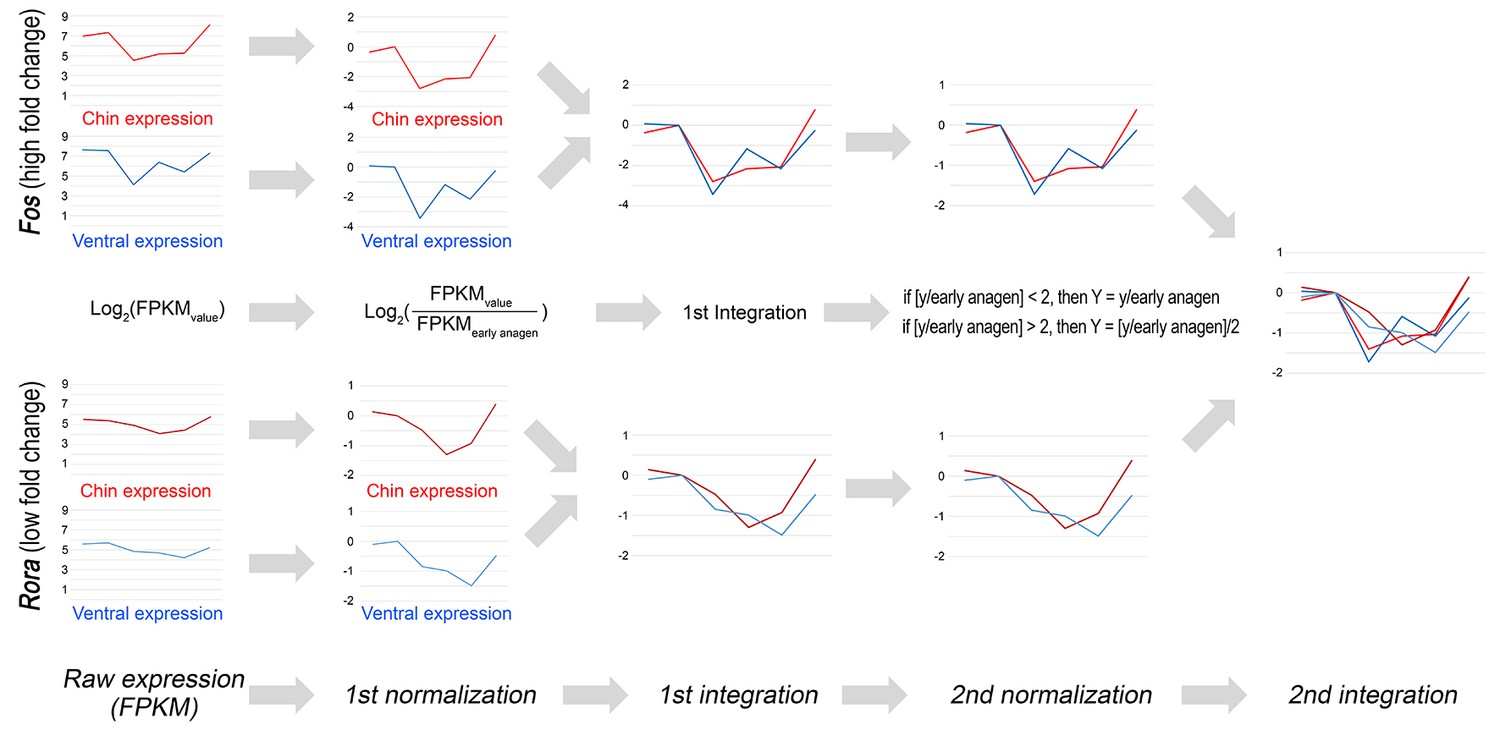
Double-normalized fold change calculation algorithm for RNA-seq data.
Double-normalized fold change on Appendix 1—figures 17–19 was calculated as follows: if [y/EA] <2, then Y = y/EA if [y/EA] >2, then Y = [y/EA]/2, where EA is gene expression value for early anagen.
Appendix 1—figure 16
Putative hair cycle activator and inhibitor genes.
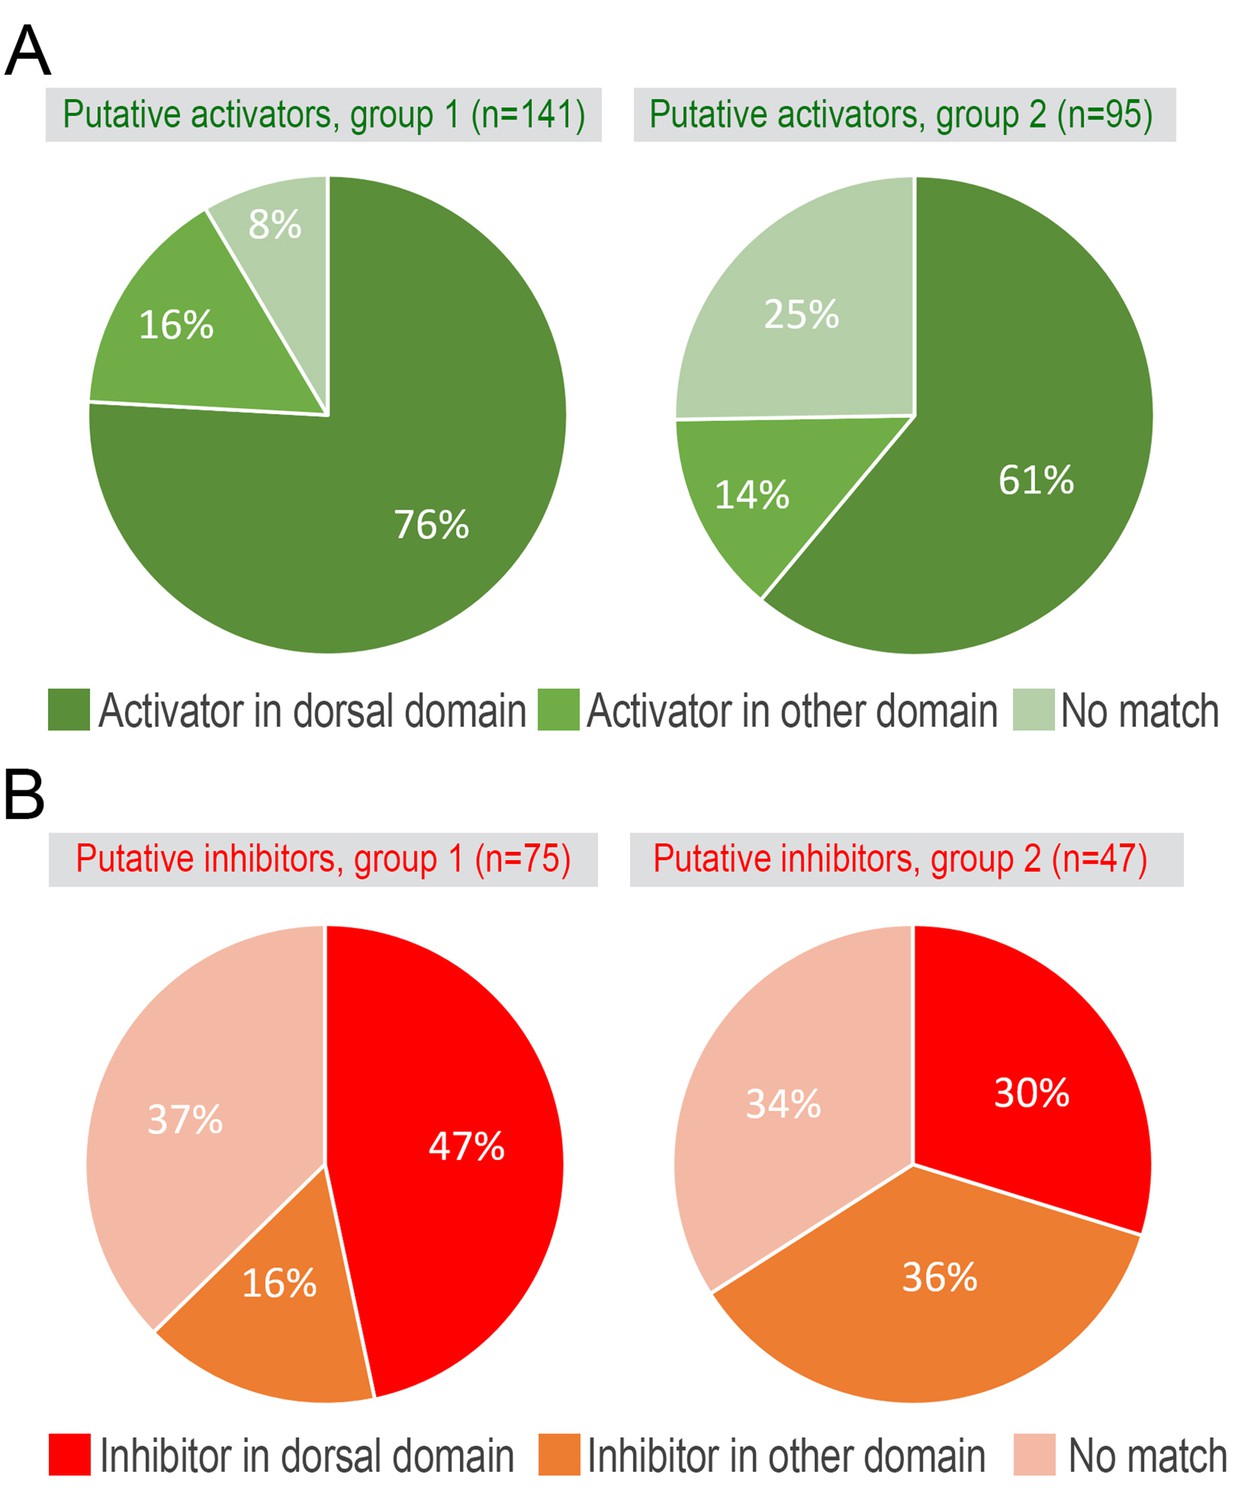
Overlap between model-predicted activators (A) and inhibitors (B) from the microarray (see main Figure 1D–1E) and RNA-seq datasets.
Appendix 1—figure 17
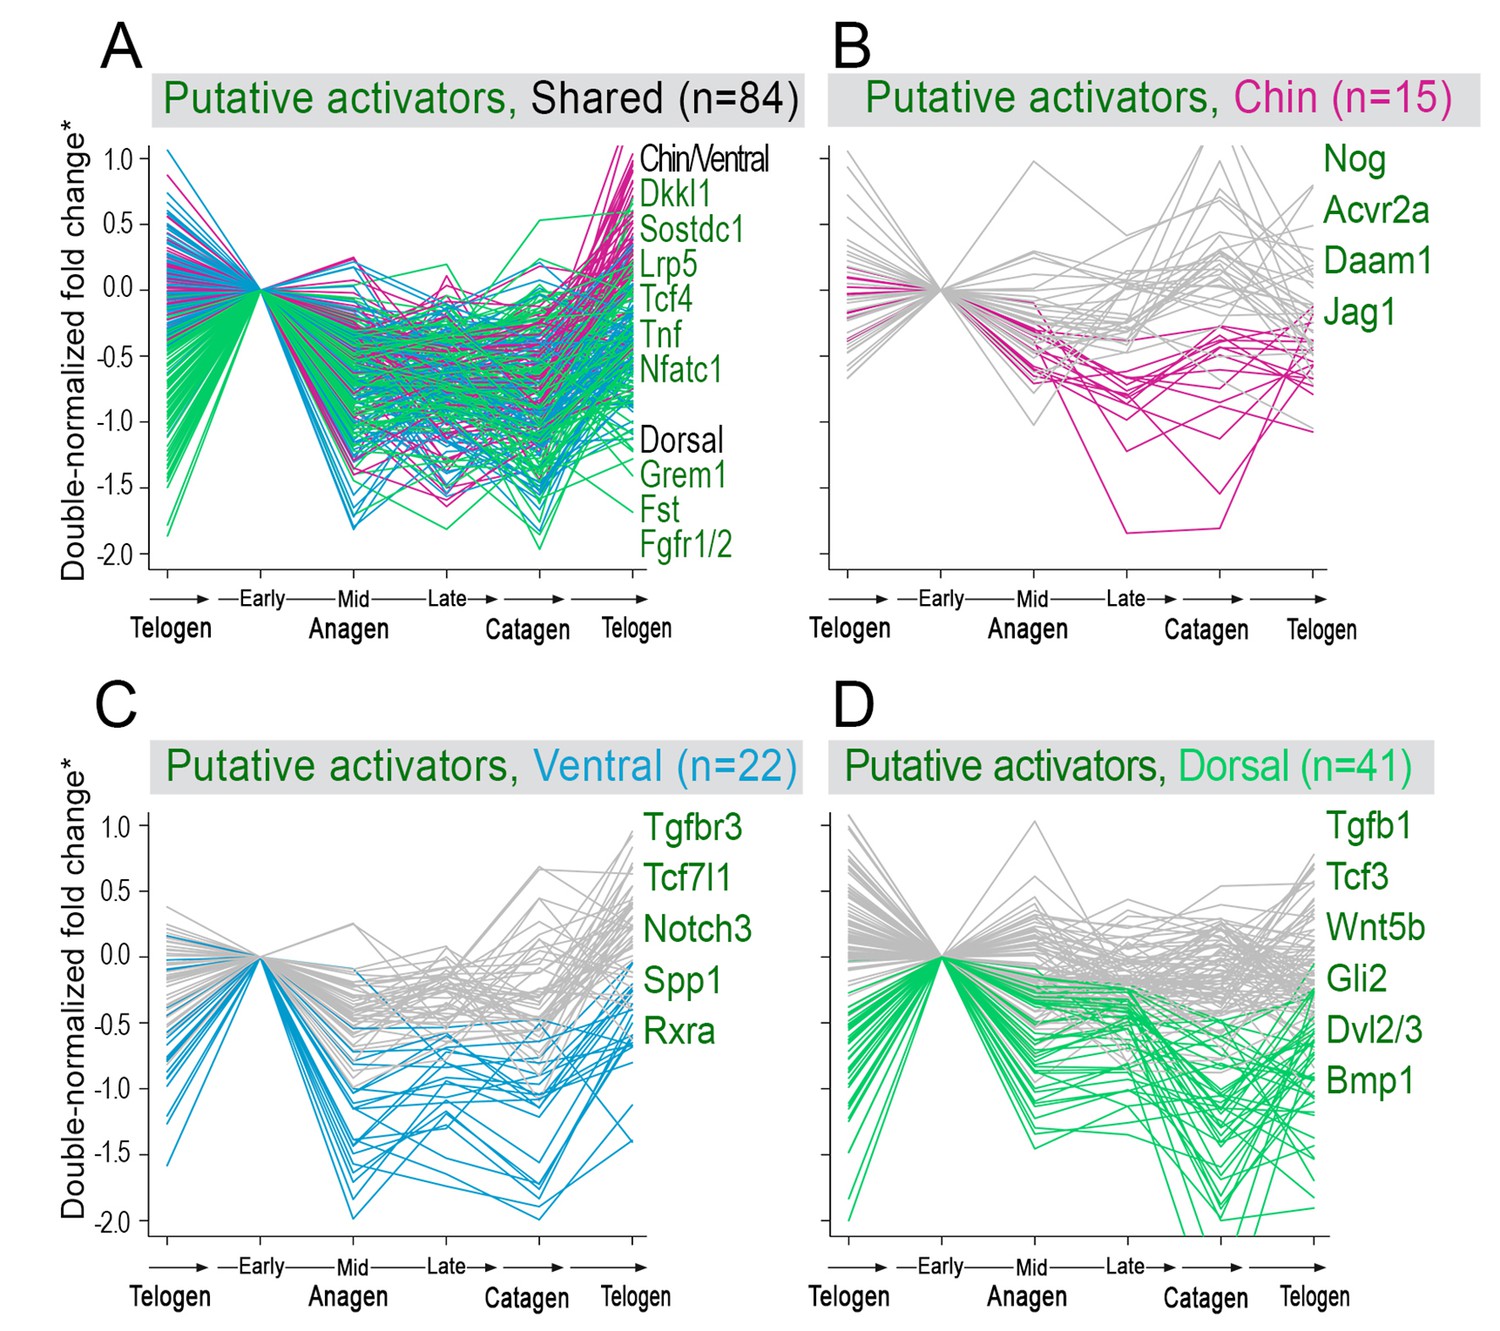
Model-predicted hair cycle activators.
Multiple putative activator show cyclic temporal expression patterns. Some activator genes show model-predicted cyclic expression patterns in all three domains (A), while other activator genes show cyclic patterns only in one domain (B–D). Select genes are listed. For A), activator genes with distinctly faster expression dynamics in chin/ventral and dorsal domains are listed. (*) Relative fold change was calculated as shown on Appendix 1—figure 15.
Appendix 1—figure 18
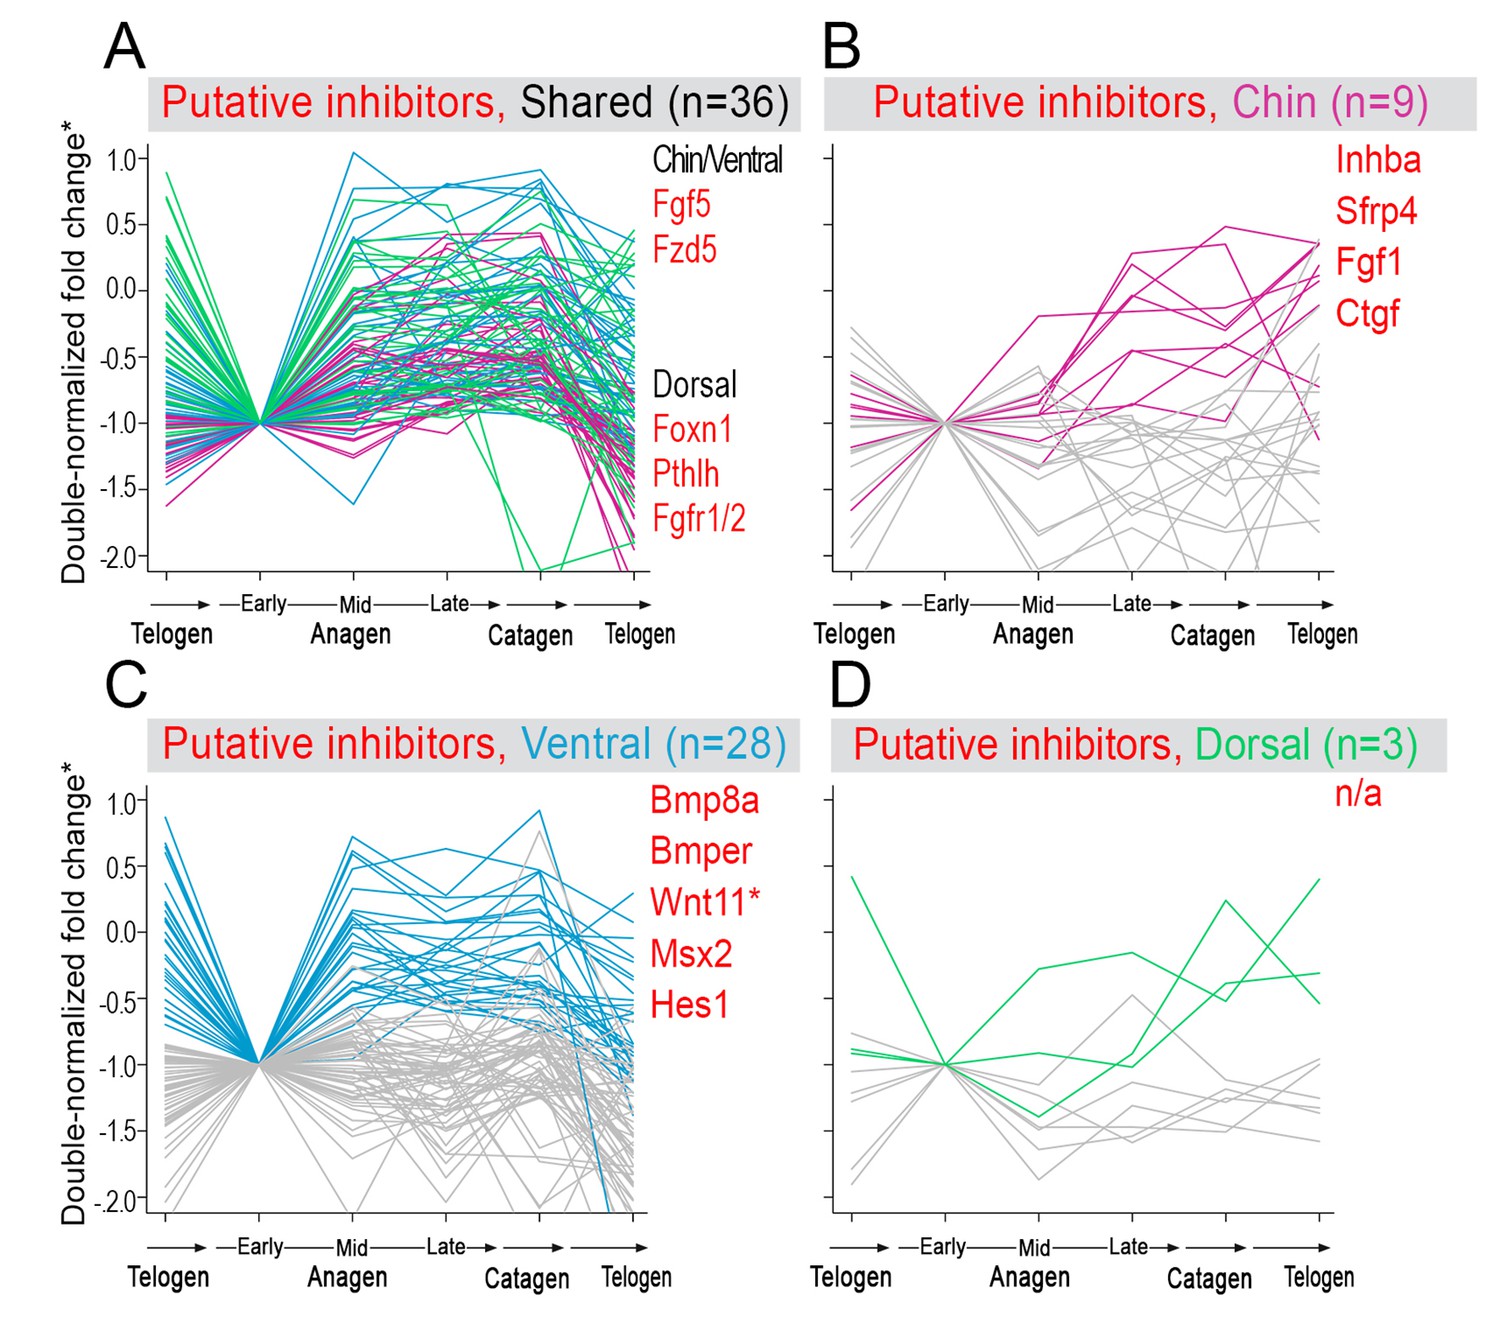
Model-predicted hair cycle inhibitors.
Multiple putative inhibitors show cyclic temporal expression patterns. Some inhibitor genes show model-predicted cyclic expression patterns in all three domains (A), while other inhibitor genes show cyclic patterns only in one domain (B–D). Select genes are listed. For A), inhibitor genes with distinctly faster expression dynamics in chin/ventral and dorsal domains are listed. (*) Relative fold change was calculated as shown on Appendix 1—figure 15.
Appendix 1—figure 19
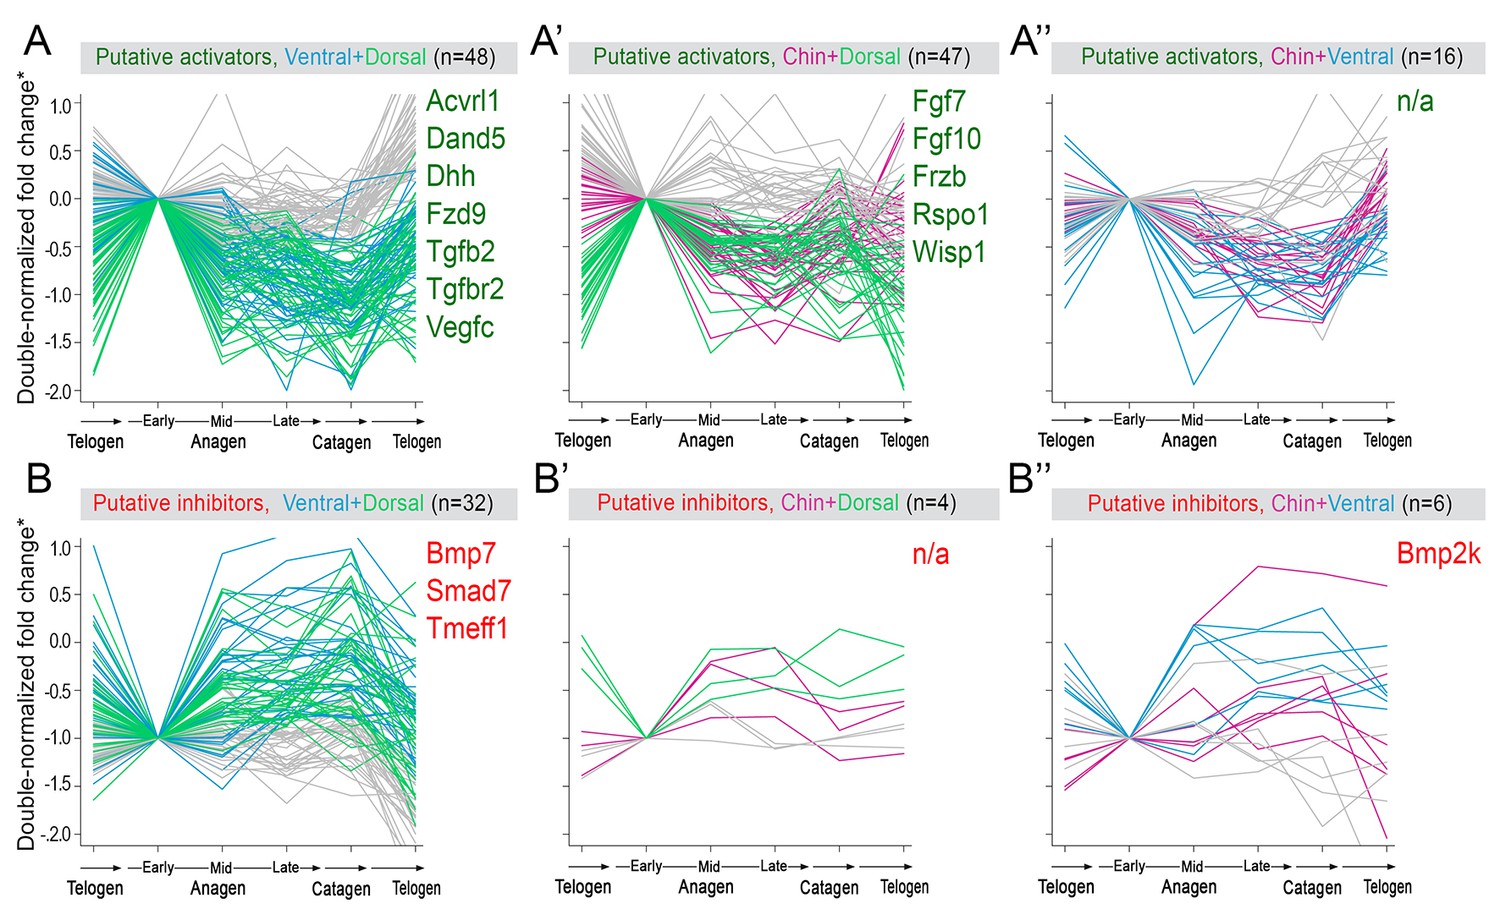
Additional activators and inhibitors.
Additional domain-specific activators (A–A’’) and inhibitors (B–B’’) identified on RNA-seq. (*) Relative fold change was calculated as shown on Appendix 1—figure 15.
Appendix 1—figure 20
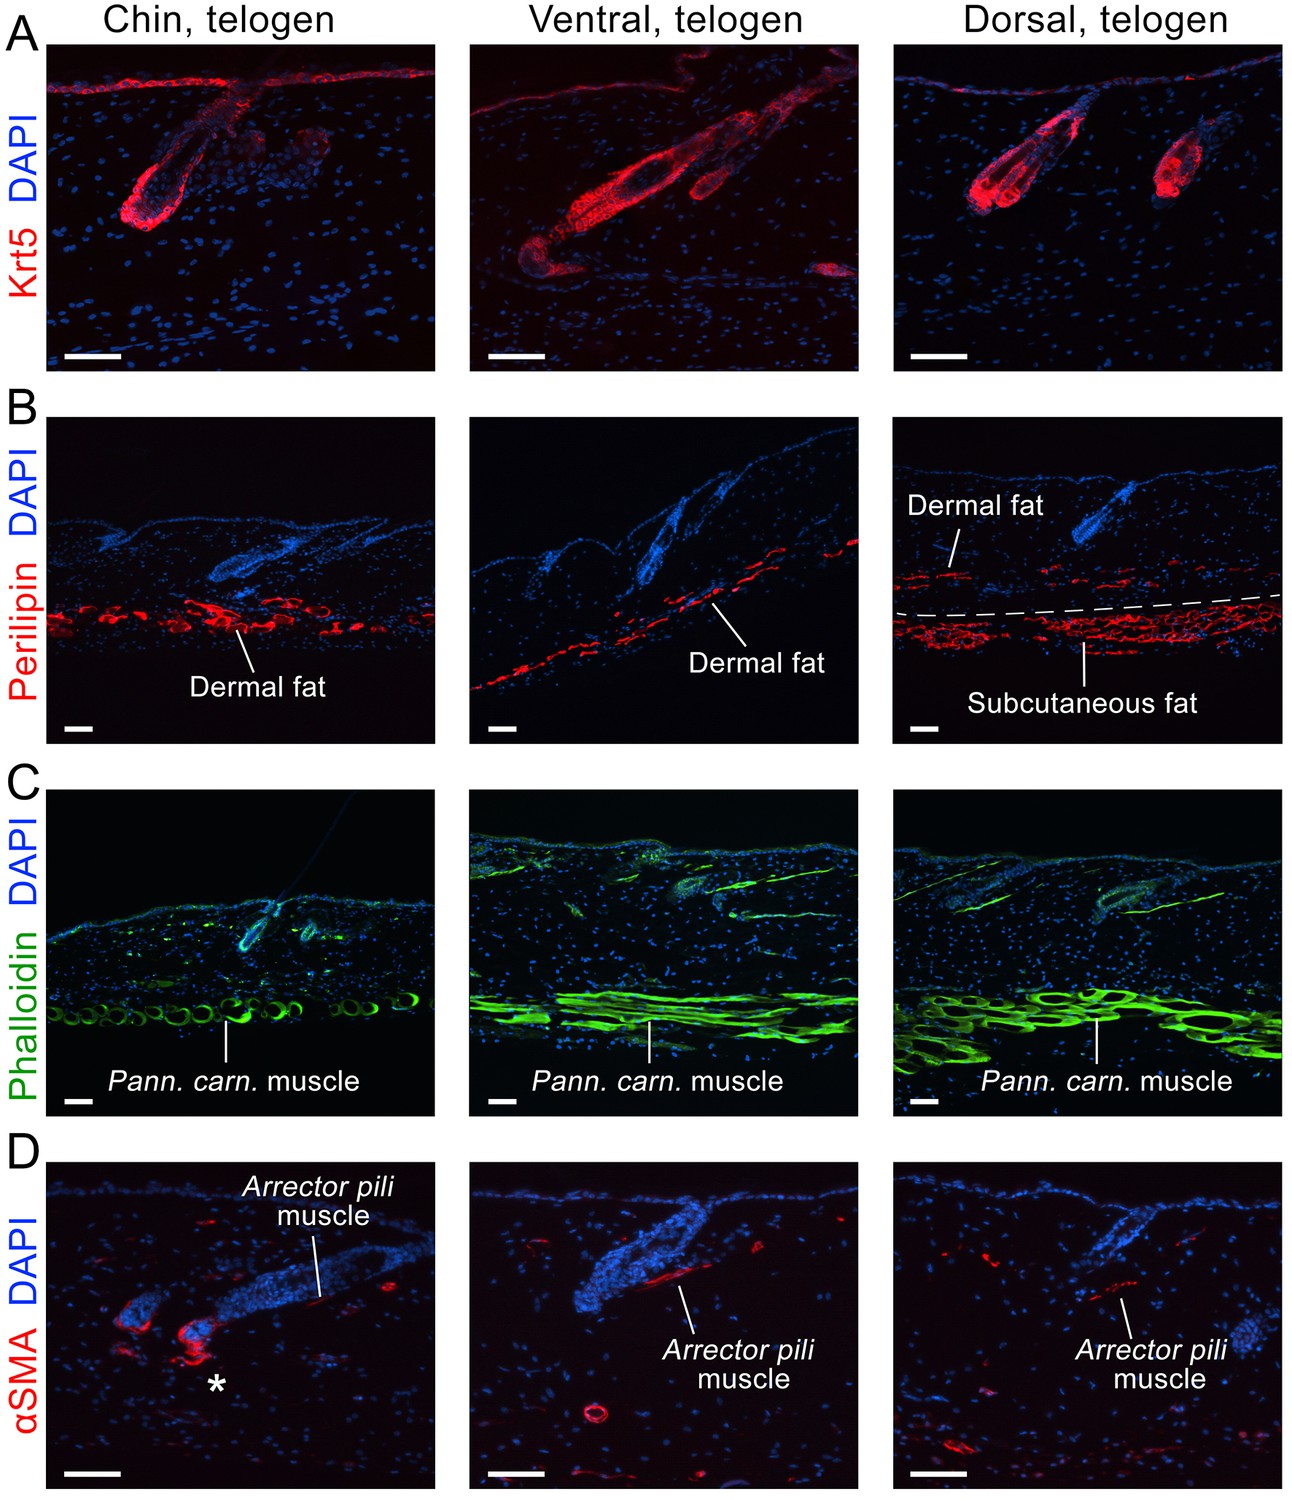
Domain-specific expression of select markers.
Immunostaining on early telogen skin reveals thicker perilipin-expressing dermal fat layer in chin and ventral domains. Despite having a prominent subcutaneous fat layer, dorsal skin has thin dermal fat layer (B). Phalloidin staining shows distinctly thicker panniculus carnosus muscle in dorsal and ventral domains as compared to chin domain (C). αSMA staining shows more contractile cells around telogen HFs in chin domain (D). Scale bars: A-D – 50 um.
Appendix 1—figure 21

Domain-specific differences in macrophage abundance.
FACS analysis on early telogen skin reveals that chin and ventral domains contain significantly more CD11b+;F4/80+ macrophages as compared to dorsal domain. Example FACS plots are shown on A–C. Statistical analysis is shown on D and domain-specific data is color-coded as follows: chin (purple), ventral (blue) and domains (green). Average percentage of macrophages is indicated within each bar (** p<0.01).
Appendix 1—figure 22
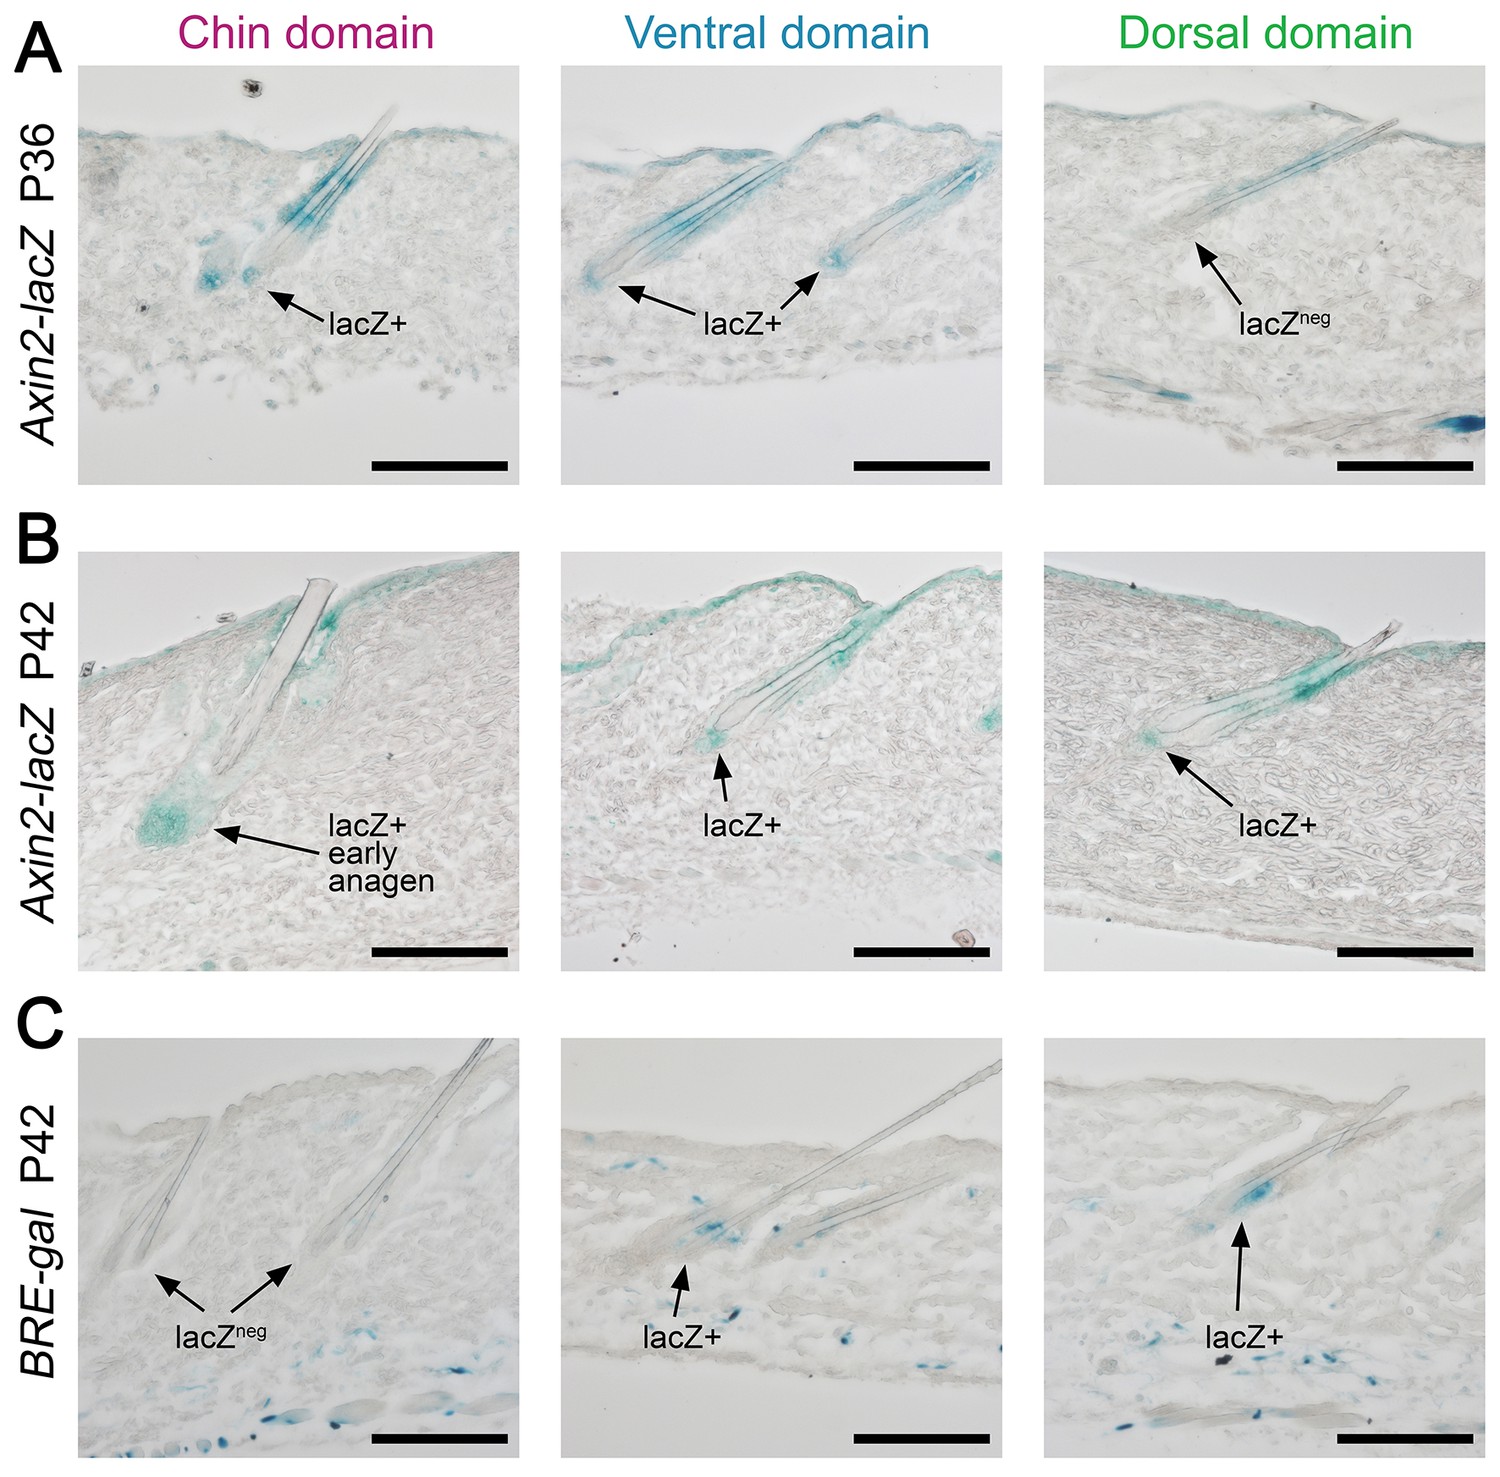
Domain-specific expression of WNT and BMP reporters.
(A) In P36 Axin2-lacZ WNT reporter mice, the majority of chin and ventral telogen HFs contain WNT-active DPs, while many dorsal telogen HFs have WNT-negative DPs. (B) By P42, the number of telogen HFs with WNT-active DPs in dorsal skin raises to the levels compatible to ventral skin. By P42, chin HFs in some animals having already entered early anagen. (C) In P42 BRE-gal BMP reporter mice, dorsal skin contains many more HFs with BMP-active bulges as compared to chin skin. Ventral skin shows intermediate percentage of BMP-active HFs. Also see main Figure 4. Scale bars: A-D – 100 um.
Appendix 1—figure 23
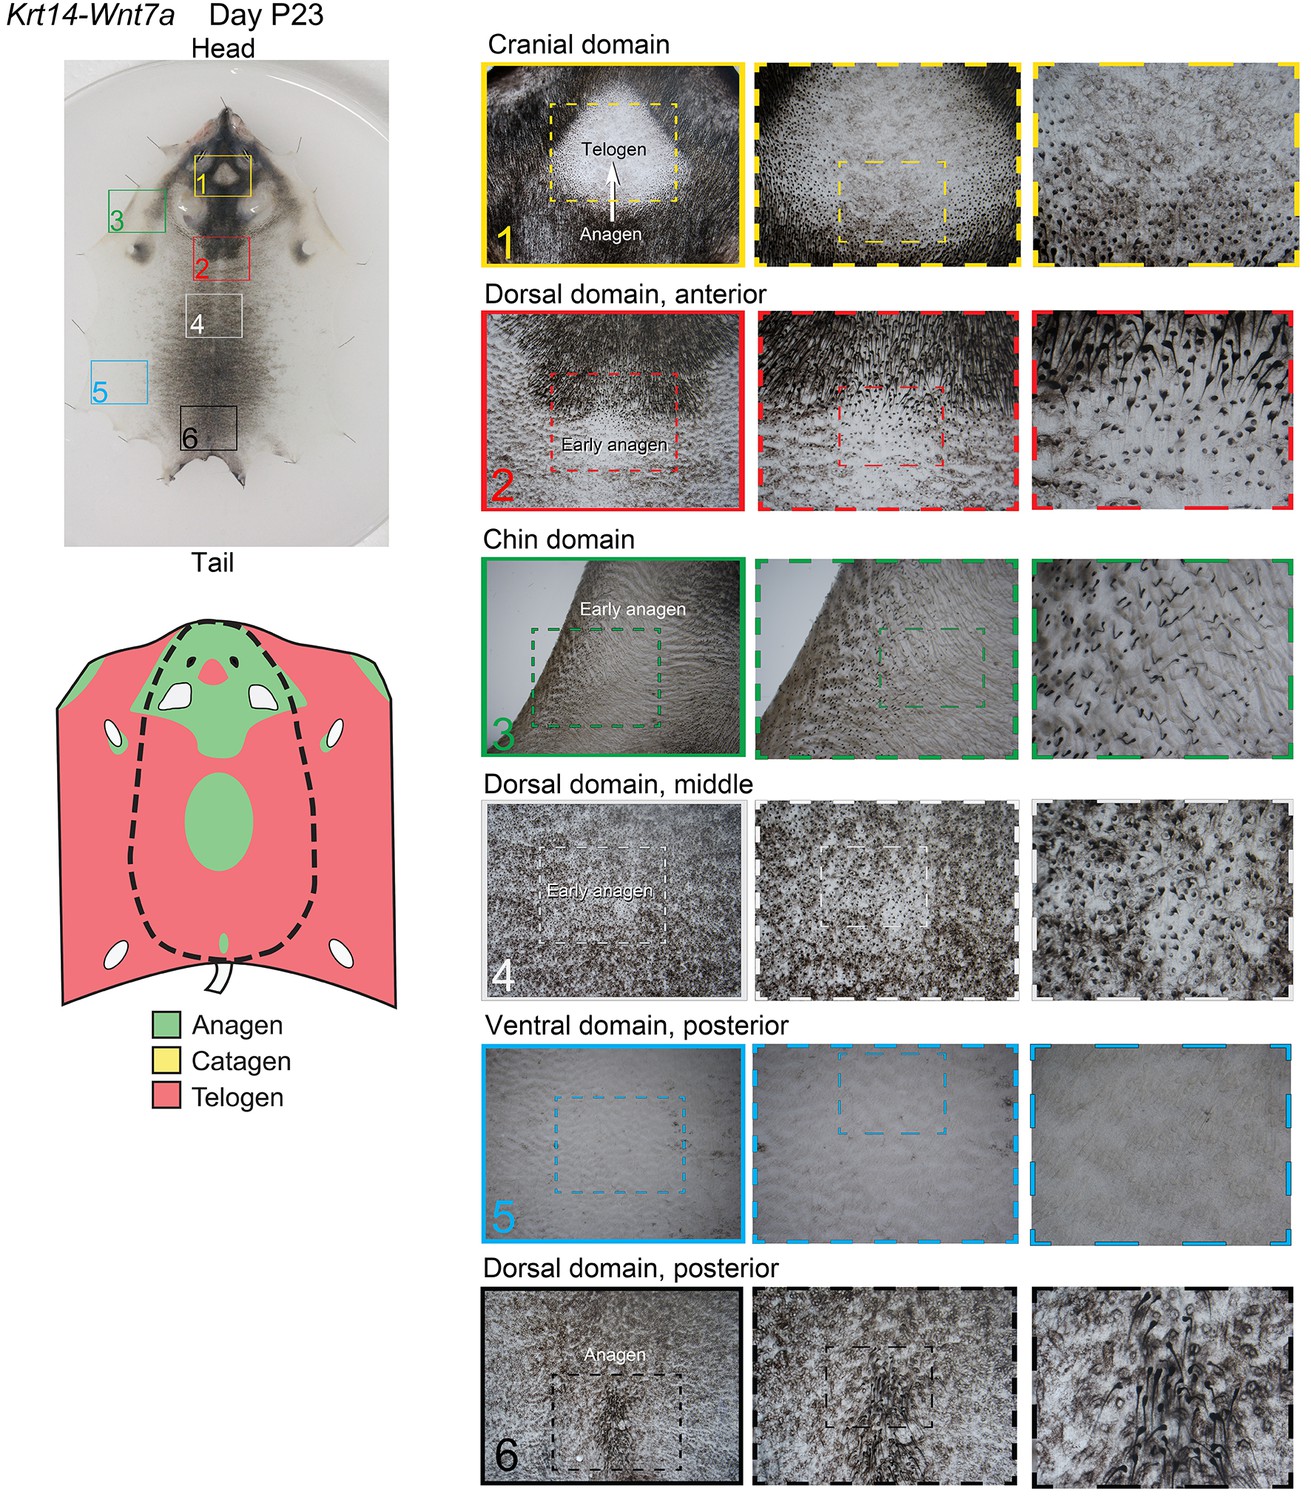
Distribution of the hair cycle stages in P23 Krt14-Wnt7a mouse skin.
On day P23, Krt14-Wnt7a mouse shows disruption of ventral-to-dorsal dominance and spontaneous anagen initiation occurs in several locations: chin domain (insert 3) and several sites along the midline in the dorsal domain (inserts 2, 4 and 6). In addition, anagen is prominent in the cranial domain (insert 1).
Appendix 1—figure 24
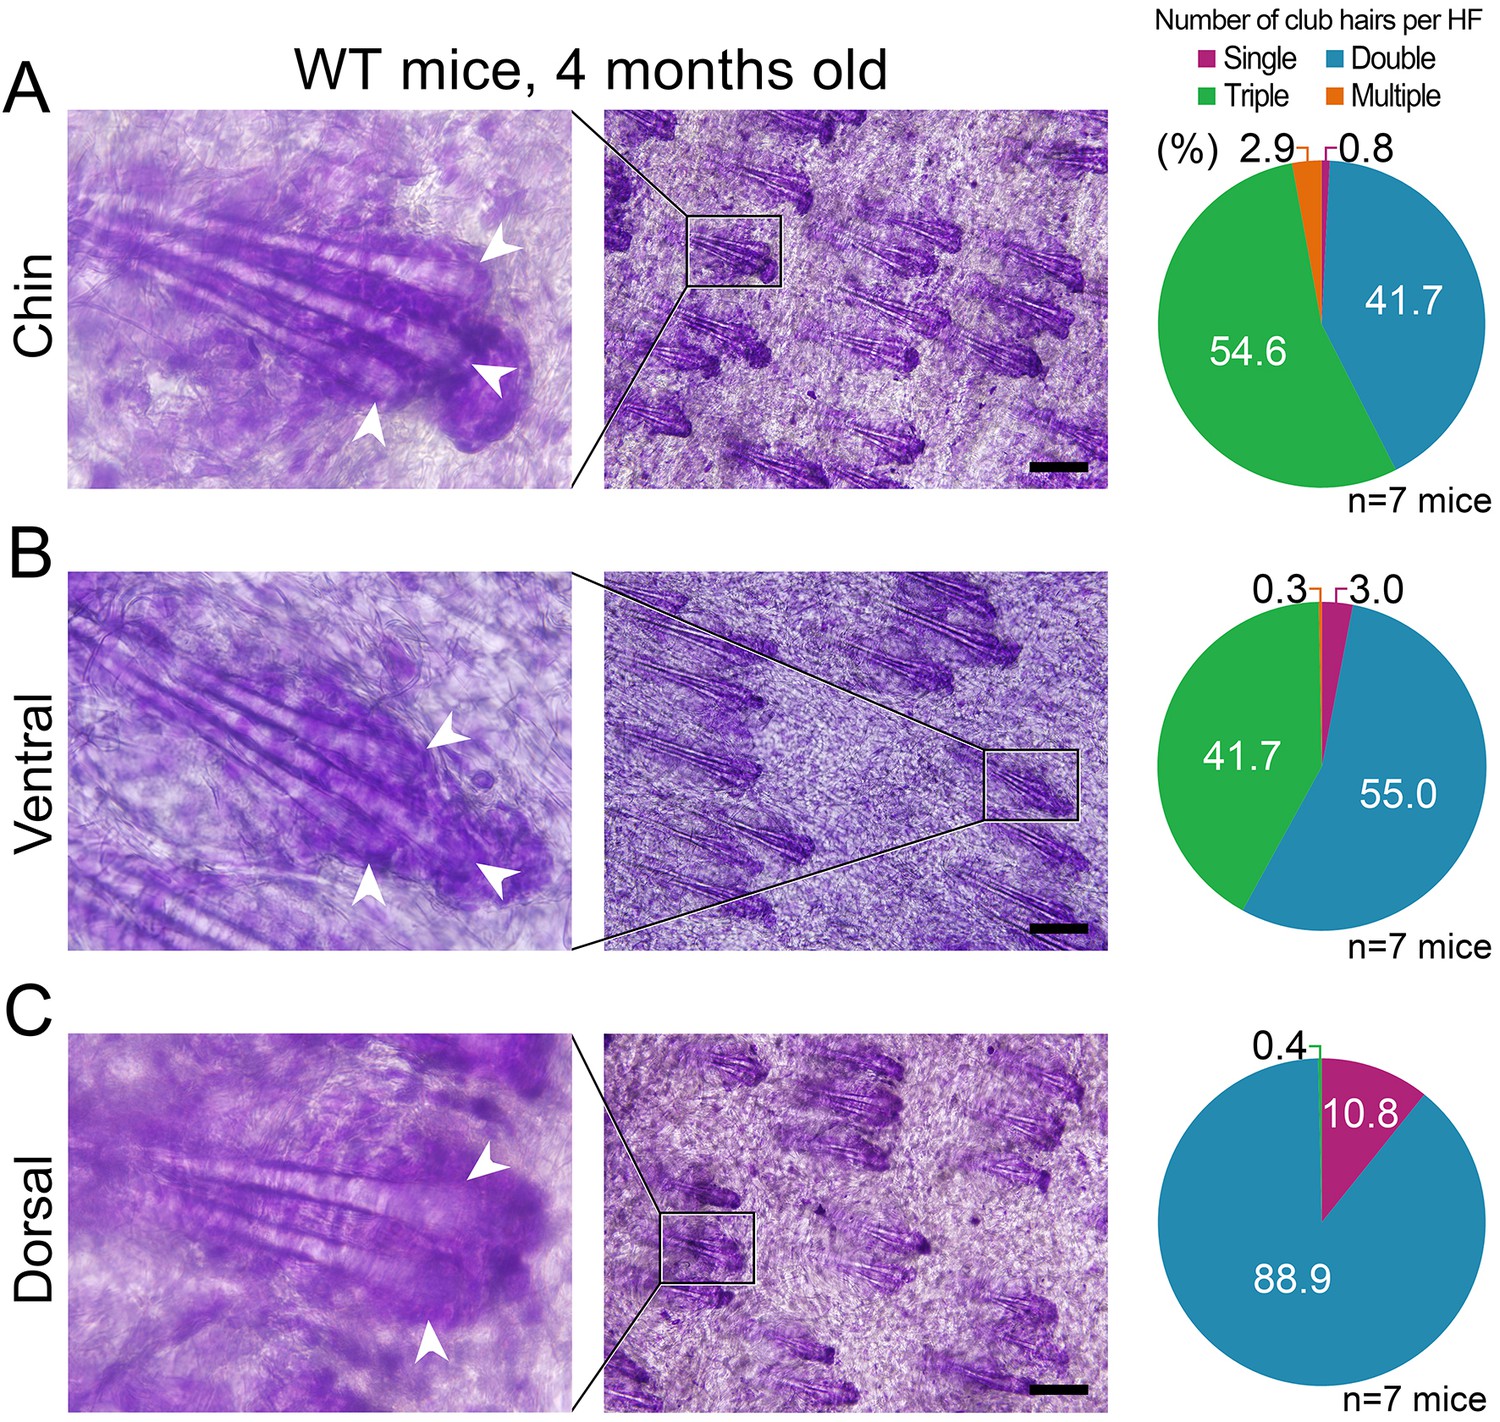
Differences in club hair density between the domains.
(A, B) In four-month-old mice, a large portion of chin (54.6%) and ventral telogen HFs (41.7%) contain three club hairs. However, in the same mice, only 0.4% of dorsal HFs contain three club hairs and the majority of HFs only have two clubs (C). Quantification of club hair density is shown on the right. Pie charts are color-coded according to the top label: single club HFs (purple), double club HFs (blue), triple clubs HFs (green) and multiple club HFs (more than 3, orange). Scale bars: A-C – 200 um.
Appendix 1—figure 25
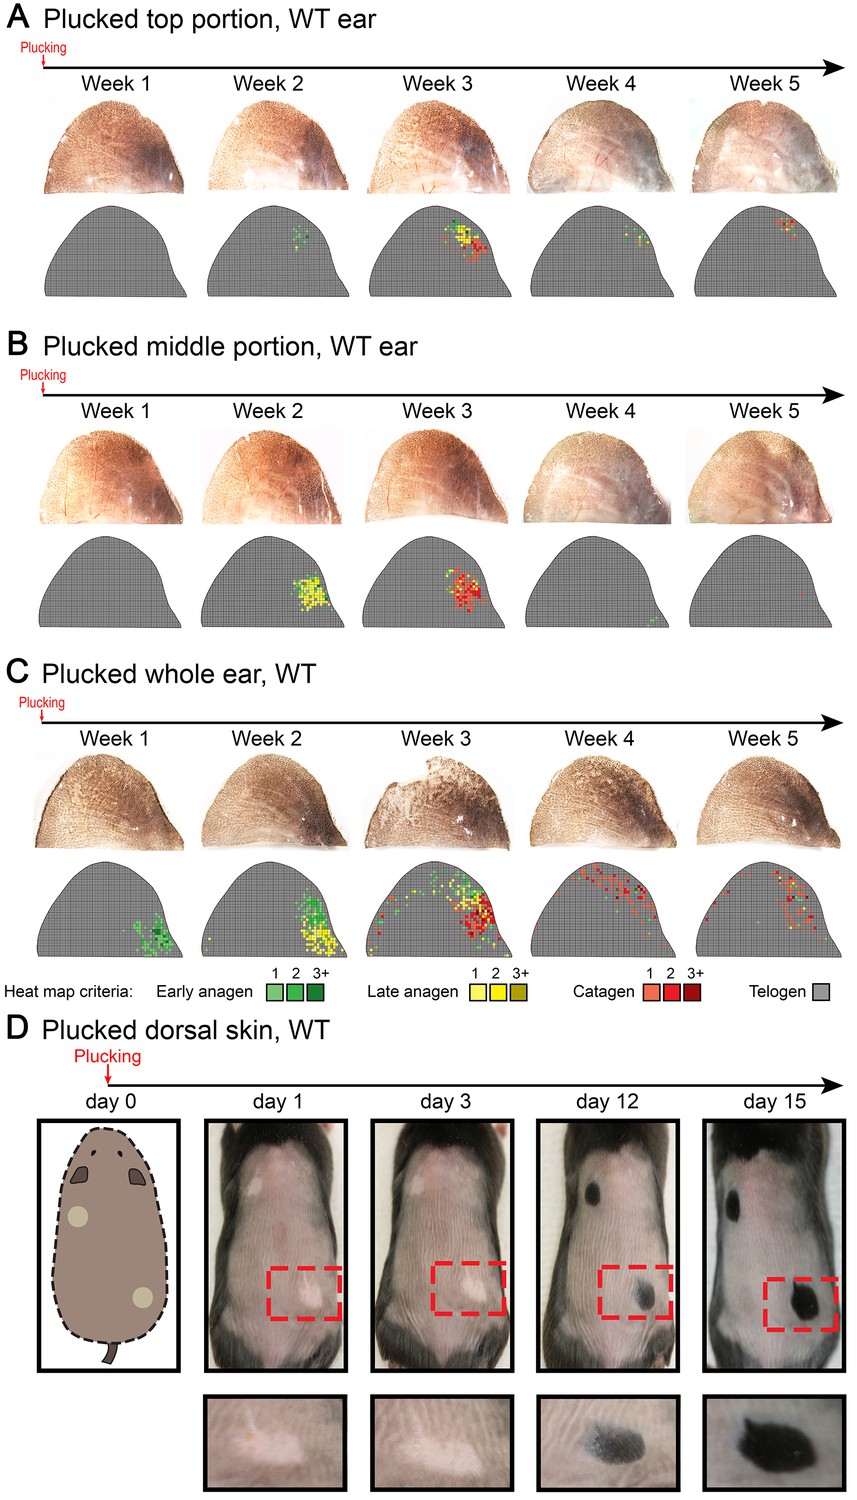
Anagen induction in response to hair plucking.
Club hair plucking activates anagen in dorsal skin (D) as well as in the ear skin along the medial side of the caudal pinna (A, B). Also see main Figure 5D. Hair plucking across the whole ear (C) reveals that HFs along the lateral side and in the center of the pinna either do not re-enter anagen (center) or re-enter it with a significant delay (lateral side). Hair cycle activation on D) was accessed based on the re-appearance of pigmentation. Ear hair plucking experiments on A–C) are based on five mice for each time point analyzed. Back hair plucking experiment on D) is based on five mice. Representative images and accompanying heatmaps are shown.
Appendix 1—figure 26
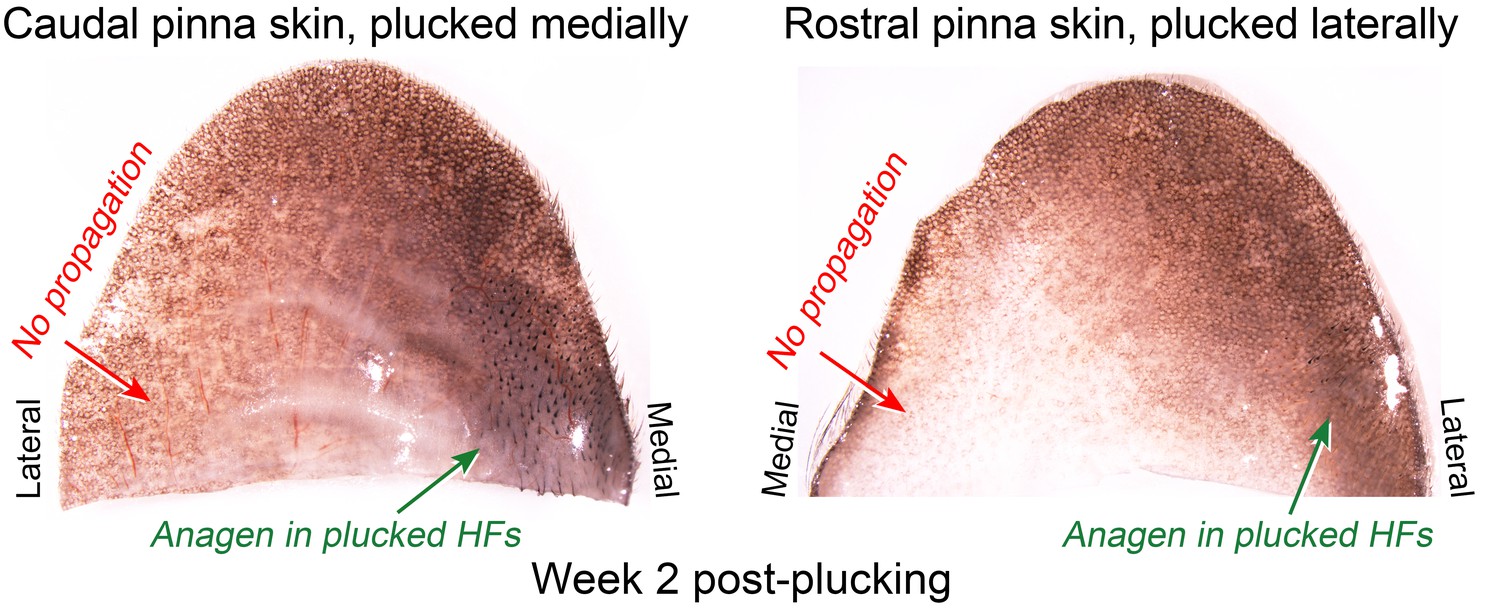
Lack of hair growth propagation across the ear pinna.
Anagen activation in response to plucking in the ear skin remains restricted to the plucked site (caudal pinna skin medially and rostral pinna skin laterally) and does not propagate across the ear onto the opposite side. Caudal pinna skin is the same skin sample as on main Figure 5D.
Appendix 1—figure 27
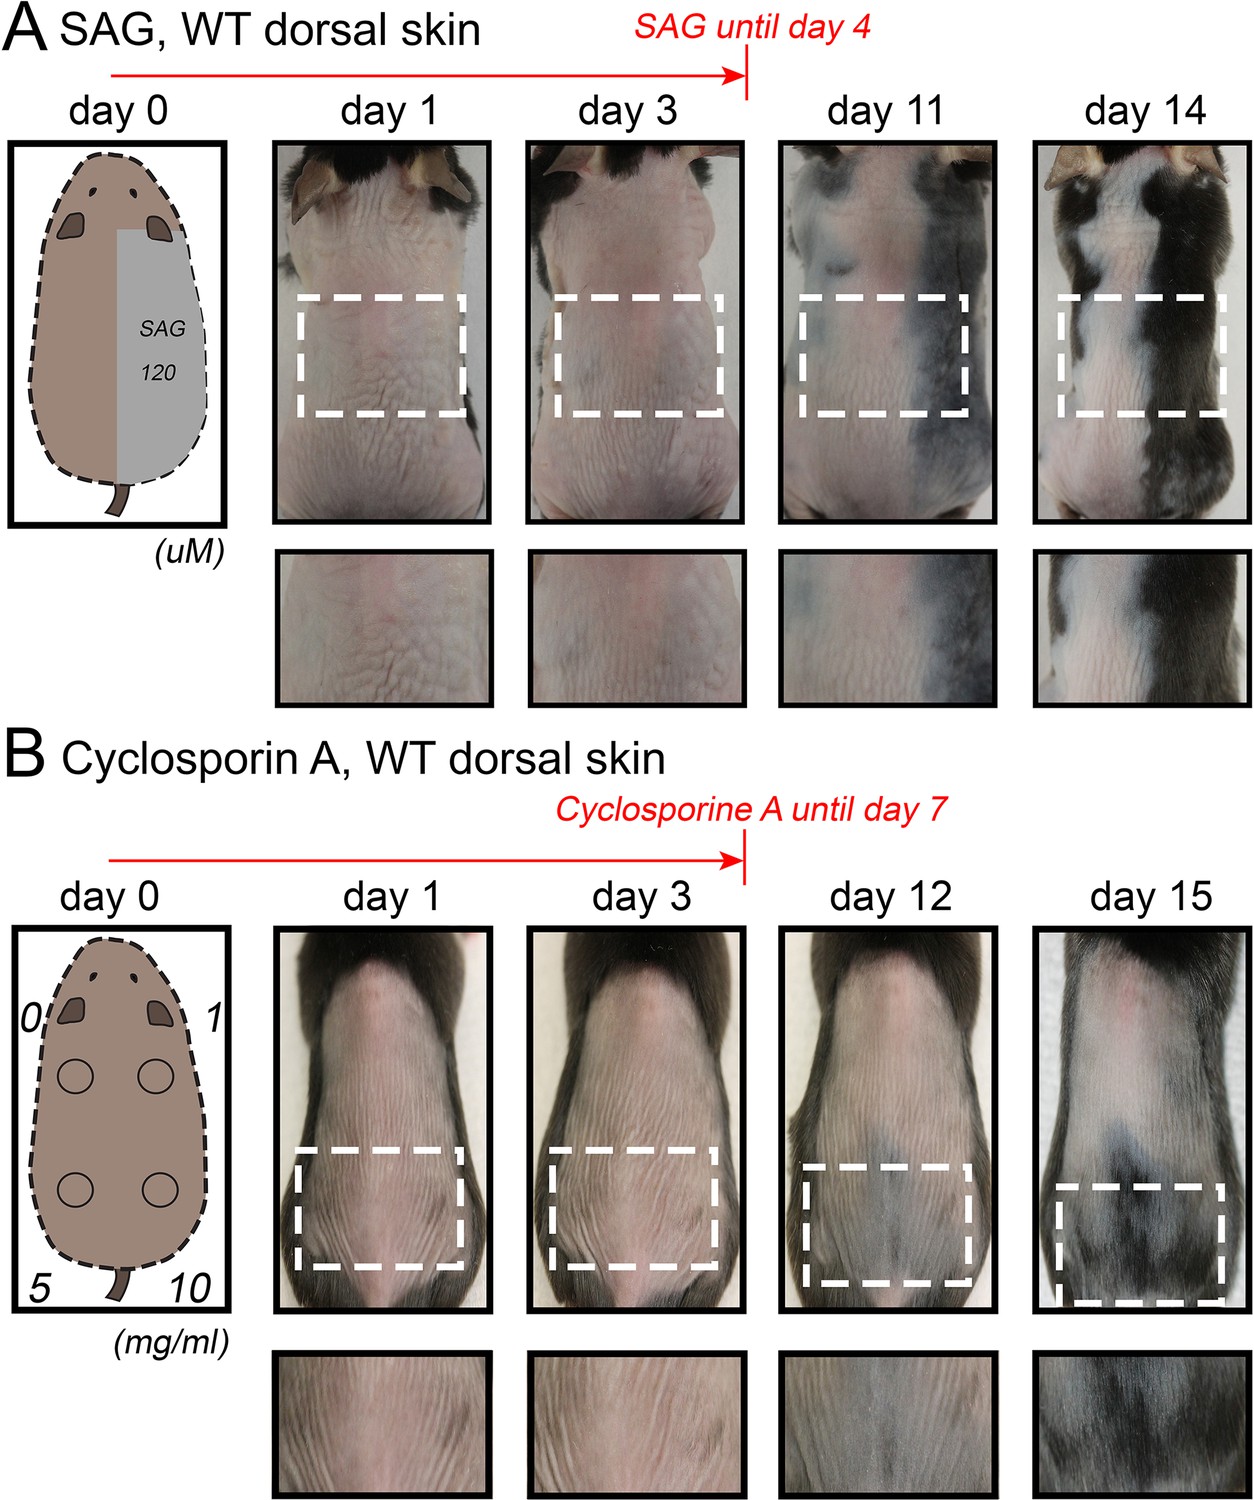
Hair growth activation in response to SAG and cyclosporin A in dorsal skin.
Topical SAG (A) and Cyclosporin A treatment (B) induce rapid hair cycle activation in dorsal telogen skin. Hair cycle activation was assessed based on the re-appearance of pigmentation, a feature of early anagen. Each experiment shown is based on three mice. Representative mice are shown.
Appendix 1—figure 28
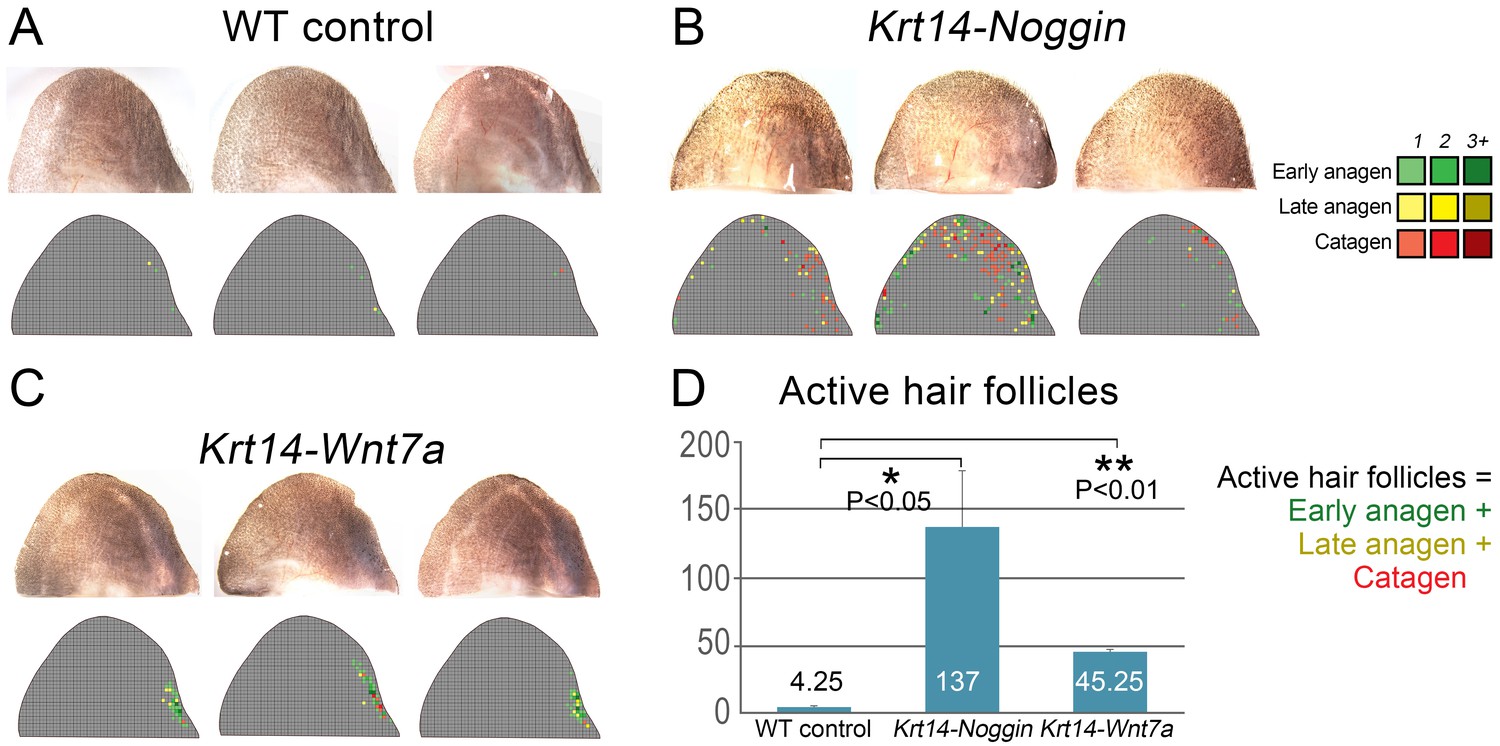
Partial rescue of the hair cycle in the ear skin of mutant mice.
Individual ear skin samples from WT control (A), Krt14-Noggin (B) and Krt14-Wnt7a mice (C) are shown. Each image is accompanied by a heatmap color-coded according to the label in the top-right corner. (D) Statistical analysis is shown on the number of active HFs (these with early and late anagen and catagen morphologies) per ear skin sample. Average number of active HFs is indicated within each bar.
Appendix 1—figure 29
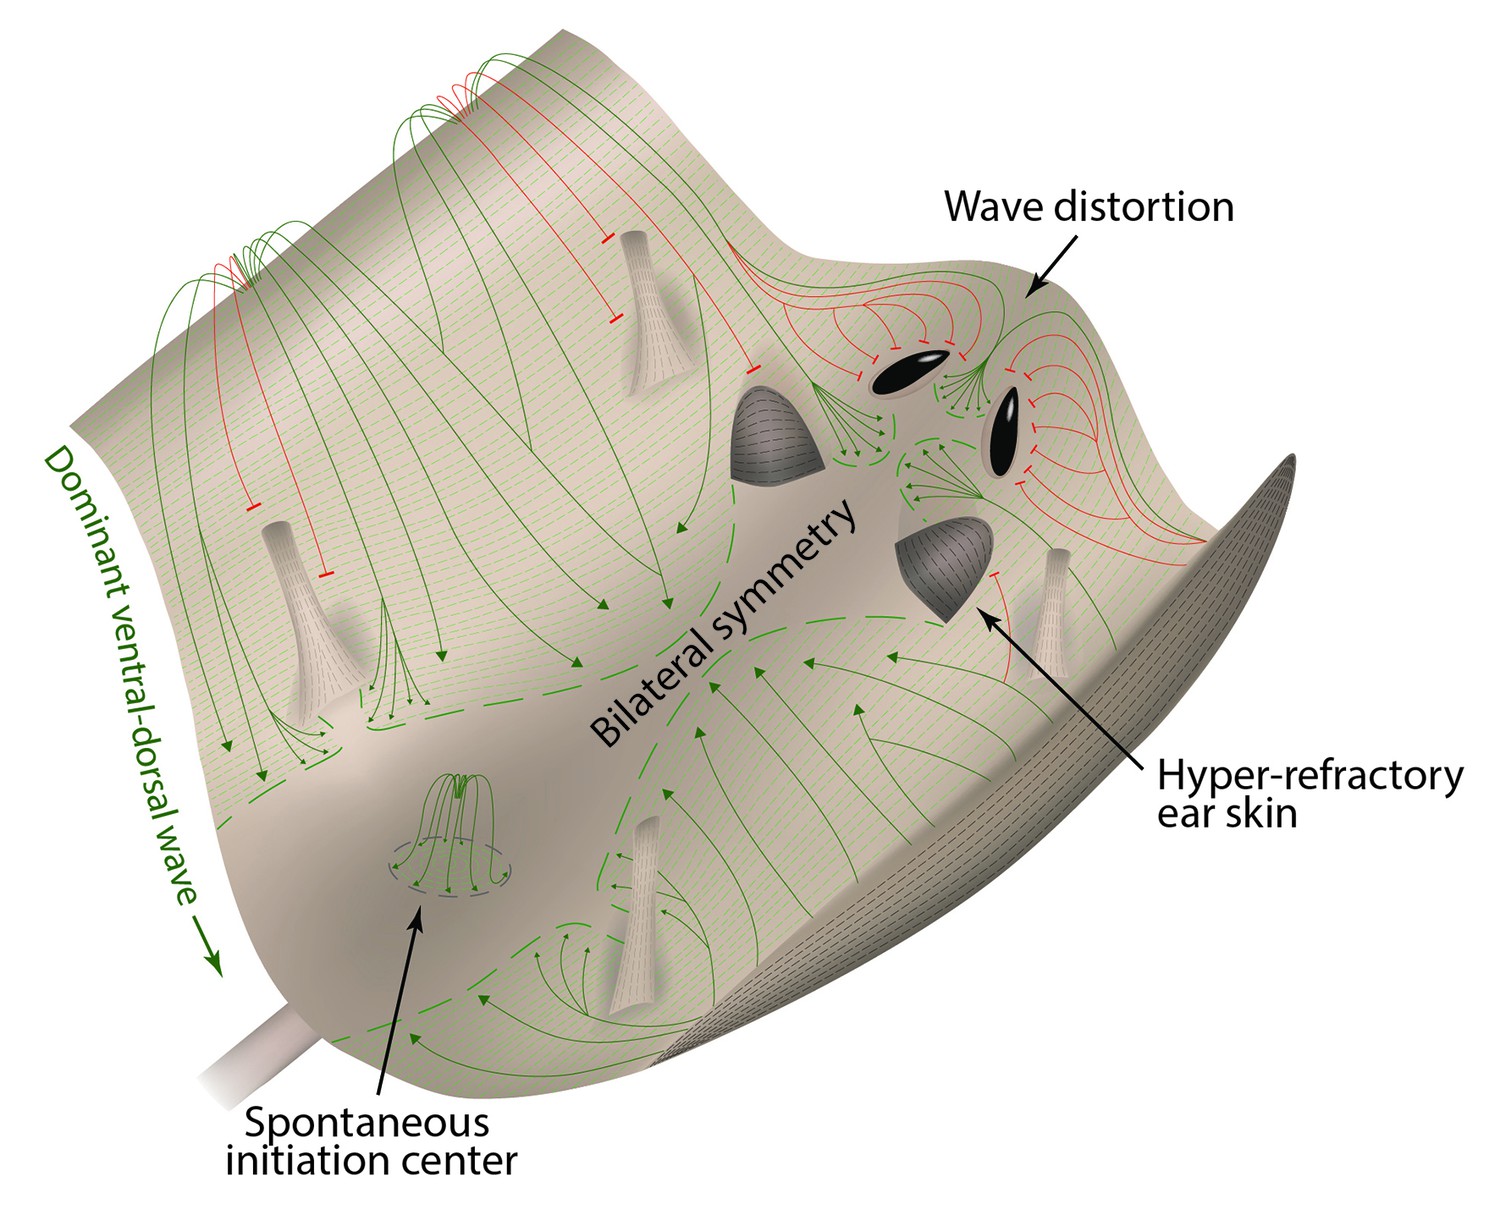
Landscape model of hair growth pattern formation.
Mouse skin is represented as a landscape with peaks (ventral and chin skin), valleys (dorsal and cranial skin) and obstacles (eye openings, ear pinnae and limbs). In analogy to water streaming downward, hair growth waves (green) preferentially spread from ventral to dorsal skin, producing bilateral symmetry. In analogy to water waves diffracting around physical obstacles, hair growth waves (red) diffract around hyper-refractory ear pinnae, limb skin, and eye openings.
Appendix 2—figure 1
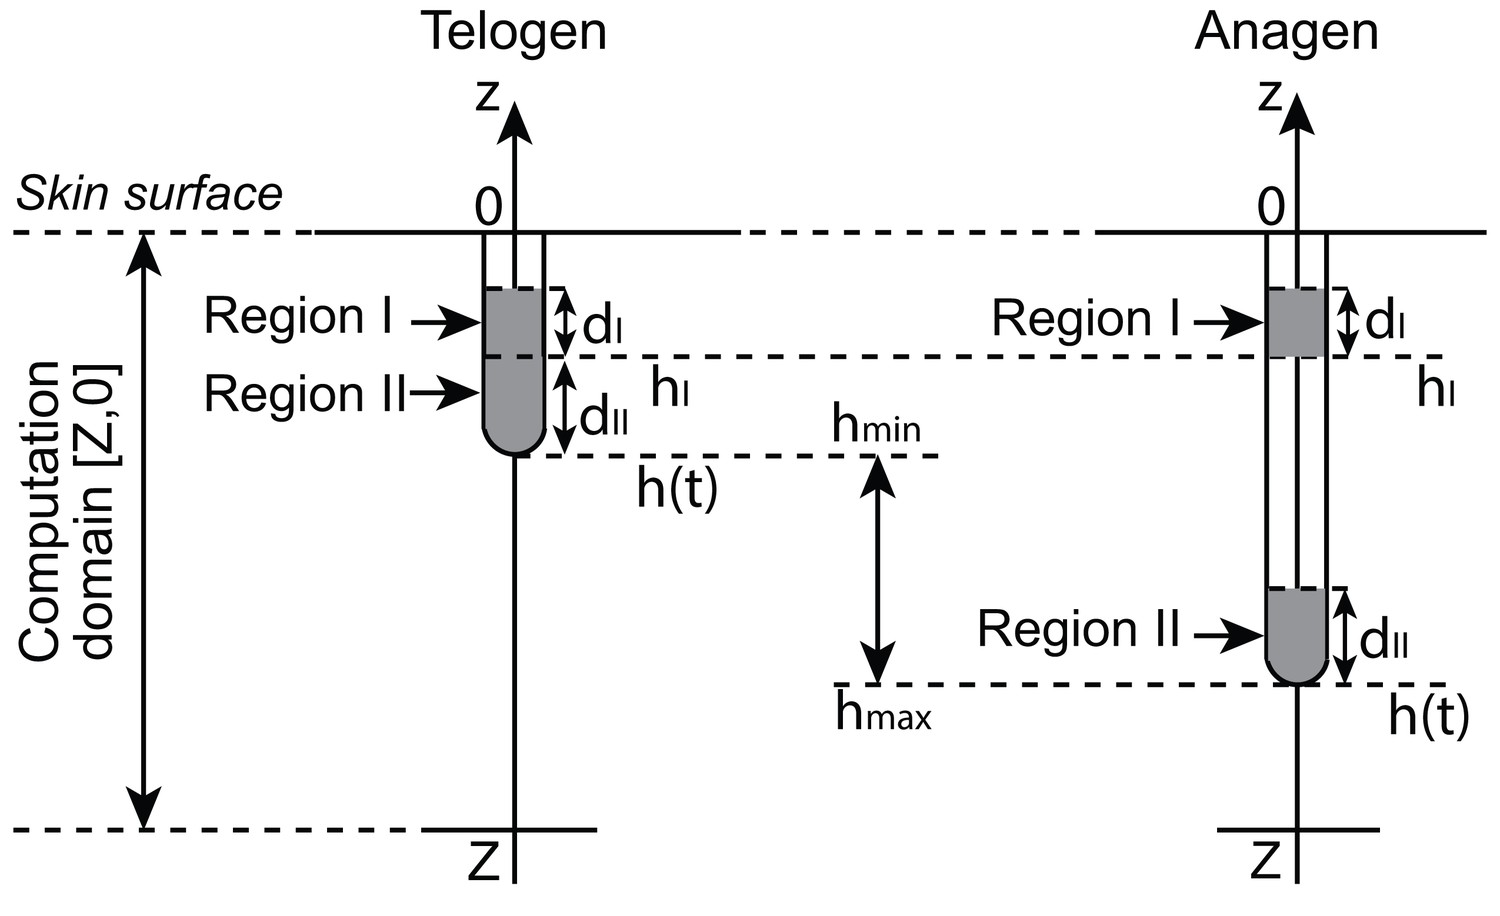
Geometry of a single hair follicle.
https://doi.org/10.7554/eLife.22772.043
Appendix 2—figure 2
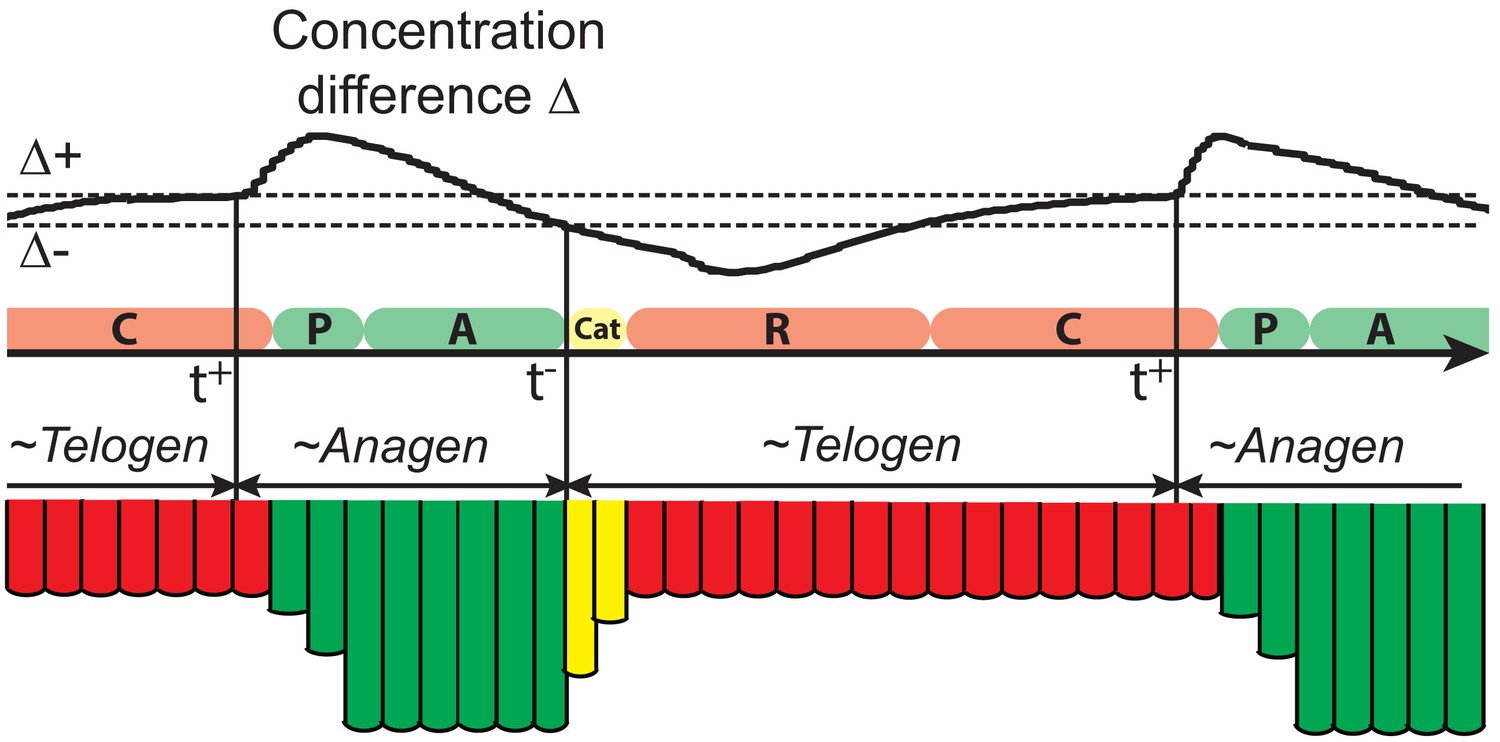
Illustration of the hair growth cycle phases.
https://doi.org/10.7554/eLife.22772.044
Appendix 2—figure 3
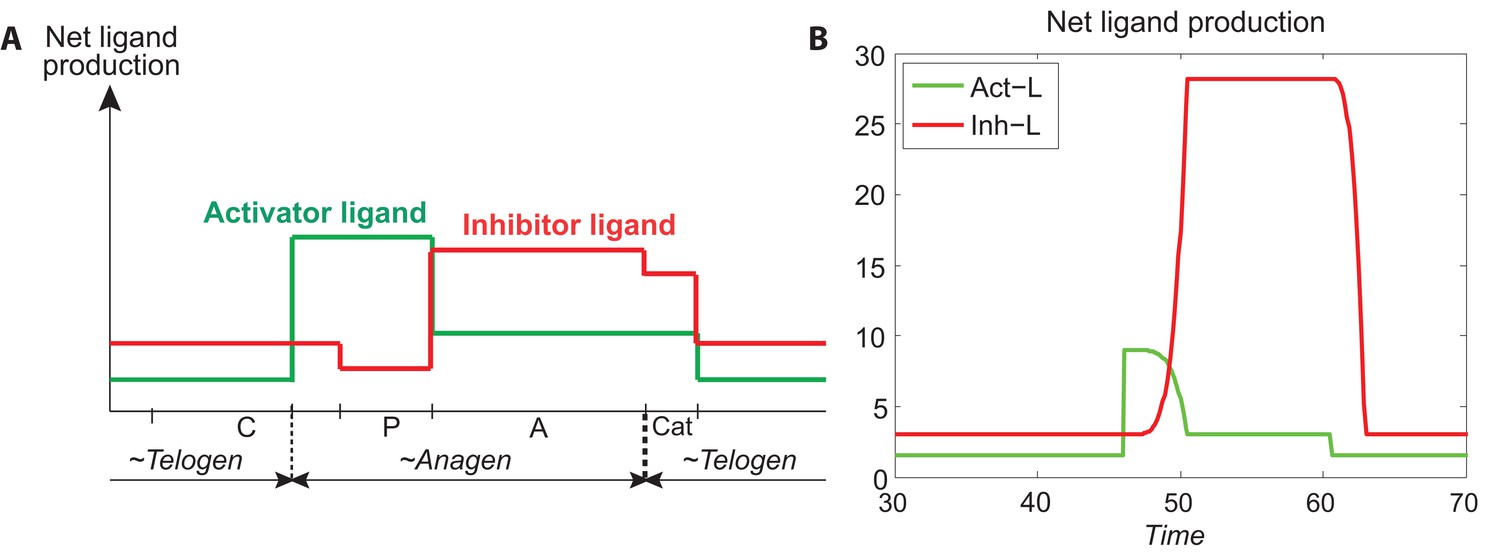
Temporal patterns of activator and ligand production.
(A) The temporal patterns of activator (green line) and inhibitor ligands (red line) produced from Appendix 2—table 4 and calculated by Appendix 2-Equations (8). (B) The temporal patterns of activator and inhibitor ligands produced from Appendix 2-Equations (9, 10). Comparing (A) to (B), we see they follow the similar patterns, indicating that our modeling of activator and ligand productions (Appendix 2-Equations (9, 10)) is reasonable.
Appendix 2—figure 4

Illustration of 2D and 3D HF model.
https://doi.org/10.7554/eLife.22772.046
Appendix 2—figure 5
When activator/inhibitor signals are either too strong or too weak (Figure 1C, grey regions), the excitability breaks down and instead of cycling, the HF reaches a stable equilibrium state.
(A) When inhibitor is very strong, signal difference per se cannot reach the threshold required for spontaneous excitation, and the HF equilibrates in a prolonged telogen-like state (Figure 1C, Equilibrium II). (B) When inhibitor is very low, it fails to catch up with the activator, and the HF equilibrates in a prolonged anagen-like state instead (Figure 1C, Equilibrium I).
Appendix 2—figure 6
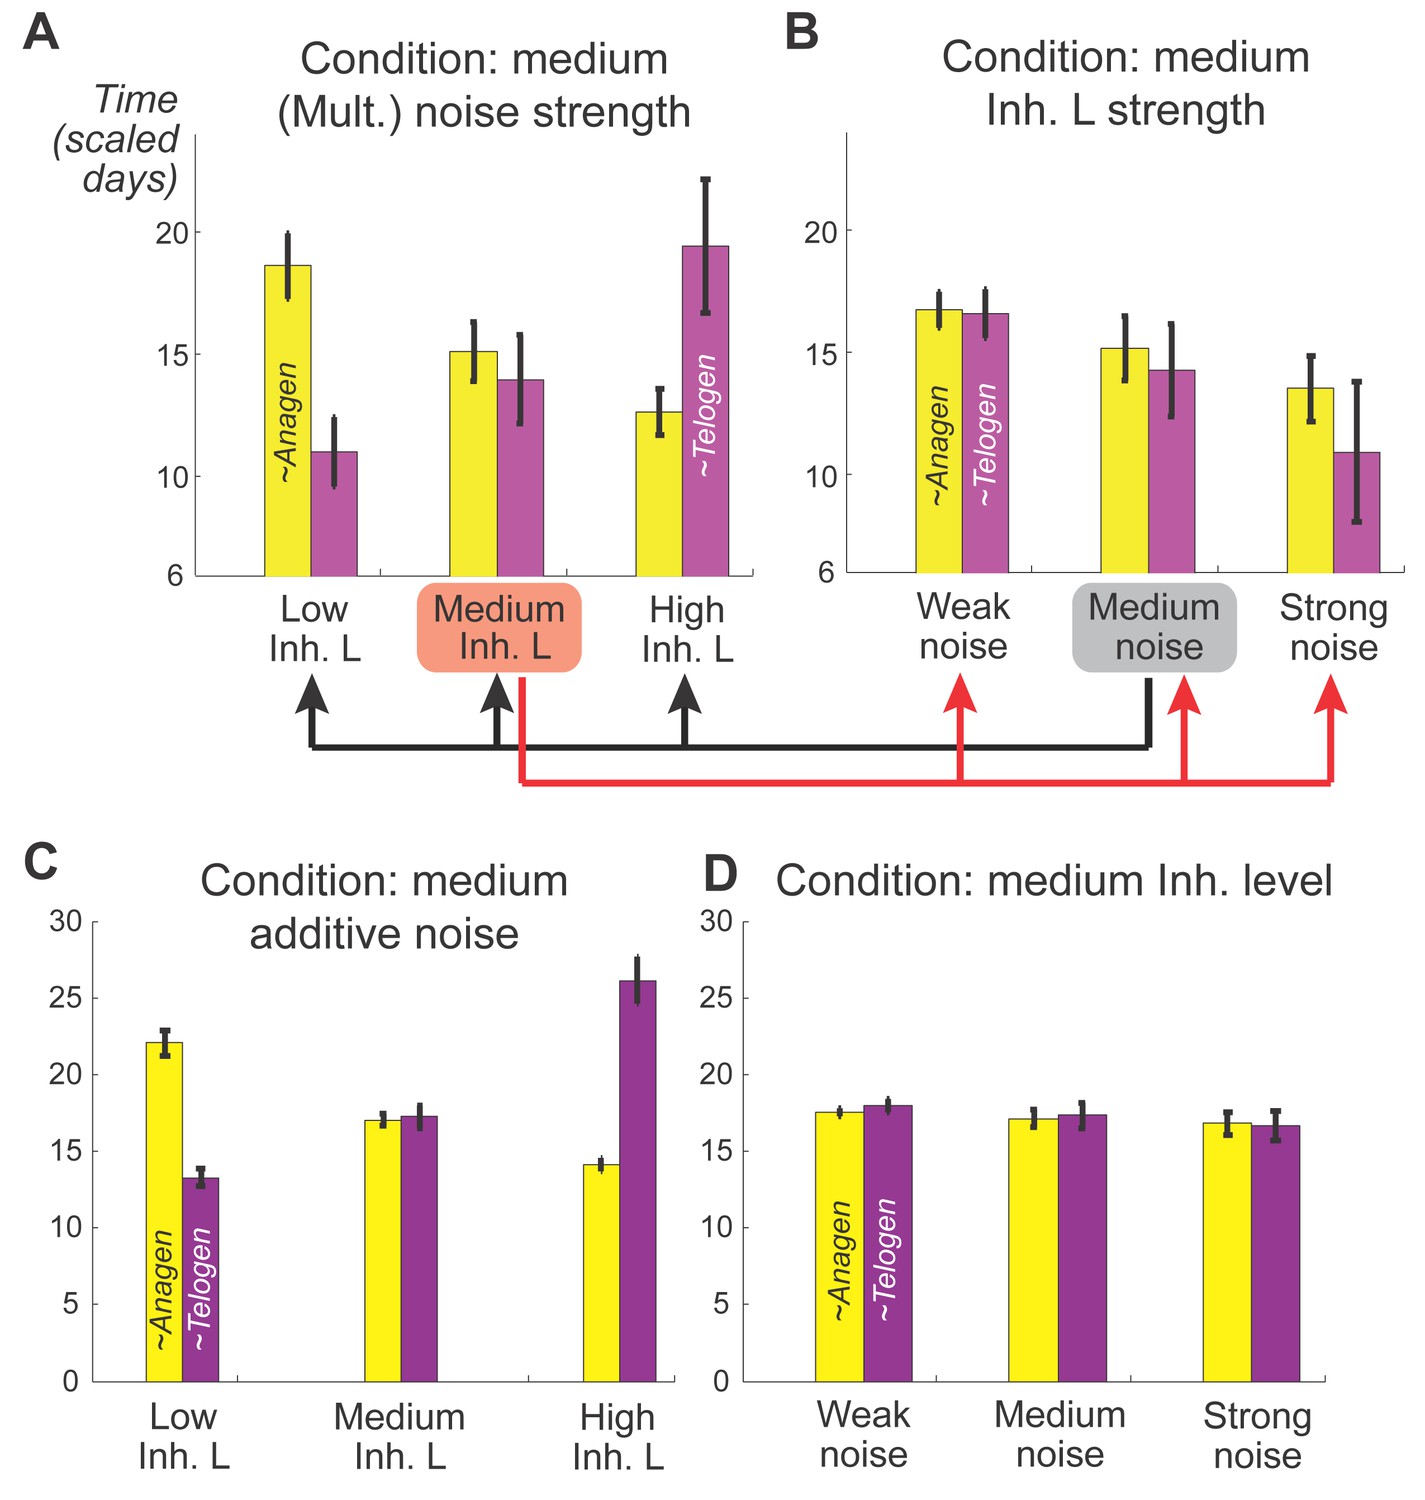
Effects of inhibitor ligand level and noise on anagen and telogen lengths.
(A, B) Mean and variances of anagen and telogen durations as functions of different inhibitor ligand levels and different levels of multiplicative noise. (A) Here, multiplicative noise of medium strength was added to both activator and inhibitor equations (Appendix 2-Equations (3, 4)). Similar changes in the mean of anagen and telogen durations as those in the noise-free simulation on Figure 1C. (B) With a medium level of inhibitory signaling, increasing the multiplicative noise strength shortens both anagen and telogen durations and increases their variances. (C, D) Mean and variances of anagen and telogen durations as functions of different inhibitor ligand levels and different levels of additive noise, the results are qualitatively the same with (A, B) obtained from mutiplicative noise. All simulations are based on 50 samples.
Appendix 2—figure 7
Dorsal-ventral interaction simulated with additive noise with noise strength .
Similar to the results obtained with multiplicative noise (Figure 2F) and biological observations, dorsal-ventral interaction lasts for mostly 2 or 3 cycles, after which it breaks into spontaneous waves showing some bilateral symmetries.
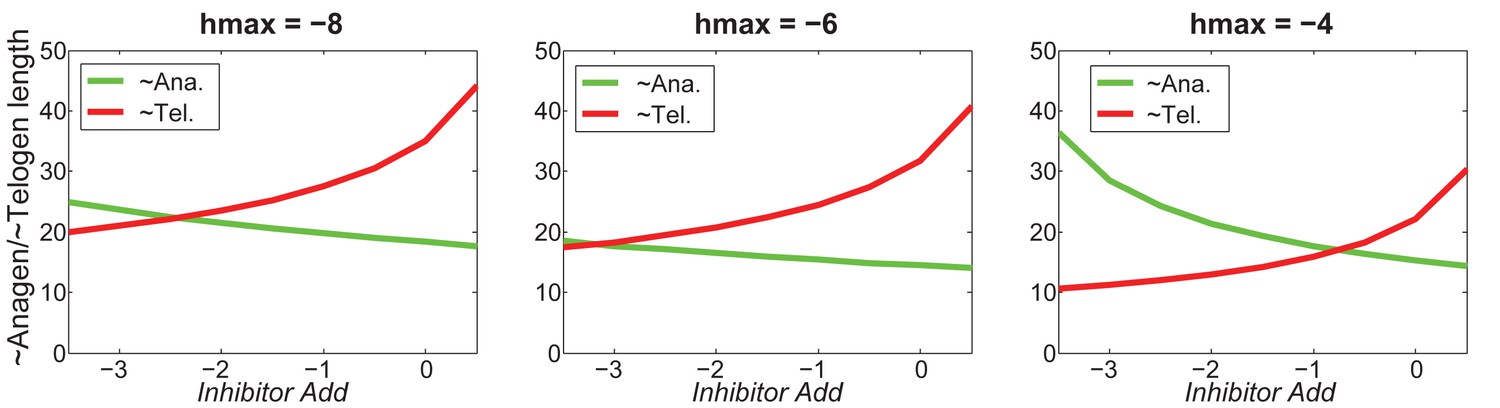
Appendix 2—figure 8
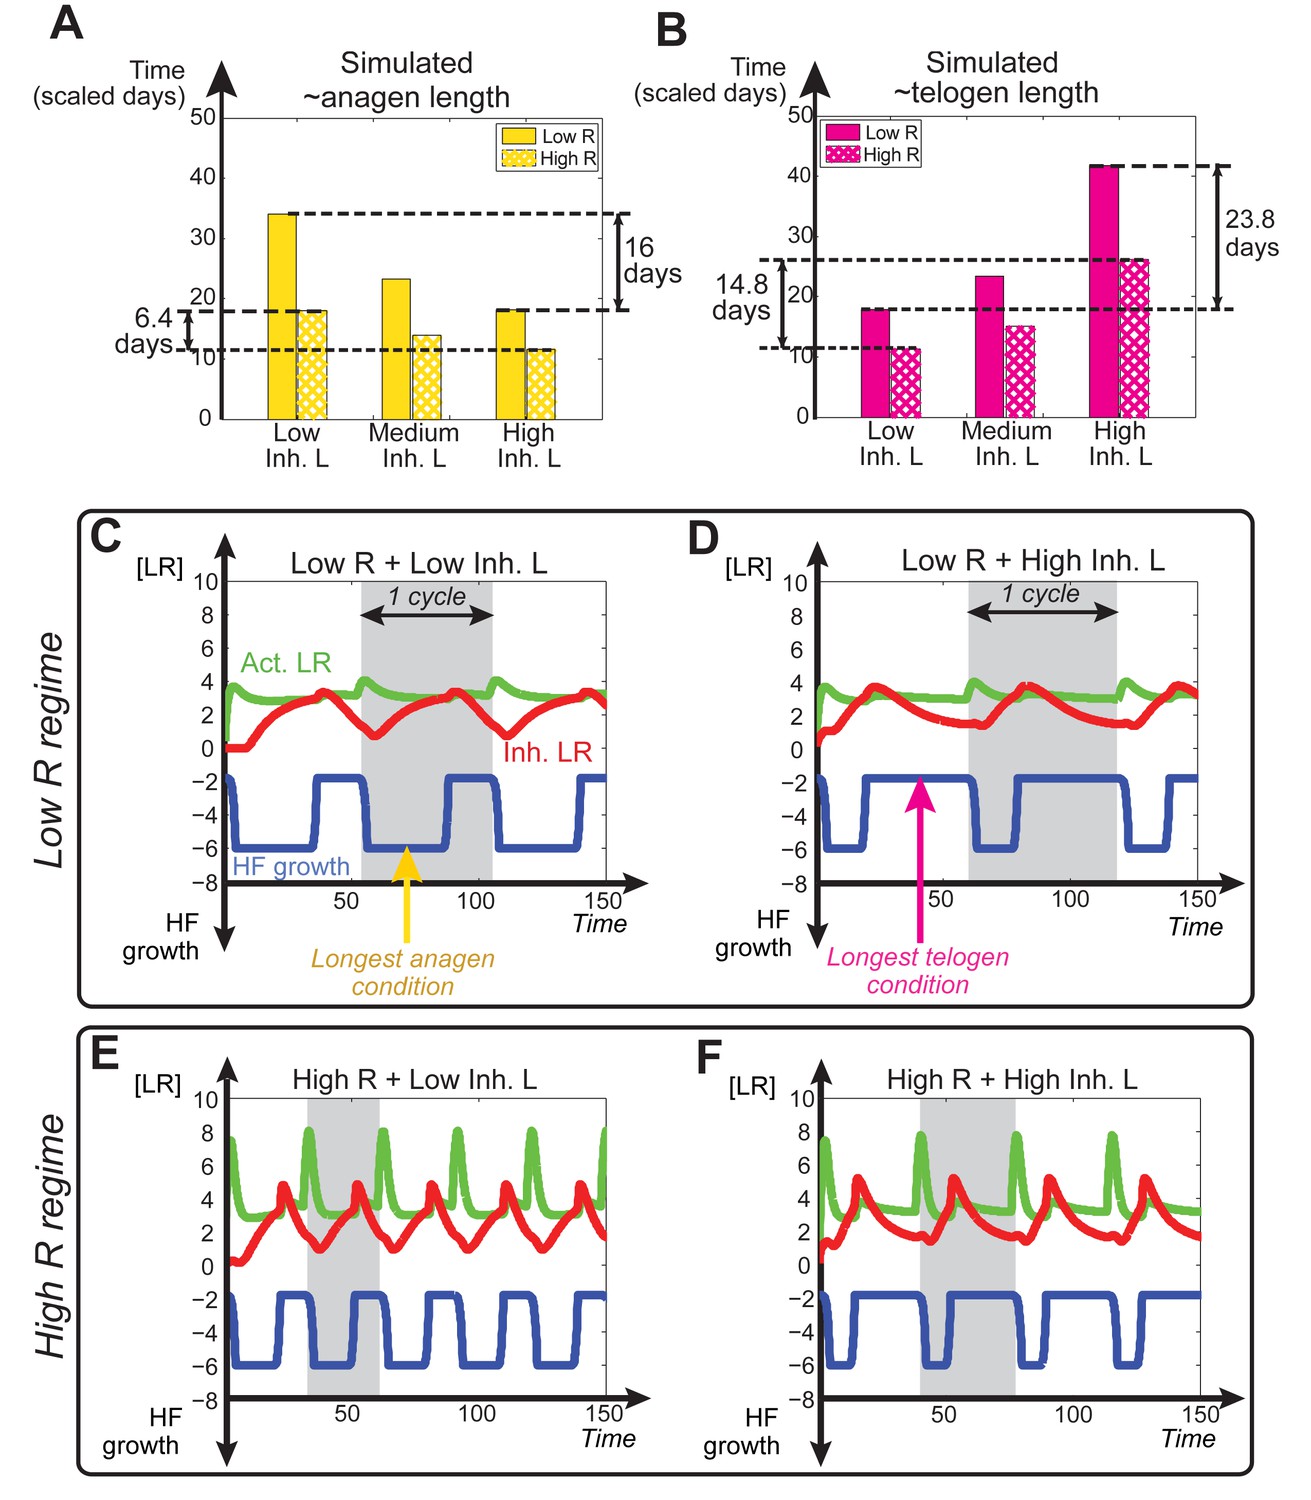
Dependence of anagen and telogen length on receptor levels.
In noise-free simulations we adjusted the levels of total available activator and inhibitor receptors ( and ). This allowed differential HF sensitivity to the same ligand level changes. (A, B) Comparative changes in anagen and telogen duration under the conditions of low (solid bars) and high levels (checkered bars) of under three different levels of inhibitor signaling. (C-F) Temporal dynamics of noise-free simulations performed using varying levels of inhibitor signaling under low (C, D) vs. high regime (E, F).
Appendix 2—figure 9

Separate roles of and on anagen and telogen lengths.
https://doi.org/10.7554/eLife.22772.051
Appendix 2—figure 10
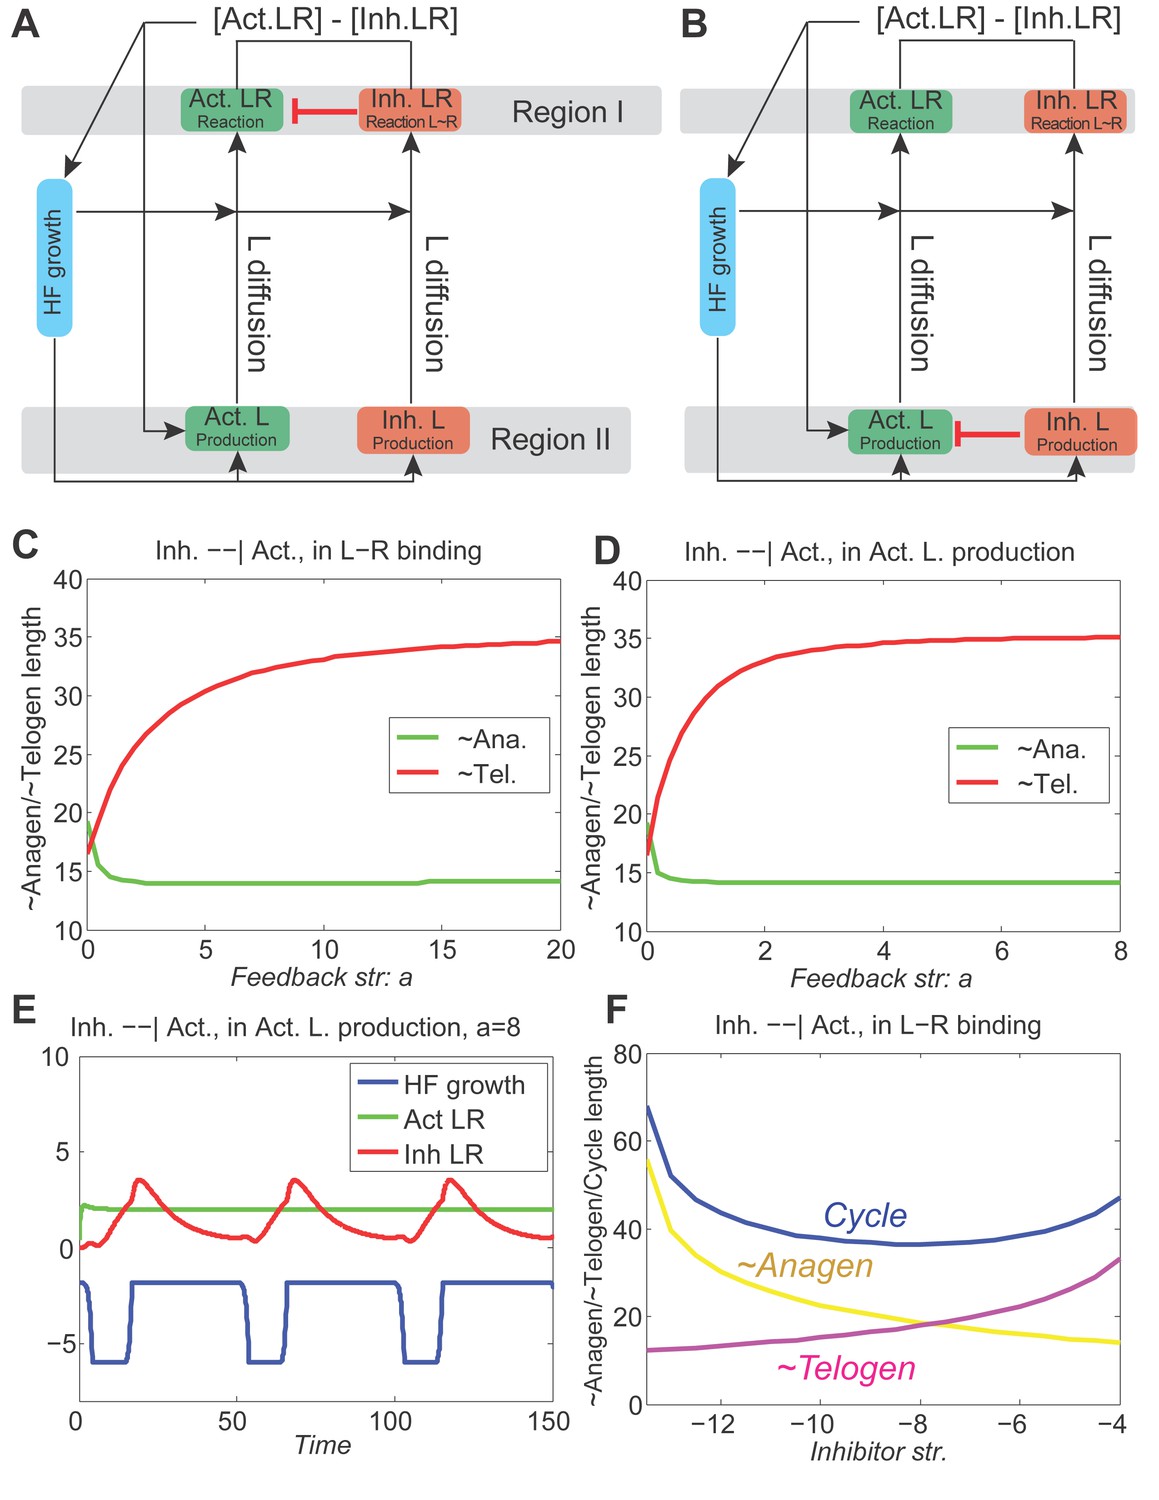
With inhibitory pathway from inhibitor to activator incorporated to the model, the dynamics are still stable.
(A, B) The inhibitor pathway is incorporated either as inhibitor LR inhibiting the activator ligand-receptor (A, Appendix 2-Equation (14)) or inhibitor ligands inhibiting the production of activator ligands (B, Appendix 2-Equation (15)). (C, D) In either type of inhibitory pathway, anagen (green line) is shortened and telogen (red line) is lengthened; moreover, as the inhibition becomes stronger (larger ), anagen length quickly drops to a minimum while telogen gradually reaches a maximum. (E) With very strong inhibition, the activator LR is pushed almost flat while the inhibitor LR still shows the hill-valley pattern, however, the HF growth (blue line) still cycles. (F) With the inhibitory pathway incorporated into our model (in the activator ligand-receptor binding with strength ), changing the inhibitor ligand levels affects the anagen, telogen and cycle lengths in a qualitative similar way as no pathway incorporated (Figure 1C), although the excitable regime is being switched from down to .
Appendix 2—figure 11
2D simulation of dorsal HF waves, when all HFs have equal probability of anagen initiation, allowing spontaneous anagen initiations.
https://doi.org/10.7554/eLife.22772.053
Appendix 2—figure 12

3D simulation of dorsal HF waves, when all HFs have equal probability of anagen initiation, allowing spontaneous anagen initiations.
Here we see spontaneous anagen initiations over the dorsal domain from the very first cycle, against the experimental observations of early head-to-tail wave degenerating into later spontaneous initiations showing some bilateral symmetries. The full time course is shown in Appendix 2—video 1. See Appendix 2—tables 1 - 3 and 5 for parameter values, except .
Appendix 2—figure 13

2D (A) and 3D (B) simulations of dorsal HF waves, when HFs near the head have higher build-in levels of activator signaling.
Here we see highly successive steady waves characterized as the ‘target-like wave’ pattern, also against experimental observations. The full time course of the 3D simulation is shown in Appendix 2—video 2. See Appendix 2—tables 1 - 3 and 5 for parameter values, except and in the 3D simulation 13B.
Appendix 2—figure 14
2D simulation of dorsal HF waves, when HFs near the head have build-in temporal phase advancement.
https://doi.org/10.7554/eLife.22772.056
Appendix 2—figure 15
3D modeling of HF growth pattern evolution with head-to-tail hair cycle asynchrony.
Initial asynchrony was introduced into the field by assigning a group of HFs on one end with a one-time increase in activator ligands. Simulations faithfully reproduce head-to-tail asynchrony of the first few cycles. However, this asynchrony fails to degrade quickly, and persists during multiple consecutive cycles. In addition, no clear bilateral symmetry is observed. This differs from rapid HF growth pattern evolution observed in mice. Also see Appendix 2—video 3 and see Appendix 2—tables 1 - 3 and 5 for parameter values, except .
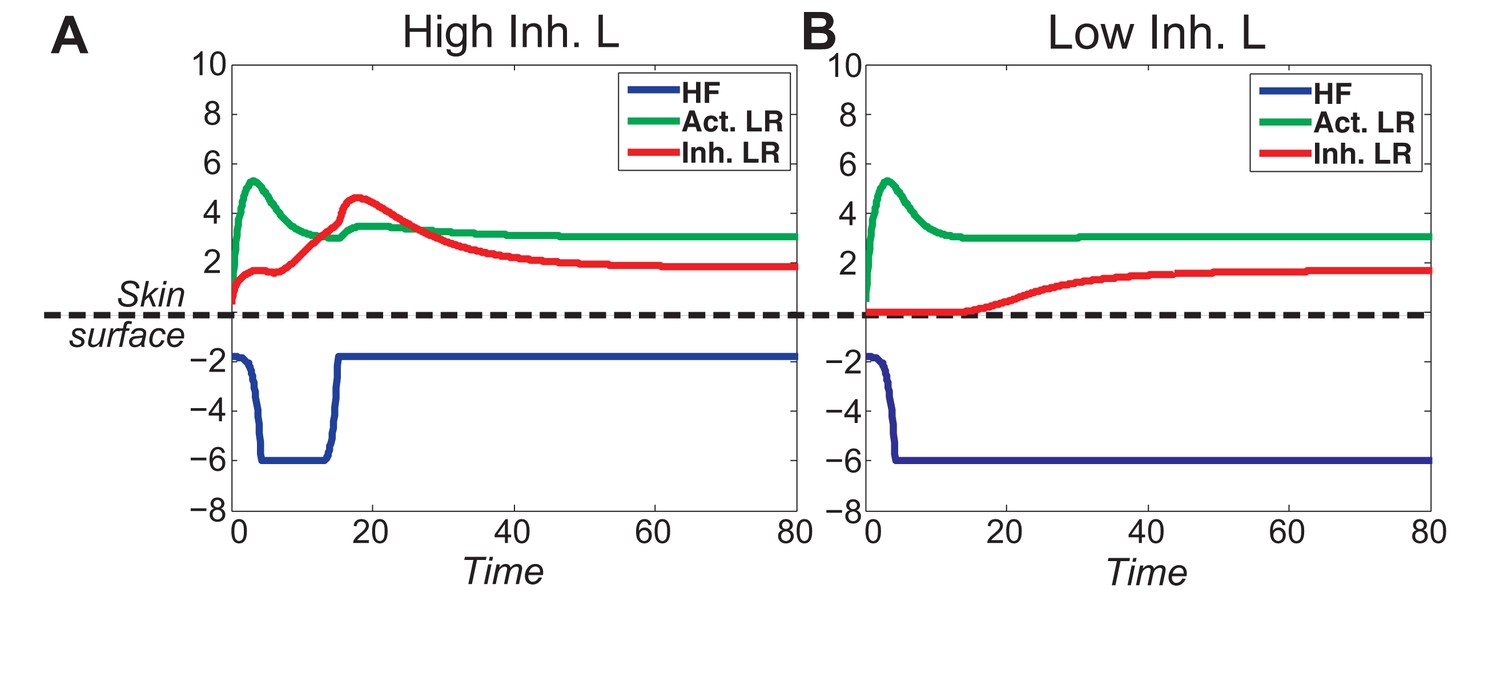
Appendix 2—figure 16
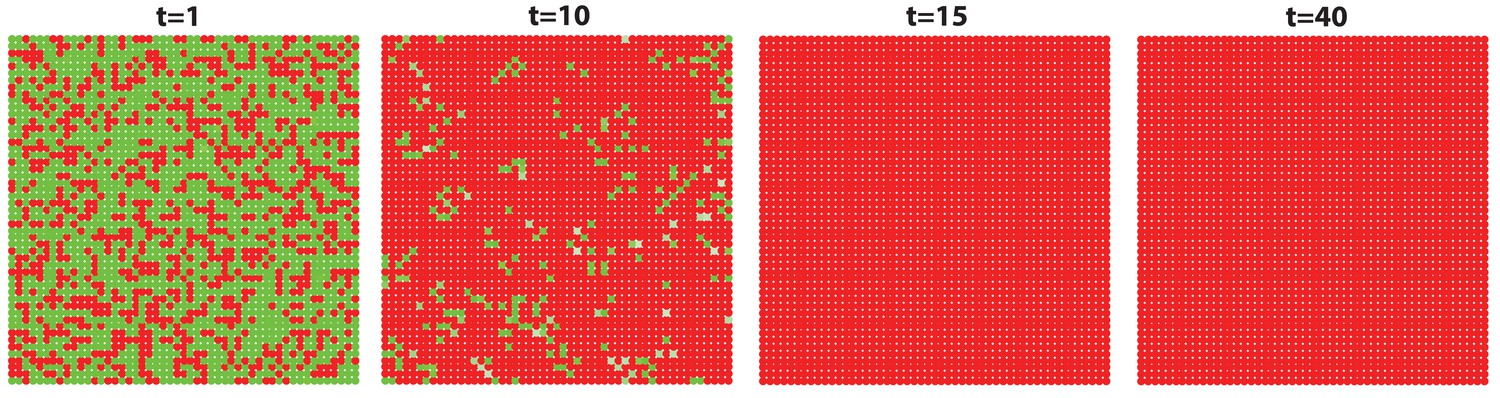
The high level of inhibitor in ear skin results in hair cycling stops and HFs equilibrate in an extended telogen.
Inhibitor level is high in this whole hyper-refractory domain. Since initially the activator level is slightly higher than later, noise is able to randomly initiate the first HF growth cycle. After that, HFs stay in an extended telogen. See Appendix 2—tables 1 - 3 and 5 for parameter values, except , , and given by Appendix 2-Equation (16).
Appendix 2—figure 17
Anagen waves spreading from dorsal skin could not propagate into the ear skin due to the hyper-refractory state.
We simulate a domain of dorsal skin, with a small patch (the region inside the box) having high inhibitor level in simulating the hyper-refractory ear skin. Steady HF waves propagate through the dorsal region for several cycles together with a few stochastic initiations, however, no HF wave is able to propagate into the ear skin due to the hyper-refractory state.
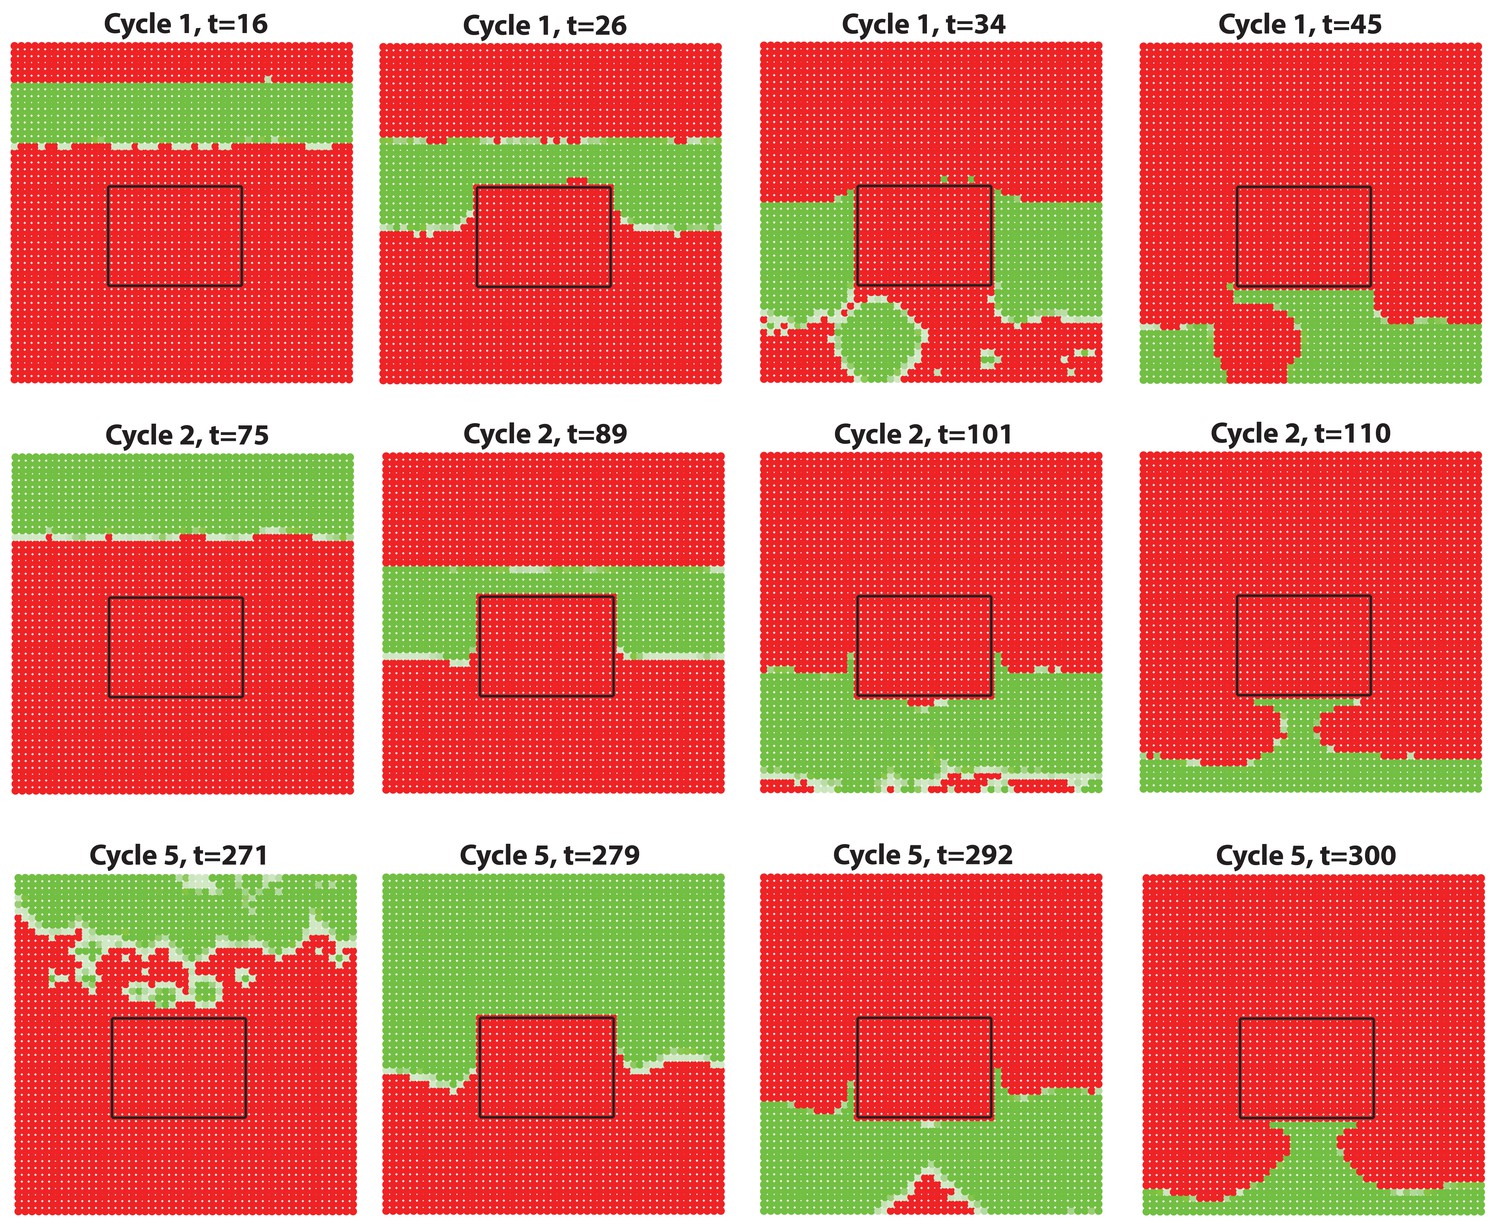
Appendix 2—figure 18
Simulation results of a wave-breaker region where HF growth is disabled while molecules are still allowed to diffuse in this region.
The growth-impaired region creates a distortion-like effect, which breaks the HF growth wave propagating.
Appendix 2—figure 19
Increasing greatly increases telogen length, slightly increases anagen length.
https://doi.org/10.7554/eLife.22772.061
Appendix 2—figure 20

For different values of , increasing inhibitor level will always result in shorter anagen and longer telogen, although to different extents.
https://doi.org/10.7554/eLife.22772.062
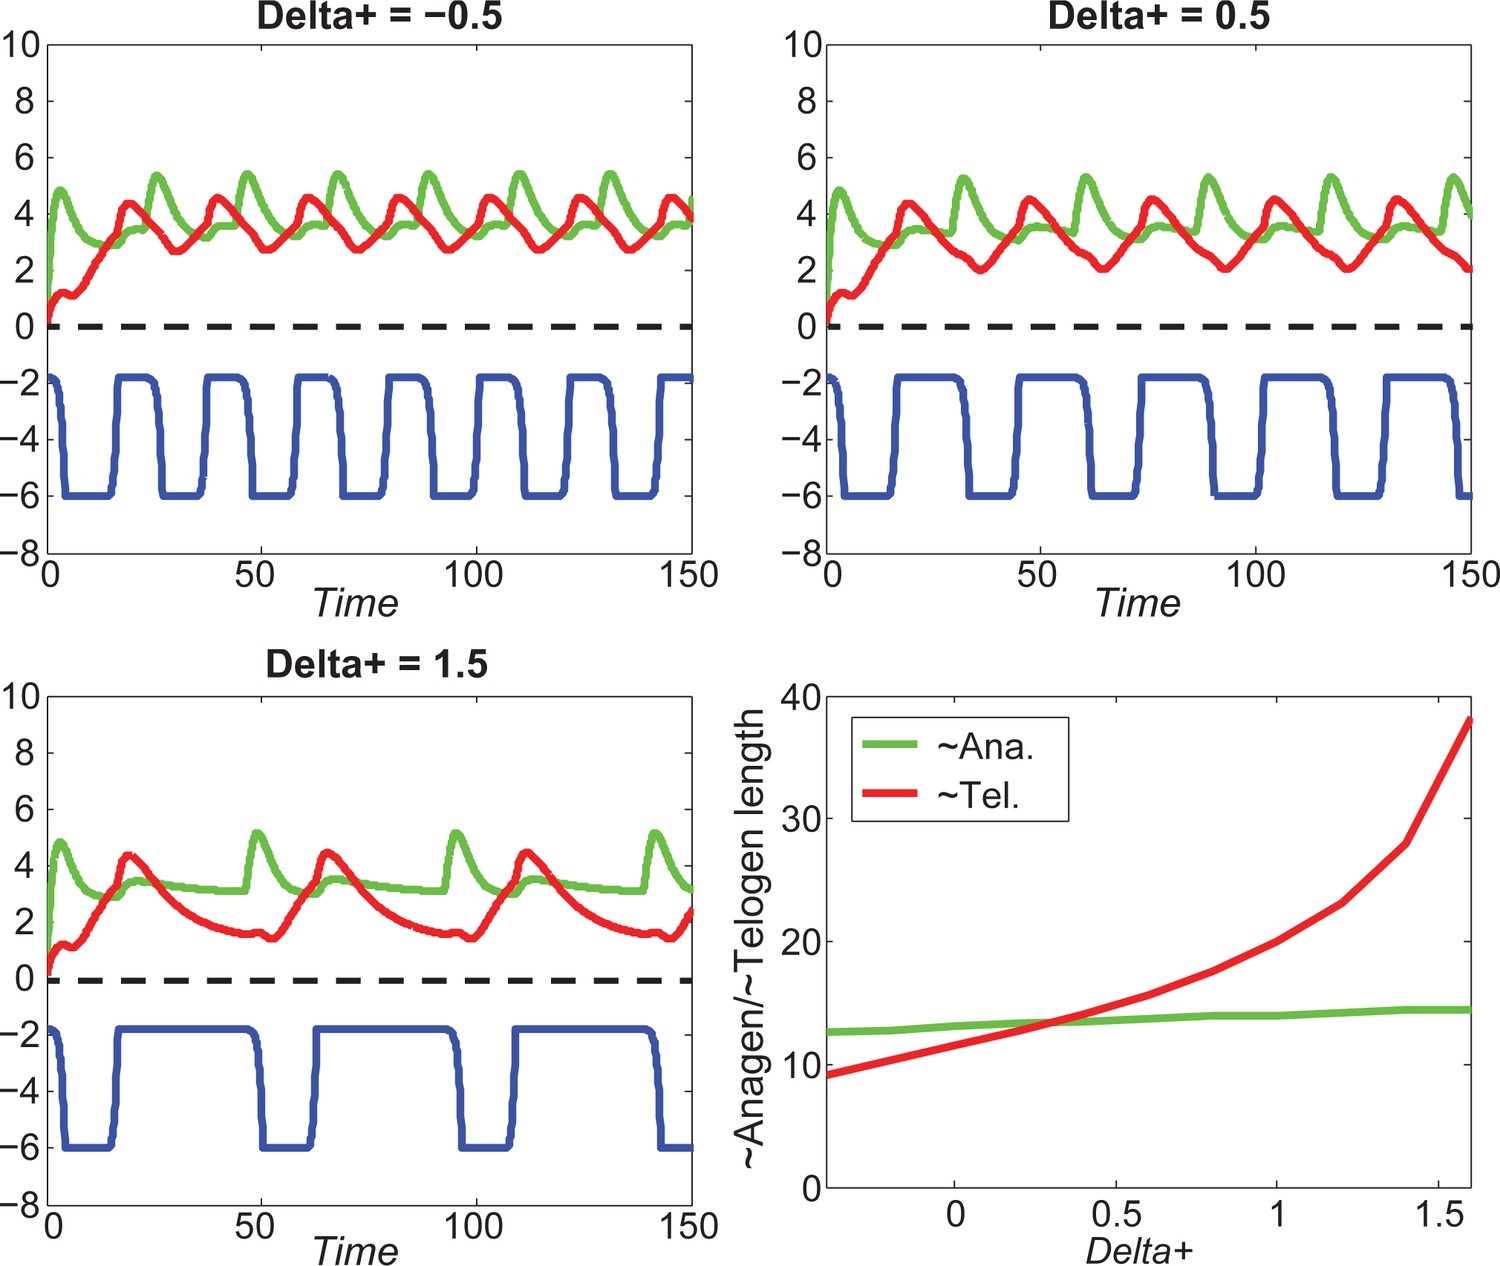
Appendix 2—figure 21
At the single HF level, increasing greatly decreases anagen length while slightly decreasing telogen length.
https://doi.org/10.7554/eLife.22772.063
Appendix 2—figure 22
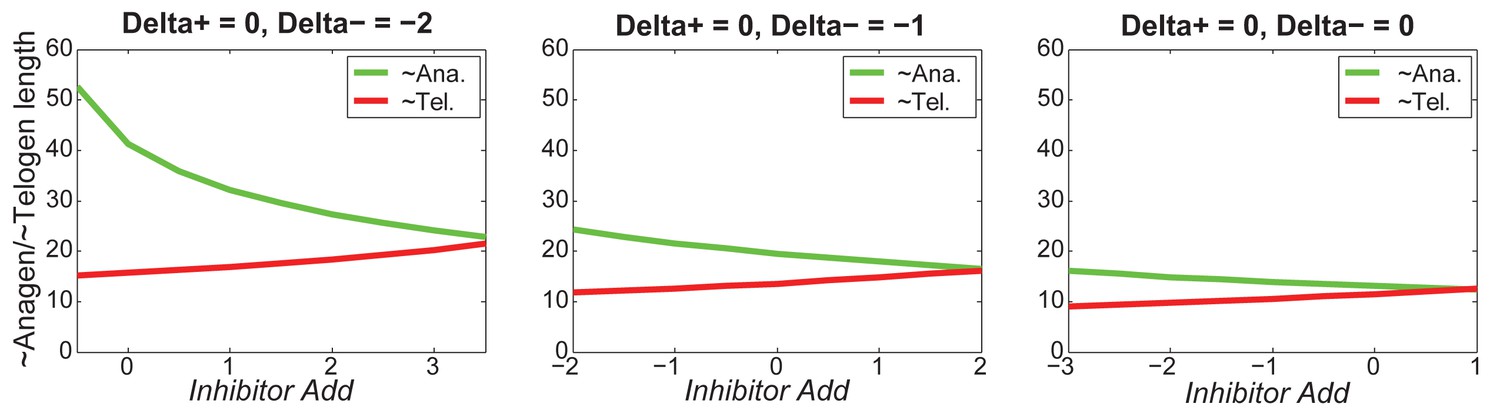
For different values of , increasing inhibitor level will always result in shorter anagen and longer telogen, although to different extents.
https://doi.org/10.7554/eLife.22772.064
Appendix 2—figure 23
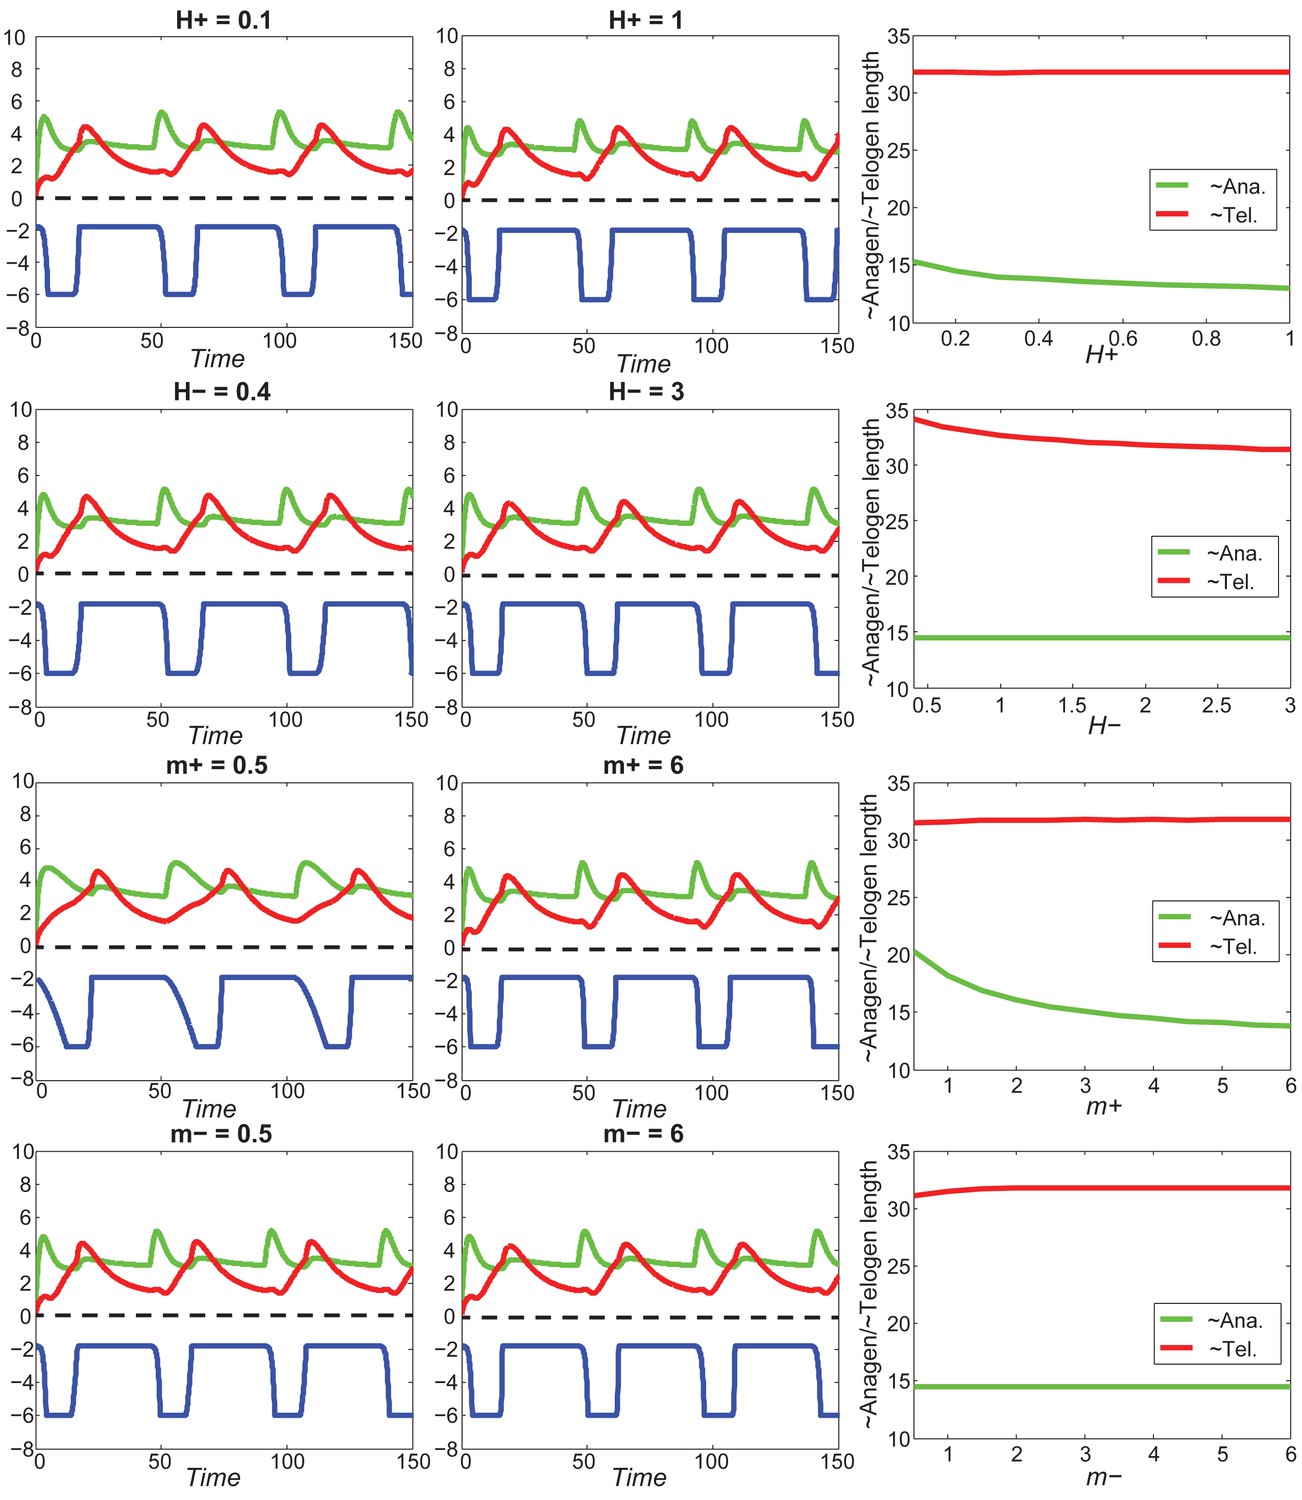
With fixed activator and inhibitor levels, changing either of the four parameters () has little effect on anagen/telogen length.
https://doi.org/10.7554/eLife.22772.065
Appendix 2—figure 24
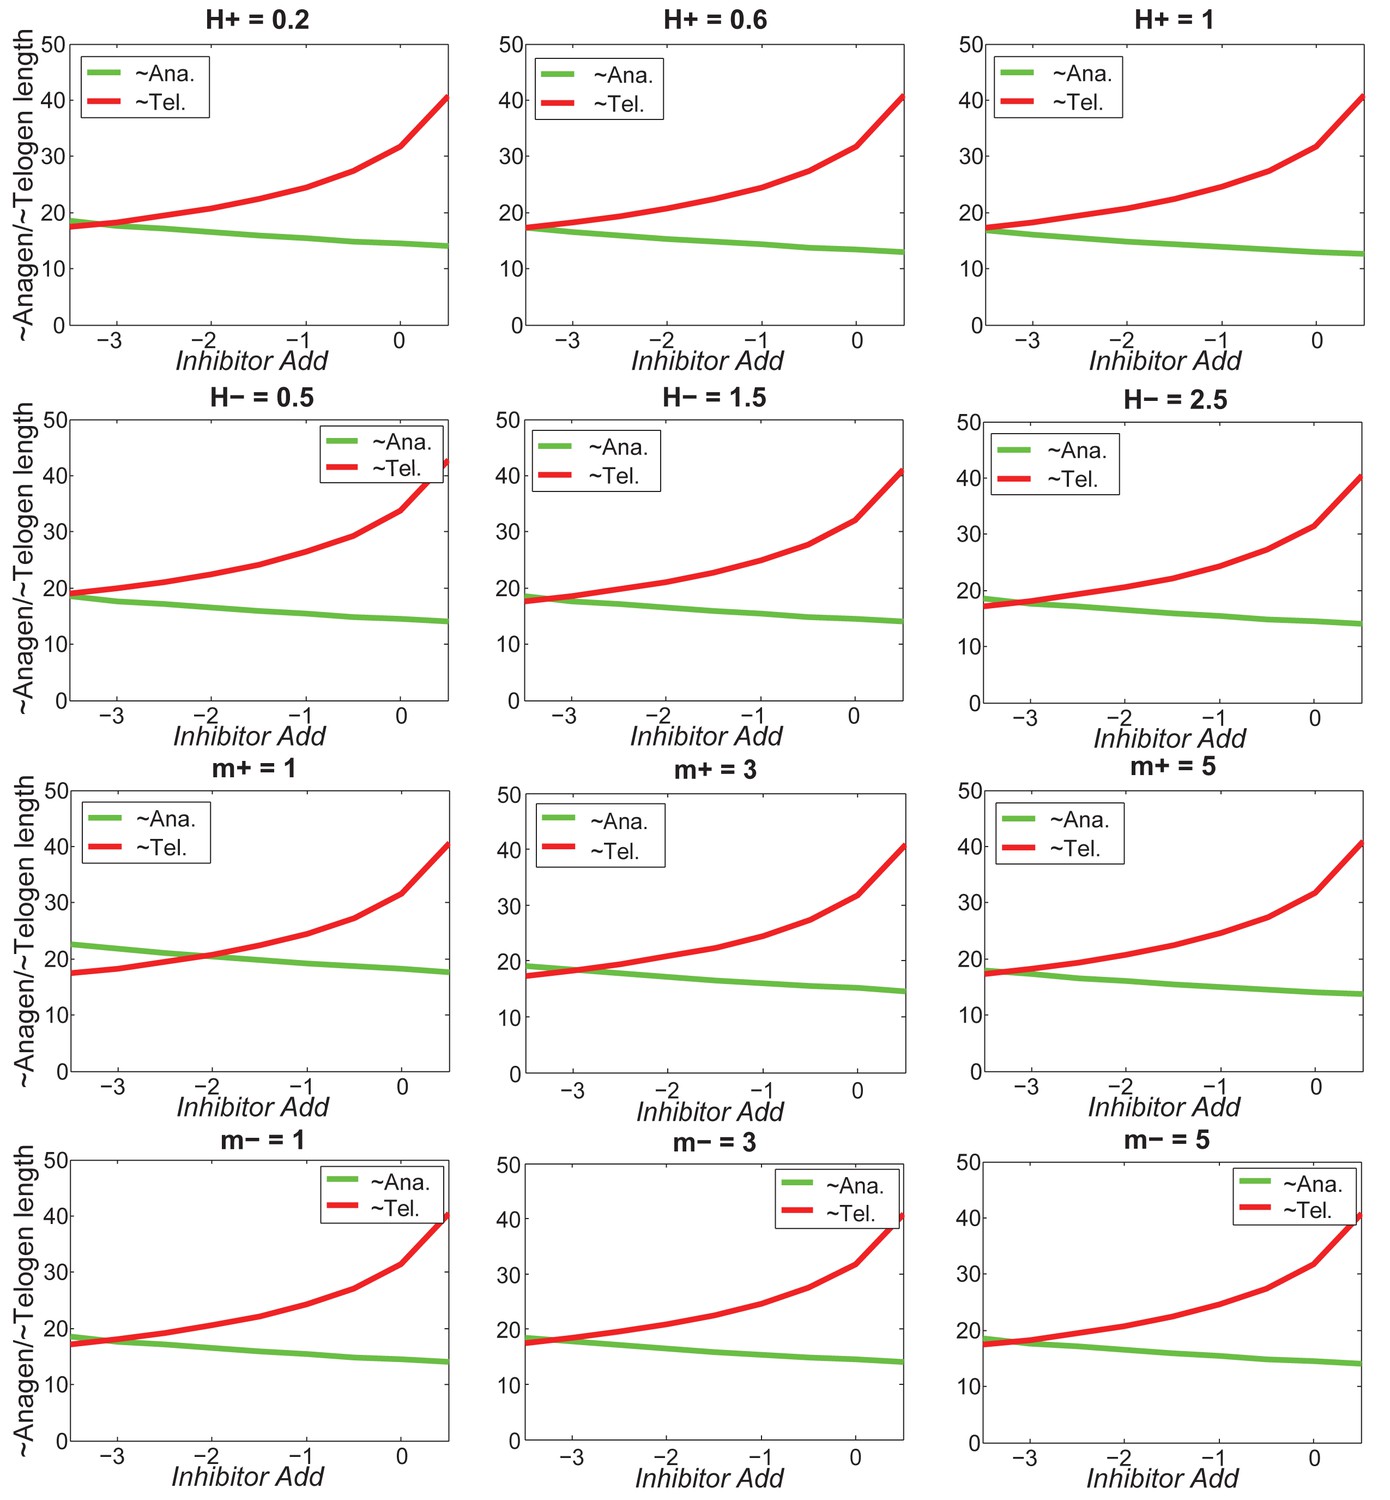
Increasing inhibitor level will always result in shorter anagen and longer telogen, and the pattern does not change much under different values of .
https://doi.org/10.7554/eLife.22772.066
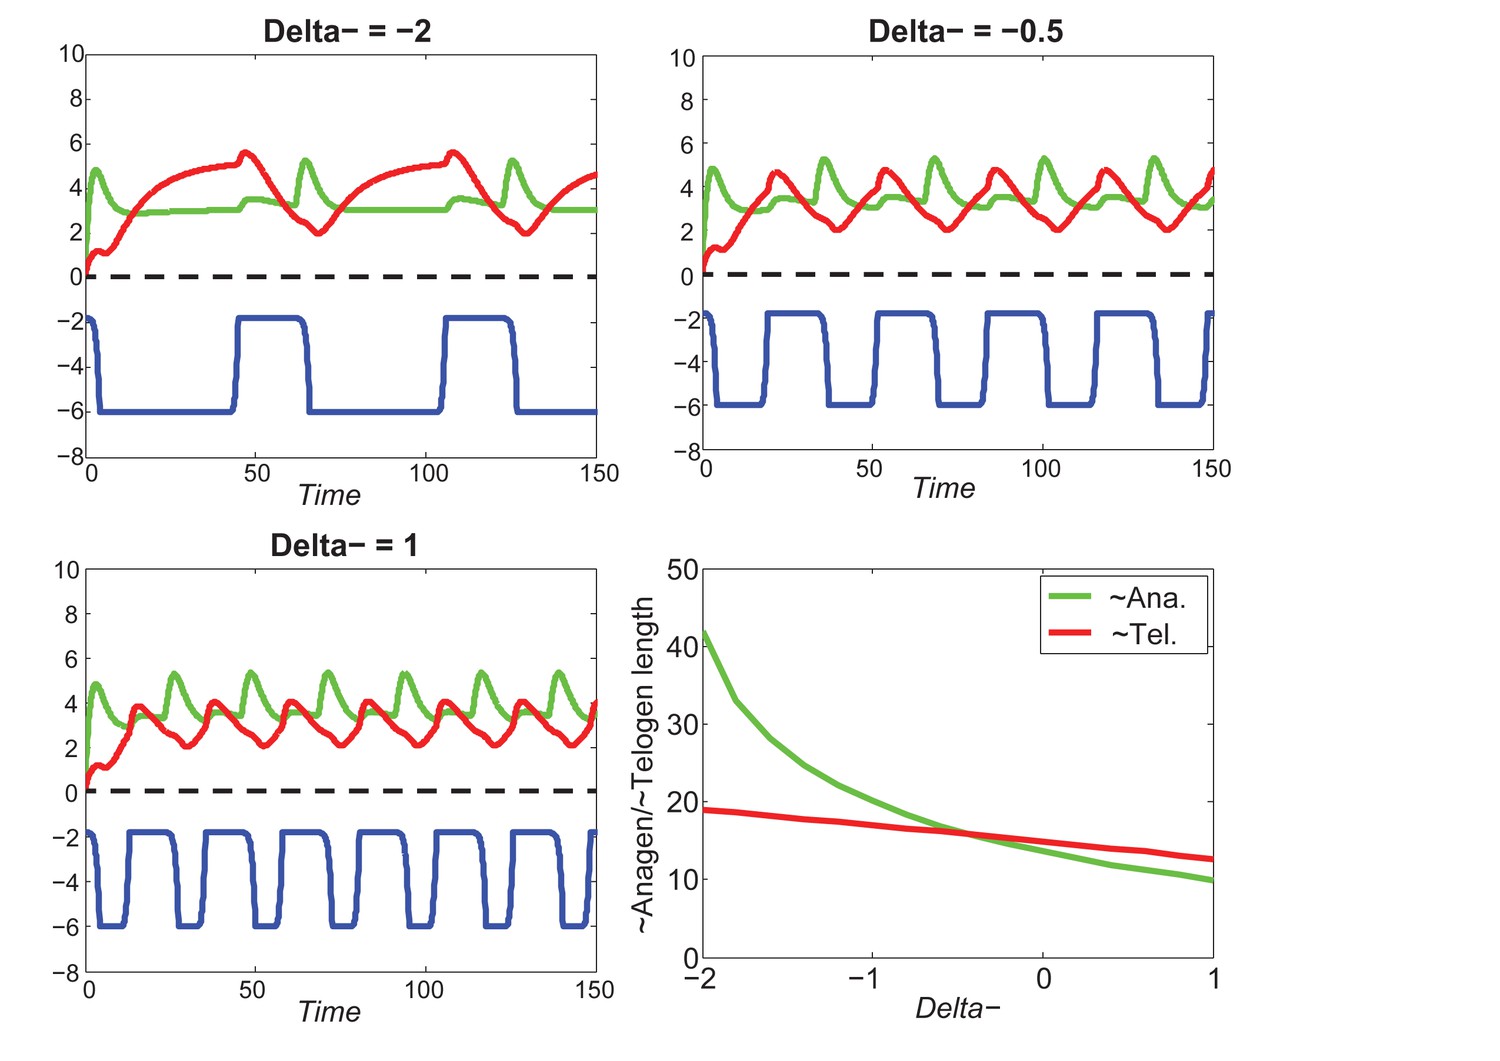
Appendix 2—figure 25
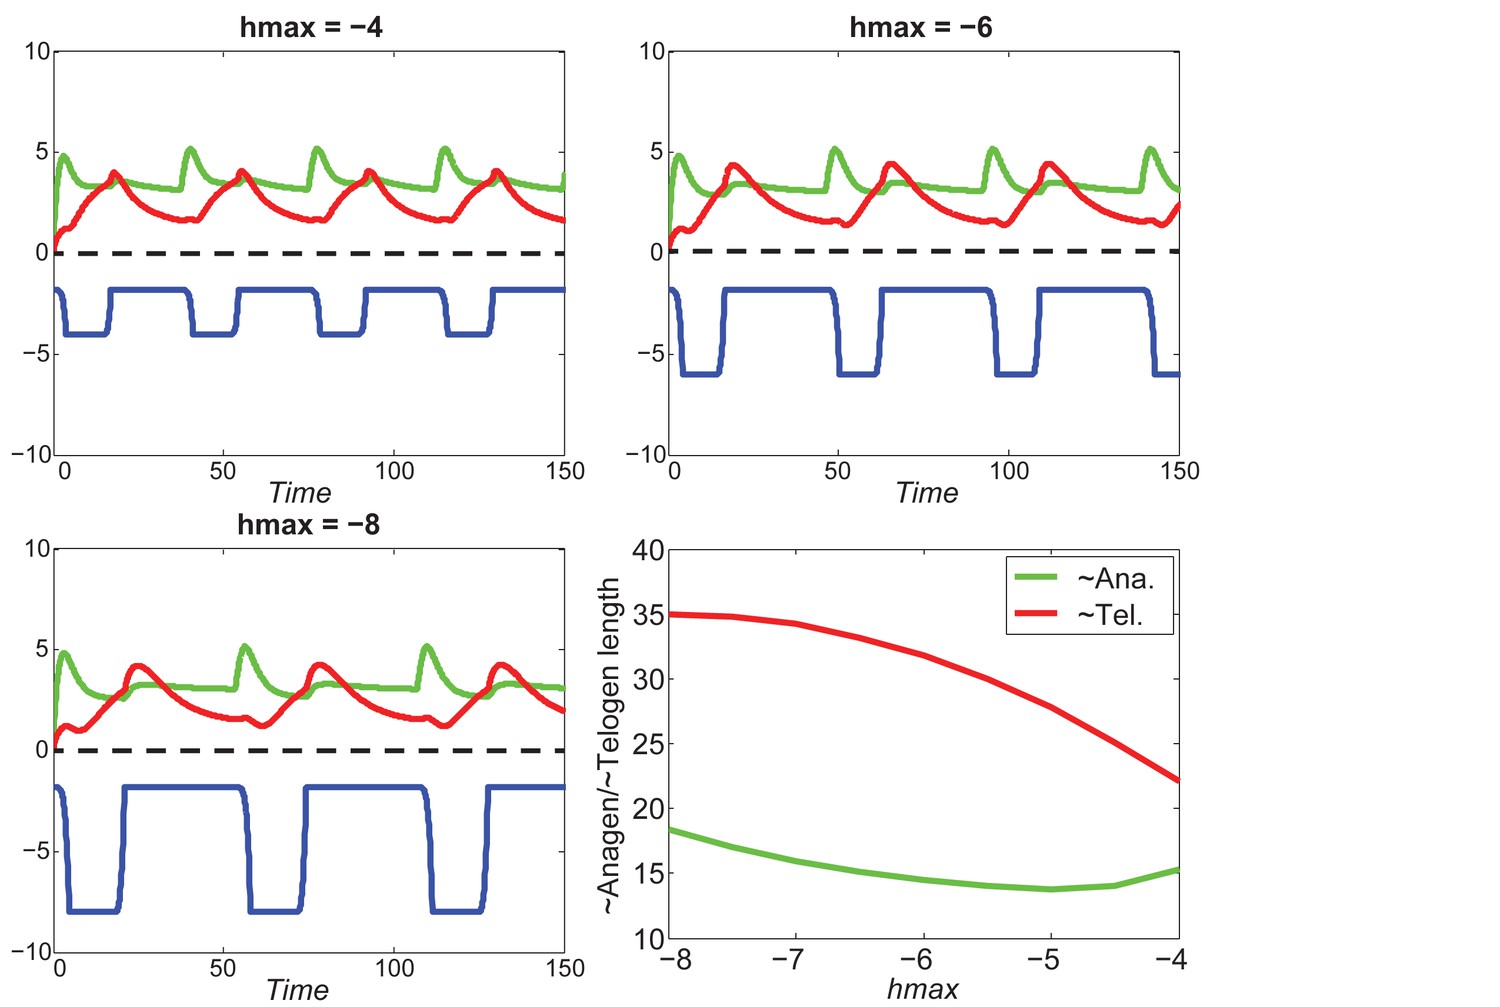
At the single HF level, increasing will shorten telogen length, and will also shorten anagen length within a certain region.
https://doi.org/10.7554/eLife.22772.067
Appendix 2—figure 26
For different values of , increasing inhibitor level will always result in shorter anagen and longer telogen, although to different extents.
https://doi.org/10.7554/eLife.22772.068
Appendix 2—figure 27

Larger (i.e., longer HF) results in a longer wave interval (B) and a wider wave (C), but the wave speed is hardly affected (A).
Simulations are noise-free, on a uniform domain, with two values of or .
Appendix 2—figure 28

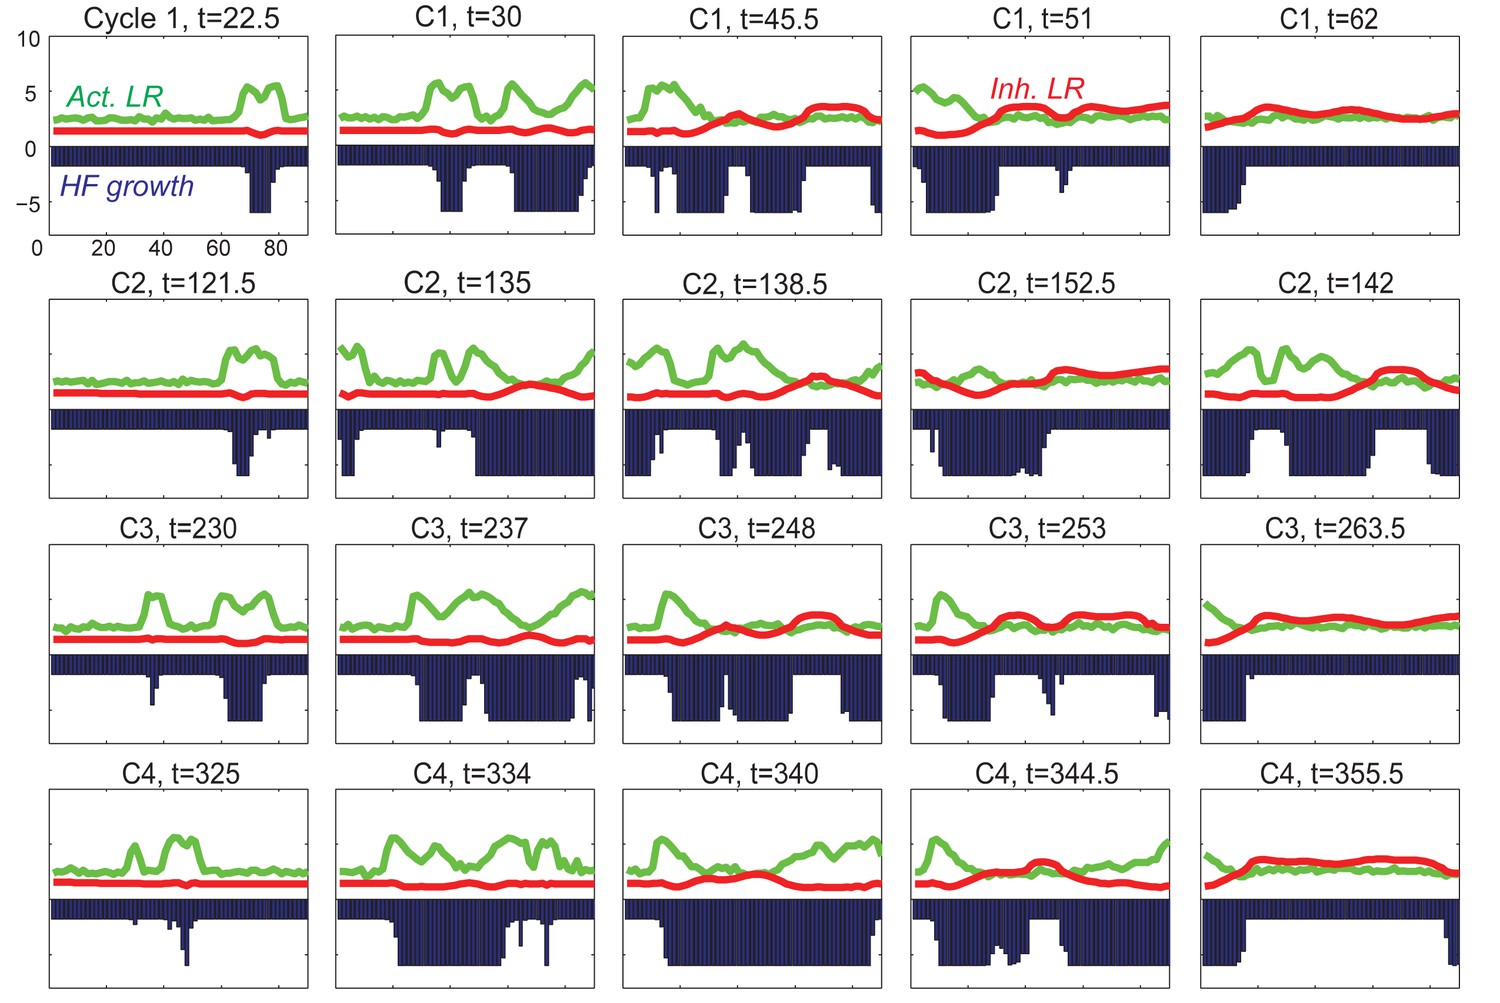
Dorsal-ventral interaction with for the dorsal while for the ventral.
First few HF waves behave similar to Figure 2F where for the dorsal while . However, with the 15/20 profile, there is no clear delay between dorsal and ventral HF wave development during later cycles.
Appendix 2—figure 29

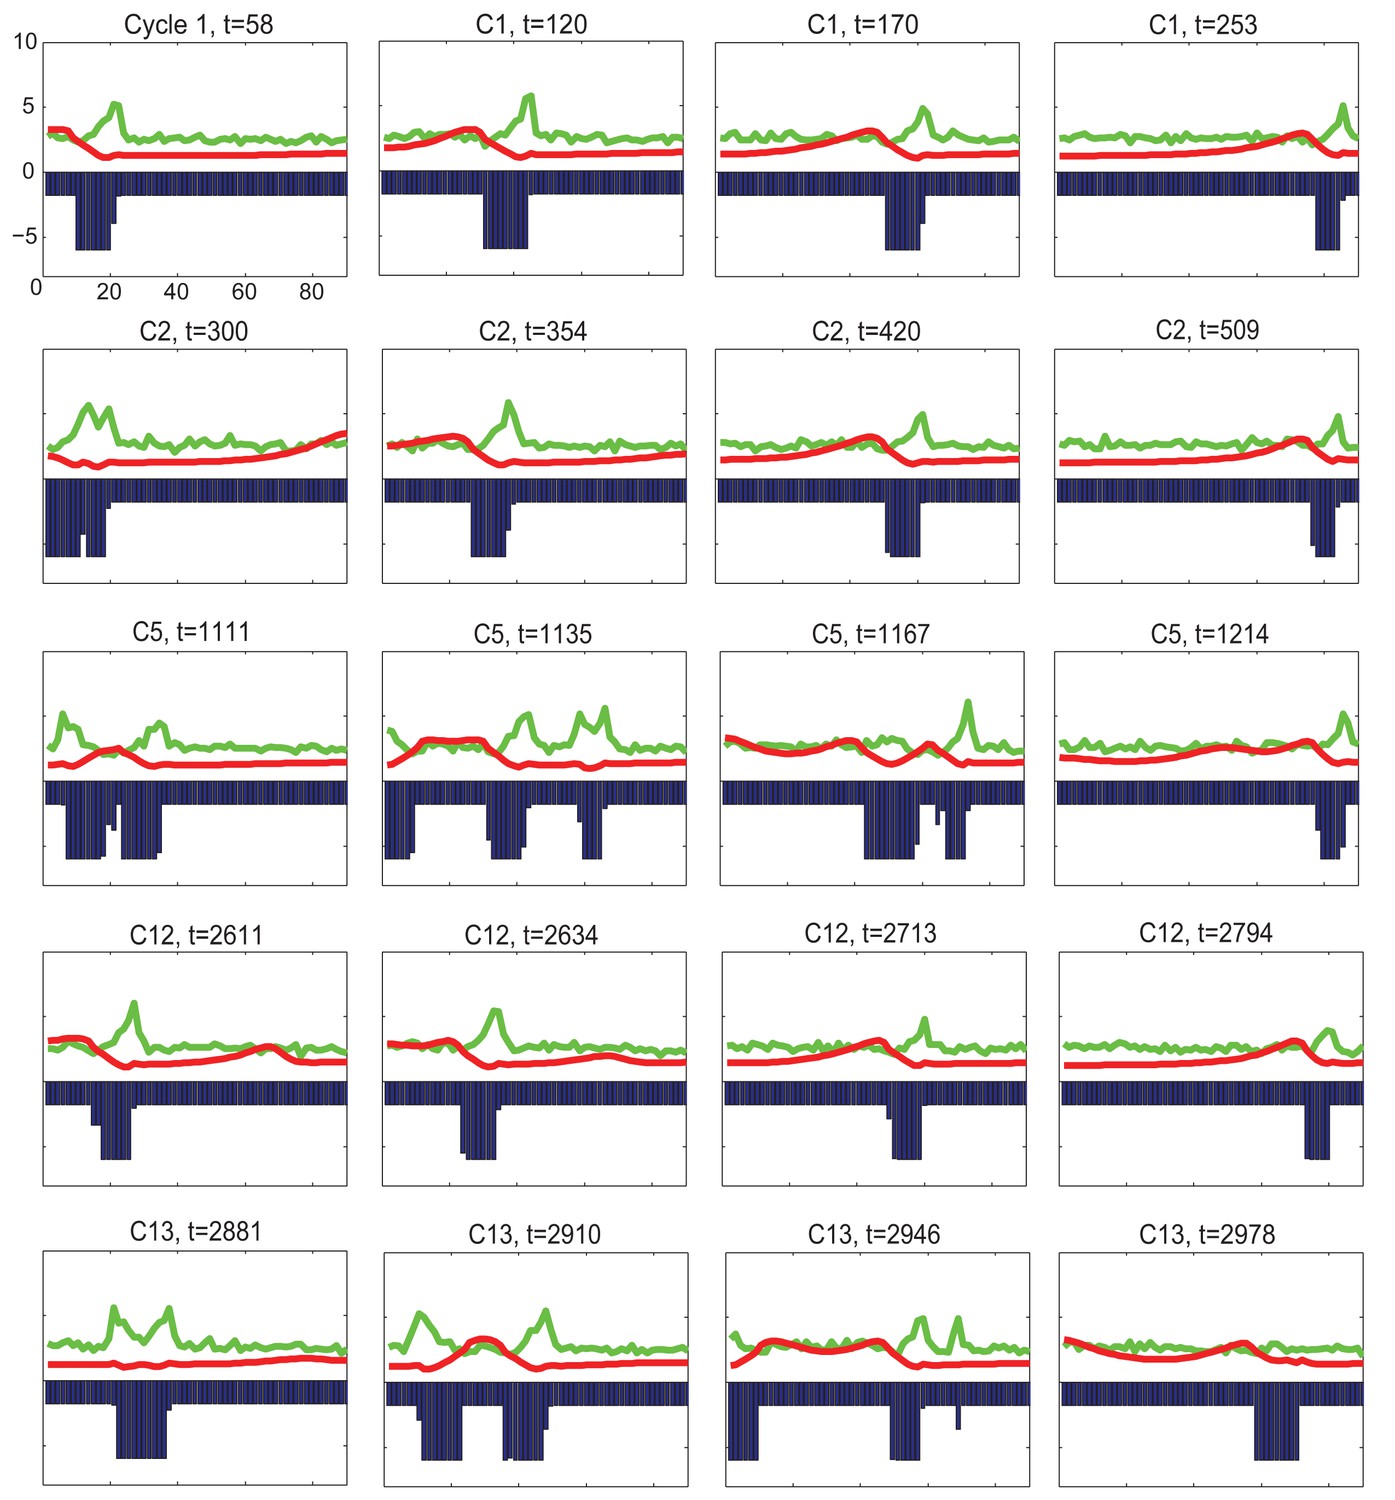
Dorsal-ventral interaction with for the dorsal while for the ventral.
First few HF waves behave similar to Figure 2F where for the dorsal while . With the 15/30 profile, there is a little delay between dorsal and ventral HF wave development during later cycles.
Appendix 2—figure 30
Dorsal-ventral interaction with for the dorsal while for the ventral.
First few HF waves behave similar to Figure 2F where for the dorsal while . With the 15/40 profile, there is clearly a delay between dorsal and ventral HF wave development during later cycles.
Appendix 2—figure 31
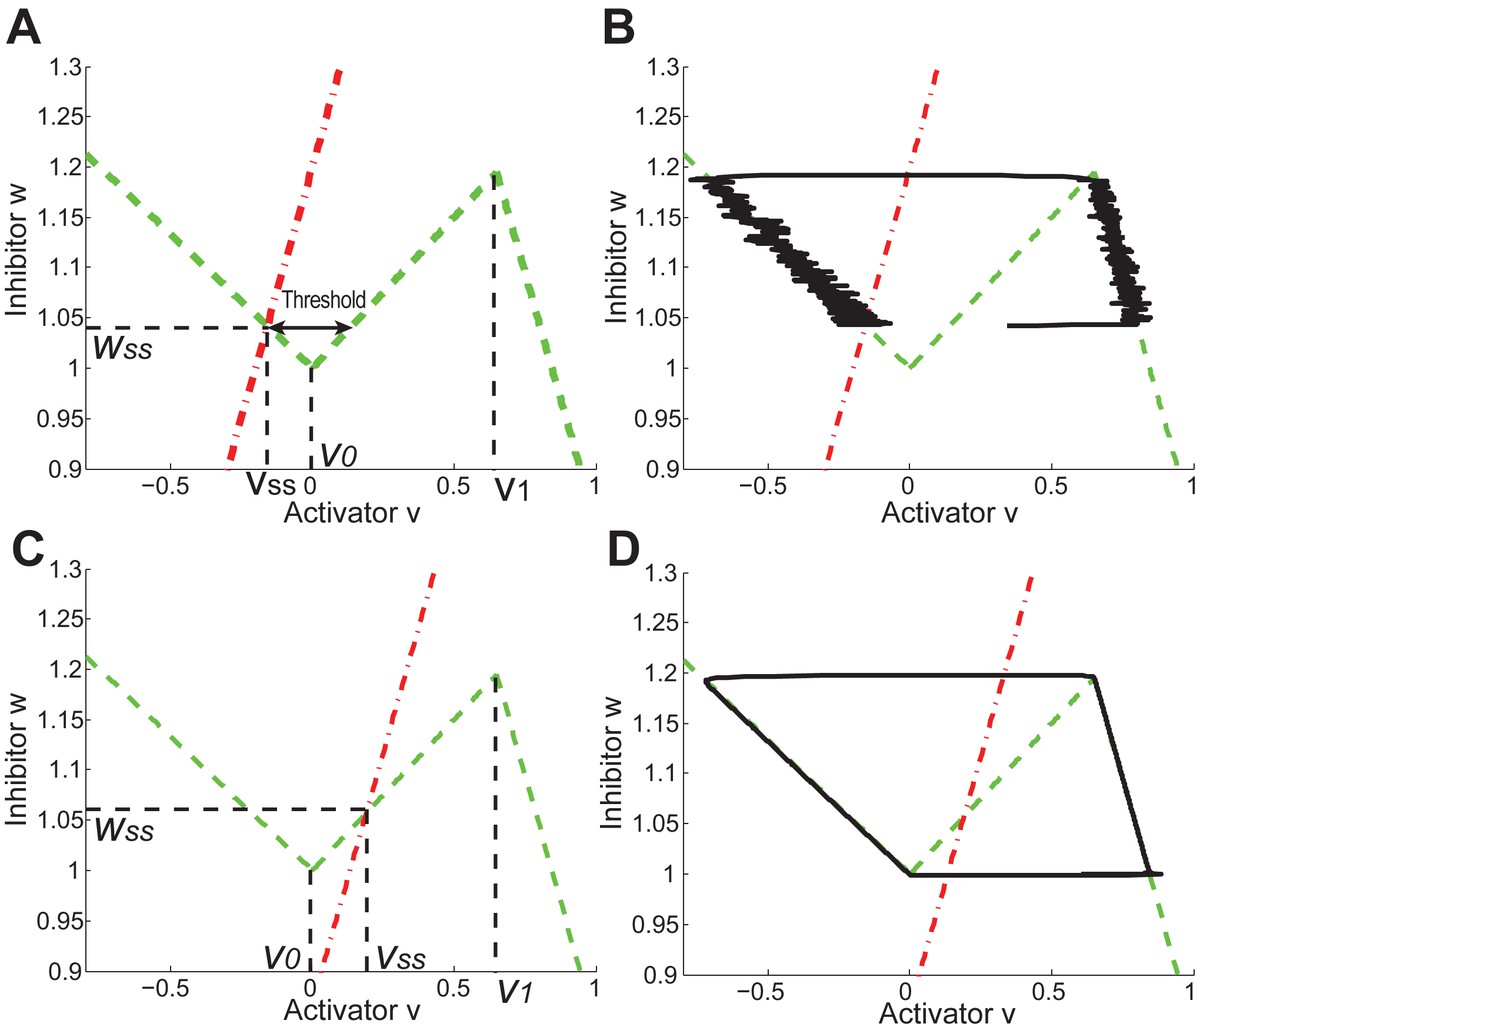
Periodic and excitable regimes in the FHN model.
(A) Nullcline (red dash-dot line) intersects with (green dash line) in its first piece . The system is excitable in this case. (B) With nullclines shown in (A), it requires strong enough noise to pass over the threshold so end the competent telogen. When noise is not strong enough, the system stays in competent telogen for a long time. Stochastic trajectory (black line) presented. (C) Nullcline (red dash-dot line) intersects with (green dash line) in its second piece . The system is periodic in this case. (D) With nullclines shown in (C), the system undergoes cyclic dynamics automatically without help from noise, as there is no threshold to pass over. Deterministic trajectory (black line) presented.
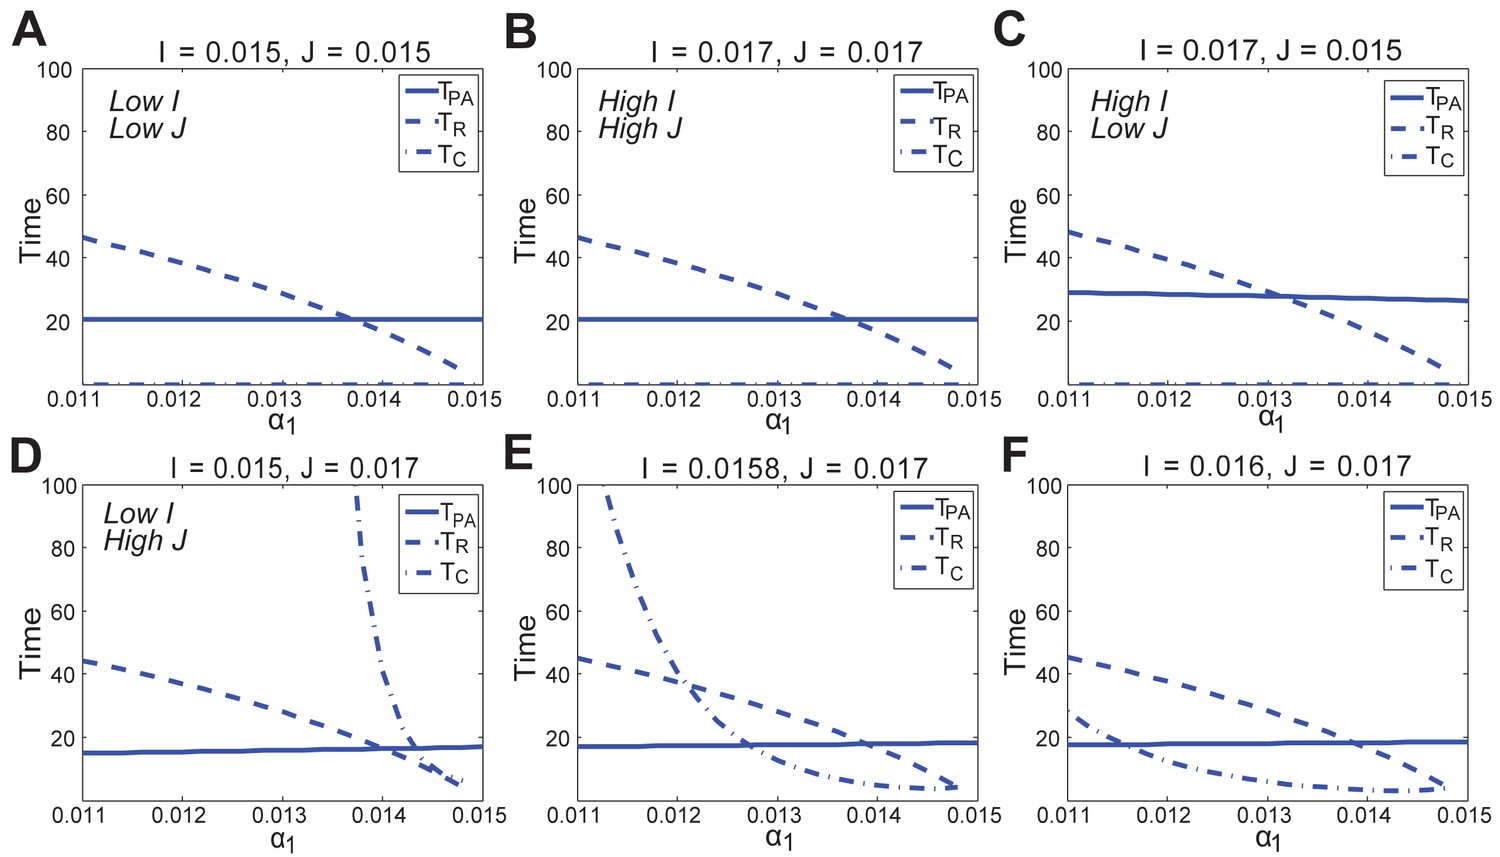
Appendix 2—figure 32
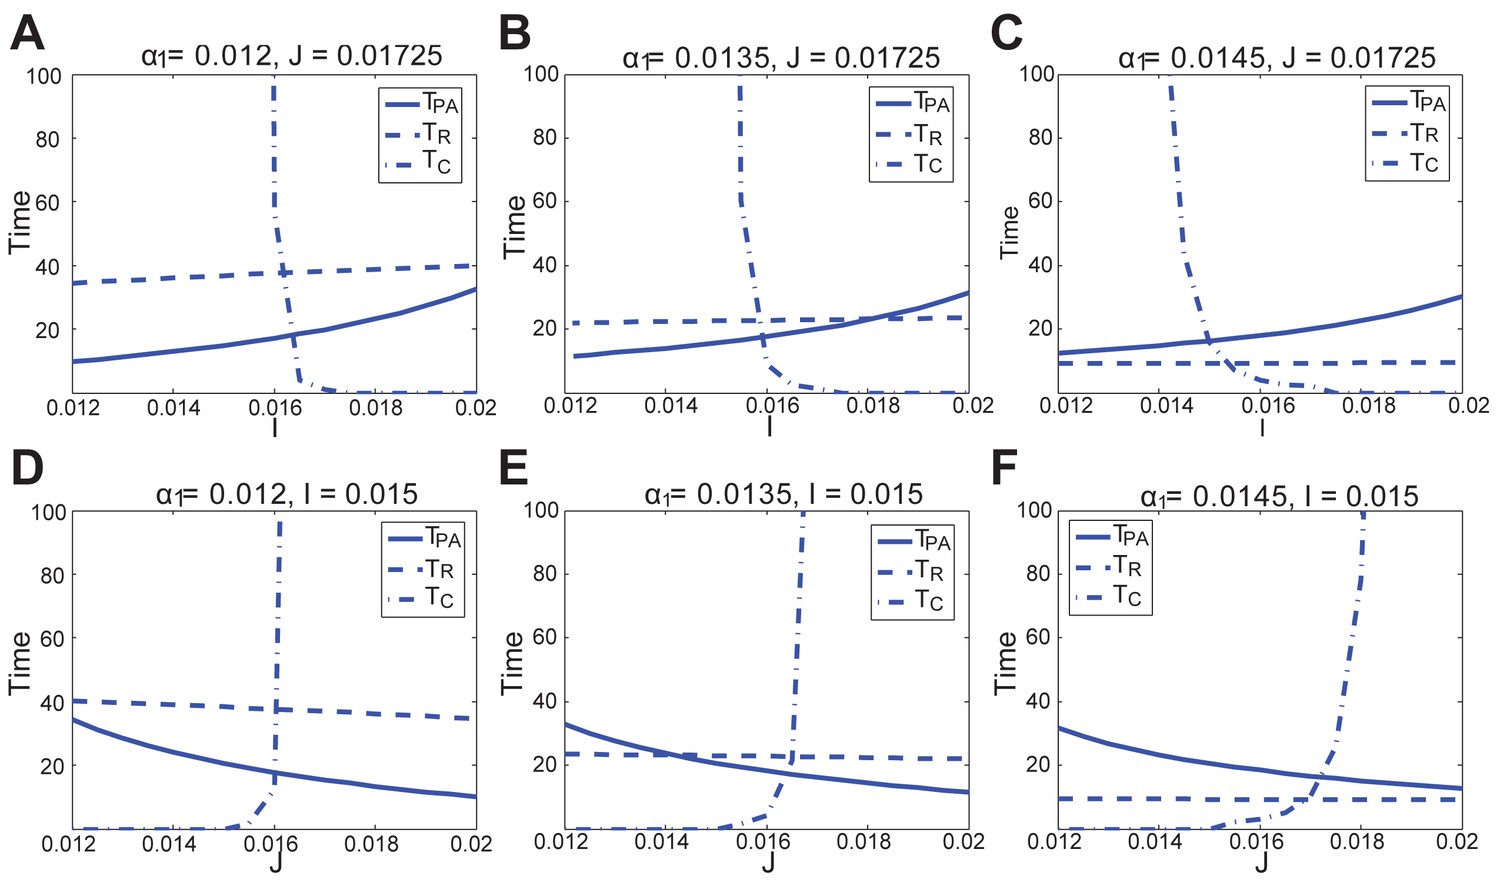
In the FHN model, changes in anagen length (solid line, ), refractory telogen length (dashed line, ), competent telogen length (dash-dot line, ) to the activator () or inhibitor () production rate, under different values of positive feedback in the activator pathway ().
https://doi.org/10.7554/eLife.22772.074
Appendix 2—figure 33
In the FHN model, changes in anagen length (solid line, ), refractory telogen length (dashed line, ), competent telogen length (dash-dot line, ) to the positive feedback in the activator pathway () under different values of activator () and inhibitor () production rates.
https://doi.org/10.7554/eLife.22772.075
Appendix 2—figure 34
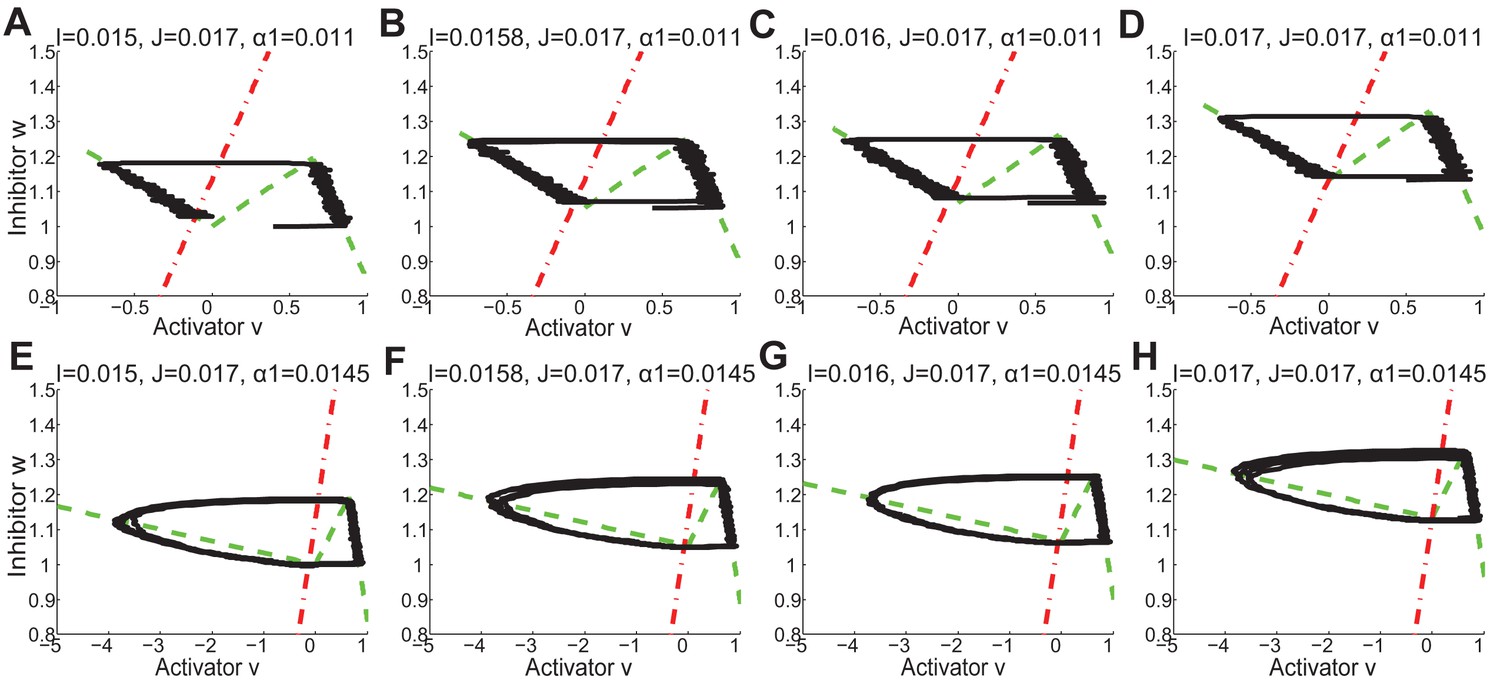
The nulleclines ( red dash-dot lines, and green dash lines) and stochastic trajectories (black lines) under different values of , and in FHN model.
(A, E) , , as in Appendix 2—figure 33D. (B, F) , , as in Appendix 2—figure 33E. (C, G) , , as in Appendix 2—figure 33F. (D, H) , , as in Appendix 2—figure 33B.
Appendix 2—figure 35
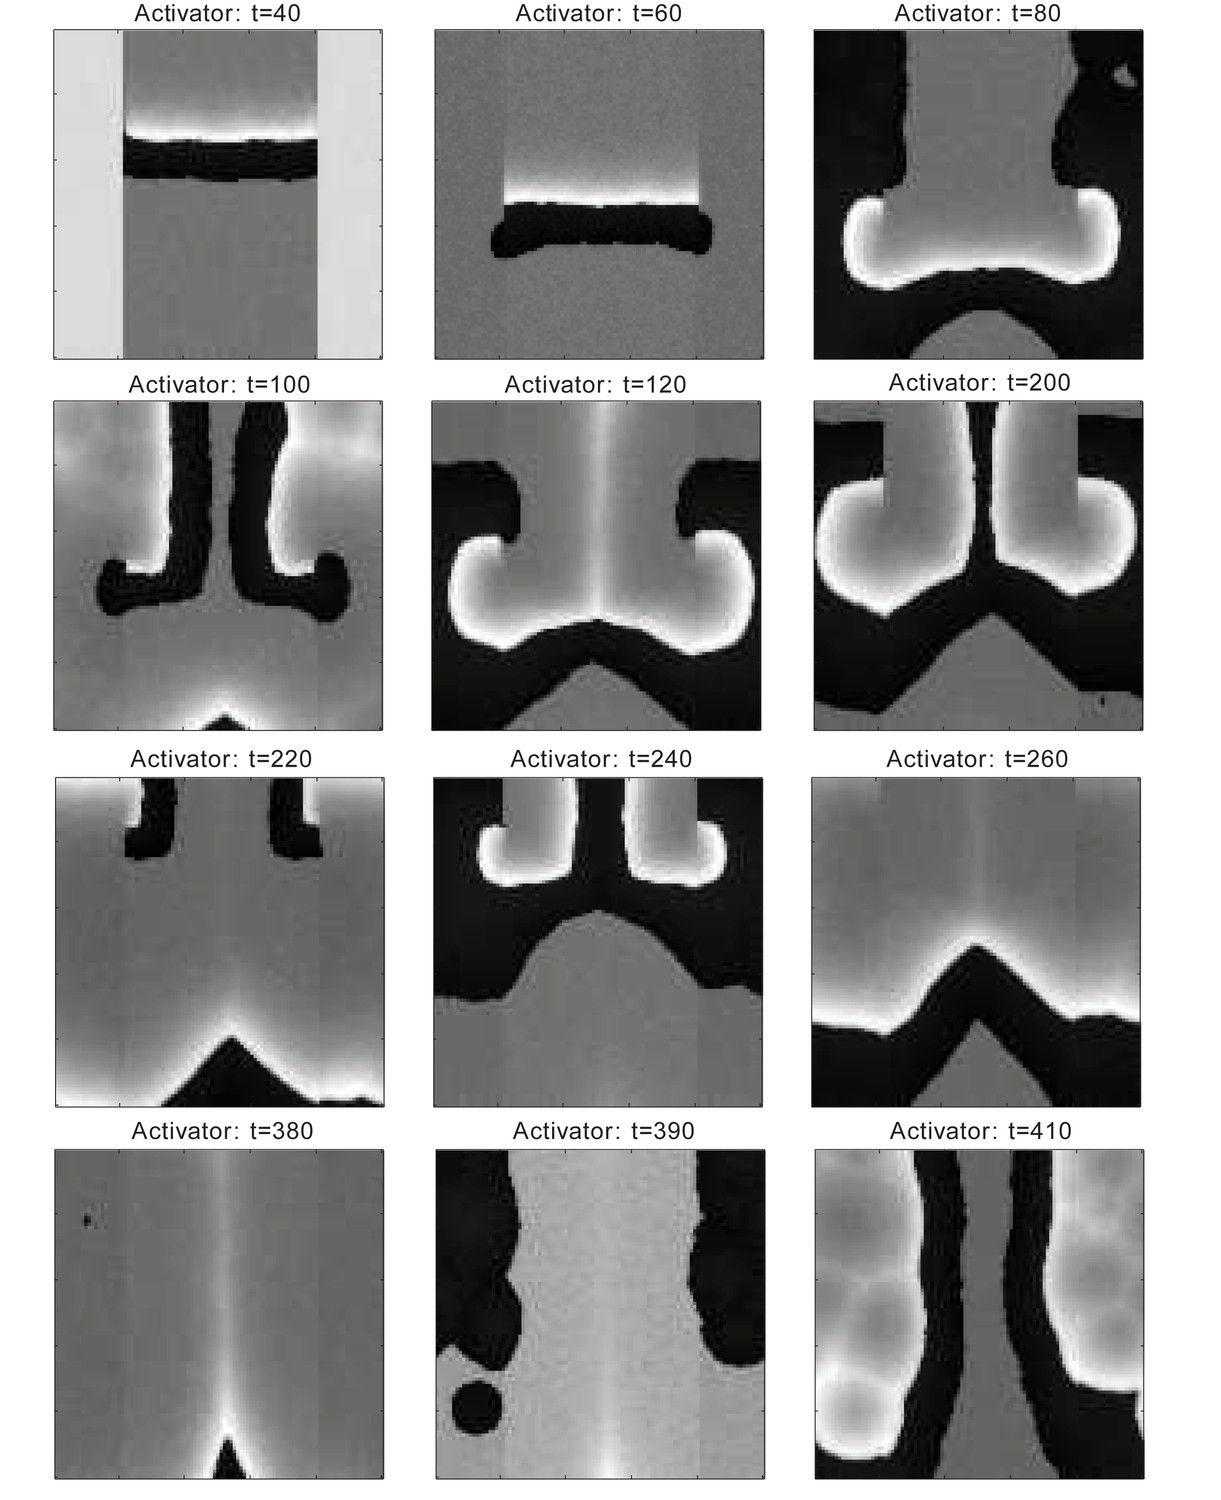
Dorsal-ventral interaction simulation by the FHN model.
In comparison to Figure 2F. Dorsal temporal advancement is built-in, the HFs have shorter telogen in the ventral domain than in the dorsal. Figure shows the activator activities (white-low, black-high). Interaction between the domains with the dorsal domain showing head-to-tail asynchrony caused by the built-in temporal advancement last for several cycles, until it breaks into waves propagating from ventral to dorsal showing bilateral symmetry, which lasts during the following few cycles. Using the FHN model, we cannot obtain the quick degradation of the early dorsal head-to-tail asynchrony as early as the third or fourth cycle, as observed in experiments or simulated by our model.
Appendix 2—figure 36
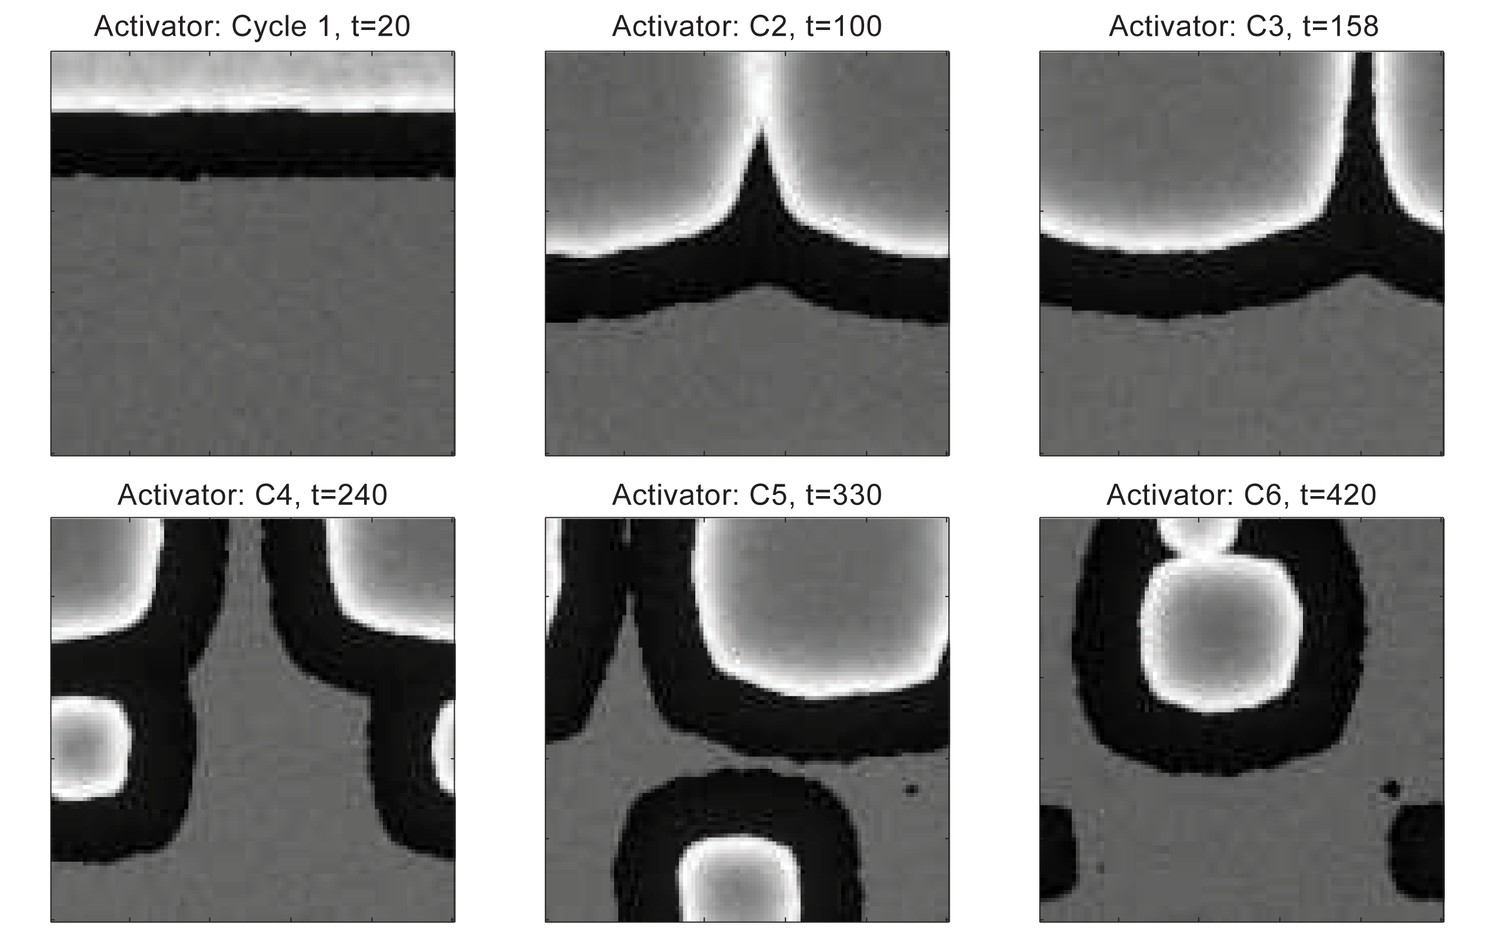
Dorsal wave propagation with temporal phase advancement built-in in HFs near the head, simulated by the FHN model.
In the homogeneous dorsal domain, the early head-to-tail asynchrony quickly degrades into spontaneous initiations, and no bilateral symmetry is observed.
Videos
Appendix 2—video 1
3D simulation of dorsal HF waves, where all HFs have equal probability of anagen initiation, allowing spontaneous anagen initiations.
Here we see spontaneous anagen initiations over the dorsal domain from the very first cycle, against the experimental observations of early head-to-tail wave degenerating into later spontaneous initiations showing some bilateral symmetry. Also see Appendix 2—figure 12.
Appendix 2—video 2
3D simulations of dorsal HF waves, where HFs near the head have higher built-in levels of activator signaling.
Here we see highly successive steady waves characterized as the ‘target-like wave’ pattern, also against experimental observations. Also see Appendix 2—figure 13B.
Appendix 2—video 3
3D modeling of HF growth pattern evolution with head-to-tail hair cycle asynchrony.
Initial asynchrony was introduced into the field by assigning a group of HFs on one end with a one-time increase in activator ligands. Simulations faithfully reproduce head-to-tail asynchrony of the first cycle. However, this asynchrony fails to degrade quickly, and persists during multiple consecutive cycles. This differs from rapid HF growth pattern evolution observable in mice. Also see Appendix 2—figure 15.
Appendix 2—video 4
3D modeling of dorsal-ventral HF wave interaction.
Initial head-to-tail asynchrony in the dorsal domain was introduced by assigning a group of HFs on one end with a one-time increase in activator ligands. We also block ventral HF growth until t = 14 to simulate the temporal-advancement in dorsal domain. Ventral HFs has faster cycle than dorsal HFs. Simulations reproduce head-to-tail asynchrony of first two cycles, which degrades into spontaneous waves possessing bilateral symmetries in later cycles, similar to what is observed from experiments. Also see Figure 2F.
Appendix 2—video 5
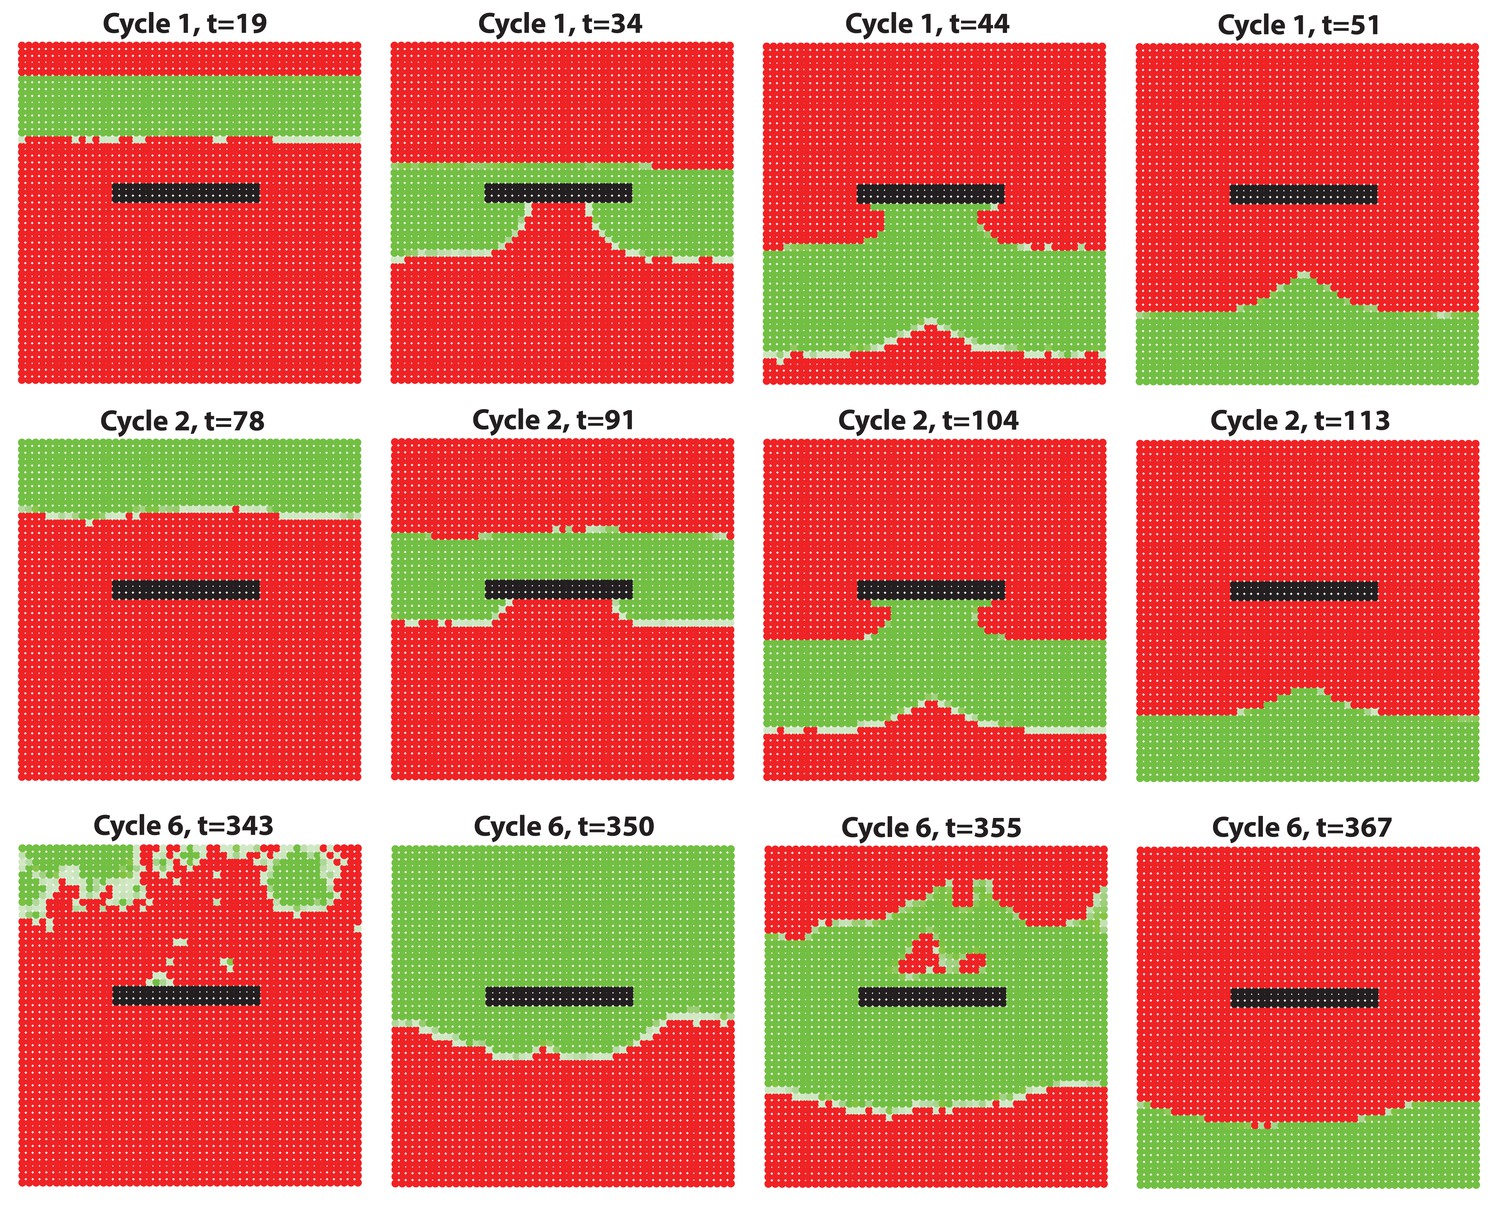
Regions like eyelids, physical breaks in the skin can break homogenous wave spreading.
The black region is ‘cut-off’ from the homogeneous outside region, i.e., no HF growth is allowed in this region and no molecules are allowed to diffuse into it. As the HF wave propagates, the black region breaks the wave spreading, creating a distortion-like effect. Also see Figure 7A.
Tables
Appendix 1—table 1
Numbers of club hairs used for analysis.
| Hair type | Control | Krt14-Noggin | Krt14-Bmp4 | Control | Krt14-Cre; Wnt7b-/- | Krt5-rtTA; tetO-Dkk1 control | Krt5-rtTA; tetO-Dkk1 induced |
|---|---|---|---|---|---|---|---|
| Auchene | 52 | 43 | 23 | 50 | 25 | 30 | 43 |
| Awl | 70 | 55 | 40 | 50 | 25 | 30 | 45 |
| Guard | 73 | 48 | 40 | 52 | 25 | 30 | 45 |
| Zigzag | 54 | 64 | 40 | 18 | 28 | 19 | 33 |
Appendix 2—table 1
Parameter values in the reaction-diffusion system: Appendix 2-Equations (1–4). (1) In Figure 1C, ranges from −11 to 2, and Figure 1B is obtained under ; both are noise-free, thus . (2) In Appendix 2—figure 6, low, medium and high inhibitor L correspond to , respectively, and weak, medium and strong noise correspond to – the same for both multiplicative and additive noise. (3) In Appendix 2—figure 8 and 9, low and high correspond to or , respectively, while low, medium and high inhibitor L correspond to , respectively, which is the same as in Appendix 2—figure 6. Appendix 2—figure 8 and 9 again show noise-free results, hence . Also see Appendix 2—table 2 for supplementary parameter values.
| Reaction - Diffusion System | ||||||
|---|---|---|---|---|---|---|
| Parameters | 1D | 2D | 3D | |||
| Dorsal | Ventral | |||||
| Preservation of Receptors | 10 | 10 | 15 | 50 | ||
| Diffusion | 1 | 0.5 | 0.5 | |||
| Reaction | 0.3 | |||||
| 0 | ||||||
| 0.5 | ||||||
| 0 | ||||||
| Degradation | 2 | |||||
| 4 | 6.5 | 7 | ||||
| Concentration Threshold | 1.5 | 2.25 | 2.6 | |||
| 0 | ||||||
| Noise | 2/4/6 | 3.2 | See Appendix 2—table 2. | |||
| Others | 4 | |||||
| −11 2 | 2.3 | |||||
Appendix 2—table 2
Parameter values in the reaction-diffusion system in 3D simulations, supplementary to Appendix 2—table 1.
| Figures | Others | |
|---|---|---|
| Figure 2F | 0.02 | |
| Appendix 2—figure 7 | 0.05 | |
| Appendix 2—figure 12 | 0.035 | |
| Appendix 2—figure 13B | 0.02 | |
| Appendix 2—figure 15 | 0.035 | |
| Appendix 2—figure 16 | 0.05 | |
| Appendix 2—figure 17 | 0.02 | |
| Appendix 2—figure 18 | 0.02 | |
| Appendix 2—figure 27 | 0 | |
| Appendix 2—figure 28 | 0.02 | |
| Appendix 2—figure 29 | 0.02 | |
| Appendix 2—figure 30 | 0.02 |
Appendix 2—table 3
Values of temporal and geometric parameters.
| Time and geometry | |||
|---|---|---|---|
| Parameters | 1D | 2D | 3D |
| 0.1 | 0.01 | ||
| NA | 1.5 | 2 | |
| NA | 2 | ||
| 0.1 | 0.2 | ||
| -1 | |||
| 0.5 | 0.6 | ||
| 0.8 | |||
| -6 | |||
| −1.8 | |||
| NA | 90 | 60/100 | |
| NA | 100 | ||
| −10 | |||
Appendix 2—table 4
Activity strength of activator/inhibitor ligands (L), antagonists (A), receptors (R) and ligand-bond receptors (LR) in different phases within a full HF growth cycle.
| Activator | Inhibitor | ||||
|---|---|---|---|---|---|
| Region I | Region II | Region I | Region II | ||
| (Bulge) | (sHG, Matrix, DP) | (Bulge) | (sHG, Matrix, DP) | ||
| Late Competent Telogen (late C) | L | 3 | (3,0,4) | 2 | (2,0,3) |
| A | 2 | (2,0,1) | 0 | (0,0,3) | |
| R | 2 | (2,0,4) | 3 | (3,0,3) | |
| LR | 4 | (4,0,4) | 1 | (1,0,3) | |
| Propagating Anagen (P) | L | 2 | (0,4,4) | 2 | (0,3,3) |
| A | 2 | (0,2,3) | 0 | (0,2,2) | |
| R | 2 | (0,3,4) | 3 | (0,3,3) | |
| LR | 4 | (0,4,4) | 1 | (0,3,3) | |
| Autonomous Anagen (A) | L | 2 | (0,4,4) | 2 | (0,4,4) |
| A | 2 | (0,4,4) | 0 | (0,2,2) | |
| R | 2 | (0,3,4) | 3 | (0,3,3) | |
| LR | 2 | (0,4,4) | 3 | (0,3,3) | |
| Catagen (Cat) | L | 2 | (2,0,2) | 2 | (2,0,4) |
| A | 2 | (2,0,4) | 0 | (0,0,1) | |
| R | 2 | (2,0,4) | 3 | (3,0,3) | |
| LR | 1 | (1,0,1) | 3 | (3,0,3) | |
| Refractory Telogen (R) | L | 2 | (2,0,1) | 2 | (2,0,4) |
| A | 2 | (2,0,4) | 0 | (0,0,1) | |
| R | 2 | (2,0,4) | 3 | (3,0,3) | |
| LR | 1 | (1,0,1) | 4 | (4,0,4) | |
| Early Competent Telogen (early C) | L | Similar to refractory telogen | Similar to late competent telogen | ||
| A | |||||
| R | |||||
| LR | |||||
Appendix 2—table 5
Parameter values of ligand productions (Appendix 2-equations (9, 10)) and HF growth (Appendix 2-equations (11, 12)).
| Ligand production | HF growth | |||||||
|---|---|---|---|---|---|---|---|---|
| Parameters | 1D | 2D | 3D | Parameters | 1D | 2D | 3D | |
| 6 | 20 | 40 | 0.2 | |||||
| 3 | 0 | 0 | 4 | |||||
| 1.5 | 1.5 | 3 | 2 | |||||
| −7.8 | −13 | −32 | 2 | |||||
| 6 | 10 | 20 | ||||||
Additional files
-
Supplementary file 1
Dataset 1: Putative activator genes (tabs #1, #2) and putative inhibitor genes (tabs #3, #4) available from a whole skin microarray dataset.
- https://doi.org/10.7554/eLife.22772.010
-
Supplementary file 2
Dataset 2: Putative activator and inhibitor genes displaying domain-specific expression patterns at all hair cycle time points on whole skin RNA-seq profiling.
Genes are grouped into individual tabs based on (i) their activator or inhibitor expression profile and (ii) their specificity to one or several skin domains.
- https://doi.org/10.7554/eLife.22772.011
-
Supplementary file 3
Dataset 3: Differentially expressed genes specific to refractory telogen dorsal skin, telogen ear skin and cartilage/muscle complex.
- https://doi.org/10.7554/eLife.22772.012
Download links
A two-part list of links to download the article, or parts of the article, in various formats.
Downloads (link to download the article as PDF)
Open citations (links to open the citations from this article in various online reference manager services)
Cite this article (links to download the citations from this article in formats compatible with various reference manager tools)
A multi-scale model for hair follicles reveals heterogeneous domains driving rapid spatiotemporal hair growth patterning
eLife 6:e22772.
https://doi.org/10.7554/eLife.22772


