Folding behavior of a T-shaped, ribosome-binding translation enhancer implicated in a wide-spread conformational switch
- University of Maryland, United States
- Leidos Biomedical Research, Inc., Frederick National Laboratory for Cancer Research, United States
- Center for Cancer Research, National Cancer Institute, United States
Figures
Figure 1 with 1 supplement
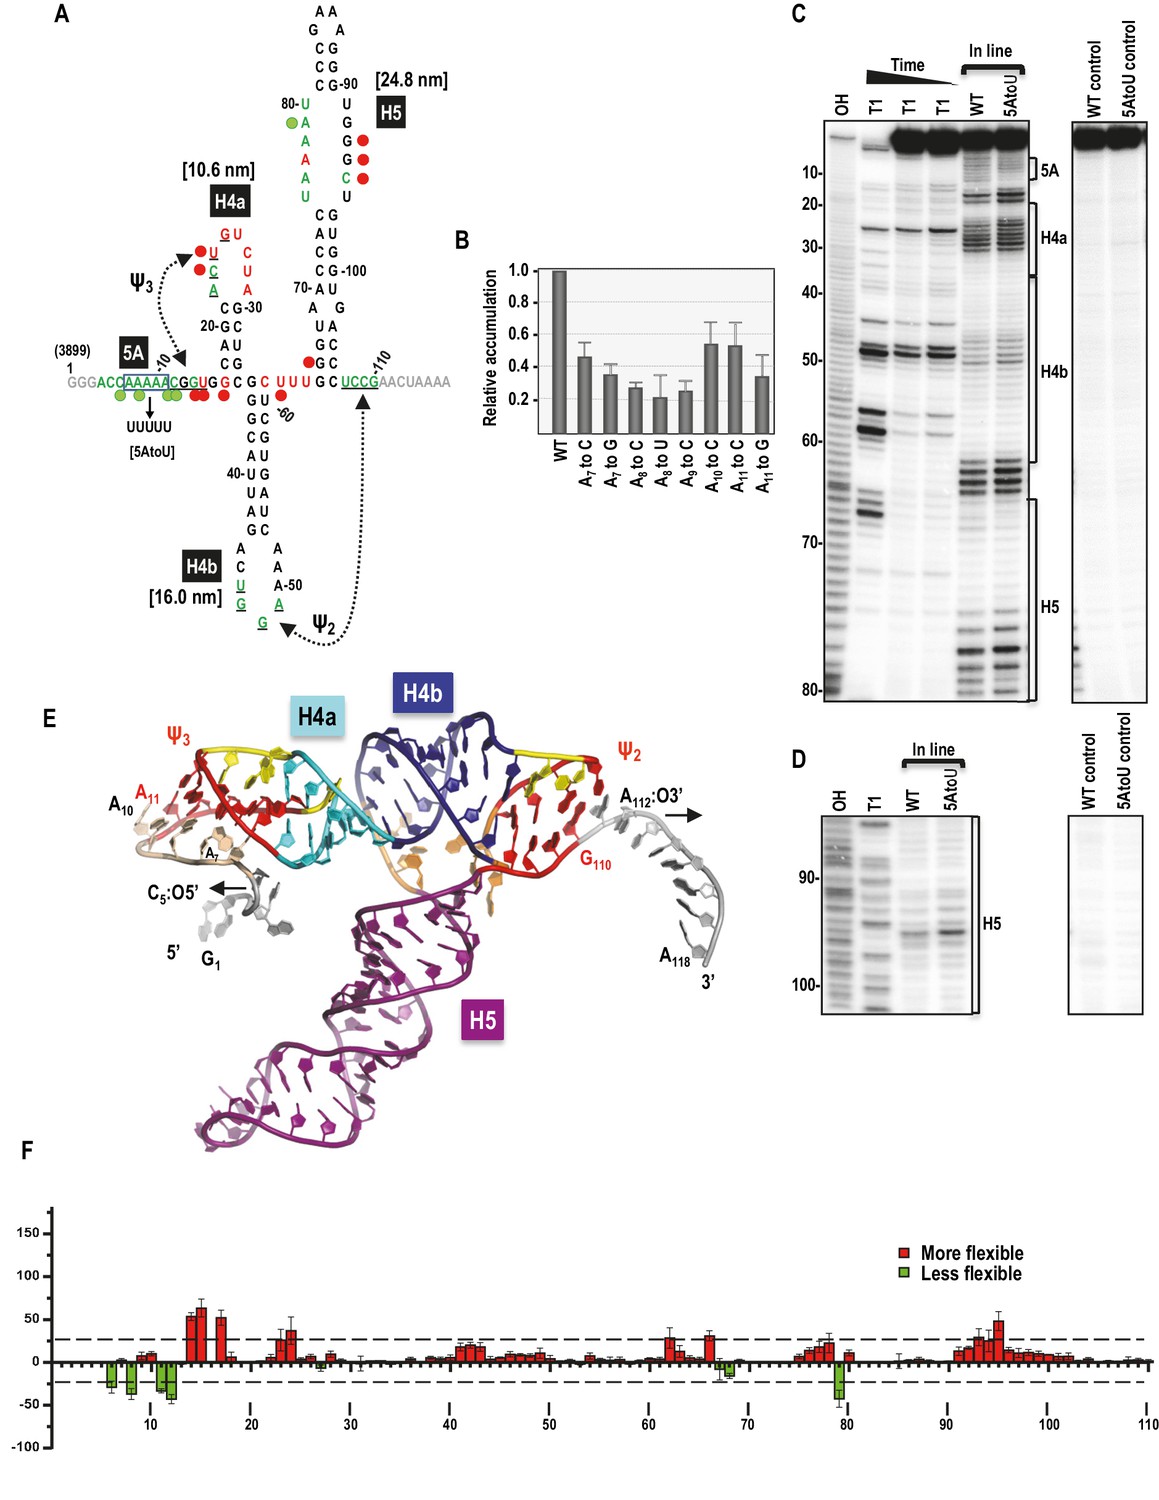
Secondary structure, tertiary interactions, and new structural model of the TSS.
(A) Sequence of TSS118 near the 3’ end of TCV gRNA. Hairpins H4a, H4b and H5 and tertiary interactions Ψ2 and Ψ3 comprise the TSS. Tertiary interactions between underlined residues are indicated by hatched arrows. Predicted contour lengths of hairpins are in brackets. Residues in green and red are moderately and highly susceptible to in-line cleavages, respectively (see C and D). Residues in grey were not evaluated. The 5A region is boxed. Green and red circles denote residues with >25% reduction or enhancement in levels of cleavage, respectively, when 5A is altered to 5U. (B) Accumulation of full-length wt and mutant TCV gRNA in Arabidopsis protoplasts. Individual adenylates were converted to the bases indicated. Data is from three independent experiments and standard deviation is shown. (C) In-line probing of the wt and 5AtoU TSS118 fragments. OH, partial hydroxide cleavage ladder; T1, partial RNase T1 digest of denatured RNA showing the location of guanylates; wt and 5AtoU control lanes were not subjected to in-line cleavage. Intensity of the in-line cleavage products correlates with flexibility of the residues. (D) Longer run of the samples shown in (C). (E) Model of TCV118 corresponding to a 25 ns state in a 40 ns-long MD trajectory. 5’ end C6 and A7 through A9 form stable Hoogsteen edge interactions with Ψ3. All 3’ end nucleotides beyond G110 remain single stranded. A fragment of this model (TSS108), comprising C5 through A112, was used as the starting point for all Steered Molecular Dynamics pulling simulations (Figure 8 and Figure 8—figure supplement 1). Nucleotides and atoms where the pulling force was applied (C5:O5’ and A112:O3’) were selected to determine the direction of pulling and have the restraints applied to are labeled and arrows indicate the direction of pulling. (F) Difference in residue flexibility in wt and 5AtoU fragments. Data is from three in-line probing experiments quantified using SAFA software.
Figure 1—figure supplement 1
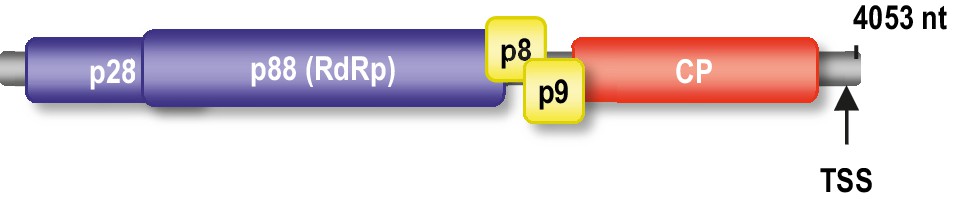
Genome organization of TCV gRNA.
The p88 RdRp is translated as a ribosomal readthrough product of p28. p8 and p9 movement proteins are translated from one subgenomic RNA and the coat protein (CP) is translated from a second subgenomic RNA. Location of the TSS proximal to the 3’ end is shown.
Figure 2 with 2 supplements
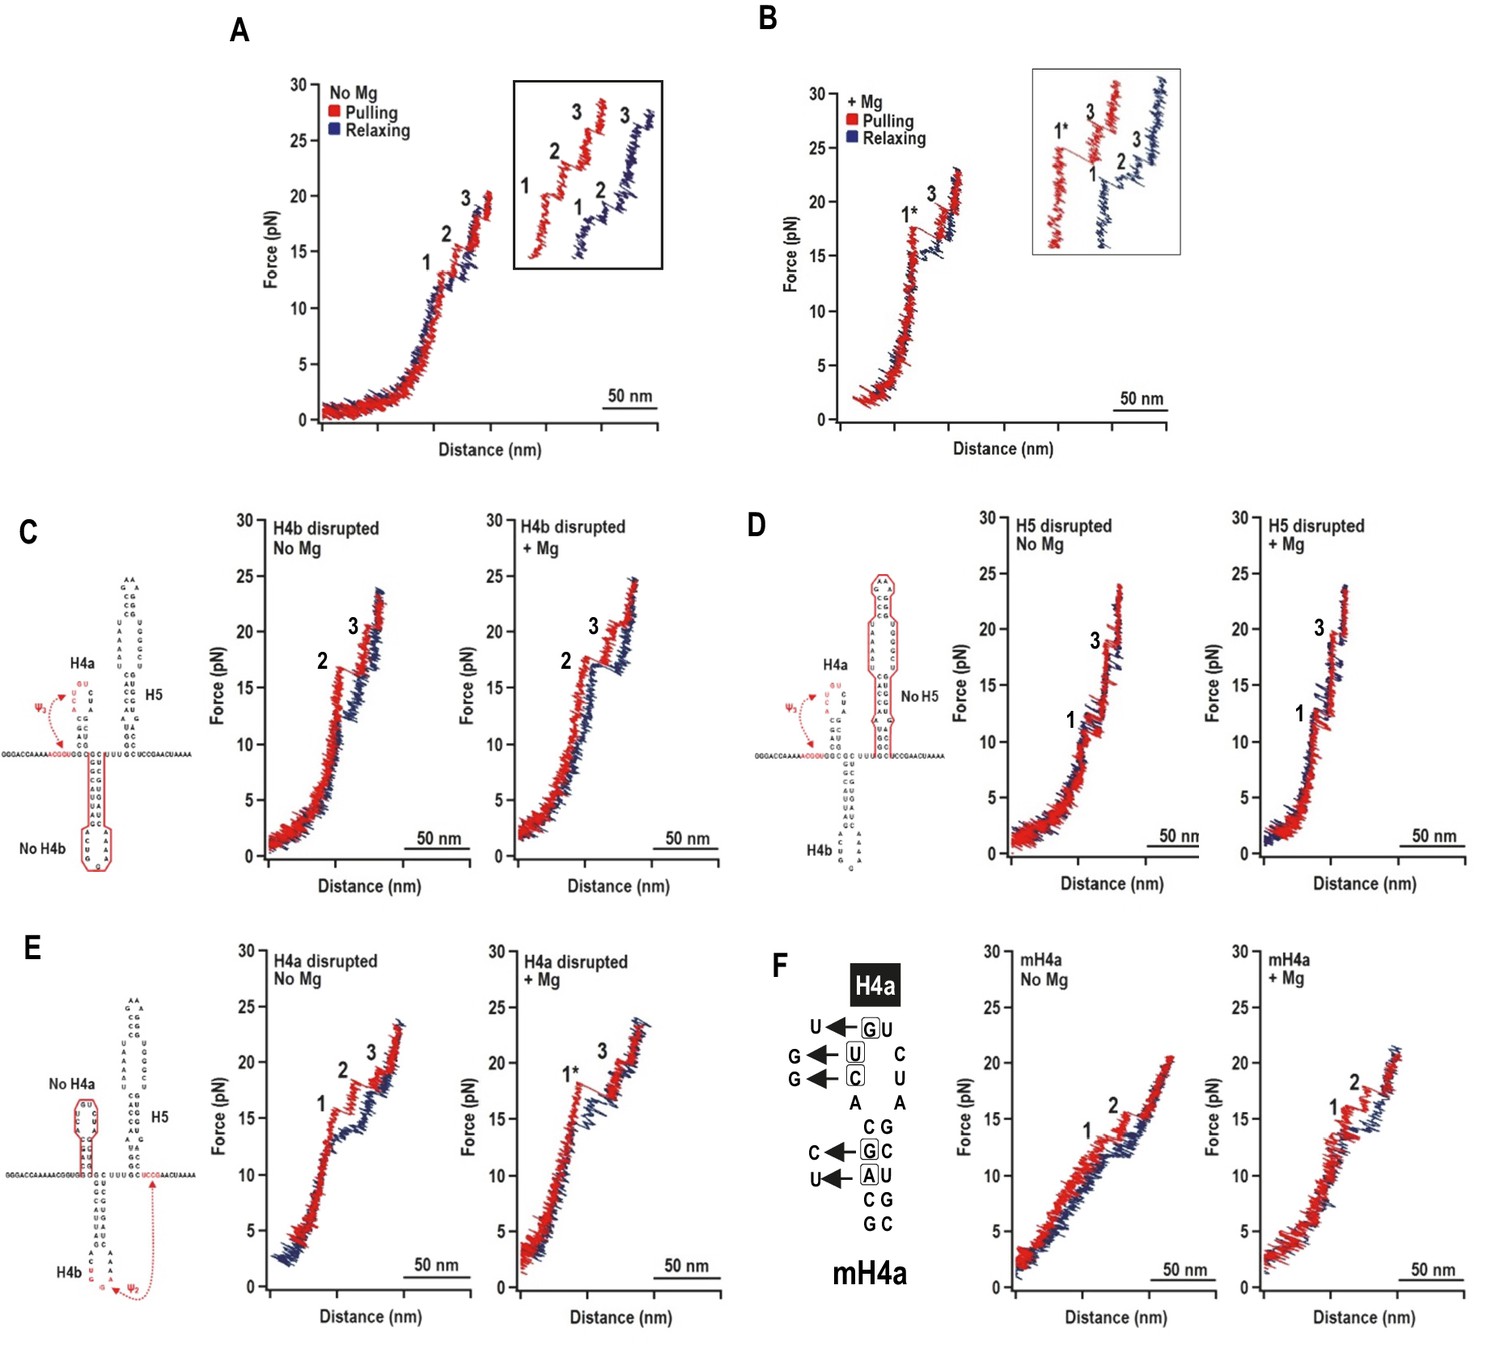
Representative force-extension curves (FEC) for the TSS using force ramping.
(A) FEC of the TSS in the absence of Mg2+ (N = 86). The red line represents the unfolding process and blue line represents the refolding process. The three intermediates are labeled. Insets show enlarged transitions. (B) FEC of TSS in Mg2+ (N = 64). The large and small rips in the unfolding process are labeled 1* and 3, respectively. (C, D, E) TSS was annealed with oligonucleotides complementary to H4b, H5, and H4a, respectively. FECs were conducted in the absence (middle) and presence (right) of Mg2+. The complimentary oligonucleotides are denoted with a red line. Note that the oligonucleotide complementary to H4a has no effect on the FEC. (F) FECs of TSS containing mutations in H4a (mH4a). All rips are numbered as for wt TSS.
Figure 2—figure supplement 1
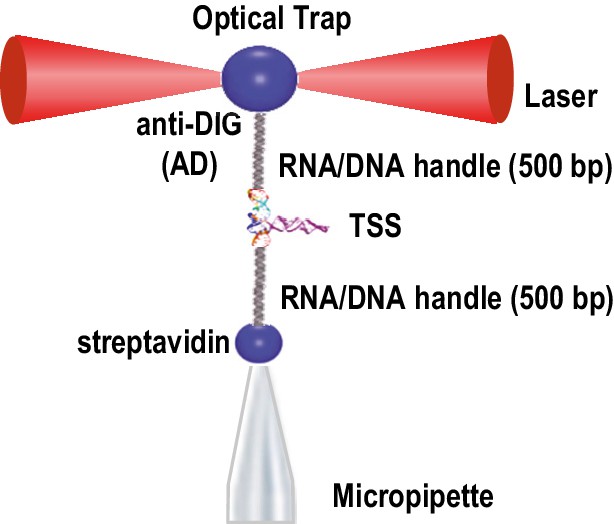
Optical tweezer (OT) experimental set-up.
The TSS RNA was placed between 500bp DNA/RNA handles that interact either with the anti-DIG bead or the streptavidin bead (see text). The former bead was trapped by lasers and the latter by suction. RNA stretching was accomplished by increasing the distance between the two beads by moving the laser-trapped bead, allowing measurement of the RNA extension length.
Figure 2—figure supplement 2
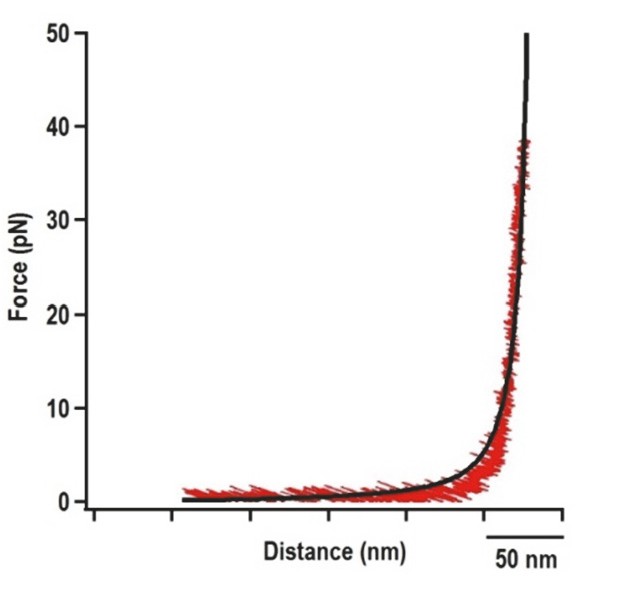
Force extension curve (FEC) of the DNA/RNA handles alone.
The 500 nt left and right handles were connected together and subjected to OT. Black line represents the FEC of DNA/RNA handles (red) fitted with the Makko-Sigga WLC model (Wang et al., 1997).
Figure 3 with 2 supplements
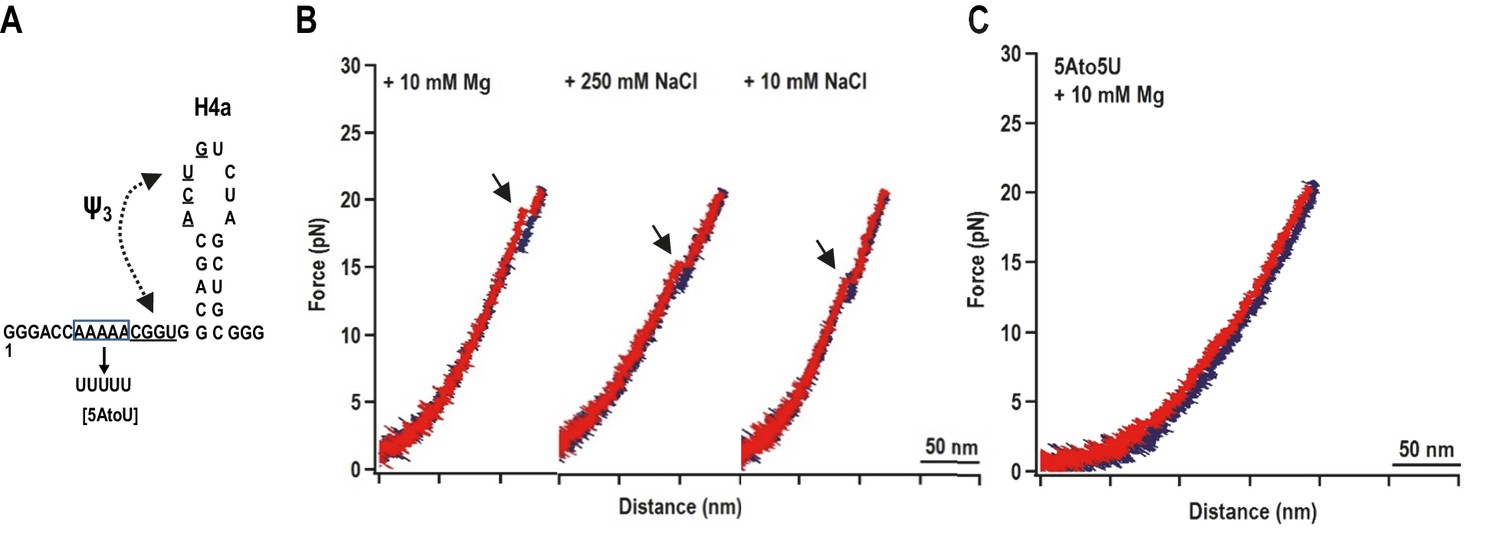
H4a/Ψ3 formation during force ramping is not dependent on H4b, H5, or Mg2+ and is stabilized by upstream 5A.
(A) Truncated H4a/Ψ3 fragment. (B) Representative FECs in 10 mM Mg2+ (N = 22), 250 mM NaCl (N = 72), or 10 mM NaCl (N = 96). Arrows denote H4a/Ψ3 rips. (C) FEC (in 10 mM MgCl2) of mutant fragment in which the 5A sequence (boxed) was replaced with 5U (5AtoU).
Figure 3—figure supplement 1
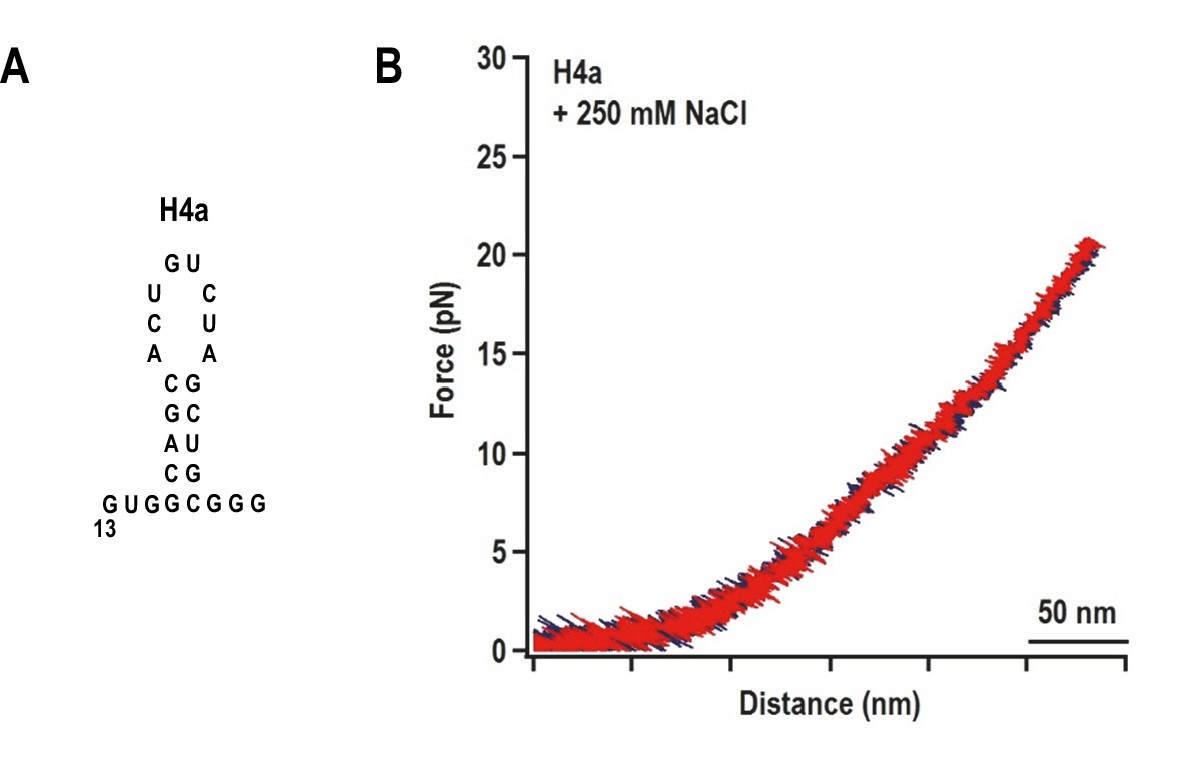
The unfolding pathway of H4a in the absence of Ψ3.
(A) The H4a fragment used. (B) FEC of H4a stretched in buffer containing 250 mM NaCl. No transition is observed, indicating that the hairpin alone is not stable.
Figure 3—figure supplement 2
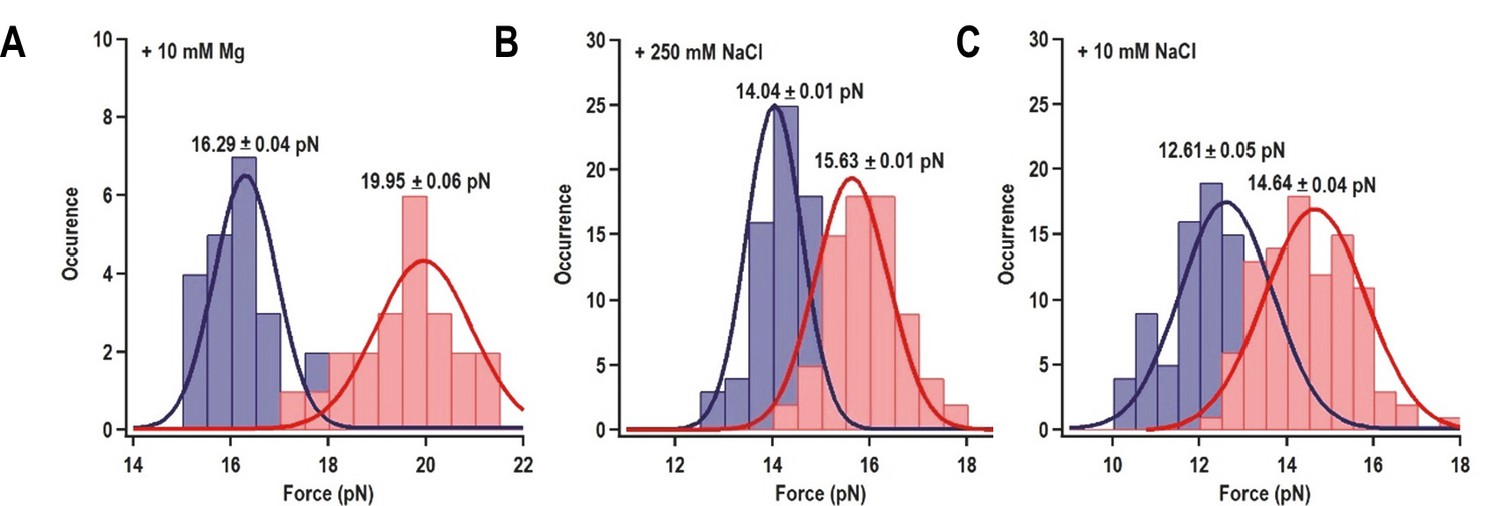
Distribution of the folding force (blue) and unfolding force (red) of H4a/Ψ3 in the fragment shown in Figure 3A.
The unfolded and folded forces were obtained from force ramping experiments (see text). Critical force was obtained by Gaussian fitting. (A) 10 mM MgCl2 (N = 22). (B) 250 mM NaCl (N = 72). (C) 10 mM NaCl (N = 96).
Figure 4 with 1 supplement
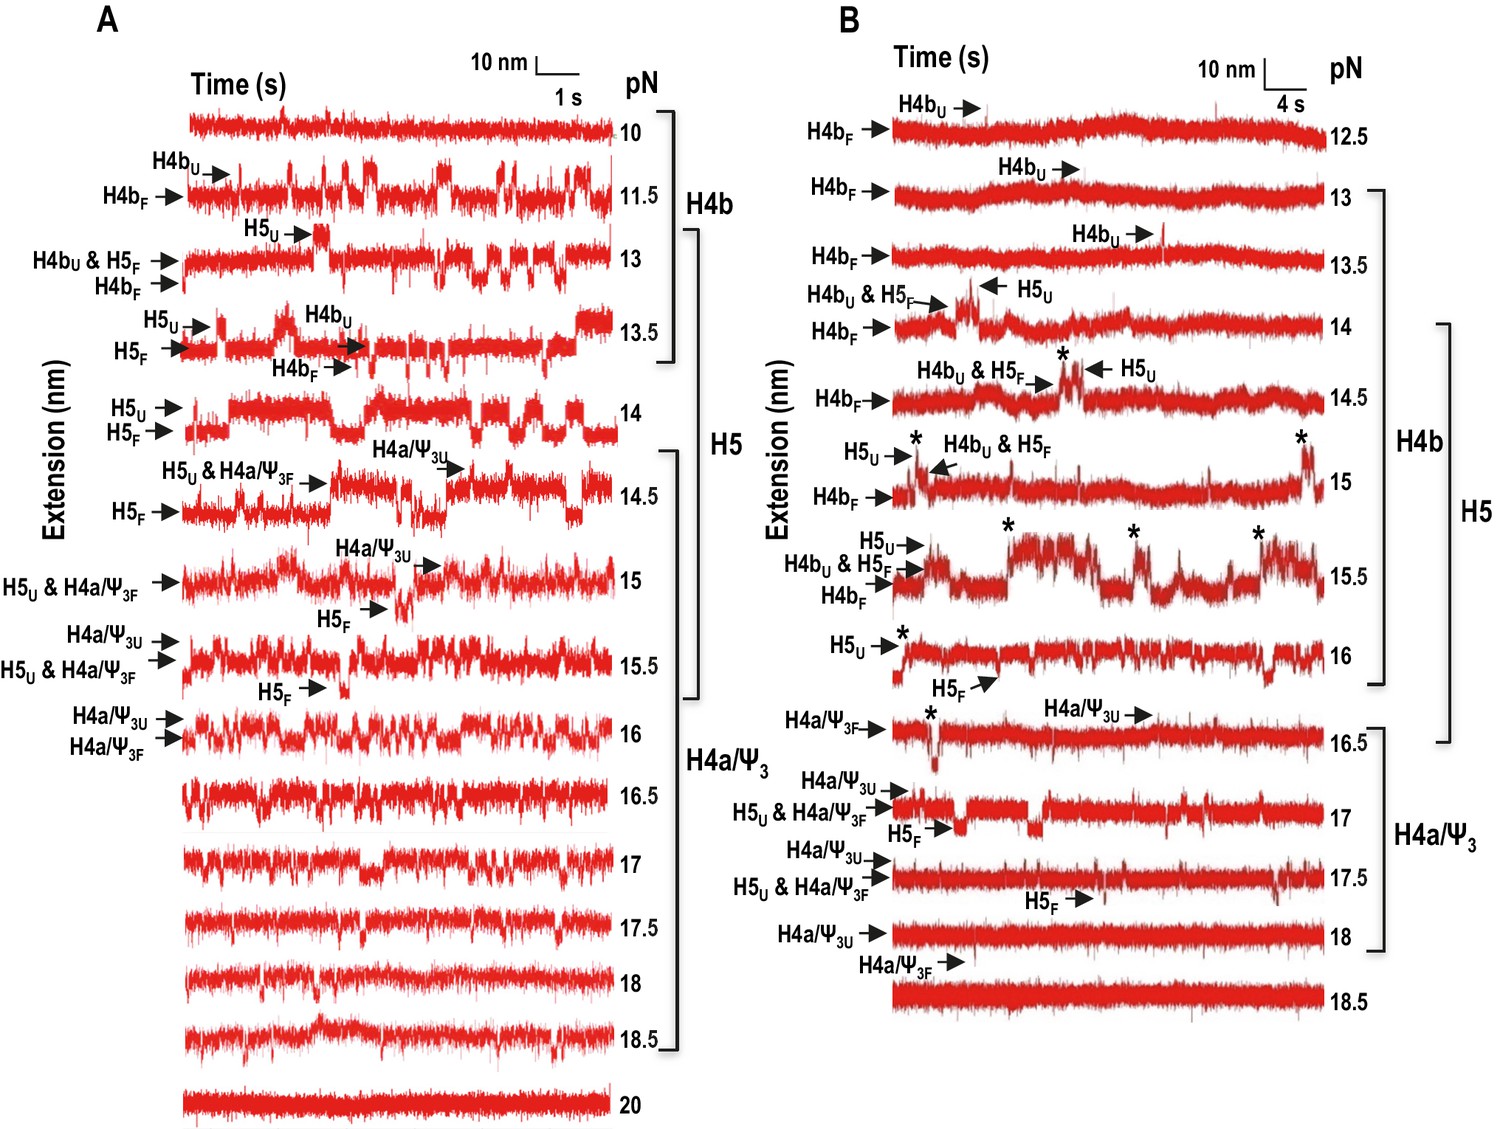
Force clamping of the TSS.
(A and B) Representative force clamping length versus time traces for TSS118 in 250 mM NaCl and 10 mM Mg2+, respectively. The TSS was held at a constant force for between 1.5 and 2 min. The assigned hairpin for each transition is indicated. Subscripts ‘U’ and ‘F’ denote unfolded and folded state of the hairpins, respectively, which are indicated by arrows. Brackets to the right denote force ranges of the TSS elements. Asterisks denote cooperative unfolding of H4b and H5.
Figure 4—figure supplement 1
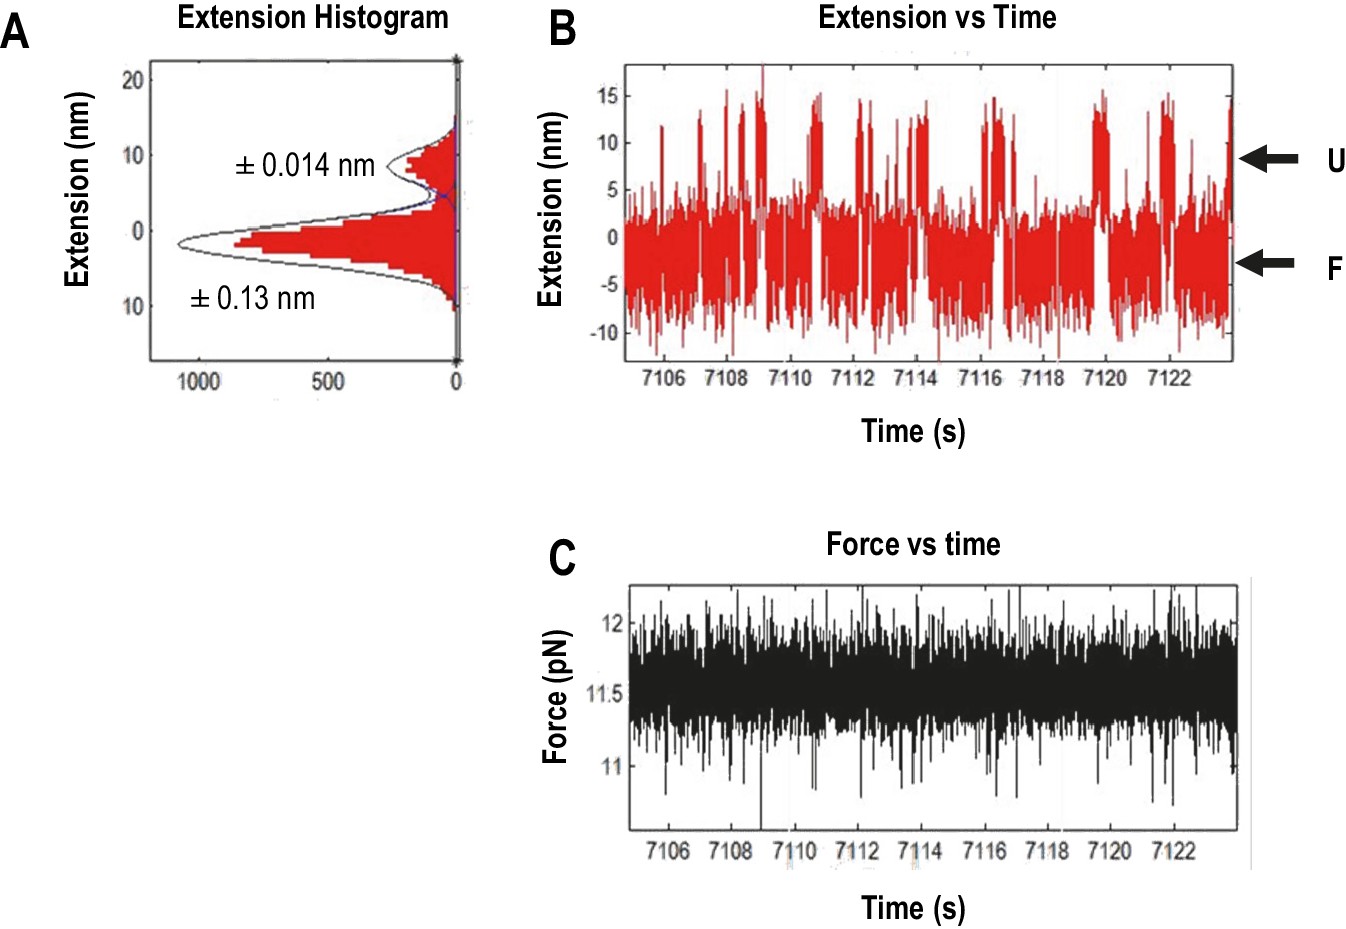
Measuring the displacement of RNA transitioning between unfolded (U) and folded (F) states using force clamping.
In force clamping, measuring the displacement of an RNA element’s transitions between the unfolded state and the folded state allows for estimation of the extended length of an element. At each force level, extension length of the intermediate states was obtained from three independent measurements of extension using the time trace of extension and then converted to contour length using the Odjik WLC model (Equation 2, Materials and methods) (Wang et al., 1997). (A) Extension histogram (red) of each state was fitted with Gaussian function (black line). The length of each transition was obtained by subtracting the extension of the two states. The range of 95% confidence interval of each fitting are provided. (B) The length versus time trace (red) of the TSS used for extension analysis. U, unfolded state; F, folded state. (C) Force versus time traces (black). The force feed-back was turned on, allowing force to be maintained constantly.
Figure 5
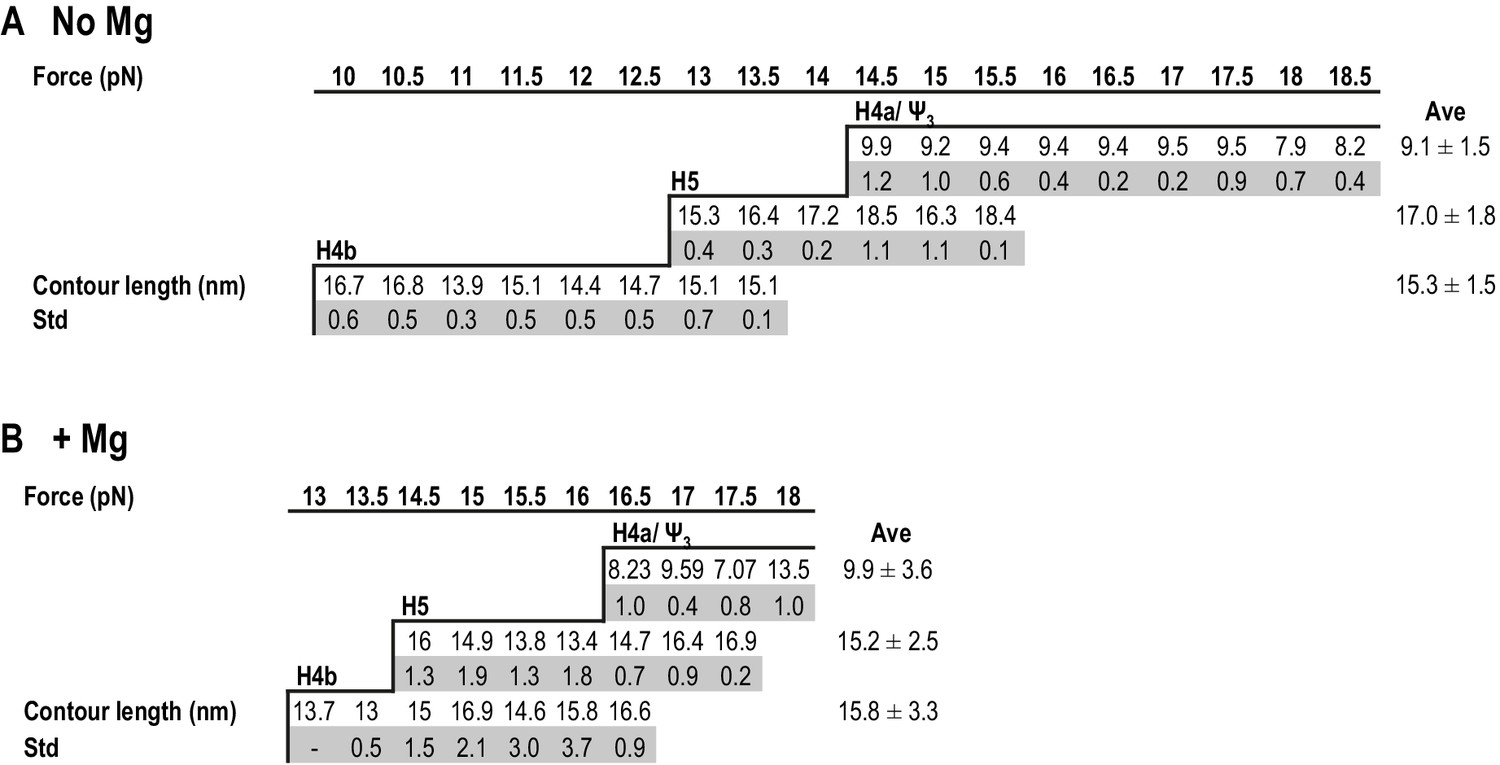
Summary of contour lengths of TSS elements obtained by force-clamping.
(A and B) Contour lengths of each transition in 250 mM NaCl and in 10 mM MgCl2, respectively. Std: standard deviation obtained for three independent measurements. Contour length of each transition measured at each force level was averaged (Ave).
Figure 6

Force clamping of TSS with disrupted elements.
(A) Representative length versus time traces for mutant mH4a in Mg2+. H4a and Ψ3 were disrupted by mutations (see Figure 2F). ‘Ψ2’ may represent unfolding of Ψ2 and the first few bases of the H4b stem. Asterisks denote cooperative unfolding of H4b and H5. Note that fewer cooperative H4b +H5 unfolding events are observed when compared with wt TSS at the same force level in the presence of Mg2+ (see Figure 4B). (B) Length versus time traces for H5-disrupted TSS. H5-complementary oligonucleotide was annealed to the TSS and force clamping performed using a 5 to 20 pN force range. The hopping behavior of H4b was observed at 11.5 pN in the presence (shown) and absence (not shown) of Mg2+. No hopping was observed for H4a/Ψ3 in the absence of Mg2+.
Figure 7
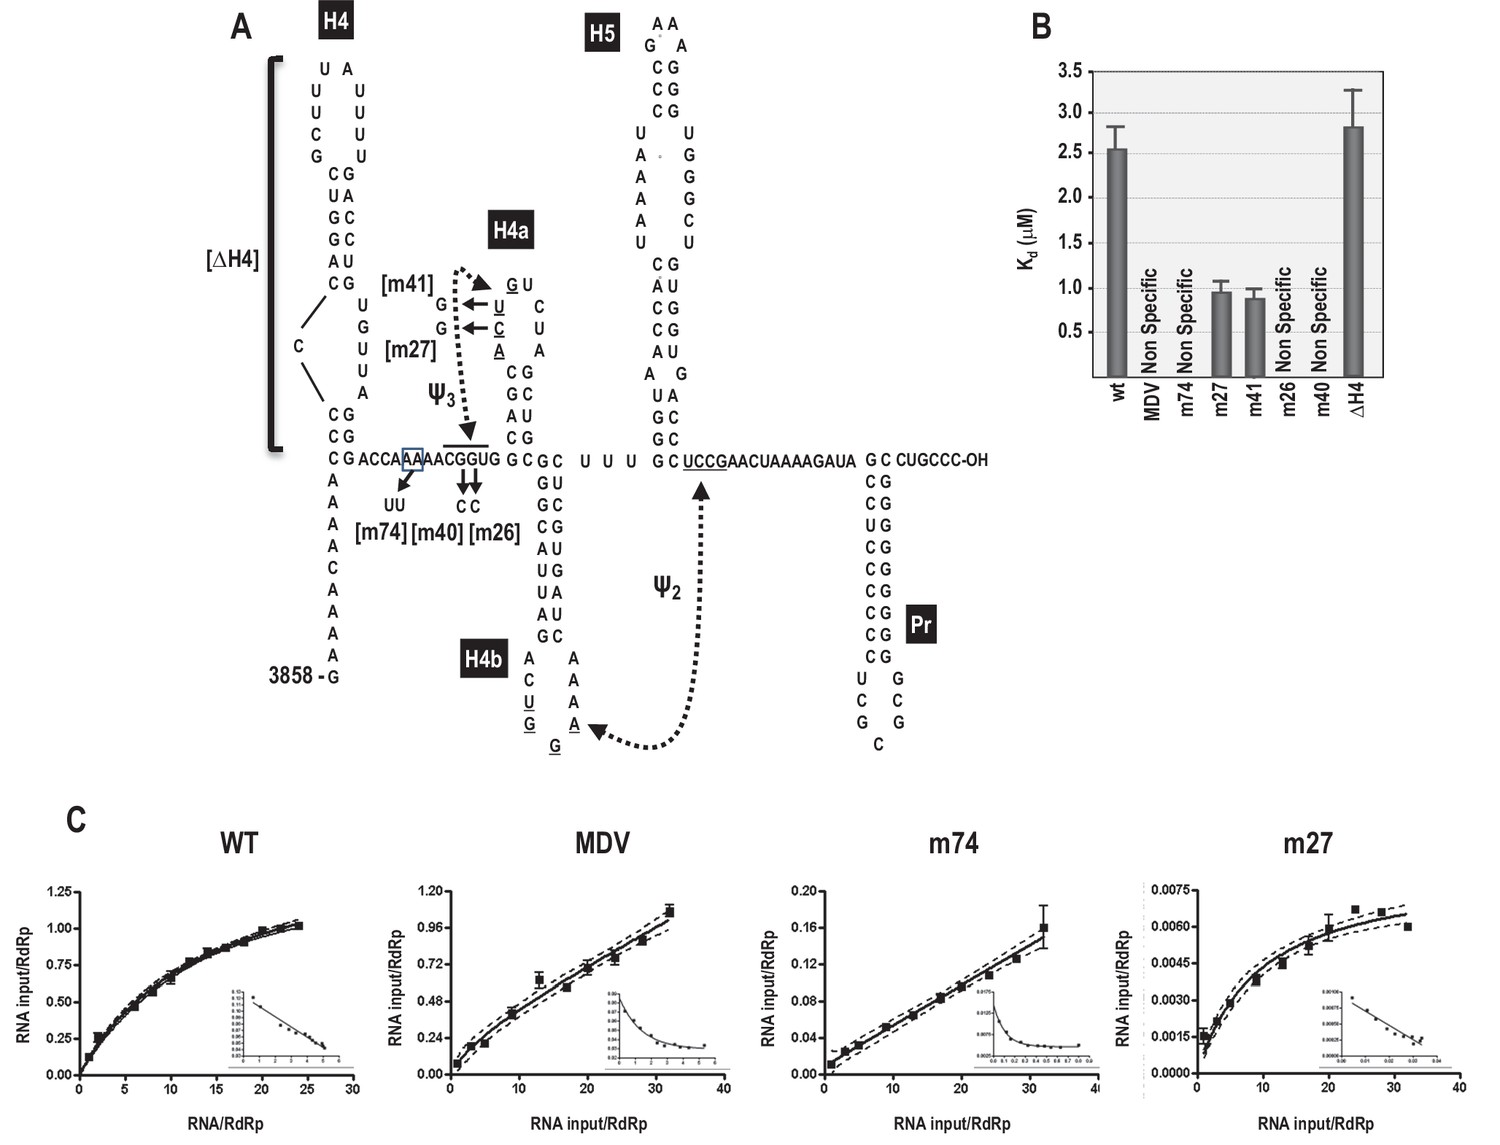
RdRp binding to mutant and wt 3’ fragments in vitro.
(A) Sequence and structure of the fragment used for RdRp binding. Locations and names of alterations are shown. ΔH4 is a complete deletion of hairpin H4. Numbering is from the 5’ end of the viral genomic RNA. (B) Five to 160 pmol of labeled wt and mutant fragments or control MDV RNA was combined with 11.4 pmol of purified, recombinant TCV RdRp, and bound RNA detected following filtration. MDV is a subviral RNA associated with Qβ bacteriophage and serves as a negative control for RdRp binding. (C) Selected saturation binding curves are shown together with Scatchard plots (insets). The similarity in non-linear Scatchard plots between MDV and m74 is interpreted as non-specific. For all assays, Kd were calculated from three independent experiments conducted in triplicate. Standard error bars are shown.
Figure 8 with 1 supplement
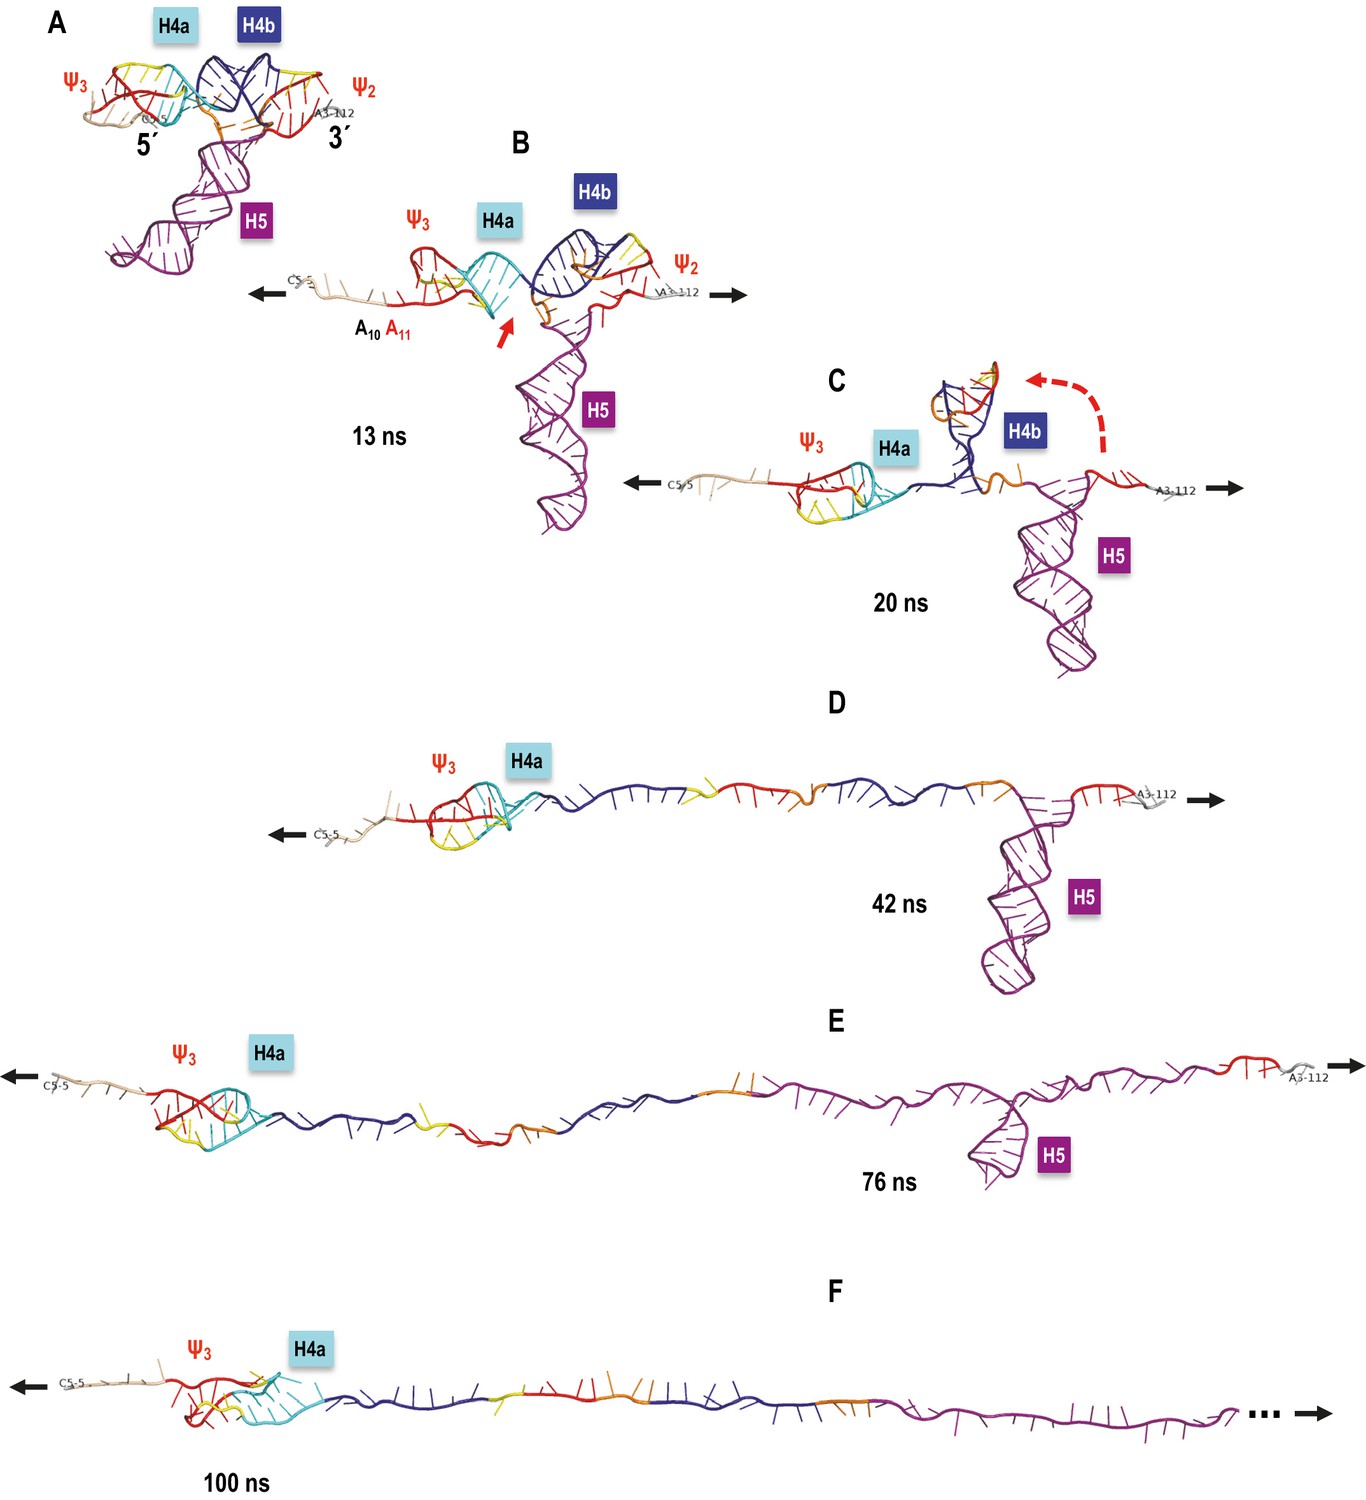
TCV TSS pulling simulation with Steered Molecular Dynamics (SMD).
Snapshots from an implicit solvent SMD simulations with a pulling speed of 0.005 Å/ps for the TSS fragment between C5 (labeled as 5´) and A112 (labeled as 3´), inclusively. (A) Initial TSS model with the 5As held by triple base interactions in the major groove of Ψ3. The initial distance between the ends is 66 Å. (B) After 13 ns of SMD simulations (~130 Å extension) the 5A are open and the initial end-to-end stacking between H4a and H4b also opens. (C) After 20 ns (~167 Å extension) H4b pivots to the vertical orientation shown, following opening of Ψ2 at approximately 19 ns time point. (D) After 42 ns (~279.5 Å extension) H4b is fully pulled apart, while H4a and H5 remain fully base-paired and Ψ3 nucleotides maintain a pseudoknot. (E) After 76 ns (~419 Å extension) H4a/Ψ3 holds while H5 is opening gradually with a pronounced pause at the C71-G100 base pair (refer to the text for details). (F) After H5 opens fully around 85 ns of the simulation, the remaining 5´ end of the TSS (H4a/Ψ3) begins to open around the 100 ns point shown (~566 Å of full extension) and is free of any base pairs after reaching the extension of 612 Å after approximately 109 ns (not shown). The 3´ end of the TSS in (F) is truncated (indicated by the three dots) to maintain the same scale in all panels.
Figure 8—figure supplement 1
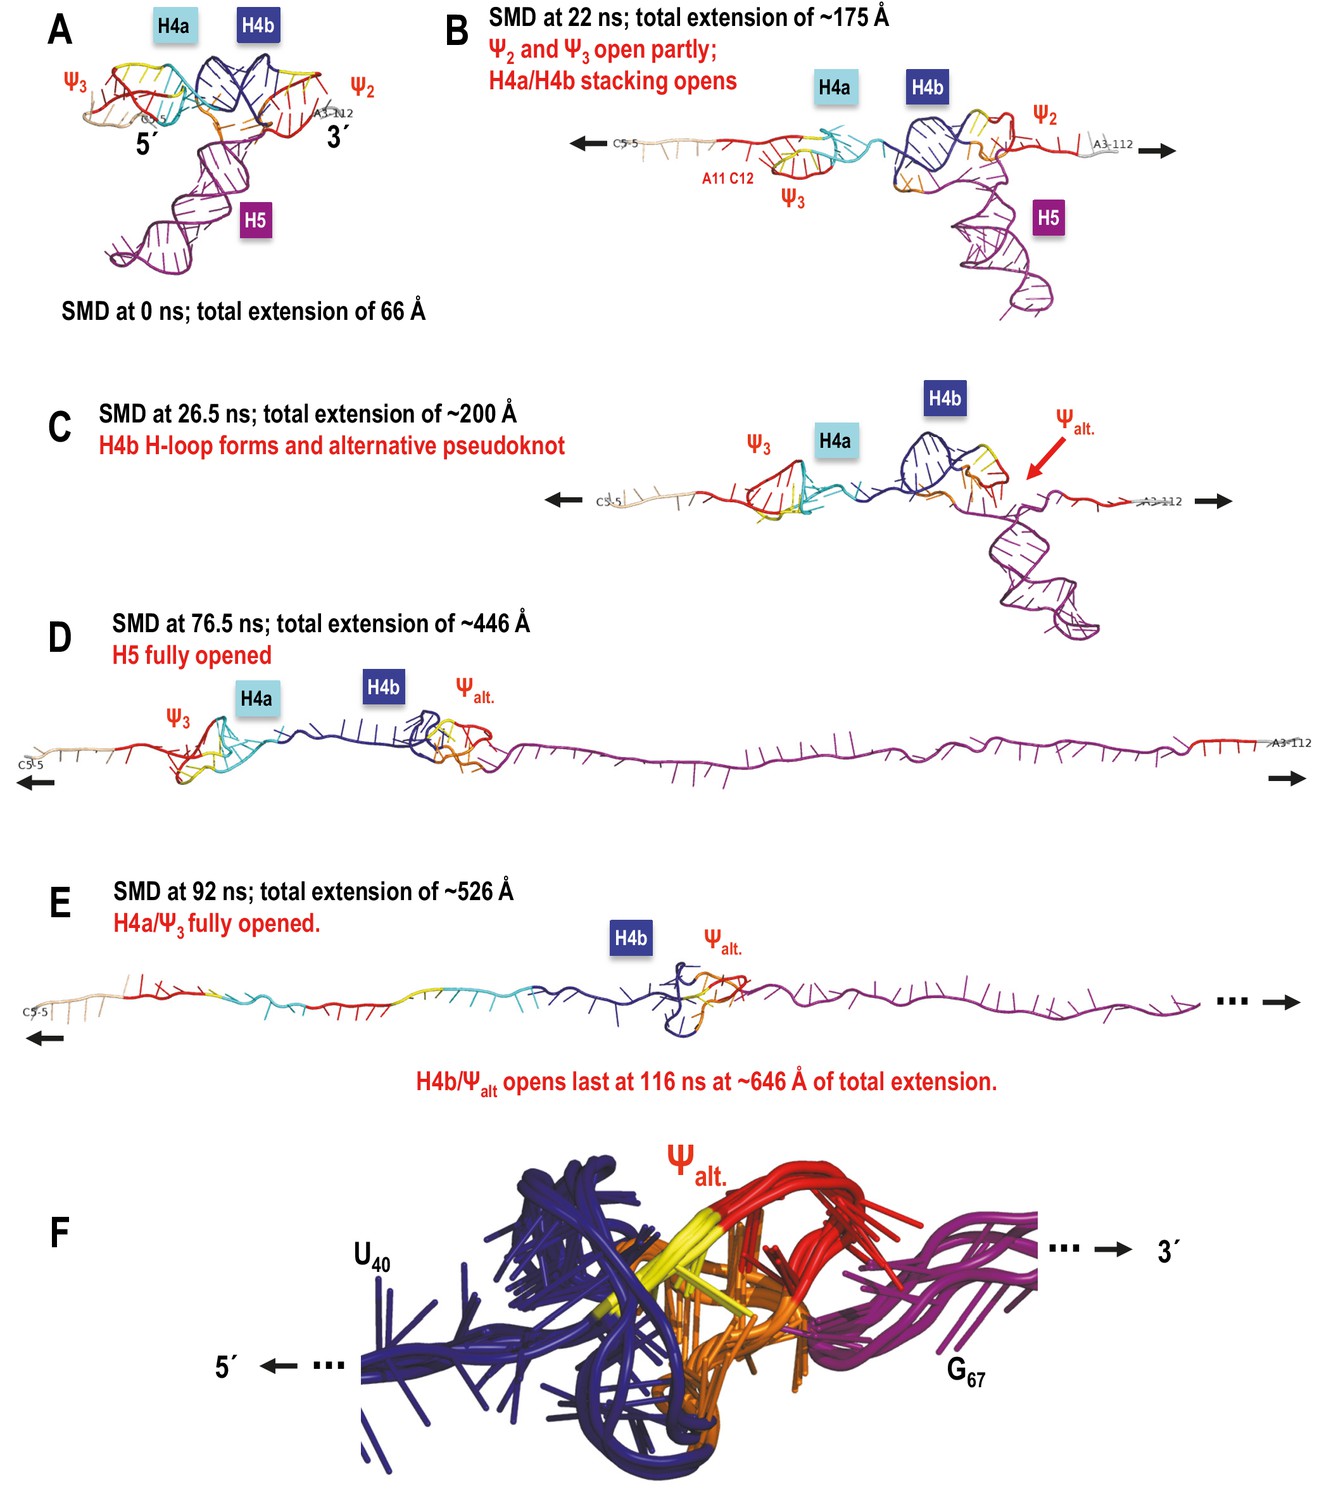
TSS simulated unfolding pathway showing the impact of transitional tertiary interactions between H4b and the unfolding chain on the coaxial orientation of H4b relative to the direction of pulling resulting in an altered order of unfolding events.
(A–E) In this simulation H5 opened first, followed by H4a/Ψ3 and H4b/Ψalt. opened last due to increased resistance of the locally knotted 3D conformation. (F) Enlarged alternative pseudoknot/knot conformation showing aligned structure snapshots taken between 55 and 92 ns time points in the SMD run. Overall the structure and its minor variants persisted from ~42 to 104 ns of the SMD trajectory. The resulting tertiary structure is oriented approximately coaxially with the direction of pulling, and even though topologically it is a pseudoknot, the 5’-end of the opening helix H4b is pulled through a loop (as if it was a true knot in 3D) that increases the number of opportunistic interactions. These add to the transient bonds formed by the ‘slipping’ hairpin loop of the horizontally oriented H4b as the whole structure is pulled apart, and offer more resistance to pulling than H4a/Ψ3, which is not ‘knotted’ in this way in 3D. In the absence of a new pseudoknot substituting for Ψ2 interactions with H4b, it is H4a/Ψ3 that offers the most resistance to pulling and opens last.
Videos
Video 1
TCV TSS optical tweezers pulling simulation movie.
A movie of aTCV TSS pulling simulation with Steered Molecular Dynamics (SMD). This movie shows the entire SMD trajectory (sampled to be viewed in a minute) for a simulated pulling speed of 0.005 Å/ps for the TSS fragment between C5 (labeled as 5´) and A112 (labeled as 3´), inclusively. This is a full trajectory from which the key state snapshots are shown in Figure 8. The initial distance between the ends is 66 Å. At ~130 Å of extension the 5' 5A open, followed by Ψ2 opening (~167 Å), full H4b (~279.5 Å), H5 (with a pause at the C71-G100 base pair) opening fully at ~494 Å. Finally, the TSS's 5' end (H4a/Ψ3) opens between ~566 Å and 612 Å of the full molecule extension. The simulation stops at 700 Å end-to-end extension.
Download links
A two-part list of links to download the article, or parts of the article, in various formats.
Downloads (link to download the article as PDF)
Open citations (links to open the citations from this article in various online reference manager services)
Cite this article (links to download the citations from this article in formats compatible with various reference manager tools)
Folding behavior of a T-shaped, ribosome-binding translation enhancer implicated in a wide-spread conformational switch
eLife 6:e22883.
https://doi.org/10.7554/eLife.22883


