Dilation of fusion pores by crowding of SNARE proteins
- School of Medicine, Yale University, United States
- Yale University, United States
- Columbia University, United States
- Laboratoire de Neurophotonique, Université Paris Descartes, Faculté des Sciences Fondamentales et Biomédicales, Centre National de la Recherche Scientifique, France
Figures
Figure 1 with 1 supplement
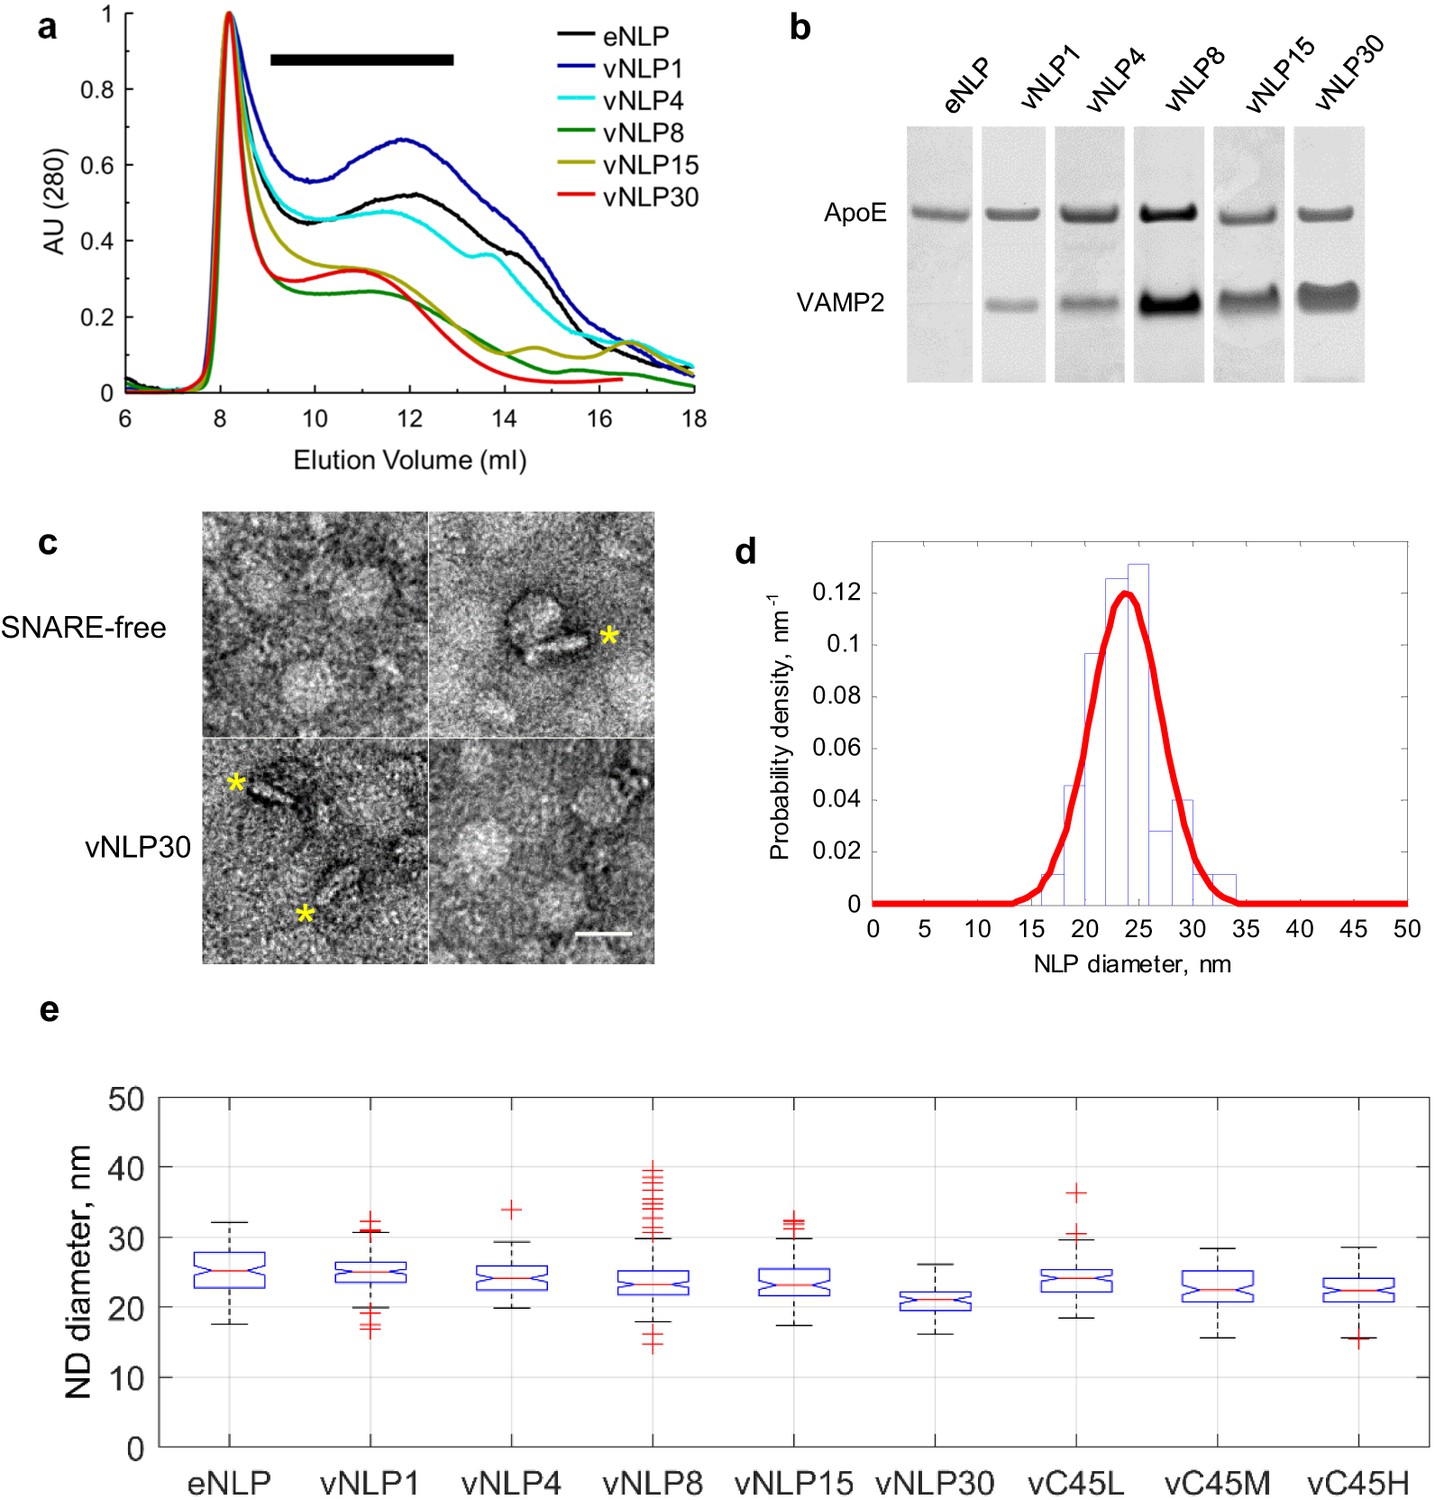
Size separation and characterization of NLPs.
(a) Representative size exclusion chromatograms for various NLP preparations as indicated. NLPs were detected by absorption at 280 nm. Typically, fractions comprising 9–13 ml were collected (black horizontal bar). (b) Coomassie-stained SDS PAGE of NLPs. For each preparation, the amount of VAMP2 relative to ApoE was determined using densitometry. (c) Representative negative-stain EM micrographs of NLPs. The top row are SNARE-free NLPs. The bottom row are NLPs loaded with 30 v-SNARE copies. NLPs marked with * are oriented perpendicular to the imaging plane and show the flat disc structure. Scale bar = 25 nm. (d) Distribution of NLP diameters for a representative vNLP15 sample, determined from analysis of micrographs as in (c). A normal distribution fit is shown (red line). (e) Boxplot of representative NLP sizes under various conditions. NLPs containing lipid-anchored VAMP2 (vC45L, vC45M, vC45H for low, medium, and high copy numbers of C45 lipid-anchored VAMP2, bearing ~1, 4, and 15 copies) had sizes comparable to NLPs bearing similar loads of wild-type VAMP2 (vNLP1, vNLP4, and vNLP15). The activity of these NLPs was tested in an established bulk fusion assay with t-SNARE-reconstituted liposomes (Figure 1—figure supplement 1).
Figure 1—figure supplement 1
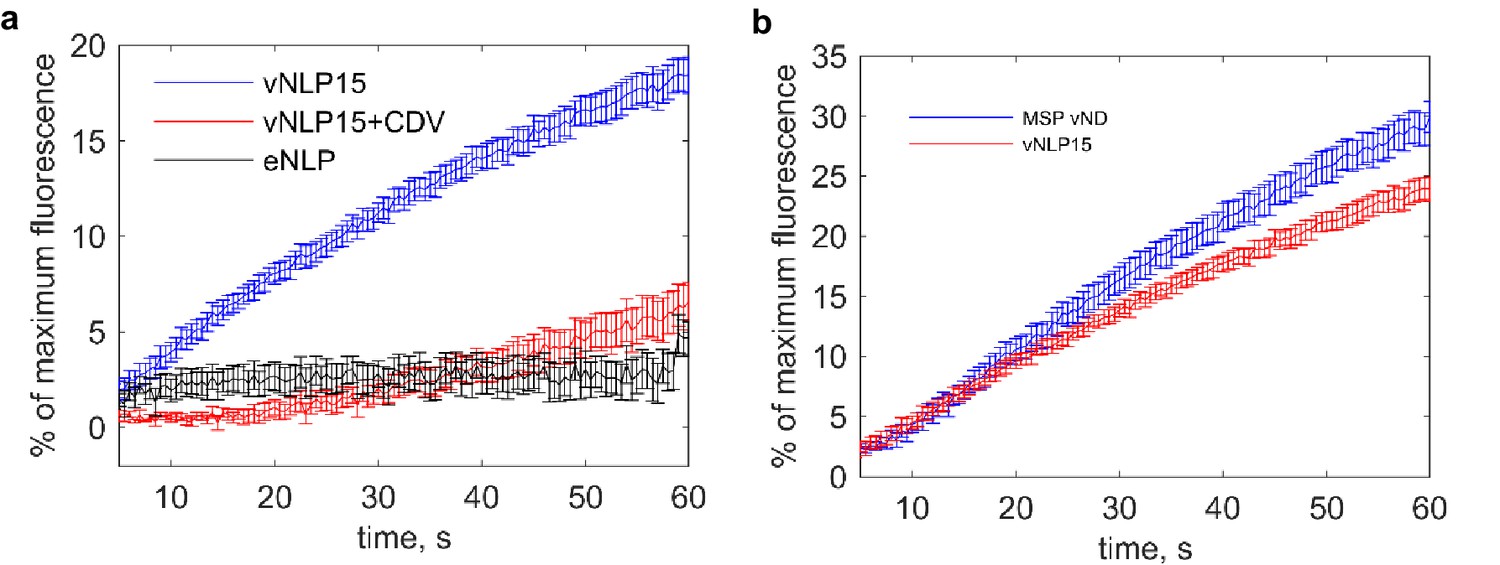
Bulk content release assay (Bello et al., 2016; Shi et al., 2012) shows that the fusion of vNLPs with t-SNARE-reconstituted small unilamellar vesicles (t-SUVs) is SNARE-dependent.
(a) Release of calcium from the liposome lumens as a function of time. t-SNARE liposomes initially entrapping calcium were mixed with vNDs. Fusion with vNDs leads to leakage of calcium through fusion pores. Binding of leaked calcium to the calcium-sensitive dye Mag-fluo-4, included in the fusion buffer, results in increased fluorescence. The maximum fluorescence was determined by adding detergent to release all entrapped calcium at the end of the reaction. Results are displayed as percentage of maximum fluorescence as a function of time. Nine independent measurements per condition were averaged. (b) Bulk calcium release rates are comparable for MSP or NLP discs bearing ~8 and ~15 copies of VAMP2, respectively, even though fusion pores can, in principle, grow to much larger sizes for NLPs. Thus, either the bulk contents release assay is insensitive to pore properties under these conditions or pores with similar properties occur in both cases. Single-pore measurements indicate that about 10% of vNLP15 pores reach large sizes (see main text). Eleven and eight independent measurements were averaged for MSP vND and vNLP15 conditions, respectively. The error bars represent standard errors of the means for both panels (a) and (b).
Figure 2 with 1 supplement
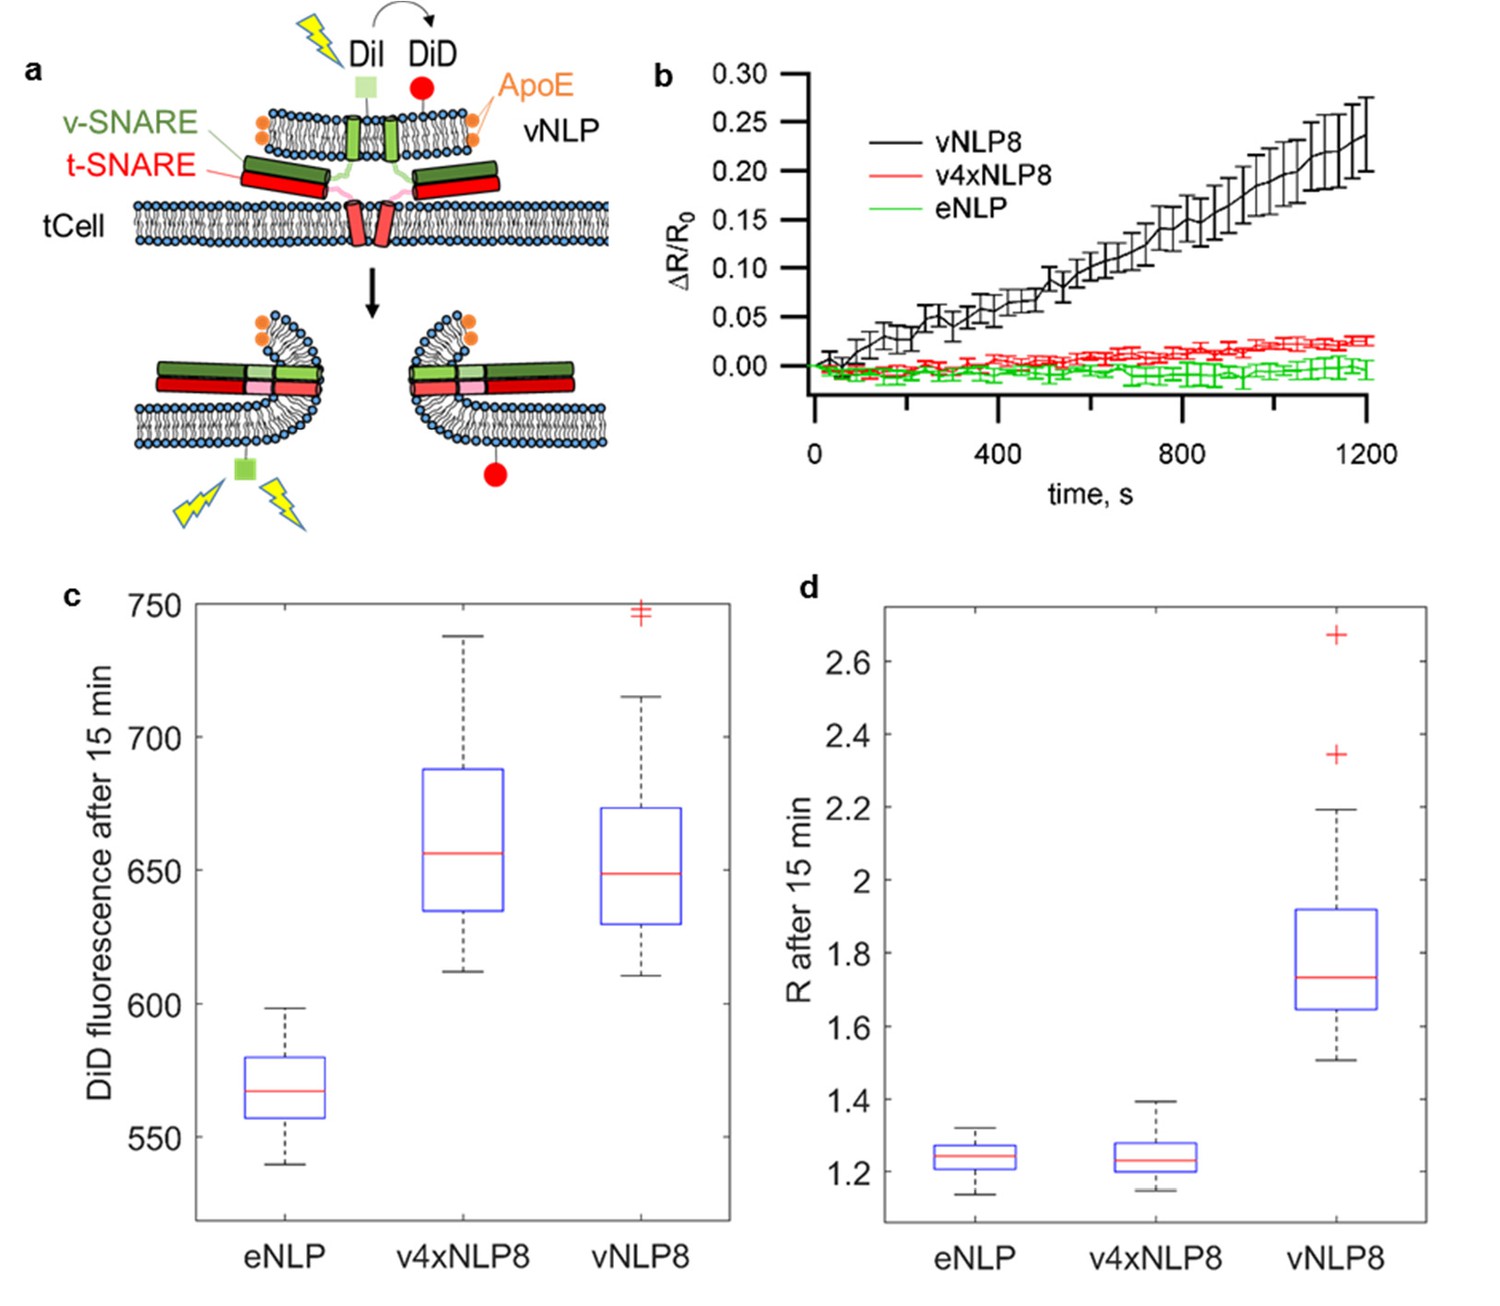
vNLPs induce lipid mixing when incubated with flipped t-SNARE cells (tCells).
(a) Schematic of the assay. (b) NLPs co-labeled with one mole % DiI and DiD were incubated with tCells for 30 min at 4°C, a temperature that allows docking but not fusion. Cells were then rinsed with cold PBS to remove free NLPs, and PBS pre-warmed to 37°C was added. Imaging of DiI and DiD fluoresce started shortly after the dish was mounted onto a confocal microscope stage held at 37°C. For each imaging cycle, we sequentially acquired DiI and DiD fluorescence (λex =561 nm and 647 nm for DiI and DiD, respectively). We quantified cell membrane DiI and DiD fluorescence and calculated the ratio of these two intensities, R. DiI fluorescence reports lipid mixing, while the DiD fluorescence is proportional to the amount of docked NLPs per cell. Thus, the ratio R normalizes the lipid-mixing signal to the amount of docked NLPs. Averages of 69, 73, and 47 regions of interest (± S.E.M.) from 7, 7, and 3 dishes are shown for NLPs loaded with ~eight copies of VAMP2 (vNLP8), for NLPs loaded with ~eight copies of the VAMP2-4x mutant (which are docking-competent but fusion incompetent – v4xNLP8), and for empty NLPs (eNLPs), respectively. (c,d) Confocal imaging after 15 min incubation and washing of NLPs with tCells at 37°C. (c) DiD fluorescence reflects the amount of docked NLPs per cell. NLPs reconstituted with ~eight copies of VAMP2-4X (v4xNLP8) docked with the same efficiency as wild-type VAMP2 NLPs bearing the same SNARE copy number (vNLP8). (d) DiI/DiD fluorescence ratio (R) reports lipid mixing normalized to the amount of docked NLPs per cell. Despite efficient docking, v4xNLP8 did not induce any lipid mixing. eNLP, empty (SNARE-free) NLPs. For (c) and (d), 6, 10, and 11 dishes were measured and 41, 66, and 63 regions of interest analysed for eNLP, v4xNLP8, and vNLP8, respectively.
Figure 2—figure supplement 1
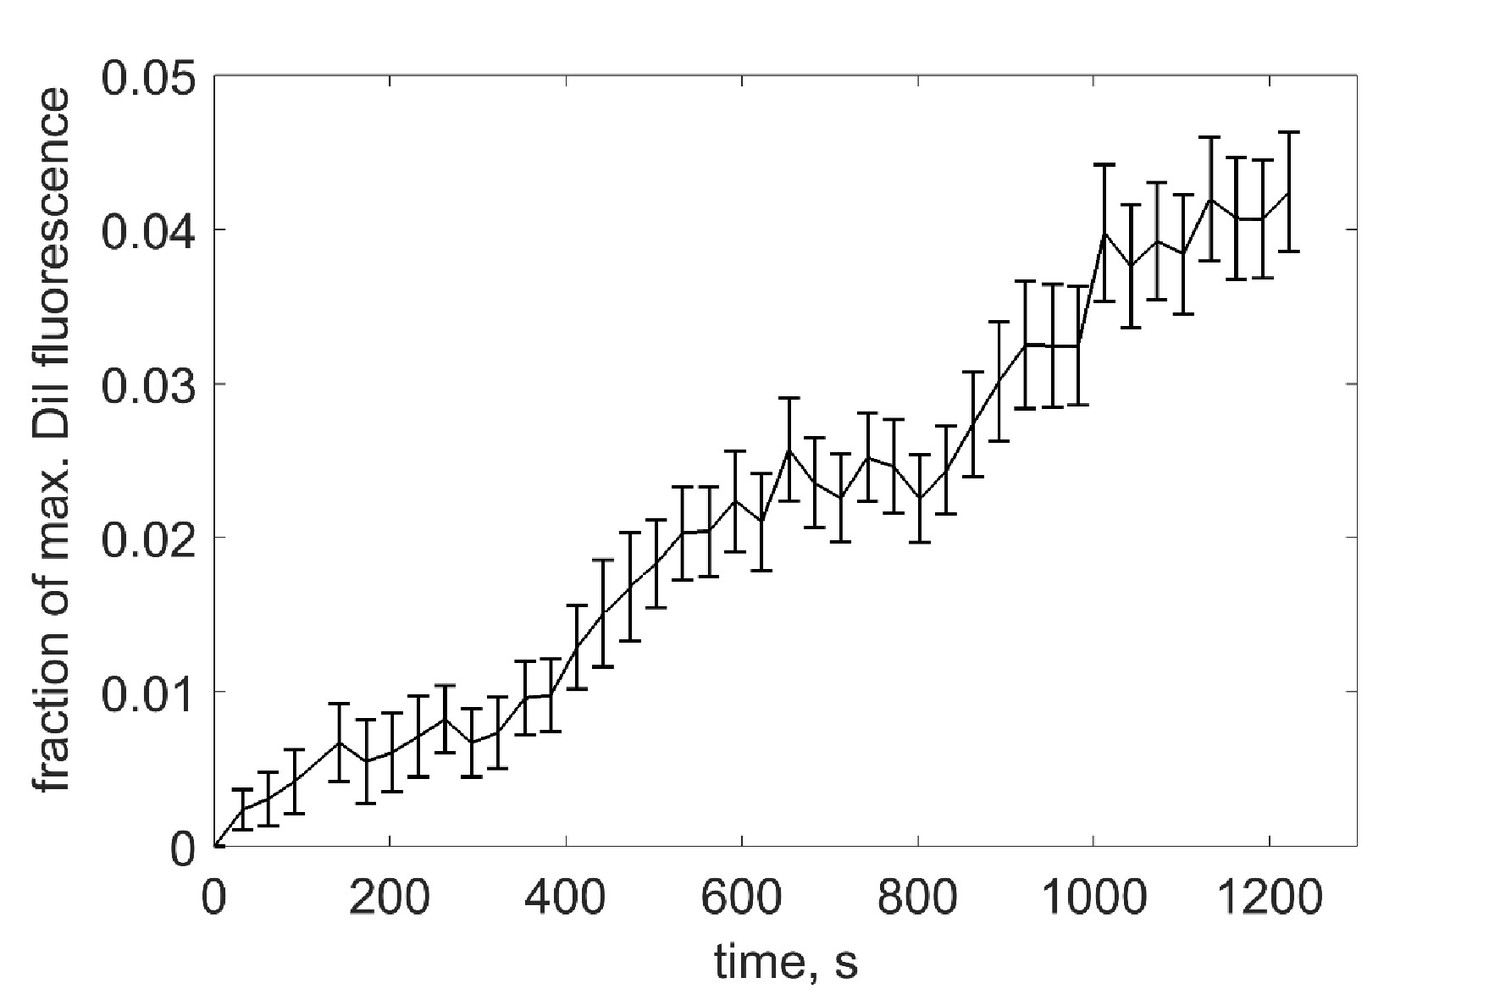
Estimation of the extent of lipid mixing.
vNLPs co-labeled with one mole % each of DiI and DiD were incubated with tCells for 30 min at 4°C, a temperature that allows docking, but not fusion. Cells were then rinsed with cold PBS to remove free NLPs, and PBS pre-warmed to 37°C was added. Imaging of DiI and DiD fluoresce started shortly after the dish was mounted onto a confocal microscope stage held at 37°C. At the end of the experiment, the DiD (acceptor) fluorescence was completely bleached using direct excitation at 647 nm with 100% laser power to obtain the maximum possible donor (DiI) intensity, . We then rescaled the donor fluorescence values to obtain the fraction of maximum DiI fluorescence: , where is the minimum at the beginning of acquision.
Figure 3 with 1 supplement
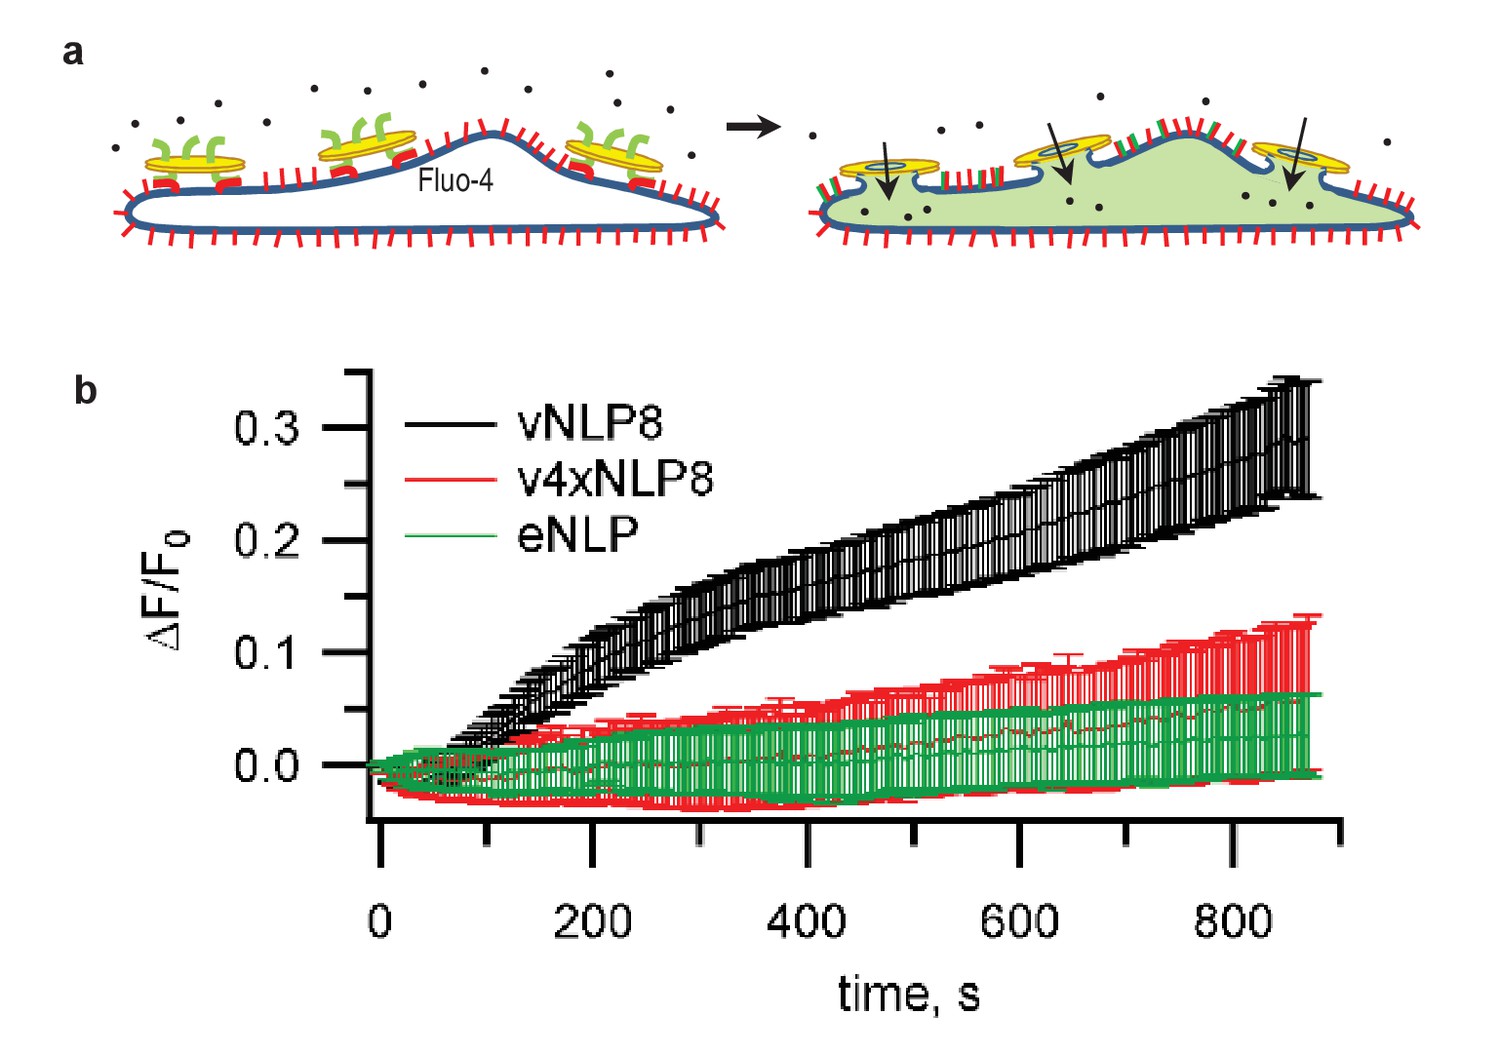
Calcium-influx assay.
(a) Schematic of the assay. (b) tCells were loaded with the Ca2+ indicator Fluo-4, whose fluorescence was imaged as a function of time. Opening of fusion pores allowed Ca2+ influx into the cytosol, causing the Fluo-4 signal to increase for vNLP8 (10 dishes), but not for v4xNLP (six dishes) or eNLP (four dishes) samples. The fluorescence from the entire viewfield for each dish was averaged. Displayed errors are S.E.M.
Figure 3—figure supplement 1
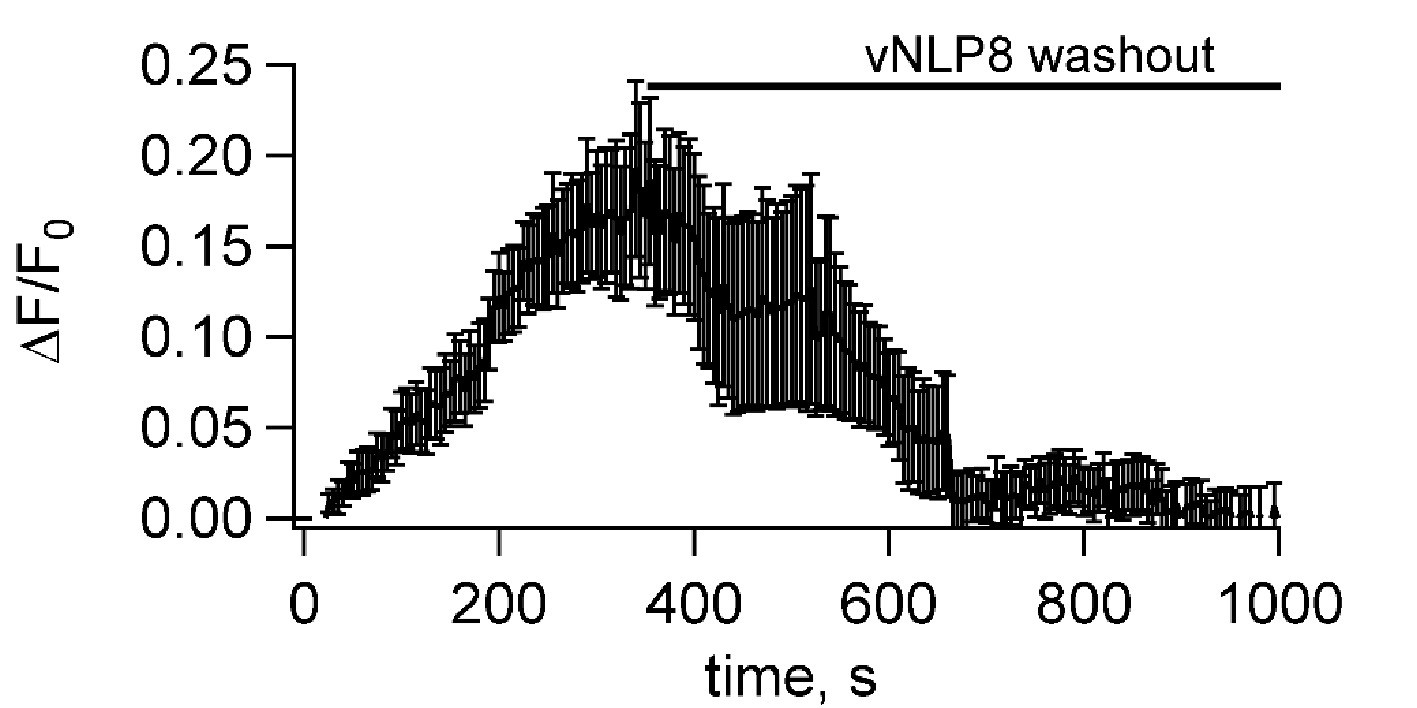
Fusion pores connecting NLPs to cells eventually close.
Flipped t-SNARE cells were loaded with the Ca2+ indicator Fluo-4, whose fluorescence was imaged as a function of time after addition of NLPs bearing eight copies of VAMP2, as in Figure 3. Opening of fusion pores allowed Ca2+ influx into the cytosol, causing the Fluo-4 signal to increase. To test whether the pores eventually closed, free NLPs were washed out after 5 min, as indicated. This caused the Fluo-4 signal to return to baseline within a few minutes, indicating that pores eventually closed. Data from six dishes; error bars are S.E.M.
Figure 4 with 3 supplements

Detection of single-pores between vNLP nanodiscs and tCells.
(a, b) Schematic of the assay. A glass pipette seals a patch on the tCell membrane. The pipette solution includes NLPs. When a vNLP fuses with the tCell membrane (b), a nm-sized pore opens and connects the cytosol to the pipette solution. Thus, currents through voltage-clamped pores report fusion and pore properties with sub-ms time resolution. In (b), the bilayers, the SNAREs and the NLP are drawn approximately to scale. The light, medium and dark shades of green and red indicate the transmembrane, linker, and SNARE domains of the v- and t-SNAREs, respectively. (c) Pores are SNARE-induced. When empty NLPs (eNLPs), the cytoplasmic domain of VAMP2 (CDV), the tetanus neurotoxin light chain (TeNT), or NLPs loaded with the docking-competent, fusion-incompetent VAMP2-4X mutant (v4xNLP8) were used, only a very low level of current activity was recorded compared to the currents resulting from NLPs loaded with ~eight copies of wild-type v-SNAREs. The number of pores/patches are indicated for each condition. (*** indicates p<0.001, t-test against vNLP8). (d) An example of a fusion pore current ‘burst’. Fusion leads to fluctuating and flickering currents that are well separated in time from one another. A threshold (red dotted line) and a minimum crossing time are imposed to define pore open periods (Materials and methods and Wu et al., [2016]). Detected sub-openings are indicated with colored bars above the current trace. (e) Average probability density function (PDF) of open-pore conductances. (f) Averaged PDF of open-pore radii. Data are from 61 fusion pores, 26 cells. (g) Free energy profile calculated from the distribution of pore sizes in (f). Distributions of flicker numbers per pore and burst lifetimes are shown in Figure 4—figure supplement 1. Additional examples of current bursts are provided in Figure 4—figure supplement 2.
Figure 4—figure supplement 1

Additional properties of single fusion pores connecting NLPs loaded with eight copies of VAMP2 and flipped t-SNARE cells (64 pores from 26 cells).
(a) Distribution of flicker numbers, and fitted geometric distribution. The red dots are a fit to a geometric distribution, , 3,... with (95% confidence interval: ). Mean ± S.E.M. was 16 ± 2.7 flickers. (b) Distribution of burst lifetimes, , as defined in (d), and exponential best fit (red curve). Mean ± S.E.M. = 10.3 ± 2.2 s.
Figure 4—figure supplement 2
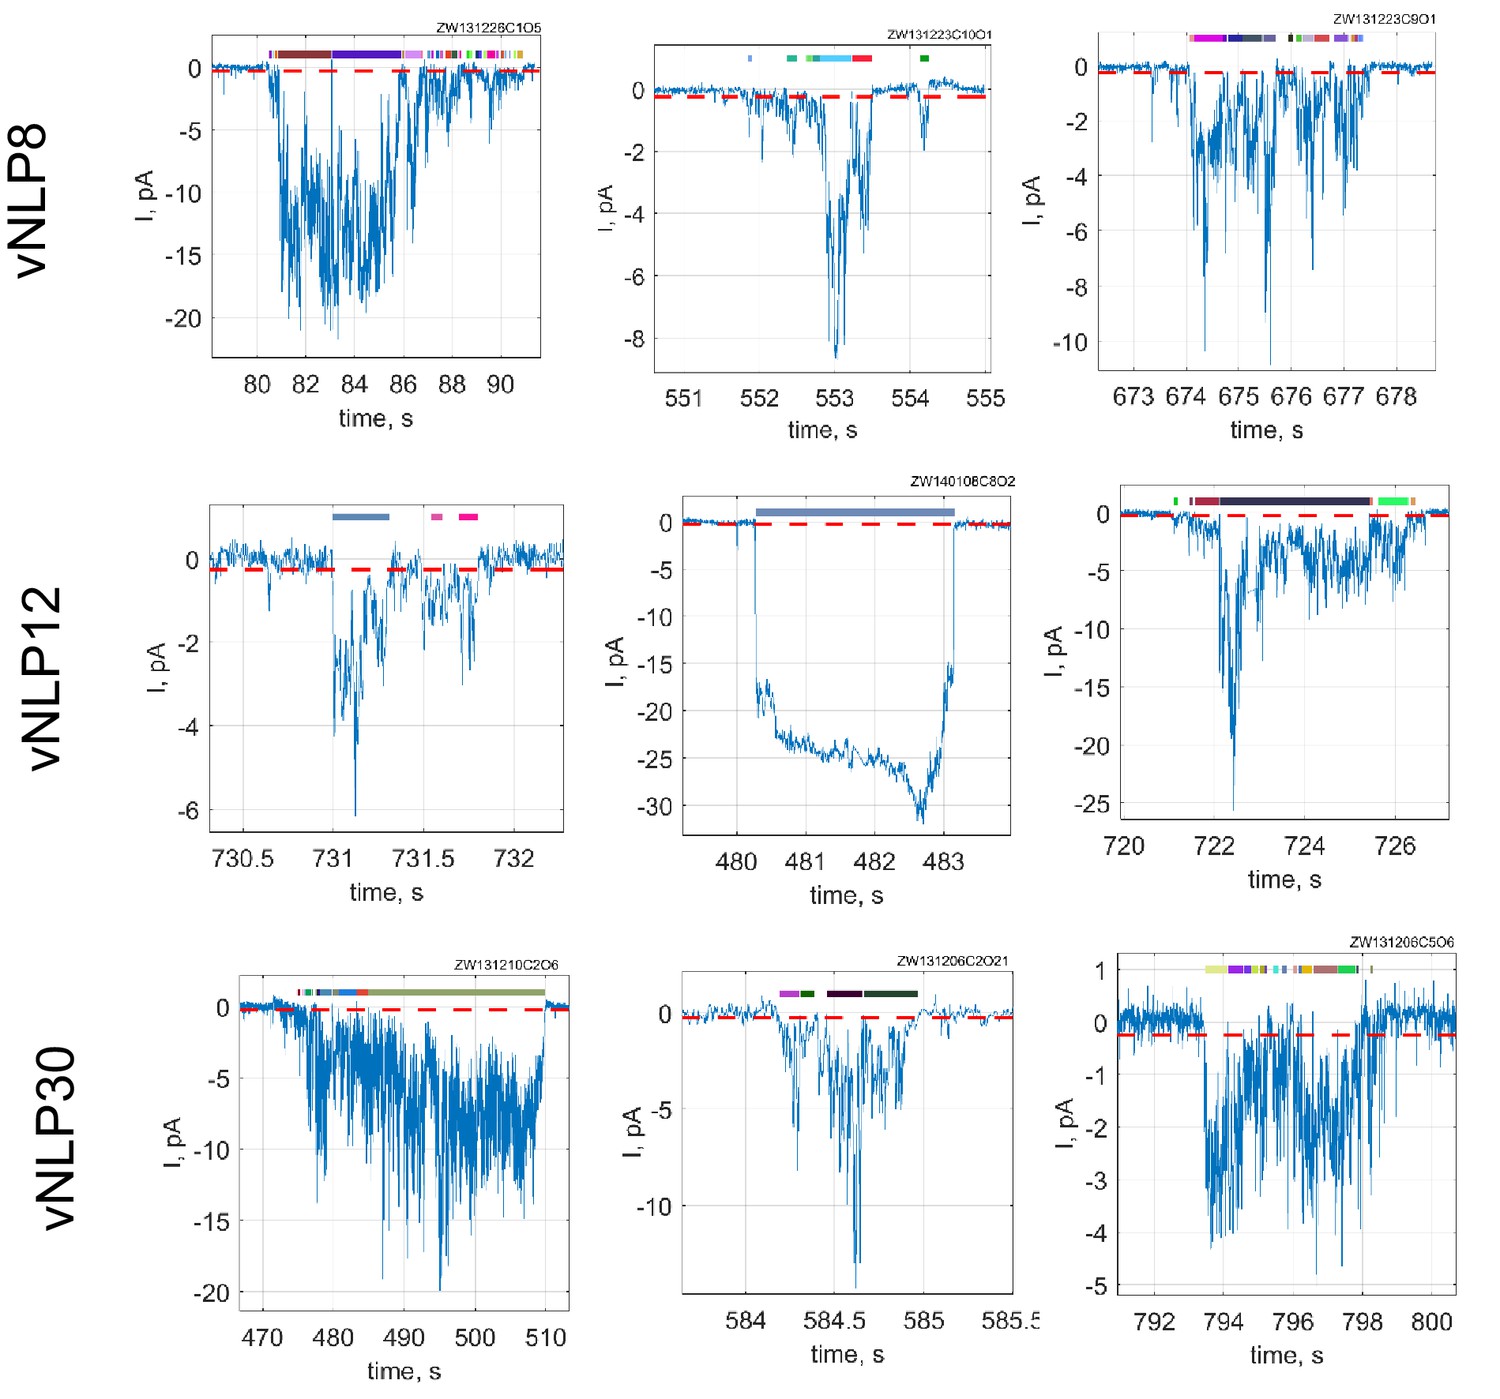
Additional examples of current bursts.
Red dashed lines indicate −0.25 pA threshold. During a burst, a pore is considered open if it crosses this threshold for at least 15 consecutive points (60 ms). Detected open sub-periods are indicated by colored bars above the traces.
Figure 4—figure supplement 3
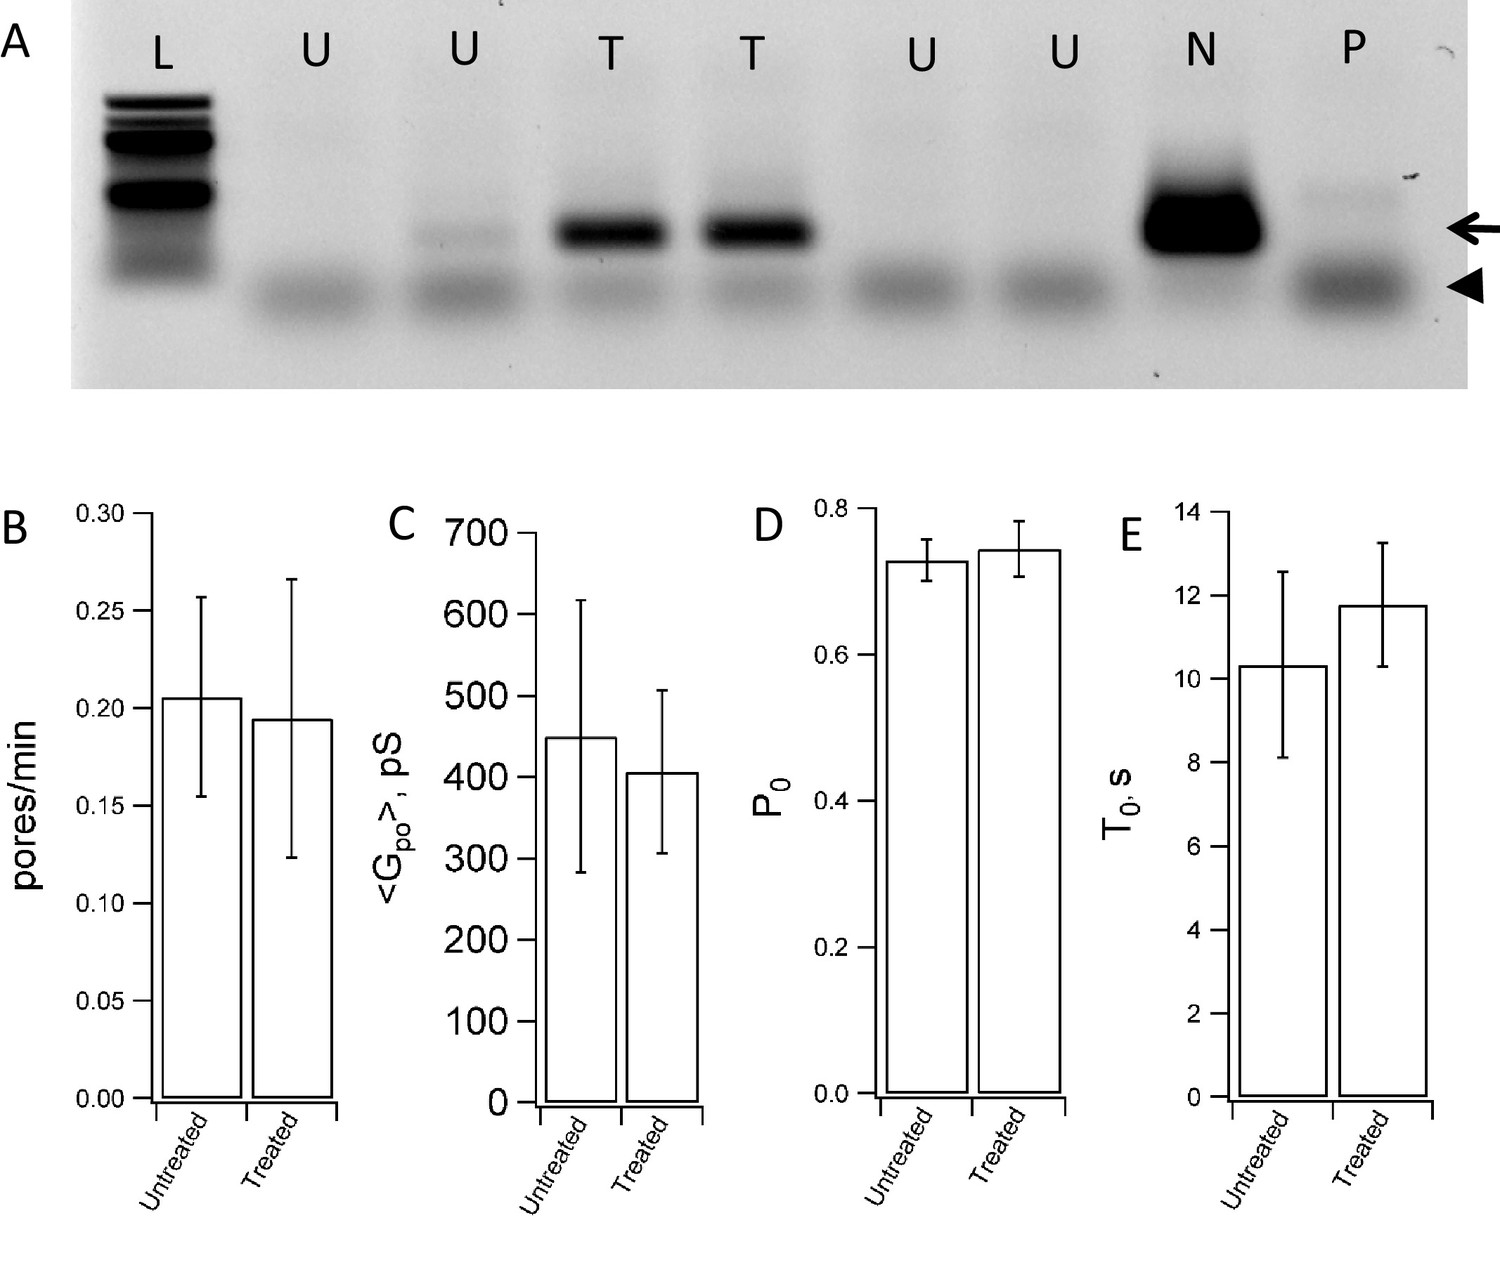
Mycoplasma contamination does not affect fusion with NLPs.
(A) Testing of flipped t-SNARE cells for mycoplasma contamination. Mycoplasma-negative control (lane marked N) shows the internal control band at 479 bp (arrow). The positive control (lane marked P) shows a band at 270 bp (arrowhead) and an additional band of the internal control at 479 bp. The 479 bp internal control DNA of the detection kit fades with increased number of amplicons formed from mycoplasma DNA. Lane L is the ladder, lanes marked U test untreated flipped t-SNARE cells, and lanes marked T test flipped t-SNARE cells treated with an anti-mycoplasma agent. Anti-mycoplasma treatement reduced contamination substantially. (B–E) Fusion between NLPs bearing eight total copies of v-SNARE (vNLP8) and flipped t-SNARE cells that were either untreated or treated for mycoplasma contamination. The rate at which pores appear (B), the mean pore conductance (C), the pore open probability during a burst (D) and the pore lifetime (E) are indistinguishable for untreated vs. mycoplasma-treated cells. 64 pores from 26 patches were recorded from untreated cells and 51 pores from 21 patches were recorded from treated cells.
Figure 5 with 4 supplements
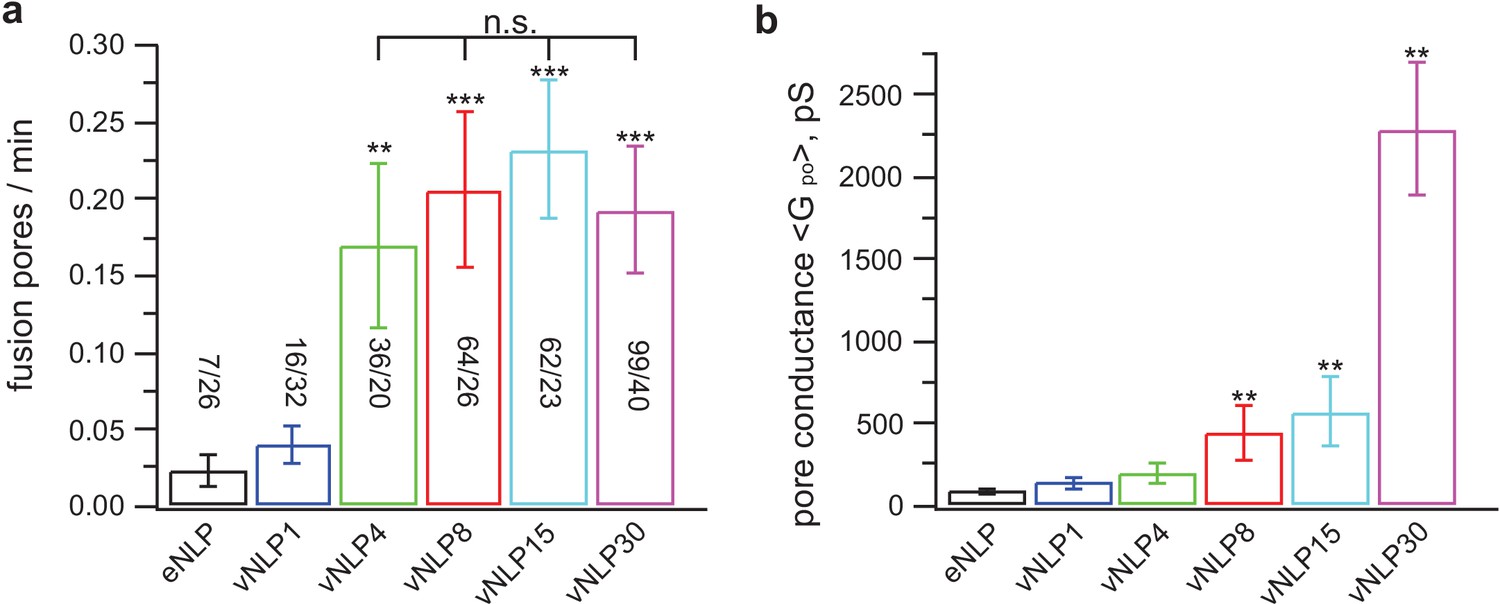
Only a few SNARE complexes are required to nucleate a pore, but more than ~15 are required to dilate it.
( a) Pore nucleation rate as a function of total v-SNARE copy number per NLP. Copy numbers per NLP face are approximately 0, 1, 2, 4, 7.5, and 15 for eNLP and vNLP1 through vNLP30, respectively. Pore nucleation requires ~two copies per NLP face and saturates at two to four copies per NLP face. n.s. indicates no statistically significant differences for the mean fusion rates among vNLP4, vNLP8, vNLP15, and vNLP30 samples, as assessed by an analysis of variance (ANOVA) and multiple pairwise comparisons of the group means. The source and analysis files are provided as Figure 5—source data 1. (b) Mean single-pore conductance, as a function of number of v-SNARE copies loaded into NLPs. increases rapidly as increasing numbers of v-SNAREs are loaded per NLP. At the maximum value tested, ~15 copies per NLP face, is far from saturating. The number of pores analyzed/total number of cells is indicated for each condition in (a). **, *** indicate p<0.01 and 0.001, respectively, using the two-sample t-test (a) or the Kolmogorov-Smirnov test (b) to compare with eNLP. Additional pore properties are shown in Figure 5—figure supplement 1. Properties of pores induced using lipid-anchored v-SNAREs are shown in Figure 5—figure supplement 2.
-
Figure 5—source data 1
Statistical analysis of fusion rates reported in Figure 5a.
Multiple pairwise comparisons of the group means were performed using 1-way analysis of variance (ANOVA) and a multiple comparison test using Matlab. The zipped file includes a matlab file (Figure 5a_FusionPoresPerMin_vs_vNLPcopies.mat) containing the fusion rate data and the results of the ANOVA and multiple comparison tests. Three figures summarize the test results (Figure 5a_ANOVAtable.fig, Figure 5a_ANOVAboxplot.fig, and Figure 5a_multcompare.fig). The analysis procedure and the results are explained in the pdf file Figure 5a_FusionRateAnalysis_summary.pdf.
- https://doi.org/10.7554/eLife.22964.013
Figure 5—figure supplement 1
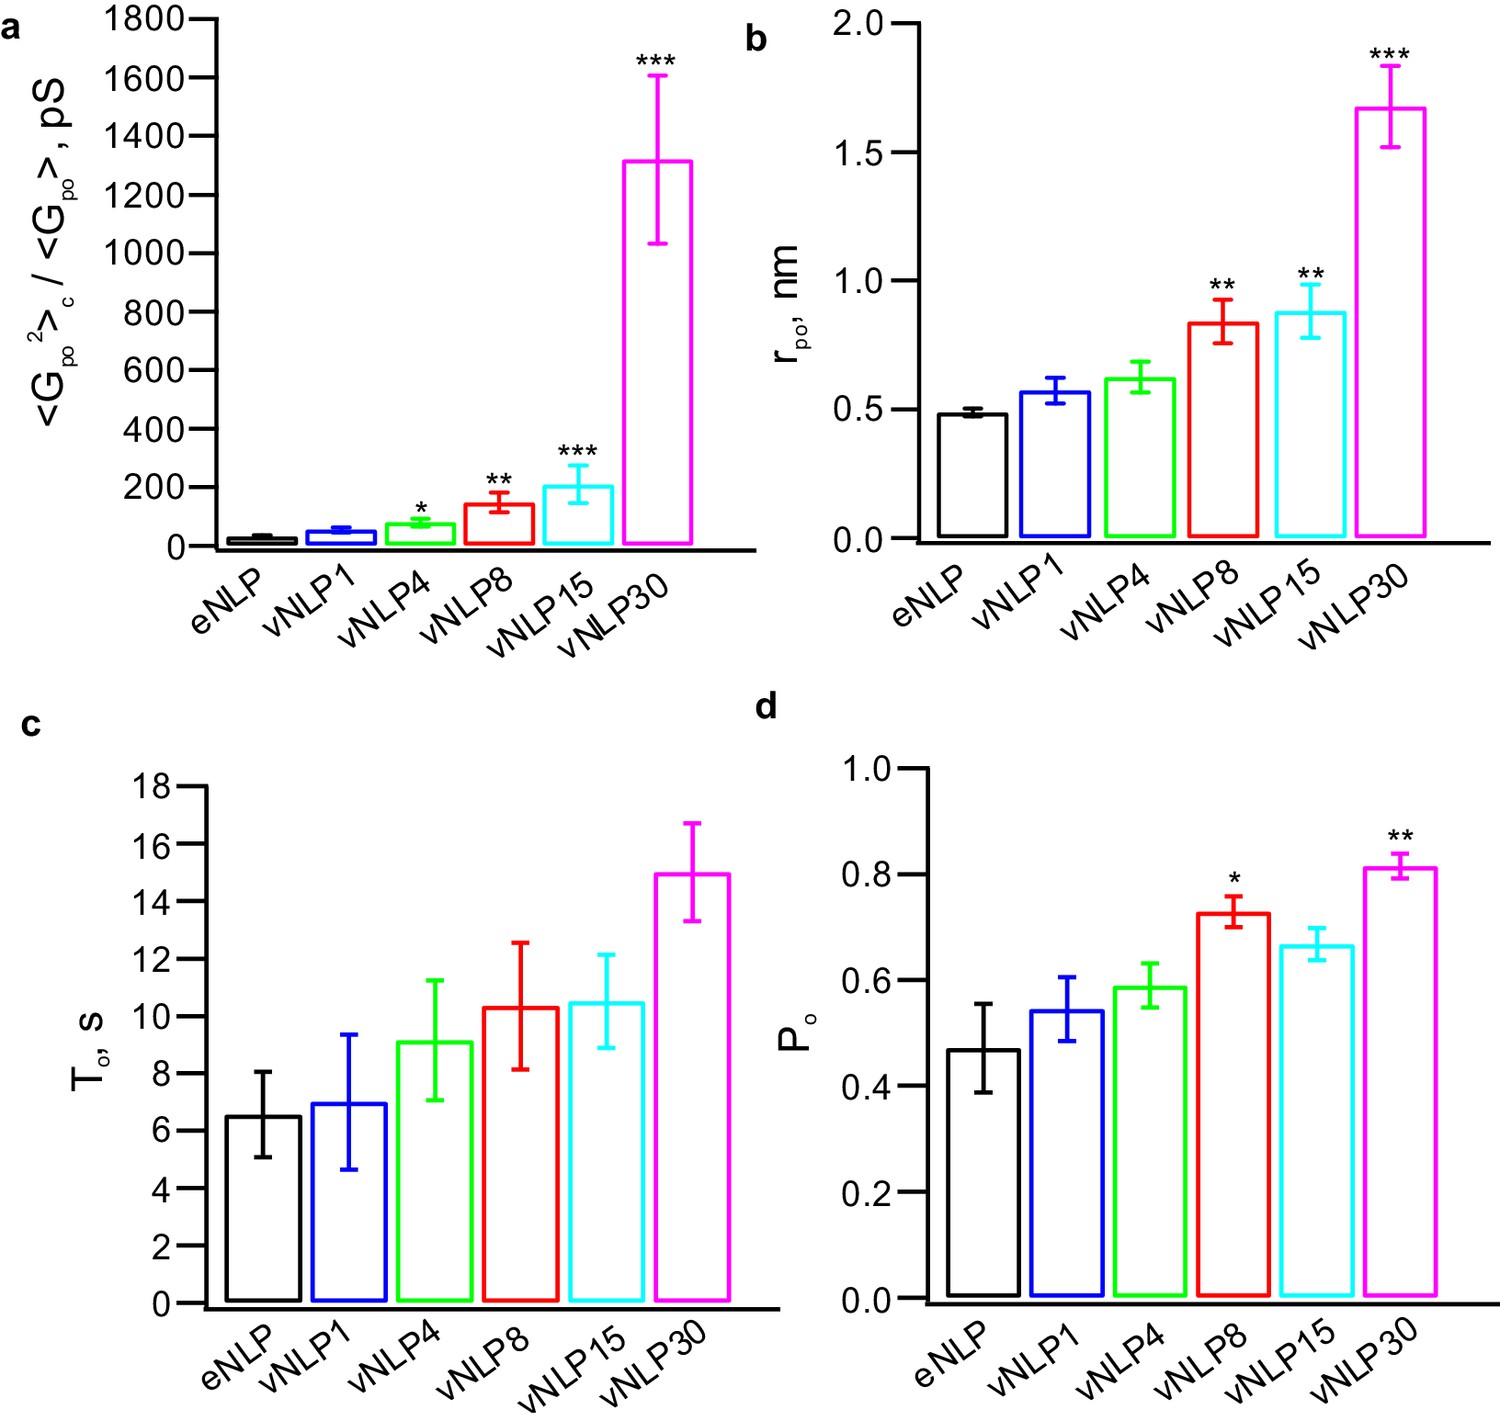
Additional pore properties as a function of v-SNARE copy number per NLP.
(a) Conductance fluctuations relative to mean . (b) Mean open-pore radii . (c) Pore lifetime, . (d) Burst open probability . eNLP, empty (SNARE-free) NLPs. The numbers in vNLP1 through vNLP30 indicate the total v-SNARE copy numbers per NLP. *, **, *** indicate p<0.05, 0.01, and 0.001, respectively, using the Kolmogorov-Smirnov test to compare with eNLP.
Figure 5—figure supplement 2
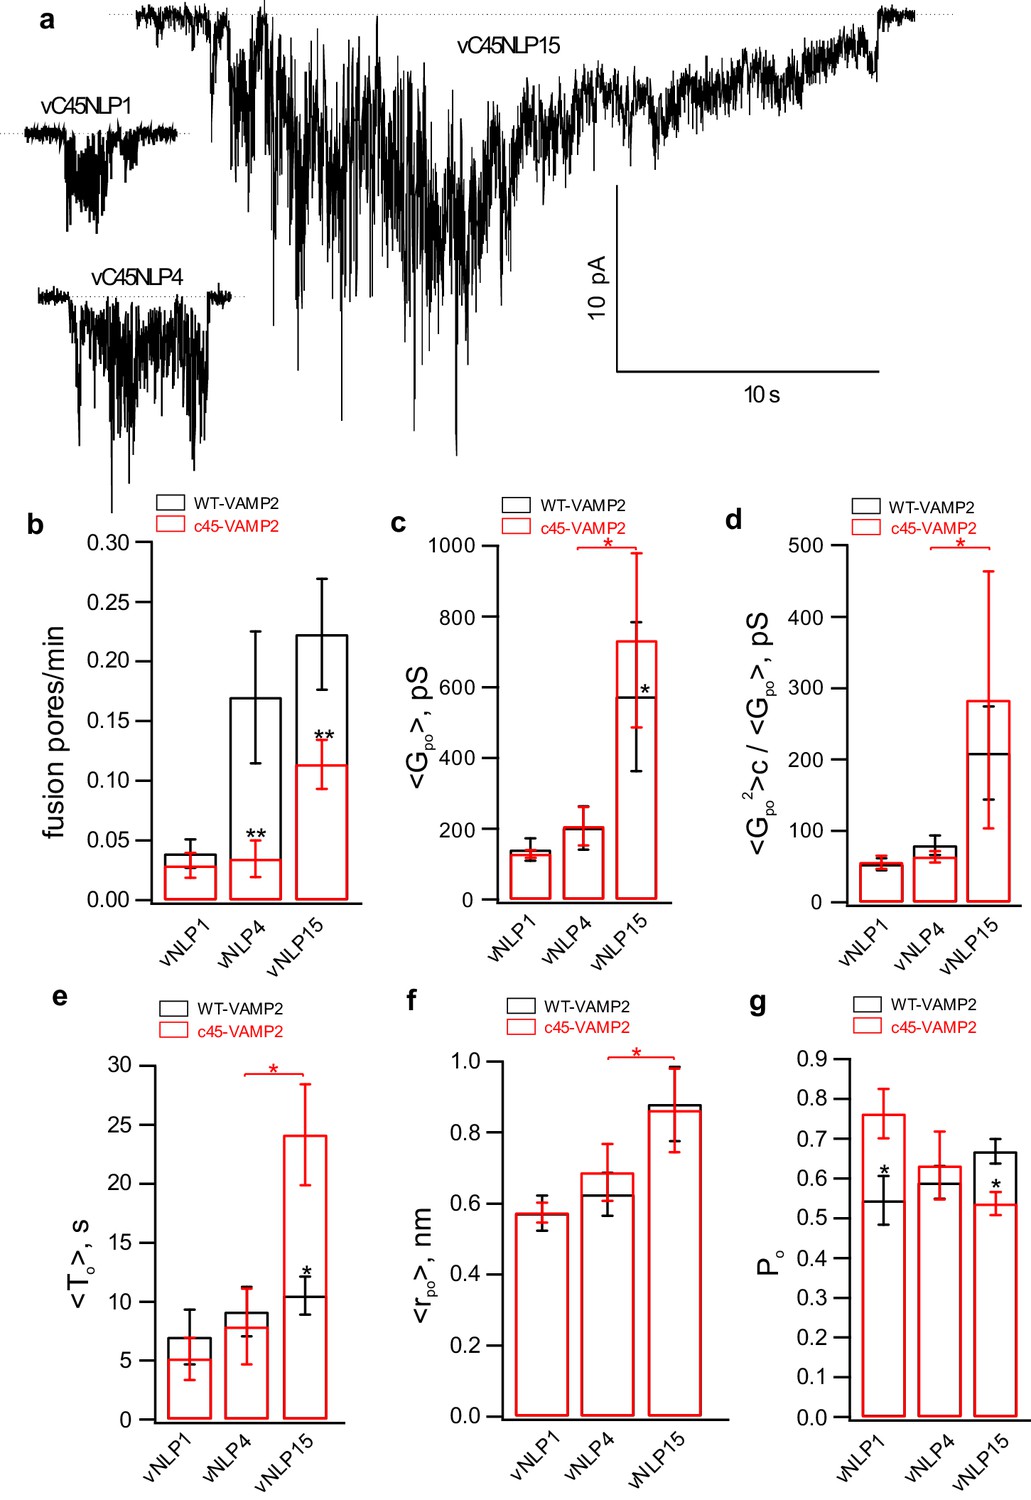
Larger numbers of lipid-anchored v-SNAREs promote pore dilation.
(a) Sample traces for NLPs loaded with different copy numbers of lipid-anchored VAMP2. (b–g) Fusion pore properties of lipid-anchored (red) and wild-type (black) v-SNARE NLPs (see legend of Figure 5—figure supplement 1 for parameter definitions). Replacing VAMP TMD with a C45 lipid anchor reduced the rate of pore nucleation (b) but made nucleation events last longer (e), consistent with previous results using smaller MSP NDs (Wu et al., 2016). Overall trends as a function of copy number were similar for all parameters for C45 and WT vNLPs. The number of pores/patches were 90/63, 12/30, and 11/29 for vC45NLP15, vC45NLP4, and vC45NLP1, respectively.
Figure 5—figure supplement 3

Swapping the locations of the v- and t-SNAREs does not affect pore properties.
Flipped v-SNARE cells were fused with t-SNARE NLPs (loaded with 4 or 15 total copies of t-SNAREs, tNLP4 and tNLP15), inverting the target membrane. For a given SNARE copy number in NLPs, burst lifetime (a), mean open-pore conductance (b), and probability that a pore is open during a burst were indistinguishable between the vNLP_tCell and tNLP_vCell configurations. The number of patches/pores are indicated for each condition in (a). The same numbers apply to (b) and (c). For vNLP_tCell fusion, results are copied from Figure 5 and Figure 5—figure supplement 1 to facilitate comparison.
Figure 5—figure supplement 4
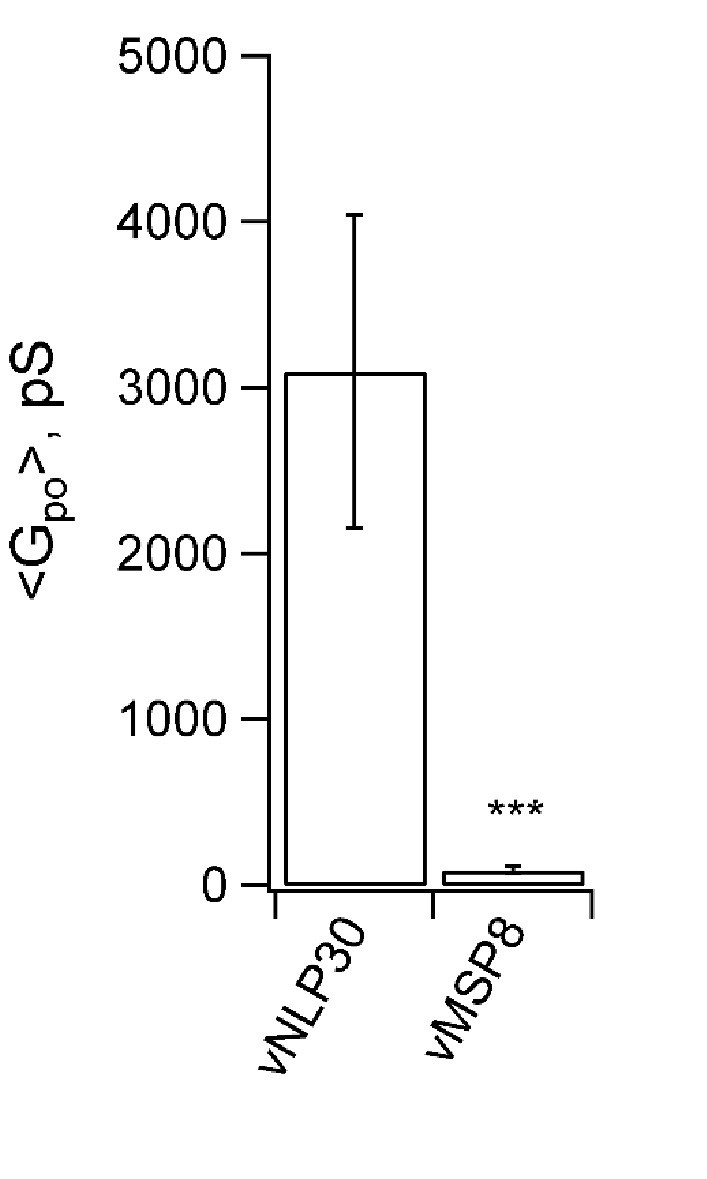
Permeability of pores to NMDG+.
Sodium in the pipette solution was replaced with N-methyl-D-glucamine (NMDG+), a large ion of nm in size without its hydration shell (Melikov et al., 2001), to test its passage through the fusion pores. Conductance was low when ~15 nm MSP nanodiscs with eight copies of v-SNAREs (vMSP8) were used (Wu et al., 2016), but not affected when ~23 nm NLPs bearing 30 v-SNAREs were employed (vNLP30). This suggests the increase in mean pore conductance that occurs as SNARE copy numbers are increased (Figure 5b) is due to pores becoming larger, and not to the appearance of multiple small pores. *** indicates p<0.001 (two-sample Kolmogorov-Smirnov test).
Figure 6 with 1 supplement
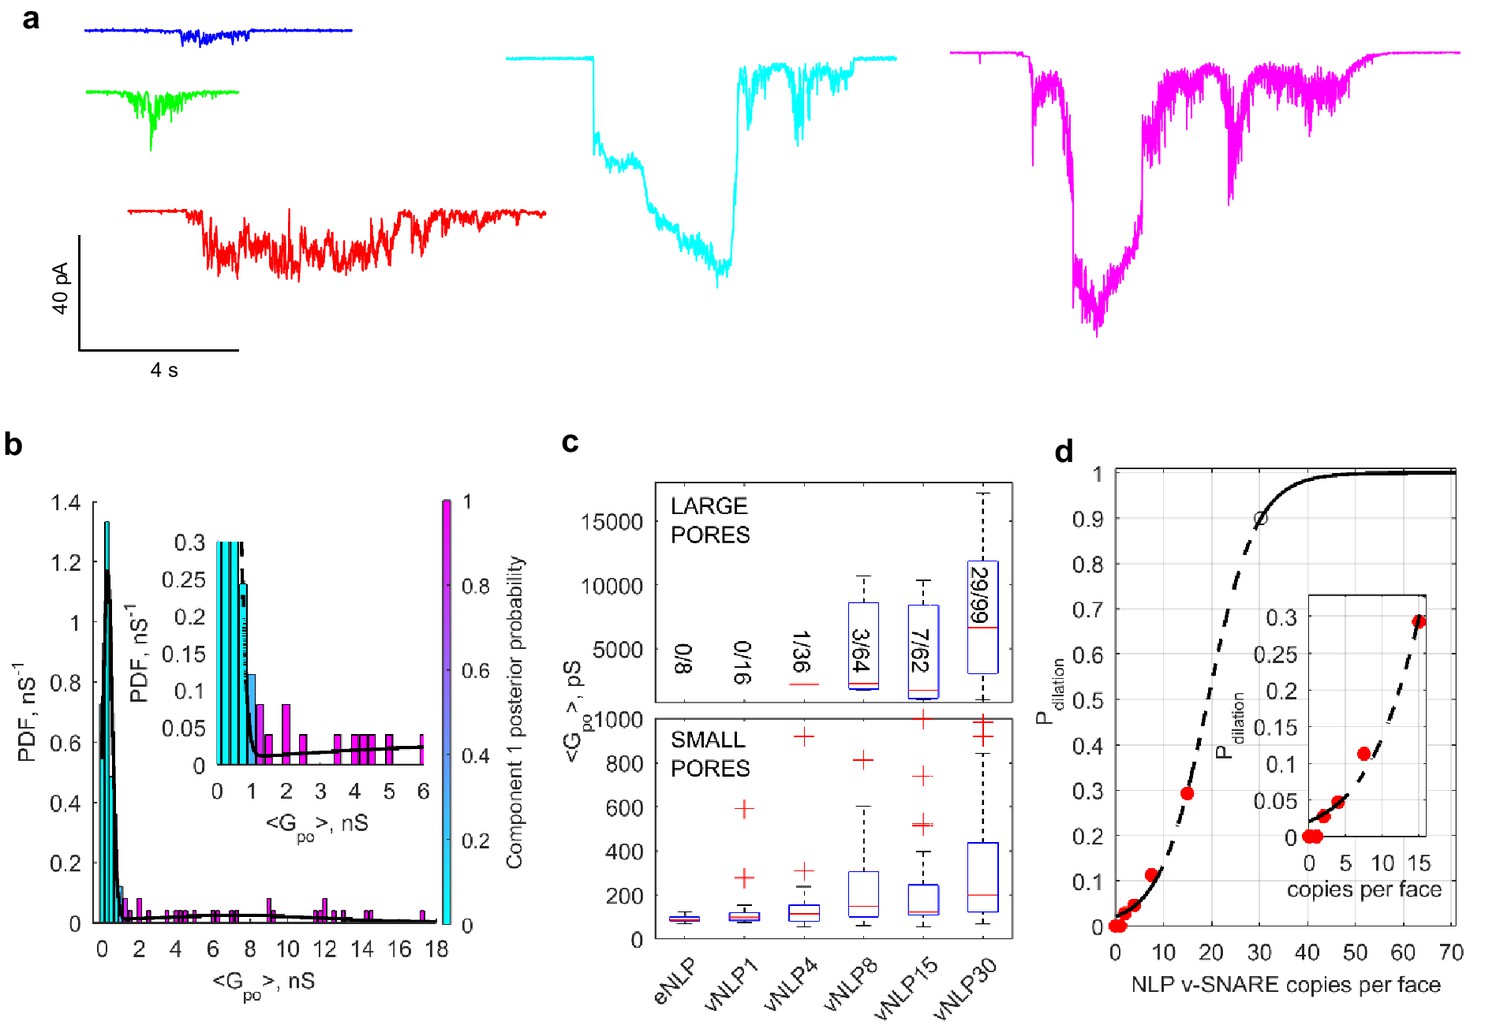
Increasing v-SNARE copy numbers increases the occurrence of large pores.
(a) At low copy numbers, all pores produced small amplitude currents (leftmost traces). As copy numbers increased, most pores still produced small-amplitude currents, but an increasing fraction had much larger currents, such as those shown in the two traces on the right. (b) The probability density function of mean open-pore conductance values from 99 vNLP30-tCell fusion pores was fitted with a Gaussian mixture model with two components. The data clustered into two Gaussian distributions centered around 300 pS and 7.21 nS, separated at ~1 nS. For every bin, the probability of belonging to component one is color-coded with the color map indicated to the right of the plot. The inset shows a zoom to the transition region between the two components. (c) Individual pores were classified as low ( nS) or high ( nS) conductance. The distribution of mean conductances is shown as a series of box plots for the v-SNARE copy numbers tested. The number of large pores/total number of pores is indicated for each group. (d) Probability of pore dilation, , defined as the fraction of pores in the high-conductance category in (c) as a function of SNARE copy number per NLP face (red dots). The dashed line is a fit , where is the copy number at which , and measures the width of the transition. Best fit parameters were (with 95% confidence intervals) , and (). The black open circle indicates that requires 30 SNAREs. See Figure 6—figure supplement 1 for a plot of open-pore conductance fluctuations relative to mean as a function of mean open-pore conductance.
Figure 6—figure supplement 1
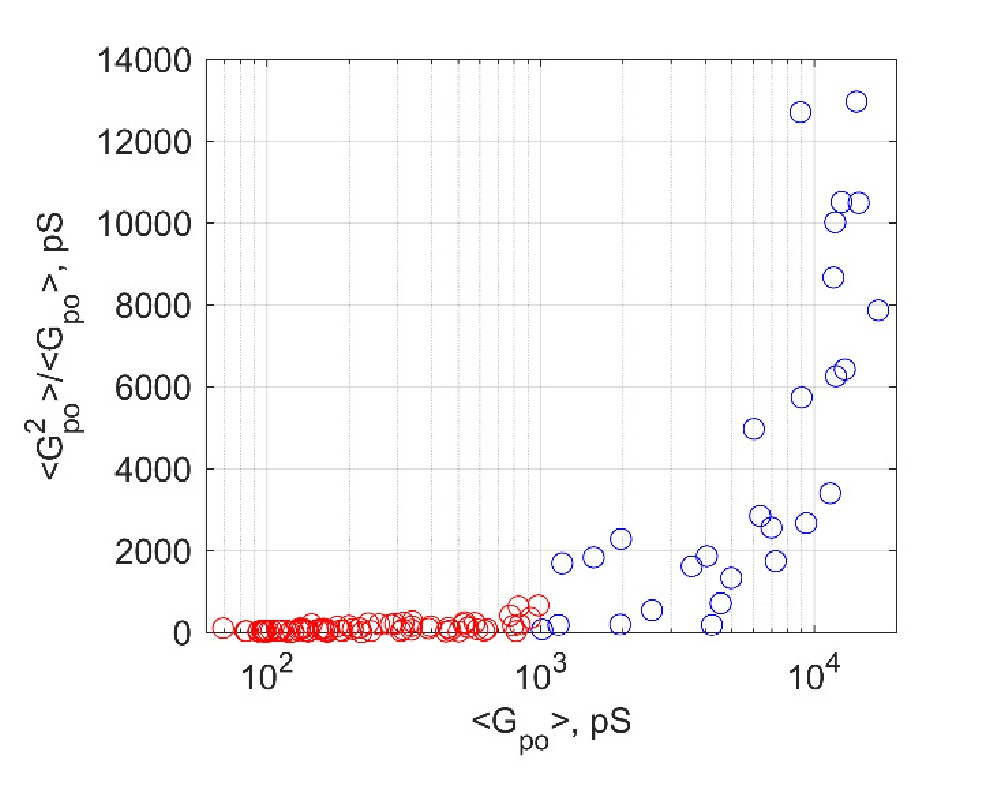
Open-pore conductance fluctuations relative to mean,, as a function of mean open-pore conductance,..
Fluctuations rise sharply for nS (blue circles).
Figure 7 with 1 supplement
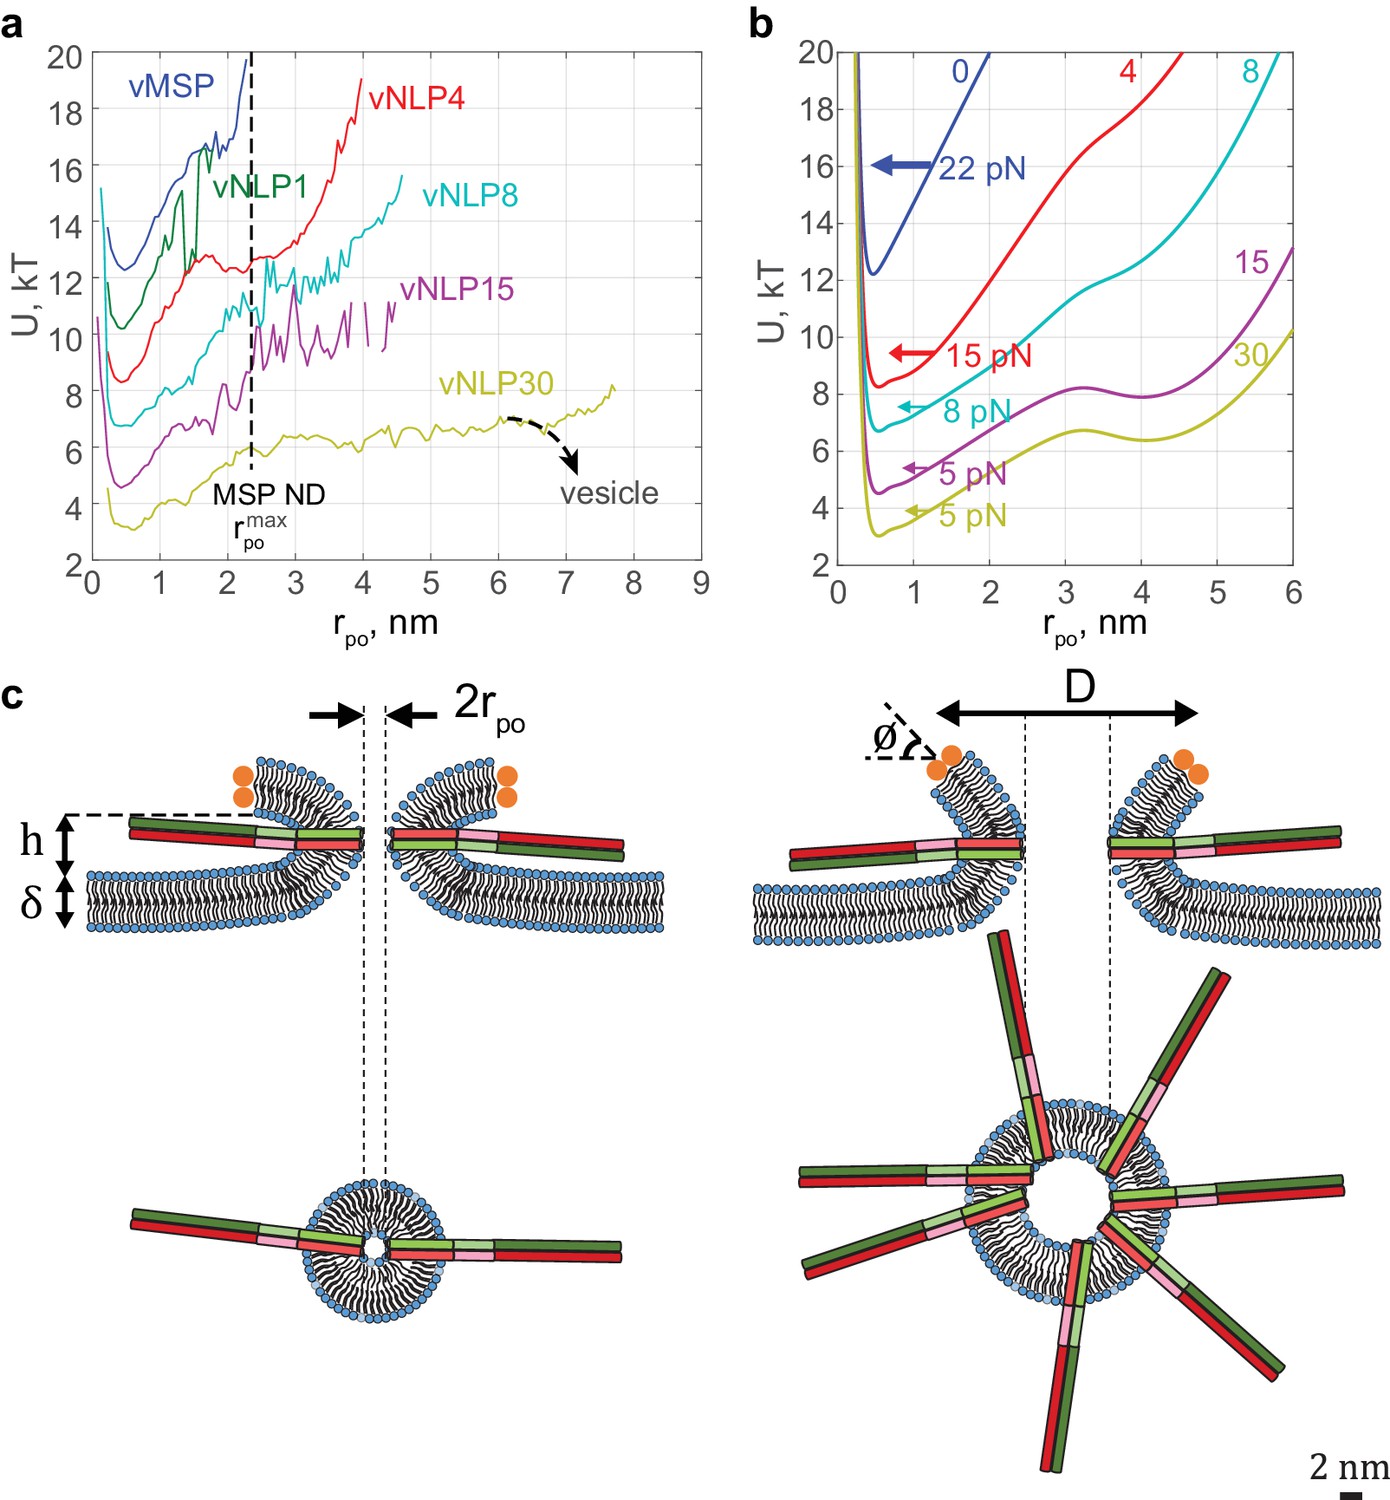
Free energy profiles for pore dilation, experimental results and model predictions.
The mathematical model describes a mechanism of pore expansion in which SNARE-crowding generates entropic expansion forces. (a) Open-pore free-energy landscape for different SNARE copy numbers. Increasing SNARE copy numbers in NLP discs softens the energy barrier against pore expansion. For vNLP30 discs, the profile starts rising above nm (expected maximum size nm). If a vesicle were fusing instead of a NLP, dilation would presumably relax pore curvature and lower the energy (dashed curve marked ‘vesicle’). vMSP data were obtained in earlier work (Wu et al., 2016) using smaller, ~16 nm diameter nanodiscs stabilized by the membrane scaffold protein (MSP), with 7–9 v-SNARE copies. The maximum allowable pore size is limited to slightly above the 2 nm radius of MSP discs. The same energy minimum around nm is found regardless of copy numbers or the size of disc used, suggesting that this minimum represents an inherent property of fusing bilayers. (b) Corresponding free-energy profiles predicted by a mathematical model of the fusion pore with SNAREs (Materials and methods, Figure 7—figure supplement 1, and Table 1). Each curve shows the copy number and the net inward force (averaged over all pore sizes ) tending to close down the pore to the minimum energy value. Membrane bending and tension resist pore expansion with a total force ~22 pN (SNARE-free pore, blue). In the presence of SNAREs, crowding effects produce an expansive entropic force that reduces the net inward force. The net force is progressively lowered with increasing numbers of SNAREs, reaching ~5 pN with 15 SNAREs. (c) Schematic illustrating a proposed SNARE-mediated pore expansion mechanism. Left: a few SNAREs can nucleate a pore, but dilation beyond a few nm is unlikely. Right: with many SNAREs, crowding generates expansion forces that are sufficient to offset the intrinsic bilayer resistance and to expand the pore. and are the height of the pore, the thickness of the membrane, the mean diameter of the vNLP discs, and the angle of twisting of the ApoE proteins, respectively. For definitions of other model parameters, see Materials and methods.
Figure 7—figure supplement 1
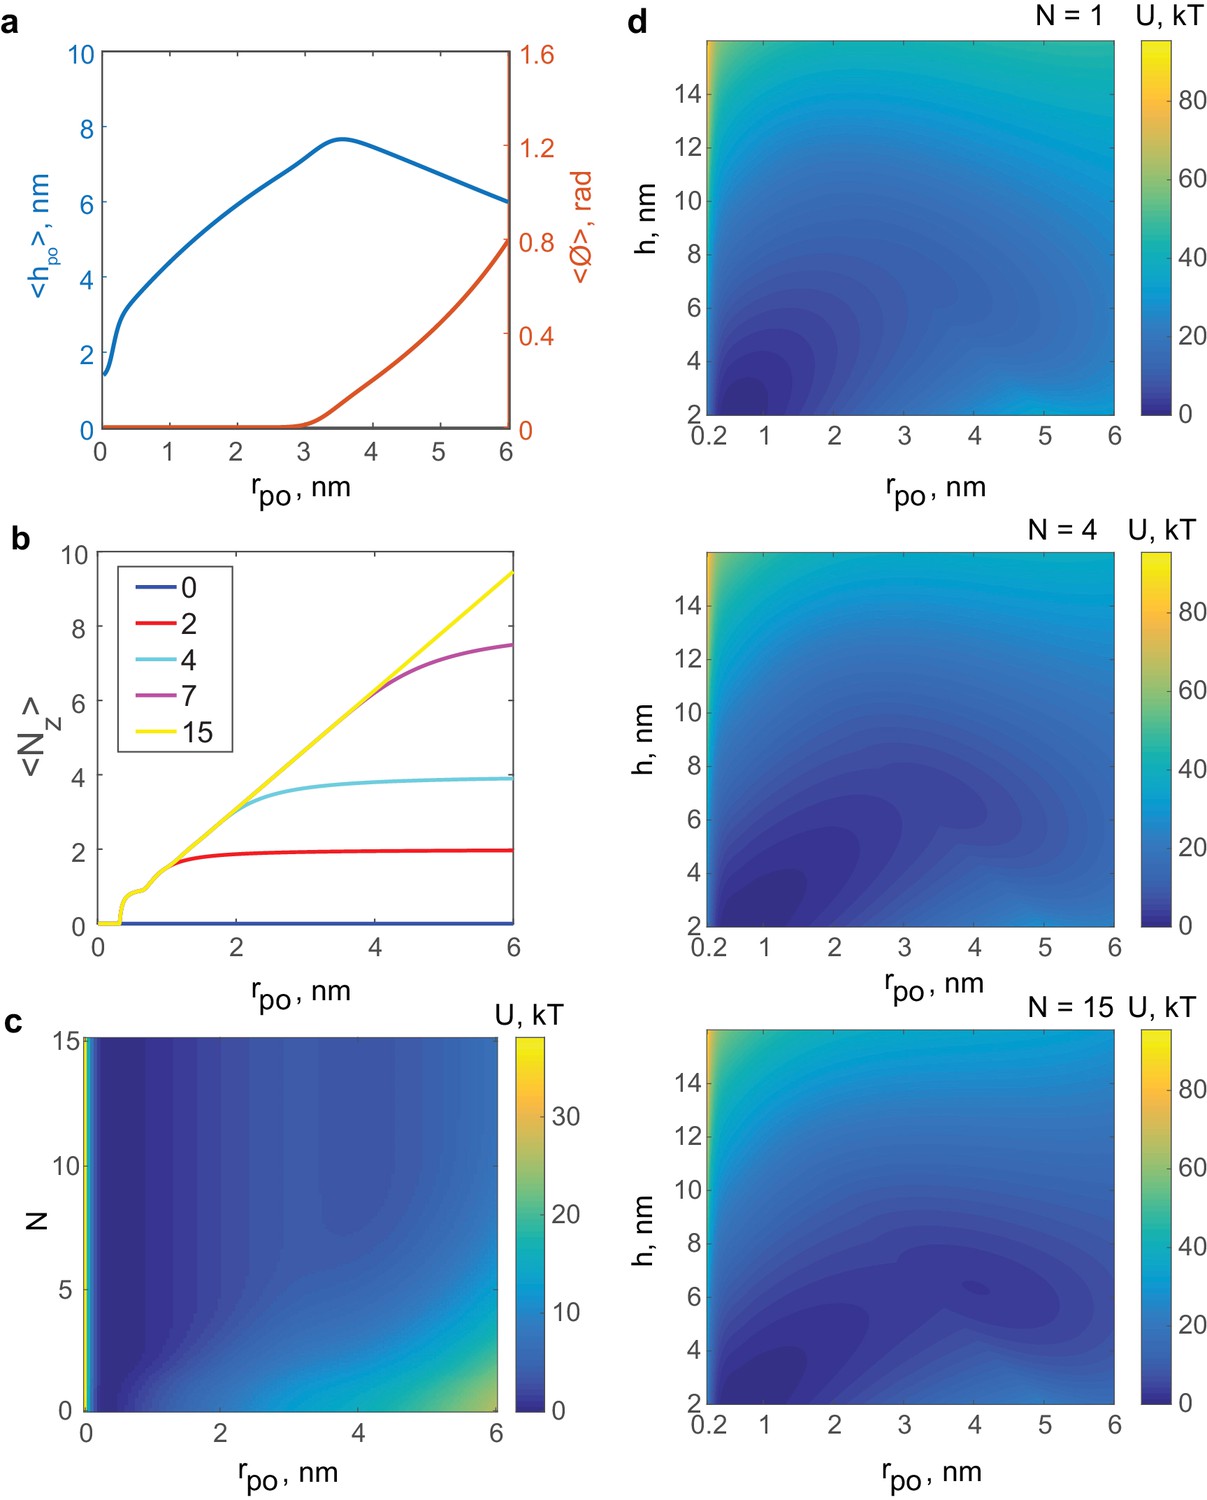
Results of the mathematical model of the fusion pore in the presence of SNAREpins.
(a) Membrane separation and angle of twist of the ApoE proteins versus pore size for a fusion pore without SNAREs. (b) Mean number of zippered SNAREs versus pore size for a fusion pore with total numbers of v-SNAREs per NLP face. (c) Free energy as a function of pore size and number of SNAREs (treated as a continuous variable).(d) Free energy as a function of pore size and membrane separation for fusion pores with total available v-SNAREs.
Tables
Table 1
Parameters used in the analytical model of fusion pores. (A) Measured by fitting a cylinder to the part of the fully zippered SNARE protein structure without the TMDs, produced using PyMOL software with PDB code 3HD7 (http://www.pymol.org). (B) Estimated in this study as a fitting parameter. (C) Measured by Mitra et al. (2004). (D) Measured in this study (Figure 1). (E) Calculated using a weighed average of the of palmitoyl-2-oleoyl phosphatidylcholine (POPC) and 1,2-dioleoyl phosphatidylserine (DOPS) from Rand and Parsegian (1989). The weighed average of the two pressure parameters, according to the 85:15 molar ratio of POPC:DOPS present in the NLPs in this study, is used to obtain . We assumed that the hydration properties of POPC are the same as those of 1,2-dioleoyl phosphatidylcholine (DOPC). (F) Values of in previous studies range from 10–50 (Cohen and Melikyan, 2004; Brochard and Lennon, 1975; Khelashvili et al., 2013; Marsh, 2006). A commonly used value in studies is (Jackson, 2009), which we used here. (G) Calculated on the basis of an atomistic molecular dynamics study of the t-SNARE TMD, which shows that these domains explore angles of ~ around their equilibrium position in a bilayer (Knecht and Grubmüller, 2003).
| Symbol | Meaning | Value | Legend |
|---|---|---|---|
| Thickness of SNARE bundle | 2 nm | (A) | |
| Energy of zippering of v- and t-SNAREs | 9.6 kT | (B) | |
| Thickness of the plasma membrane | 5 nm | (C) | |
| NLP diameter | 24 nm | (D) | |
| Decay length for inter-membrane steric-hydration force | 0.10 nm | (B) | |
| Pressure prefactor for inter-membrane steric-hydration force | 5.0 × 10¹¹ dyn/cm2 | (E) | |
| Torque per unit length to twist the ApoE proteins at the NLP boundary | pN | (B) | |
| Bending modulus of the lipid bilayer | 20 kT | (F) | |
| Membrane tension | 0.66 pN nm−1 | (B) | |
| Solid angle explored by bending of zippered SNAREs | 0.05 sr | (G) |
Download links
A two-part list of links to download the article, or parts of the article, in various formats.
Downloads (link to download the article as PDF)
Open citations (links to open the citations from this article in various online reference manager services)
Cite this article (links to download the citations from this article in formats compatible with various reference manager tools)
Dilation of fusion pores by crowding of SNARE proteins
eLife 6:e22964.
https://doi.org/10.7554/eLife.22964


