Memory CD4 T cell subsets are kinetically heterogeneous and replenished from naive T cells at high levels
- College of Medical, Veterinary & Life Sciences University of Glasgow, United Kingdom
- Icahn School of Medicine at Mount Sinai, United States
- University College London, United Kingdom
Figures
Figure 1

New donor T cells differentiate into memory compartments in the absence of deliberate infection.
(A) Outline of experimental protocol. Host CD45.1 mice aged 8 weeks were treated with two doses of 10 mg/kg busulfan, followed by injection of 107 T cell-depleted bone marrow cells from CD45.2 donors. The numbers of donor and host cells in the thymus and peripheral lymphocyte compartments were evaluated by flow cytometry at various time points up to one year post bone marrow transplantation (BMT). (B) Numbers of naive and memory CD4 T cells (host + donor) recovered from spleen and lymph nodes of busulfan chimeras made at age 8 weeks, compared to numbers in WT CD45.1 controls. (C) Ki67 expression in naive and memory CD4 cells in chimeras (14 weeks post-BMT) compared to age-matched WT controls; 11 mice per group. (D) Identification of host and donor-derived cells in a representative mouse 8 weeks post-BMT. (E) Timecourses of normalised peripheral chimerism (defined as the proportion of the population that is donor-derived, divided by the proportion of the DP1 population that is donor-derived) in naive and memory CD4 T cell populations, showing steady but incomplete replacement of host cells in both. Fitted curves are empirically determined to show trends only.
-
Figure 1—source data 1
Comparing naive and memory cell numbers and Ki67 expression in busulfan chimeras and wild-type controls (panels B and C) .
- https://doi.org/10.7554/eLife.23013.004
-
Figure 1—source data 2
Timecourses of infiltration of donor-derived T cells into the naive and memory compartments in busulfan chimeras (panel E).
- https://doi.org/10.7554/eLife.23013.005
Figure 2 with 2 supplements

Estimating constitutive rates of generation of CD4 T cell memory.
(A) Gating strategy for CD4 central and effector memory subsets. (B) Describing the kinetics of the source. Fits of empirical descriptor functions to the timecourses of naive CD4 counts and chimerism, with 95% uncertainty envelopes (see Materials and methods). Similar curves (not shown) were used to describe CD4 TCM numbers and chimerism when modelled as the source for CD4 TEM. Estimates of the parameters defining the source functions are in Appendix 1—table 1. (C) Timecourses of total (host+donor) numbers of CD4 TCM and TEM and of chimerism, modelled from 6 weeks post-BMT (age 14 weeks/98 days). The resistant memory models with naive source described both the CD4 TCM and TEM data well (left-hand and central panels). Also shown are the statistically poorer fits to CD4 TEM kinetics using a model in which they are fed exclusively by CD4 TCM (AIC = 11). Both models contained five free parameters; estimates are in Appendix 1—table 2. (D) Projections of how the rates of memory replacement change with age, assuming a naive source. Replacement is shown both as a fraction of the total pool, and as a fraction of the displaceable subset only.
-
Figure 2—source data 1
Timecourses of numbers and chimerism within the naive, effector memory and central memory CD4 T cell compartments in busulfan chimeras (Figure 2 panels B and C, and Figure 2—figure supplement 1).
- https://doi.org/10.7554/eLife.23013.007
-
Figure 2—source data 2
Source code used to analyse flows between naive, CD4 TEM and CD4 TCM populations.
- https://doi.org/10.7554/eLife.23013.008
Figure 2—figure supplement 1
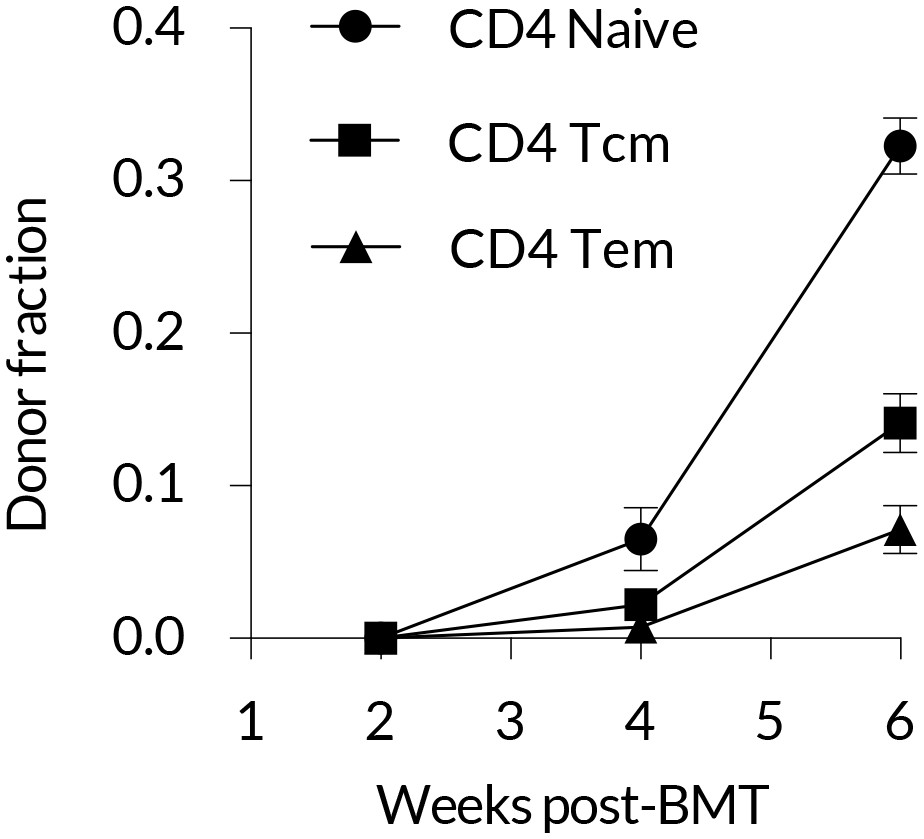
Early kinetics of peripheral replacement in busulfan chimeras made at age 8 weeks, showing that the generation of CD4 TEM cells lags that of CD4 TCM (three mice per timepoint; mean and s.e.m.).
https://doi.org/10.7554/eLife.23013.009
Figure 2—figure supplement 2
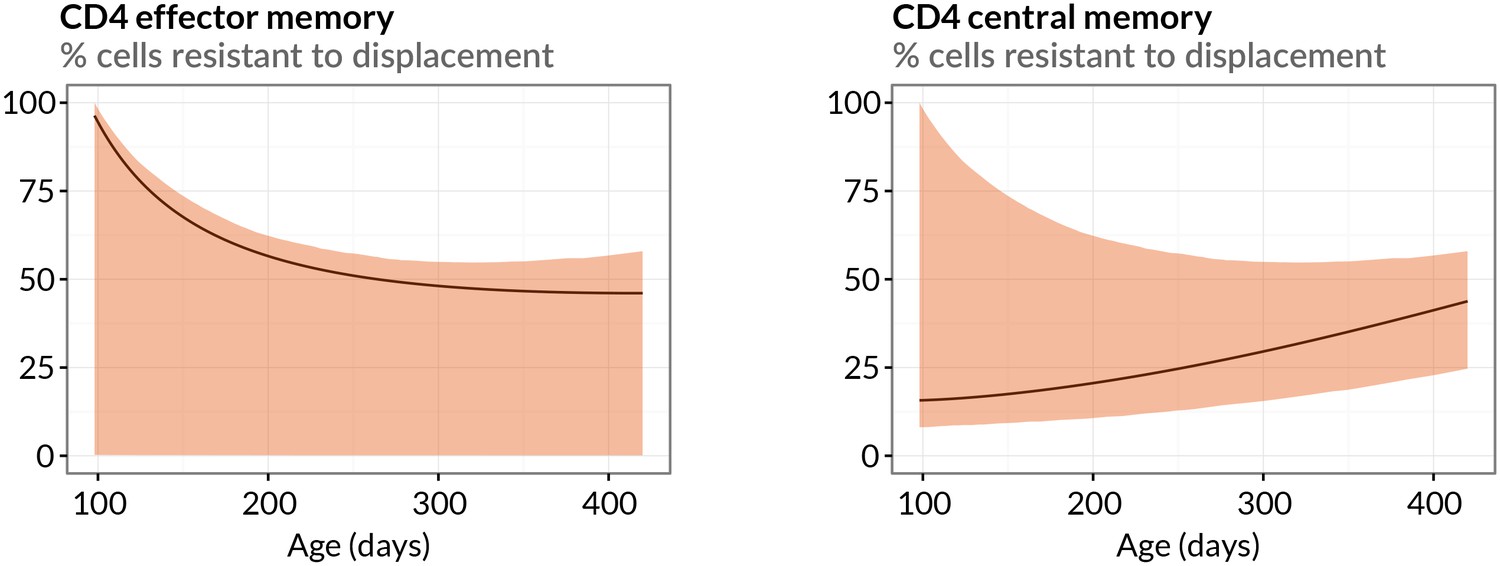
Estimated sizes of memory populations resistant to displacement.
Proportions of CD4 TEM and TCM predicted to be numerically stable, self-renewing cells resistant to displacement, with age. Shaded regions indicate 95% confidence intervals.
Figure 3
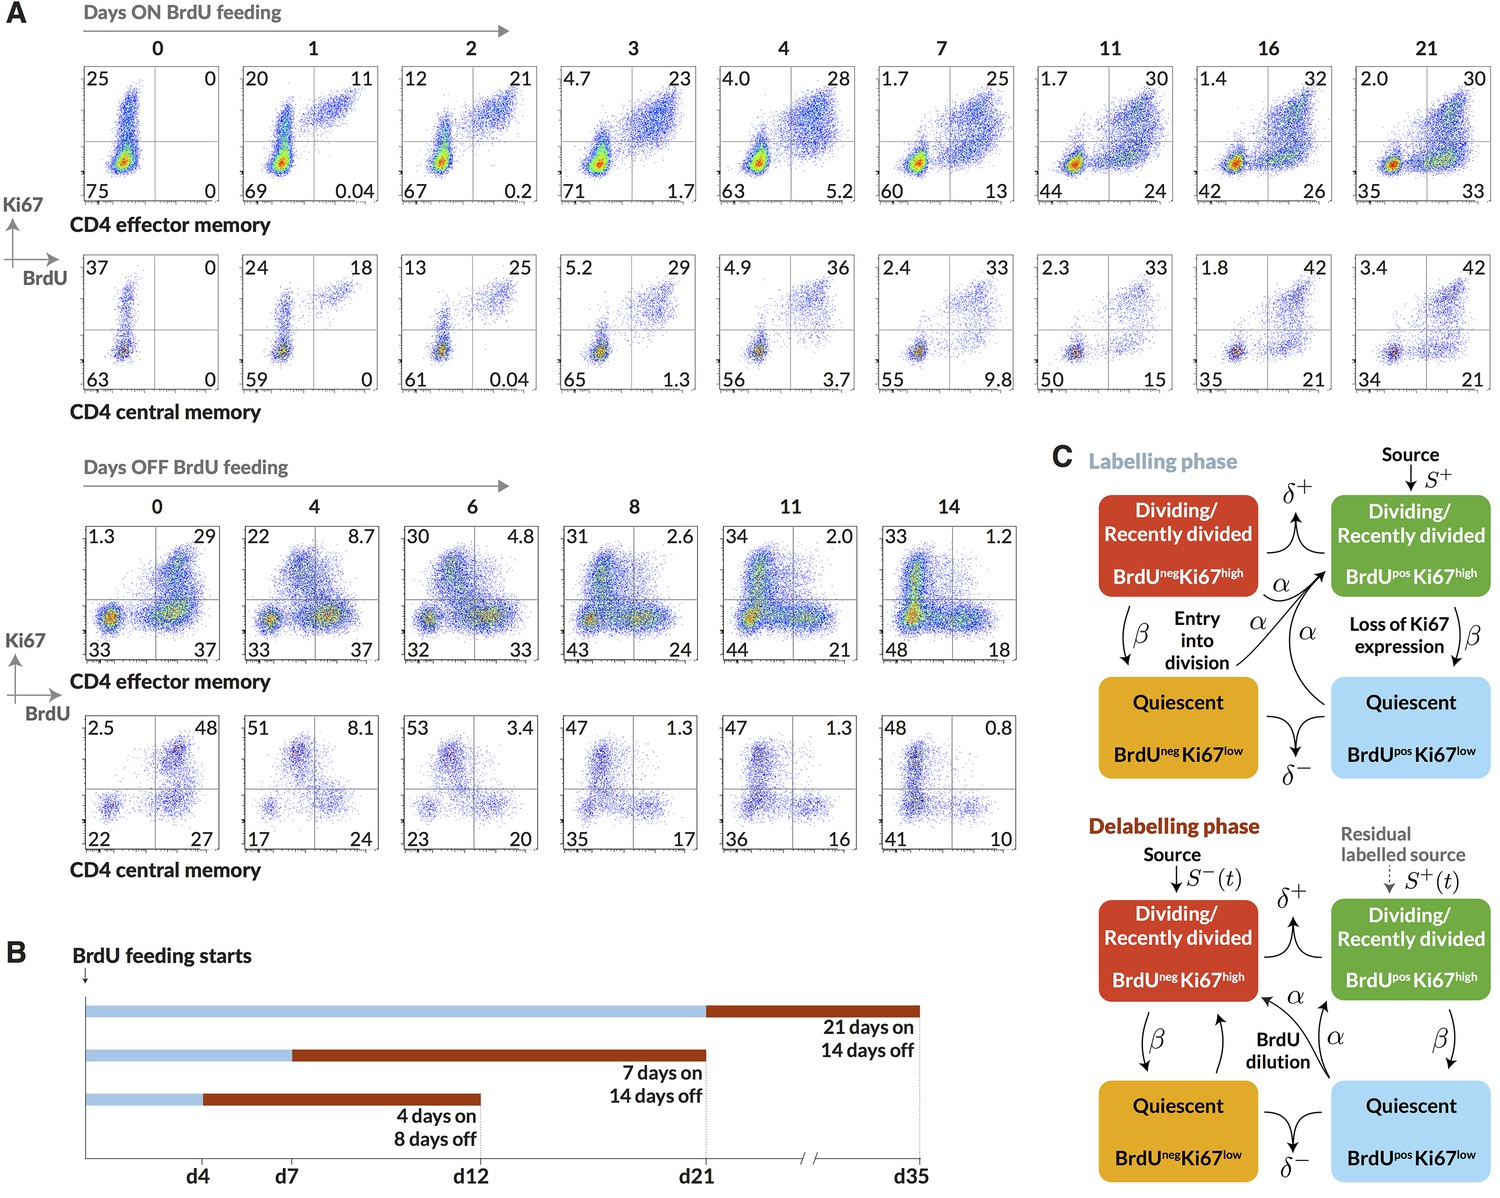
Quantifying the homeostatic dynamics of effector and memory CD4 T cells by combining BrdU labelling with measurements of Ki67 expression.
(A) Representative data from flow cytometric analyses of BrdU uptake and Ki67 expression in a pulse-chase experiment. Cells were recovered from lymph nodes. (B) Outline of experimental design. (C) A schematic of the core multi-compartment model used to describe the flows between the BrdU Ki67low/high populations during and after labelling. Shown here is a model of temporal heterogeneity, in which either effector or central memory CD4 T cells are modelled as a single population entering division stochastically at per capita rate ; with quiescent (Ki67low) and recently divided (Ki67high) cells dying at rates and respectively; an external source of cells feeding the BrdU Ki67high populations at rates and , where is a constant, ; and cells transitioning from Ki67high to Ki67low at rate . This basic model was refined to account for multiple subpopulations (kinetic heterogeneity), different distributions of Ki67 expression times, inefficient BrdU uptake, and post-labelling dilution of BrdU within both labelled cells and within the source (). See Materials and methods and Appendix 1 for details of the model formulation.
Figure 4
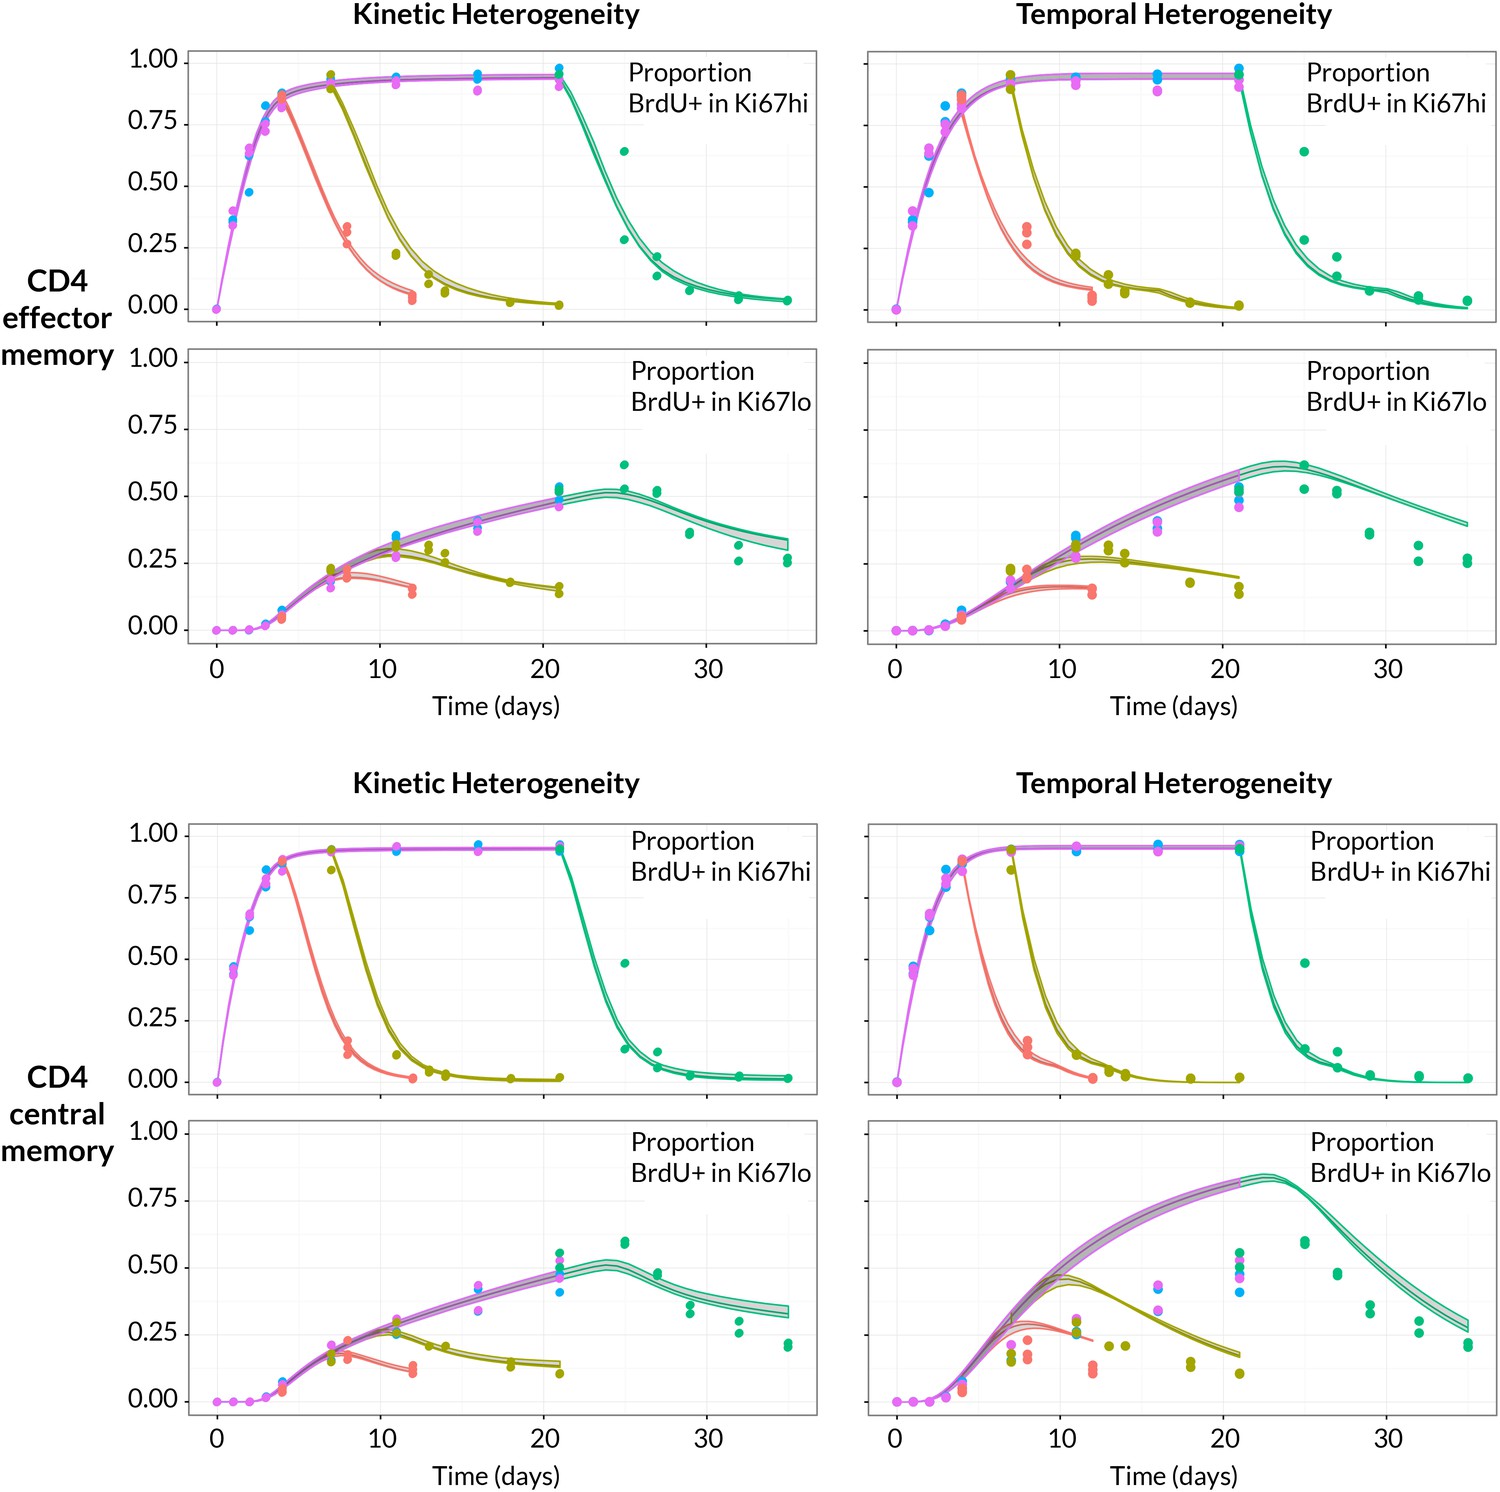
BrdU/Ki67 dynamics in memory CD4 T cell subsets are best described by a model of kinetically distinct subpopulations.
Data and best fit predictions for two classes of model describing BrdU uptake and loss – kinetic heterogeneity (left panels) and temporal heterogeneity (right panels) – for CD4 TEM (upper panels) and CD4 TCM (lower panels). Fits were generated using the best-fit estimates of the influx into each population (for CD4 TEM, 7.0% of the pool size per week at 14 weeks of age; for CD4 TCM, 10.6% per week; these figures are 7 the daily influx quoted in Table 1). Colours denote different BrdU feeding timecourses and shaded regions represent 95% confidence envelopes on the fits, calculated by resampling the parameters from their bootstrap distributions. The inability of the TH model to describe both the timecourses well stems from the tight coupling between the BrdUKi67low cells and their BrdUKi67high precursors, with little freedom to fit the timecourses of both simultaneously; whereas in the KH model, those two populations are enriched for the slow and fast subpopulations respectively, which are parameterised independently.
-
Figure 4—source data 1
Timecourses of the BrdU fractions within the Ki67high and Ki67low populations during the BrdU labelling/delabelling experiments.
- https://doi.org/10.7554/eLife.23013.014
-
Figure 4—source data 2
Source code used to generate and fit models to BrdU/Ki67 timecourses.
- https://doi.org/10.7554/eLife.23013.015
Figure 5 with 1 supplement
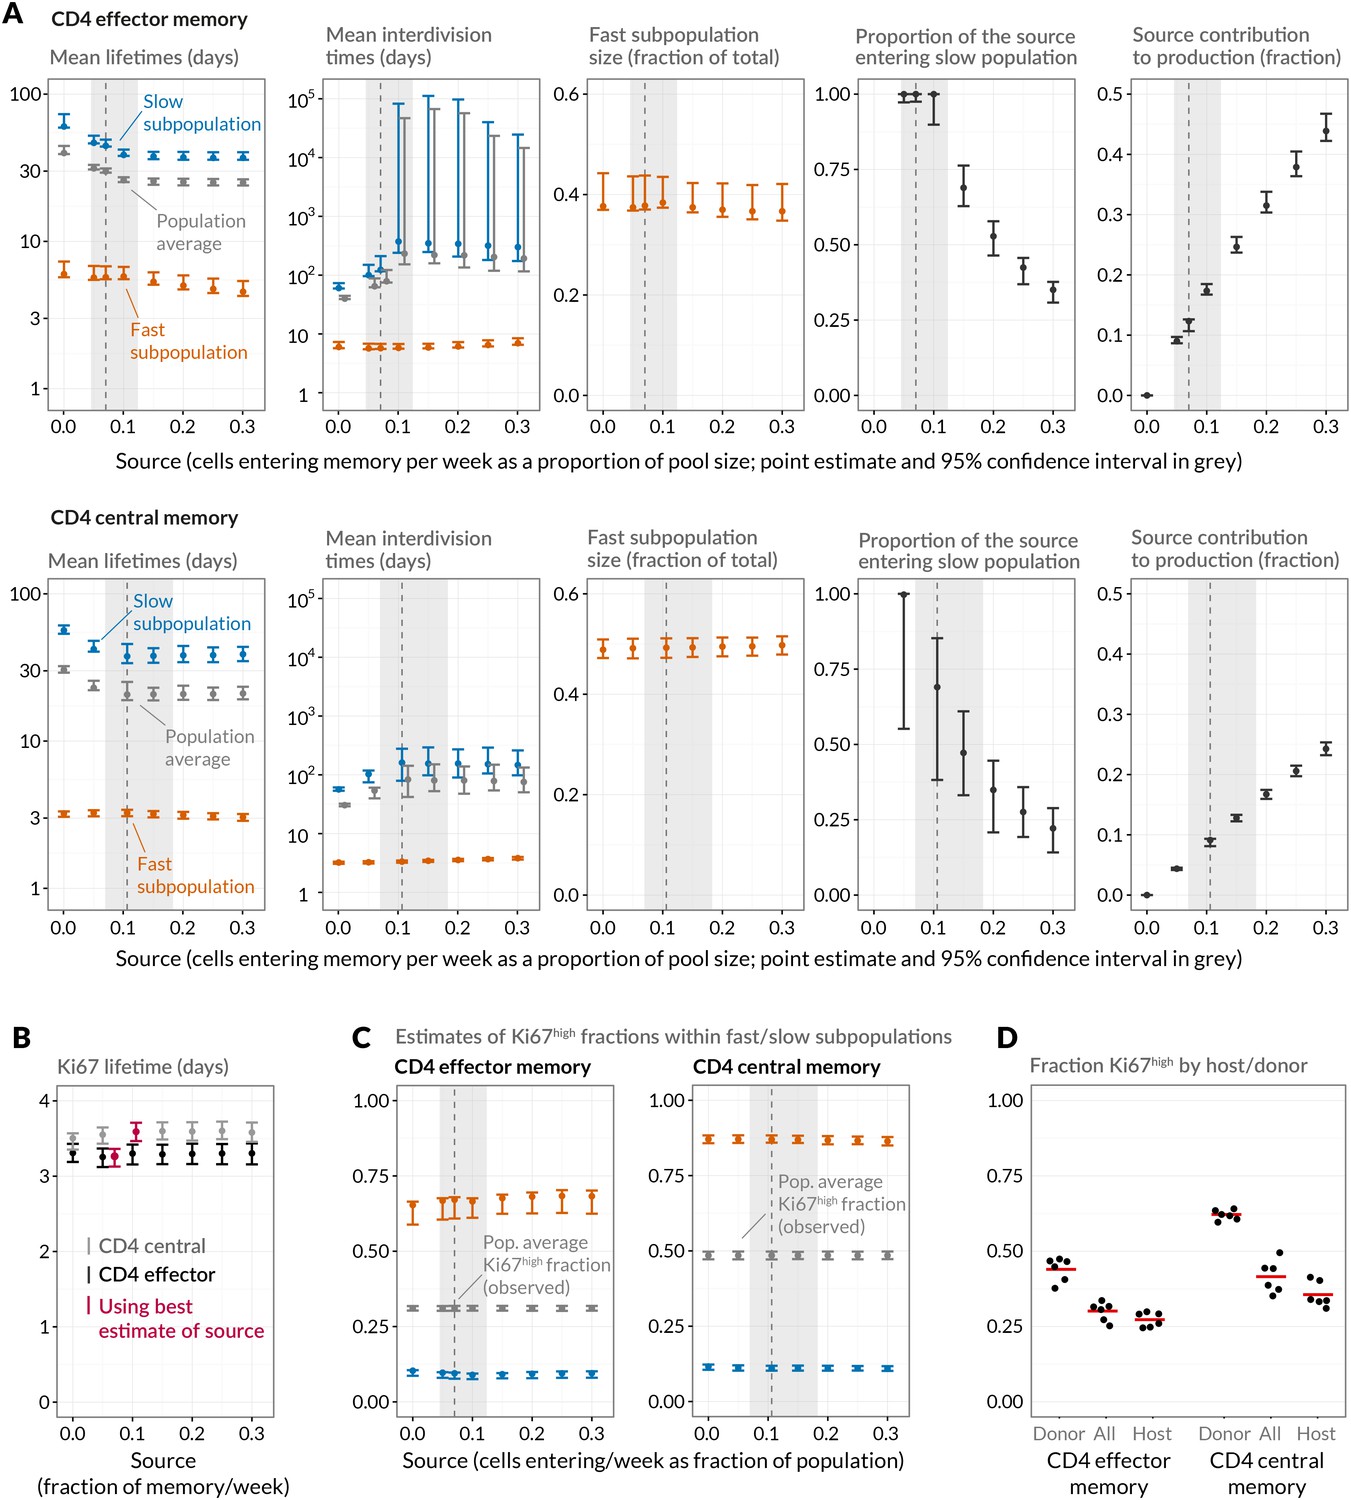
Quantifying CD4 TEM and CD4 TCM homeostasis assuming kinetic heterogeneity.
(A) Key kinetic parameters for CD4 TEM and TCM estimated for different levels of memory influx. Grey points represent population average parameters; for interdivision times these are offset for clarity. Vertical dashed lines and shaded areas represent the best estimates of influx with 95% confidence intervals. These estimates are the weekly influxes as a fraction of the pool size (i.e., 7 the daily influxes quoted in Table 1; 0.07 of pool/week for CD4 TEM, 0.11 for TCM). (B) Estimated mean duration of Ki67 expression post-mitosis. (C) Estimated proportions of cells that are Ki67high within fast and slow subpopulations. The weighted averages of these proportions for each of CD4 TEM and CD4 TCM were constrained to be the observed level of expression (mean + s.e.m.) averaged over the course of the BrdU labelling experiments (Appendix 1—figure 1). (D) Stratifying Ki67high expression within CD4 TEM and CD4 TCM by host and donor, in six busulfan chimeras that were 8 weeks post-BMT and of comparable ages to the mice used in the BrdU labelling experiments, indicating that fast/slow cells cannot be exclusively identified as donor/host-derived.
-
Figure 5—source data 1
Ki67 expression in host and donor CD4 TEM and TCM cells in busulfan chimeras 8 weeks post-BMT (panel D).
- https://doi.org/10.7554/eLife.23013.017
Figure 5—figure supplement 1
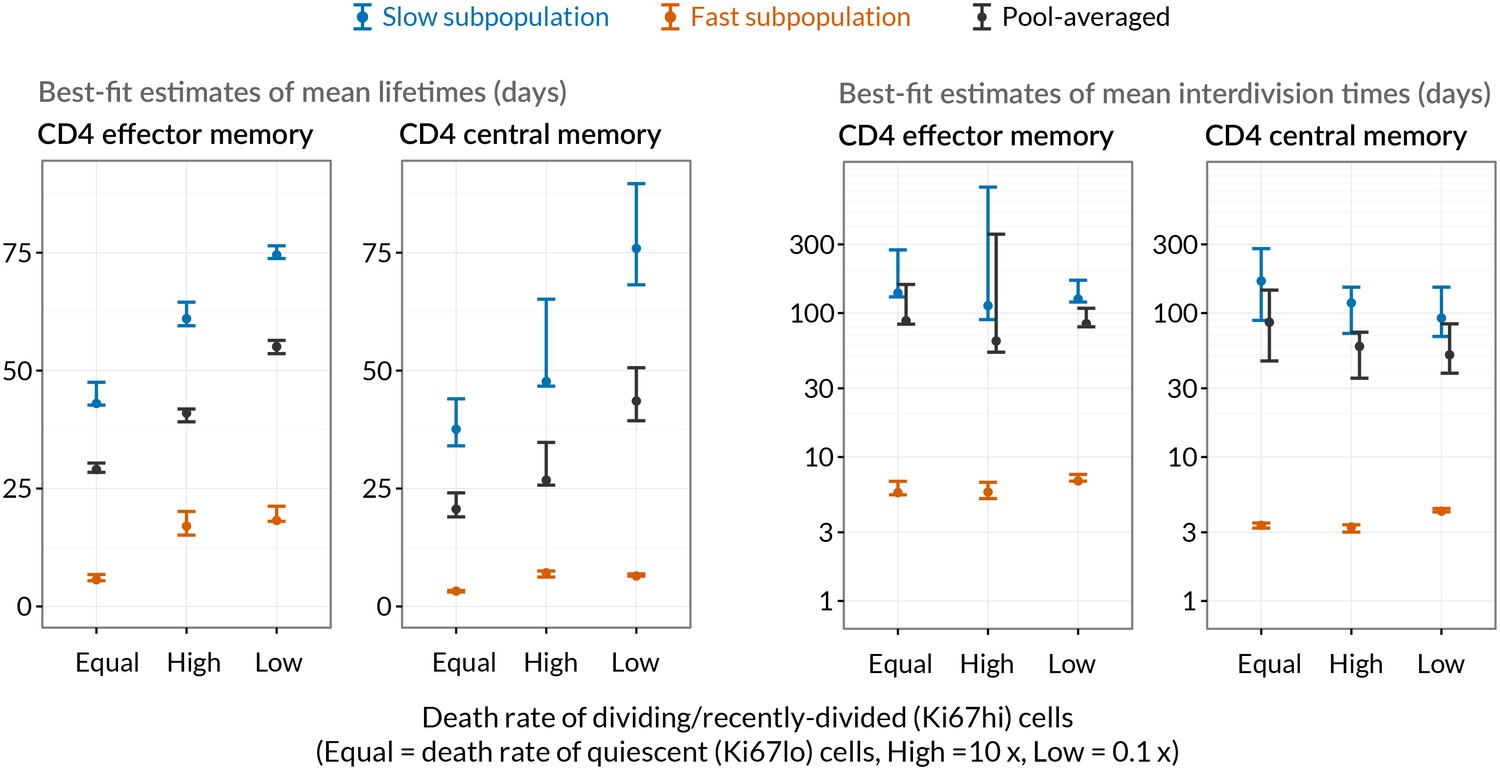
Comparing mean lifetimes and interdivision times obtained with the KH model when adding temporal heterogeneity.
We fitted extensions of the basic KH model in which death rates of Ki67high cells were set to be 1/10 or 10 times that of Ki67low cells. Orange/blue denote the fast/slow subpopulations respectively. Mean lifetimes for each population (EM/CM, fast/slow) are weighted averages of the lifetimes of the Ki67high and Ki67low subsets. Vertical bars indicate 95% confidence intervals calculated by bootstrapping residuals and resampling from the bootstrap estimates of the magnitude of the source.
Appendix 1—figure 1
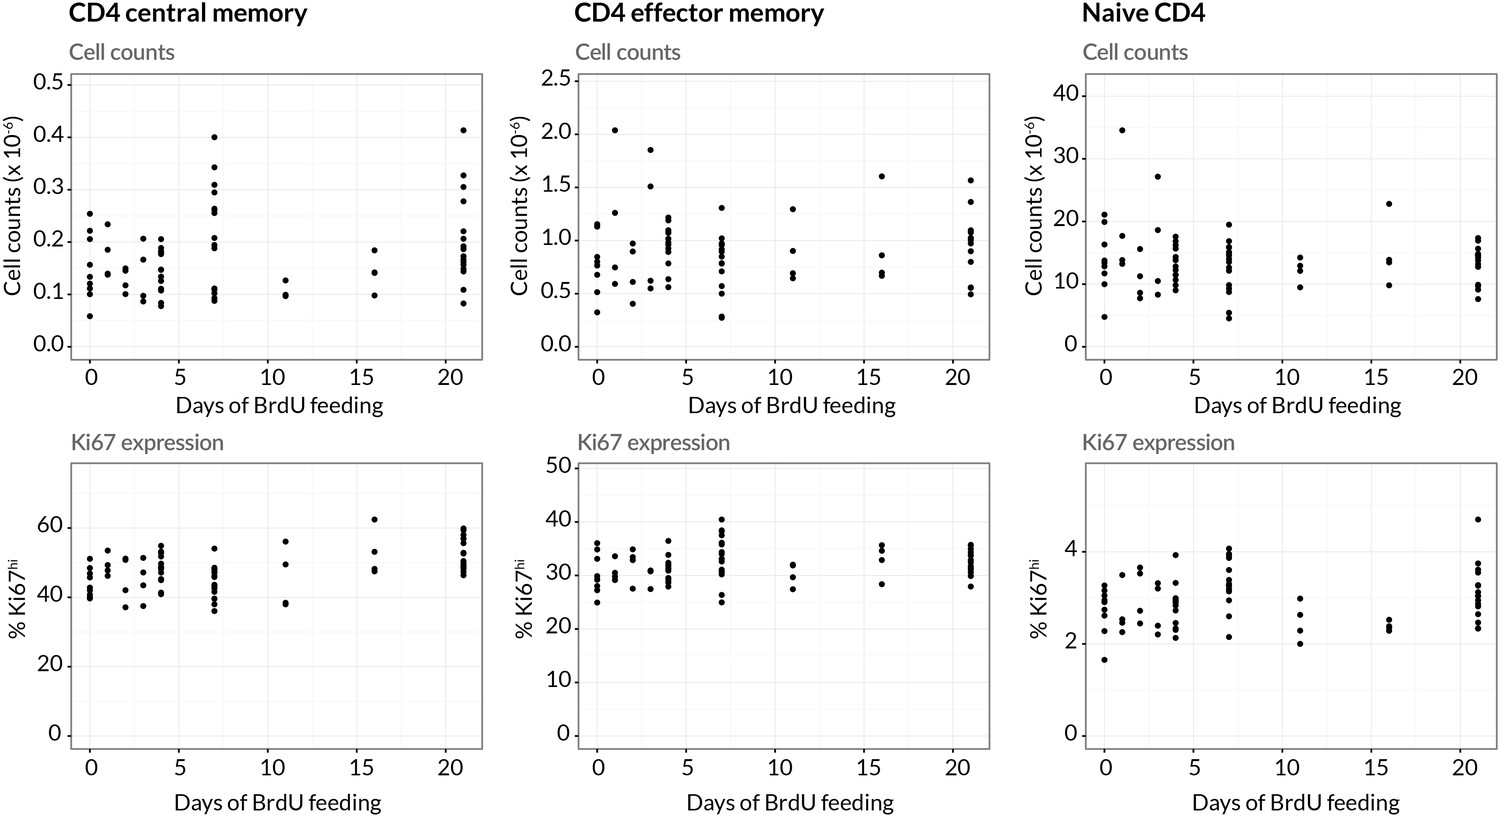
Stability of cell numbers and Ki67 expression during BrdU labelling.
Cells for BrdU/Ki67 analysis were recovered from lymph nodes. We show the corresponding data for naive CD4 T cells to confirm that BrdU feeding has no significant impact on the (putative) source population.
-
Appendix 1—figure 1—source data 1
Data showing stability of both numbers and Ki67 expression of effector memory, central memory and naive CD4 T cells recovered from lymph nodes during BrdU labelling.
- https://doi.org/10.7554/eLife.23013.023
Appendix 1—figure 2
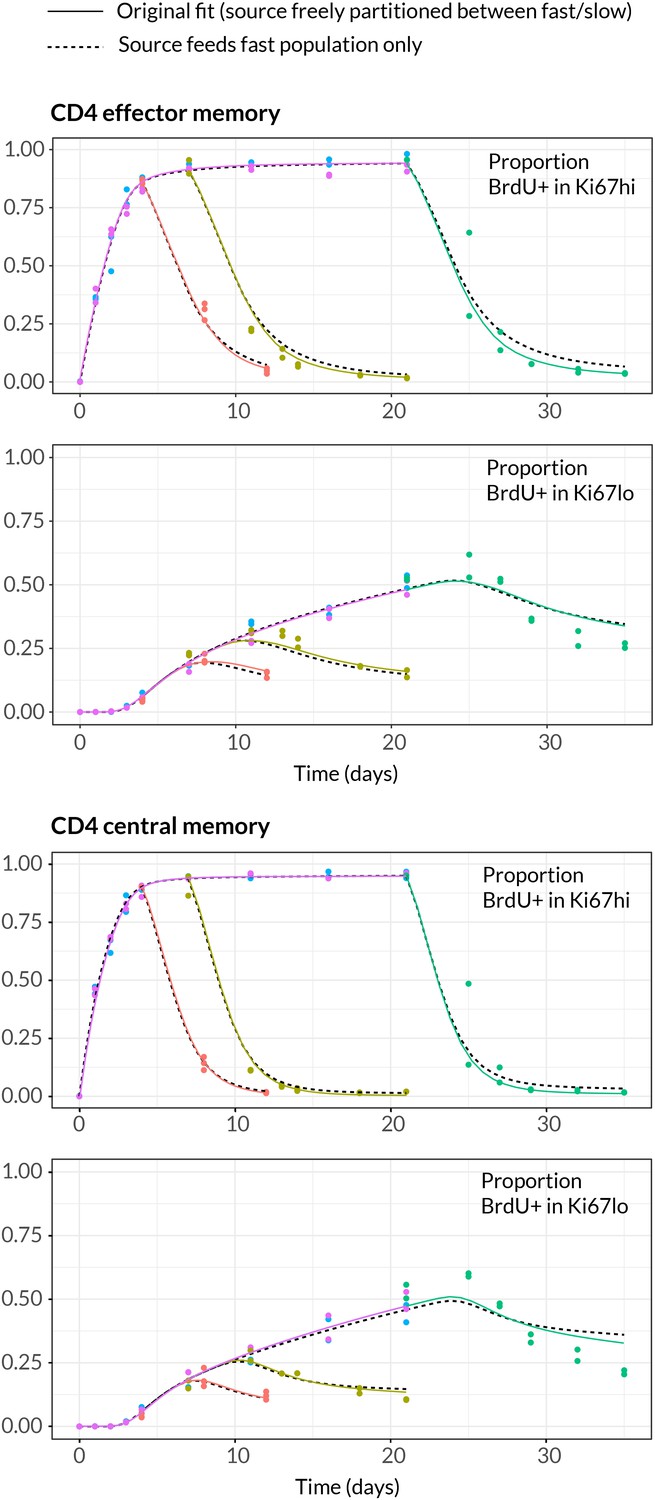
Comparing models of BrdU labelling with different partitionings of the influx into memory.
We compare the fits using the model presented in the text, in which the allocation of the source into fast/slow populations is a free parameter (solid lines) with a reduced model in which the source is forced to feed the fast subpopulations only (dashed lines).
Author response image 1

Tables
Table 1
Estimated rates of replacement of CD4 effector and central memory through influx of new cells in 14 week-old mice. We quote both absolute influx (cells per day as a percentage of the pool size) and percent replaced per week. The latter is slightly less than 7 the daily rate of influx because immigrant cells are assumed to be lost at the same rate as existing displaceable cells (see Methods). AIC differences (AIC) are quoted relative to the best-fitting model for each cell type. These differences reflect the relative support for two models, with exp(AIC/2) being the relative probability that it is the model with the lower penalised likelihood (larger AIC value) that minimises the information lost in describing the data. For CD4 TEM the two models have equal support, but for CD4 TCM the resistant memory model is favoured (AIC = 8.3, exp(AIC/2)=0.02). Models considered most plausible are highlighted.
| Resistant memory model | Declining recruitment model | ||||||||||
|---|---|---|---|---|---|---|---|---|---|---|---|
| Source | % Input/day | % Replaced/wk | AIC | % Input/day | % Replaced/wk | AIC | |||||
| CD4 TEM | Naive | 1.0 | (0.7, 1.4) | 6.3 | (4.4, 8.6) | 0.16 | 1.0 | (0.7, 1.6) | 6.4 | (4.3, 9.7) | 0 |
| CM | 4.1 | (2.6, 7.5) | 23.0 | (16, 35) | 11 | 3.6 | (2.1, 6.2) | 21 | (13, 30) | 11 | |
| CD4 TCM | Naive | 1.5 | (1.0, 2.8) | 9.8 | (6.5, 17) | 0 | 2.3 | (1.3, 4.1) | 13.5 | (8.4, 22) | 8.3 |
Table 2
Parameters describing homeostasis of murine CD4 memory subsets, using a two-population model of kinetic heterogeneity and the best estimates of the magnitudes of the influx into each subset from the naive pool. Pool-average lifetimes and interdivision times are defined to be the mean of the corresponding quantities for the fast and slow subpopulations weighted by their size estimates. The best-fitting models were those that assumed no difference in death rates of Ki67high and Ki67low cells (indicated by rows in which ratio of loss rates = 1).
| Parameter | Ratio of loss rates | CD4 effector memory | CD4 central memory | ||
|---|---|---|---|---|---|
| Ki67high:Ki67low | Estimate | 95% CI | Estimate | 95% CI | |
| Pool-average lifetime (days) | 1 10 0.1 | 29 41 55 | (28, 30) (39, 42) (54, 56) | 21 27 44 | (19, 24) (26, 35) (39, 51) |
| Pool-average interdivision time (days) | 1 10 0.1 | 88 63 84 | (83, 158) (53, 353) (80, 108) | 86 59 51 | (47, 144) (35, 74) (38, 84) |
| Ki67 lifetime (days) | 1 10 0.1 | 3.28 3.23 3.28 | (3.14, 3.39) (3.03, 3.30) (3.18, 3.41) | 3.59 3.74 3.32 | (3.47, 3.70) (3.57, 3.82) (3.31, 3.52) |
| Efficiency of BrdU uptake (%) | 1 10 0.1 | 76 75 78 | (74, 79) (73, 78) (76, 81) | 77 78 78 | (76, 79) (76, 79) (78, 81) |
| Delay before source switches to BrdU− post-labelling (days) | 1 10 0.1 | 2.5 2.6 2.1 | (1.7, 3.0) (1.9, 3.5) (1.3, 2.3) | 0.085 0.006 0.14 | (0.002, 1.16) (0.003, 1.43) (0.003, 0.66) |
| Source contribution to peripheral production (fraction) | 1 10 0.1 | 0.12 0.11 0.15 | (0.12, 0.13) (0.099, 0.11) (0.15, 0.16) | 0.092 0.085 0.12 | (0.088, 0.096) (0.08, 0.088) (0.11, 0.12) |
| Fraction of source enteringslow subpopulation | 1 10 0.1 | 1 1 1 | (0.98, 1) (0.95, 1) (0.98, 1) | 0.69 1 0.46 | (0.38, 0.85) (0.45, 1) (0.19, 0.62) |
| Mean lifetime offast subpopulation (days) | 1 10 0.1 | 5.7 17 18 | (5.5, 6.8) (15, 20) (18, 21) | 3.3 7.1 6.4 | (3.1, 3.4) (6.2, 7.5) (6.4, 6.9) |
| Mean lifetime ofslow subpopulation (days) | 1 10 0.1 | 43 61 75 | (43, 48) (60, 65) (74, 77) | 38 48 76 | (34, 44) (47, 65) (68, 90) |
| Mean interdivision time offast subpopulation (days) | 1 10 0.1 | 5.7 5.7 6.8 | (5.5, 6.9) (5.1, 6.7) (6.8, 7.6) | 3.4 3.3 4.2 | (3.2, 3.5) (3.0, 3.4) (4.2, 4.4) |
| Mean interdivision time ofslow subpopulation (days) | 1 10 0.1 | 138 113 125 | (130, 275) (90, 750) (119, 169) | 167 118 92 | (89, 280) (72, 151) (69, 151) |
| Size of fast subpopulation(fraction of total) | 1 10 0.1 | 0.38 0.46 0.35 | (0.37, 0.44) (0.43, 0.54) (0.34, 0.38) | 0.49 0.52 0.47 | (0.47, 0.51) (0.49, 0.53) (0.45, 0.48) |
Appendix 1—table 1
Parameter estimates for the functions used to empirically describe the timecourses of the size and chimerism of the putative source populations feeding memory CD4 T cell subsets.
| Exponential model of source numbers | ||
|---|---|---|
| Naive source | TCM source | |
| | 5.2 (4.4, 6.2) 107 5.3 (4.5, 6.0) 10−3 | 1.1 (0.81, 1.4) 106 2.3 (0.80, 3.6) 103 |
| Logistic model of normalised source chimerism | ||
|---|---|---|
| Naive source | TCM source | |
| | 0.85 (0.80, 0.88) 0.09 (0.012, 0.18) 0.038 (0.027, 0.080) | 0.48 (0.41, 0.56) 0.013 (0.0032, 0.034) 0.045 (0.030, 0.073) |
Appendix 1—table 2
Parameter estimates for the models describing the feeding of memory CD4 T cell subsets from a source. Parameters common to both models are defined as follows: , total (host + donor) initial number of memory cells; , the chimerism in the memory compartment at age 14 weeks, normalised to that at the DP1 stage of thymic development; , the per capita conversion rate of source cells into memory cells at age 14 weeks; , the per capita loss rate of displaceable memory cells through death and differentiation. Parameters specific to the resistant memory model: , the number of resistant, host-derived memory cells, assumed to be constant over time. For the declining recruitment model: , the rate of decay of the per capita rate of conversion of source cells into memory, with age (yielding ). AIC differences are quoted relative to the best-fitting model for each population.
| Resistant memory model | |||
|---|---|---|---|
| CD4 TEM | CD4 TCM | ||
| Naive source | TCM source | Naive source | |
| 5.5 (4.6, 6.8) 106 | 4.3 (3.2,5.8) 106 | 0.93 (0.68, 1.3) 106 | |
| 0.026 (0.019, 0.035) | 0.027 (0.019, 0.039) | 0.074 (0.051, 0.11) | |
| 1.7 (1.1, 2.5) 10−3 | 0.20 (0.13, 0.40) | 4.5 (2.8, 8.7) 10-4 | |
| 1.6 (−1.9, 5.4) 10−3 | 0.012 (0.0060, 0.034) | 0.019 (0.011, 0.038) | |
| 5.3 (0.0074, 6.1) 106 | 6.2 (0.00023, 24.0) 105 | 1.5 (0.75, 2.2) 105 | |
| AIC | 0.16 | 11.0 | 0.0 |
| Declining recruitment model | |||
|---|---|---|---|
| CD4 TEM | CD4 TCM | ||
| Naive source | TCM source | Naive source | |
| 5.6 (4.5, 6.8) 106 | 4.4 (3.3,6.0) 106 | 6.9 (5.0, 9.3) 105 | |
| 0.026 (0.018, 0.035) | 0.028 (0.018, 0.040) | 0.073 (0.053, 0.11) | |
| 2.2 (0.94, 5.8) 10−3 | 0.17 (0.096, 0.37) | 1.3 (0.47, 4.0) 10−3 | |
| 0.22 (−1.3, 1.7) 10−3 | 0.011 (0.0042, 0.025) | 7.1 (5.1, 9.6) 10−3 | |
| 2.2 (−2.5, 8.3) 10-3 | −0.85 (−4.2, 5.0) 10−3 | 9.7 (3.8, 17.0) 10−3 | |
| AIC | 0.0 | 11.0 | 8.3 |
Appendix 1—table 3
Comparing parameter estimates for variants of the model of kinetic heterogeneity used to describe BrdU labelling kinetics. We show point estimates of parameters for the original KH model (source freely allocated to the kinetically distinct subpopulations) and the variant which the source is forced to feed into the fast subpopulation only. The impact is largely on the parameters defining the slow population.
| CD4 effector memory | ||
|---|---|---|
| Quantity | Free source | Source feeds fast |
| Brdu uptake efficiency (%) | 76 | 79 |
| Mean Ki67 lifetime (days) | 3.28 | 3.27 |
| Population-averaged lifetime (days) | 29 | 39 |
| Population-averaged interdivision time(days) | 88 | 39 |
| Delay before source turns BrdU post-labelling (days) | 2.52 | 2.43 |
| Source contribution to peripheral production (fraction) | 0.12 | 0.13 |
| Lifetime of fast population (days) | 5.7 | 5.4 |
| Lifetime of slow population (days) | 43 | 58 |
| Interdivision time of fast population (days) | 5.7 | 6.3 |
| Interdivision time of slow population (days) | 138 | 58 |
| Size of fast population (fraction of total) | 0.38 | 0.37 |
| CD4 central memory | ||
|---|---|---|
| Quantity | Free source | Source feeds fast |
| Brdu uptake efficiency (%) | 77 | 79 |
| Mean Ki67 lifetime (days) | 3.59 | 3.51 |
| Population-averaged lifetime (days) | 21 | 30 |
| Population-averaged interdivision time(days) | 86 | 31 |
| Delay before source turns BrdU post-labelling (days) | 0.085 | 0.003 |
| Source contribution to peripheral production (fraction) | 0.092 | 0.091 |
| Lifetime of fast population (days) | 3.3 | 3.23.2 |
| Lifetime of slow population (days) | 38 | 57 |
| Interdivision time of fast population (days) | 3.4 | 3.5 |
| Interdivision time of slow population (days) | 167 | 57 |
| Size of fast population (fraction of total) | 0.49 | 0.49 |
Additional files
-
Appendix 1—figure 1—source data 1
Data showing stability of both numbers and Ki67 expression of effector memory, central memory and naive CD4 T cells recovered from lymph nodes during BrdU labelling.
- https://doi.org/10.7554/eLife.23013.023
Download links
A two-part list of links to download the article, or parts of the article, in various formats.
Downloads (link to download the article as PDF)
Open citations (links to open the citations from this article in various online reference manager services)
Cite this article (links to download the citations from this article in formats compatible with various reference manager tools)
Memory CD4 T cell subsets are kinetically heterogeneous and replenished from naive T cells at high levels
eLife 6:e23013.
https://doi.org/10.7554/eLife.23013


