TAPBPR bridges UDP-glucose:glycoprotein glucosyltransferase 1 onto MHC class I to provide quality control in the antigen presentation pathway
- University of Cambridge, United Kingdom
- University of Southampton, United Kingdom
- Institute of Medical Sciences, University of Aberdeen, United Kingdom
- Eberhard Karls University Tübingen, Germany
Figures
Figure 1
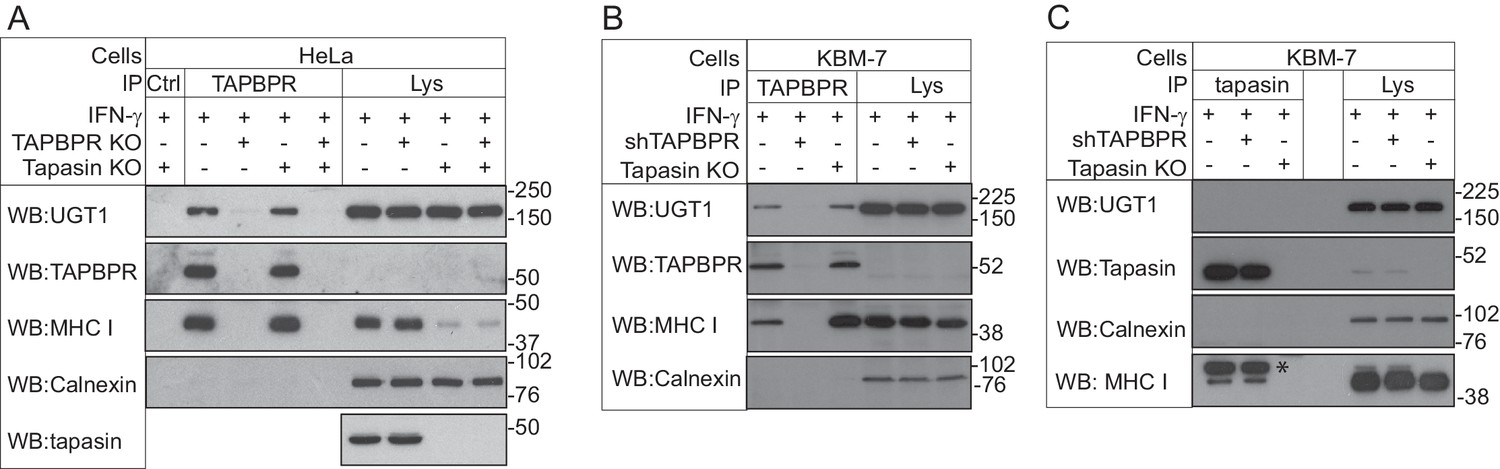
TAPBPR associates with UDP-glucose:glycoprotein glucosyltransferase 1
(A and B) TAPBPR or (C) tapasin were immunoprecipitated using PeTe4 or Pasta1, respectively, from (A) IFN-γ-treated HeLaM, TAPBPR KO, tapasin KO, and double tapasin KO/TAPBPR KO HeLaM cells or (B and C) IFN-γ-treated wild-type, TAPBPR-depleted (+ shTAPBPR), and tapasin KO KBM-7 cells. In (A), immunoprecipitation with an isotype control antibody was used as a control (labelled 'Ctrl'). Western blot analysis was performed for UGT1, TAPBPR (using R021), tapasin (Rgp48N), MHC class I HC (using 3B10.7), or calnexin as a loading control on immunoprecipitates or lysates as indicated. Note: the amounts of TAPBPR present in the lysates were below limits of detection and were detectable after concentration via immunoprecipitation. In (C), * denotes the tapasin protein from the previous blot, while the lower band is the MHC class I HC. The data shown are representative of three independent experiments. In (A and B), an increased association between TAPBPR and MHC class I molecules in the absence of tapasin can be observed. While this is not immediately obvious in (A) with HeLaM cells, a significant loss of MHC class I expression is observed in the absence of tapasin in this cell line. Therefore, a relative increase in the association between MHC class I molecules and TAPBPR is observed in the absence of tapasin. KO: knockout; UGT1: UDP-glucose:glycoprotein glucosyltransferase 1; IP: immunoprecipitation; WB: western blot.
Figure 2 with 1 supplement
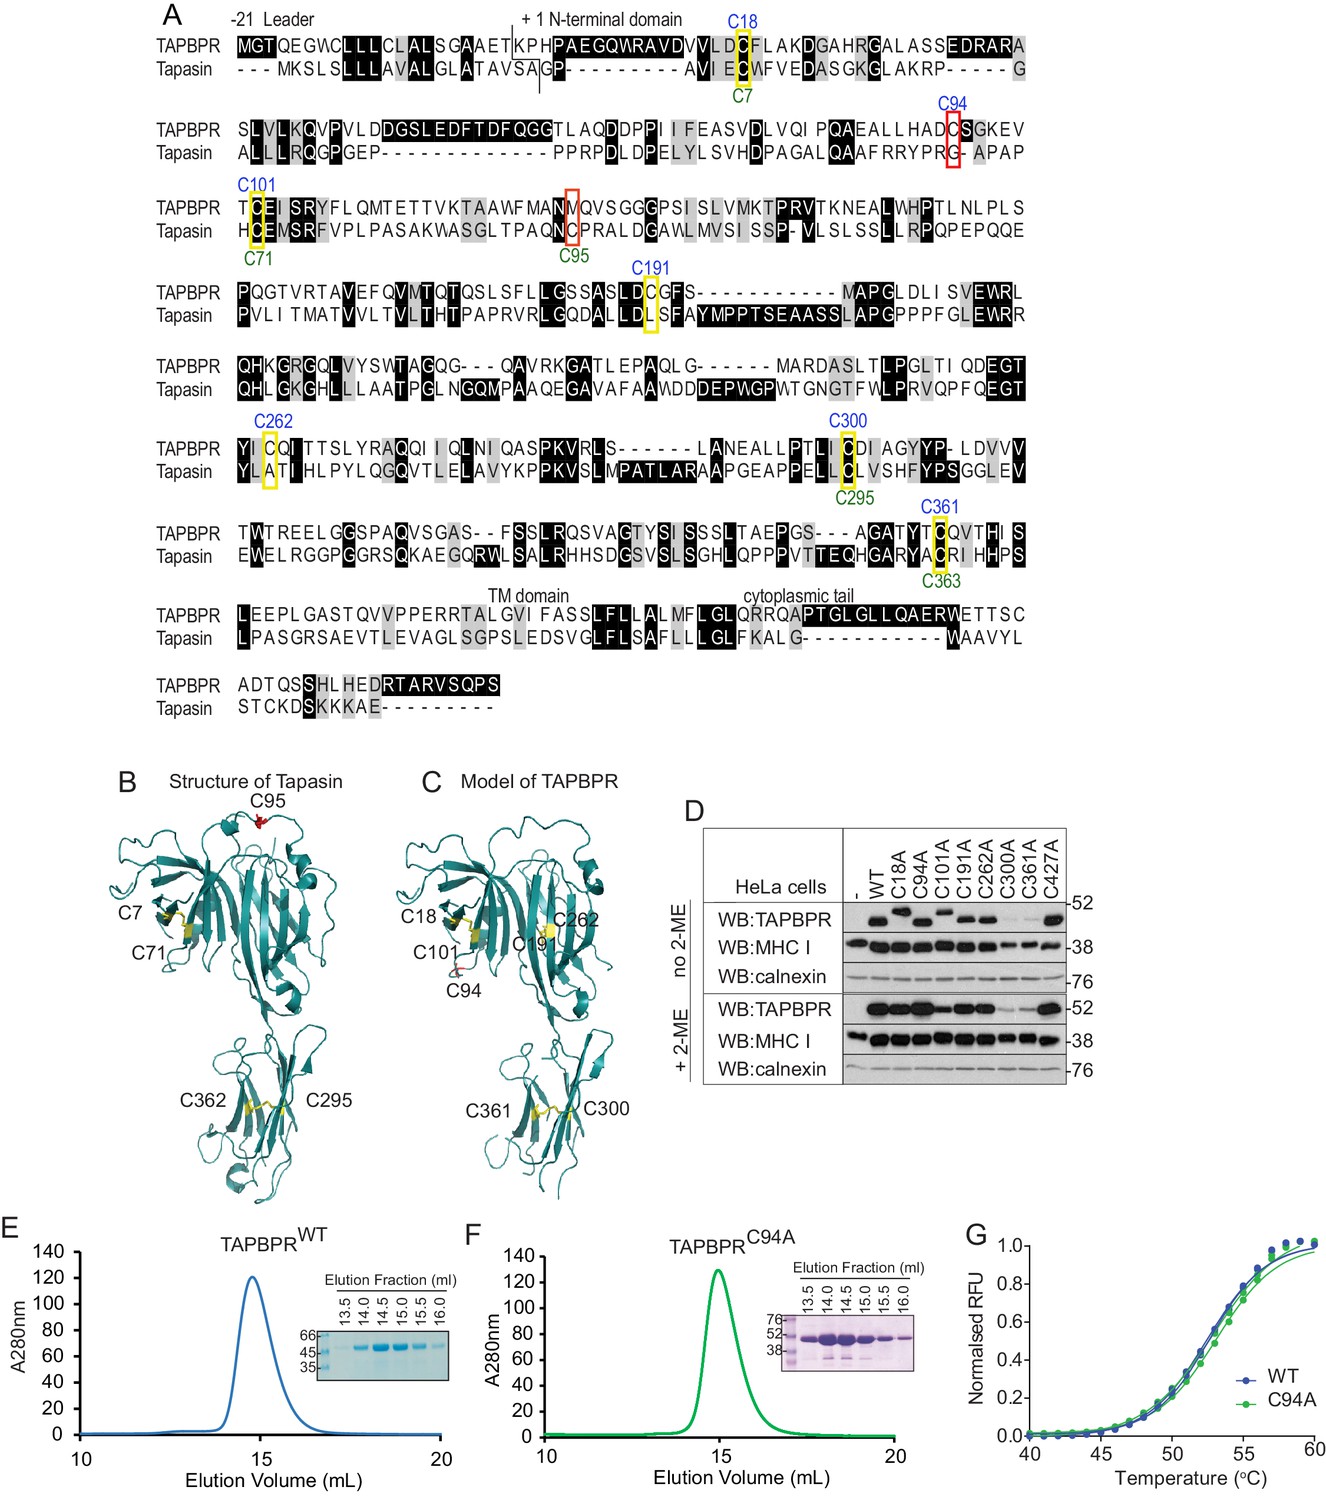
C94 in TAPBPR is not involved in an intramolecular disulphide bond
(A) Amino acid sequences of human TAPBPR (NP_060479.3) and tapasin (AAC20076.1) were aligned using ClustalW. Cysteine residues are marked in yellow boxes, with the cysteine in tapasin that interacts with ERp57 and the predicted unpaired cysteine in TAPBPR highlighted in red. The positions of the cysteine residues in TAPBPR and tapasin are labelled above and below, in blue or green, respectively. (B) Structure of tapasin (Protein Data Bank ID: 3F8U), with the cysteines involved in intramolecular disulphide bonds highlighted in yellow and the free cysteine C95 highlighted in red. (C) FFAS model for TAPBPR (Hermann et al., 2013), with potential disulphide bridges highlighted in yellow and the predicted free cysteine C94 highlighted in red. (D) Lysates from a HeLaM cell panel expressing cysteine-mutant TAPBPR molecules were resolved under non-reducing (no 2-ME) or reducing (+2-ME) conditions, then blotted for TAPBPR (using mouse anti-TAPBPR), MHC class I heavy chain (using HC10), or calnexin as a loading control. The antibody used to detect TAPBPR was raised against the membrane distal domain (aa 23–122); therefore, it is unlikely that the lack of detection of C300 and C361 is due to a lack of antibody recognition of these IgC domain mutants. Data shown in (D) are representative of three independent experiments. (E and F) Size exclusion chromatogram of TAPBPRWT and TAPBPRC94A purified from cell culture supernatant. The protein peaks were analysed by SDS-PAGE followed by Coomassie staining. (G) Differential scanning fluorimetry of TAPBPRWT and TAPBPRC94A demonstrates equivalent thermal denaturation profiles. WT: wild-type; WB: western blot; RFU: relative fluorescence units.
Figure 2—figure supplement 1
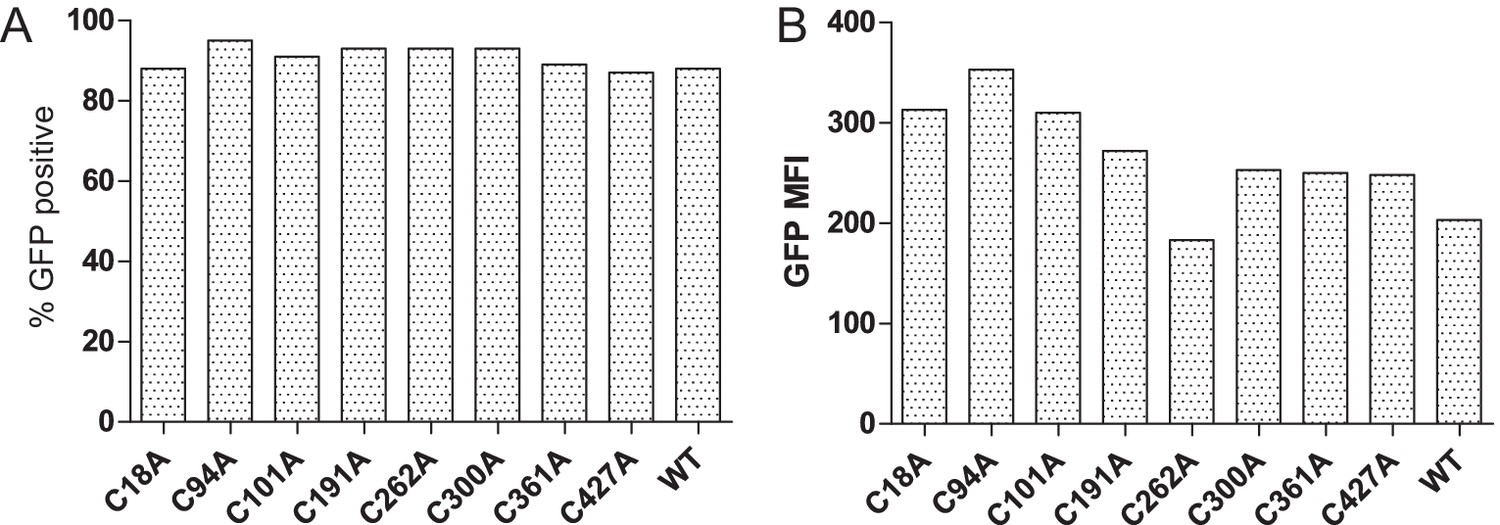
Transduction efficiency of the cysteine-mutant panel into HeLaM cells
(A) Bar graph showing the percentages of GFP-expressing cells for the various TAPBPR cysteine mutants transduced into HeLaM cells. (B) Bar graph showing mean fluorescence intensity for GFP expression on the full cysteine-mutant panel expressed in HeLaM. WT: wild-type; MFI: mean fluorescence intensity.
Figure 3 with 2 supplements
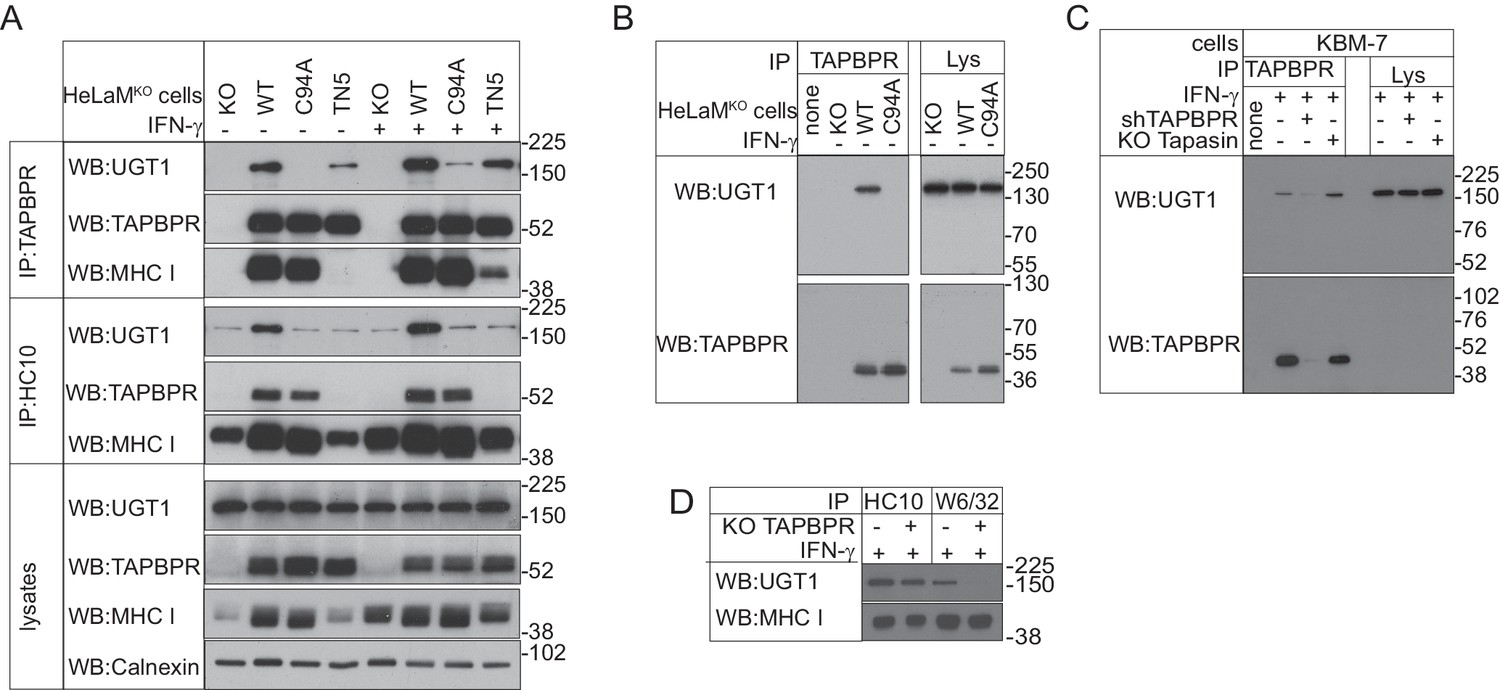
TAPBPR binds to UDP-glucose:glycoprotein glucosyltransferase 1 in a C94-dependent manner, but not via a disulphide bond and bridges UDP-glucose:glycoprotein glucosyltransferase 1 to MHC class I molecules
(A–C) TAPBPR or (A) HC10-reactive MHC class I were isolated by immunoprecipitation from (A and B) HeLaM-TAPBPRKO cells (HeLaMKO) and HeLaMKO cells reconstituted with either TAPBPRWT, TAPBPRC94A, or TAPBPRTN5 or (C) WT, TAPBPR-depleted (+ shTAPBPR), and tapasin KO KBM-7 cells, with or without IFN-γ treatment, as indicated under (A) reducing or (B and C) non-reducing conditions. (D) HC10 and W6/32-reactive MHC class I molecules were isolated from IFN-γ-treated HeLaM and HeLaMKOcells and resolved under reducing conditions. Western blot analysis was performed for UGT1, TAPBPR (using R021), MHC class I HC (using 3B10.7), or calnexin as a loading control on immunoprecipitates or lysates as indicated. The lane labelled ‘none’ in (B) indicates PeTe4 antibody only, with no cellular lysate in immunoprecipitation. All data shown are representative of three independent experiments. KO: knockout; UGT1: UDP-glucose:glycoprotein glucosyltransferase 1; WT: wild-type; WB: western blot; IP: immunoprecipitation.
Figure 3—figure supplement 1
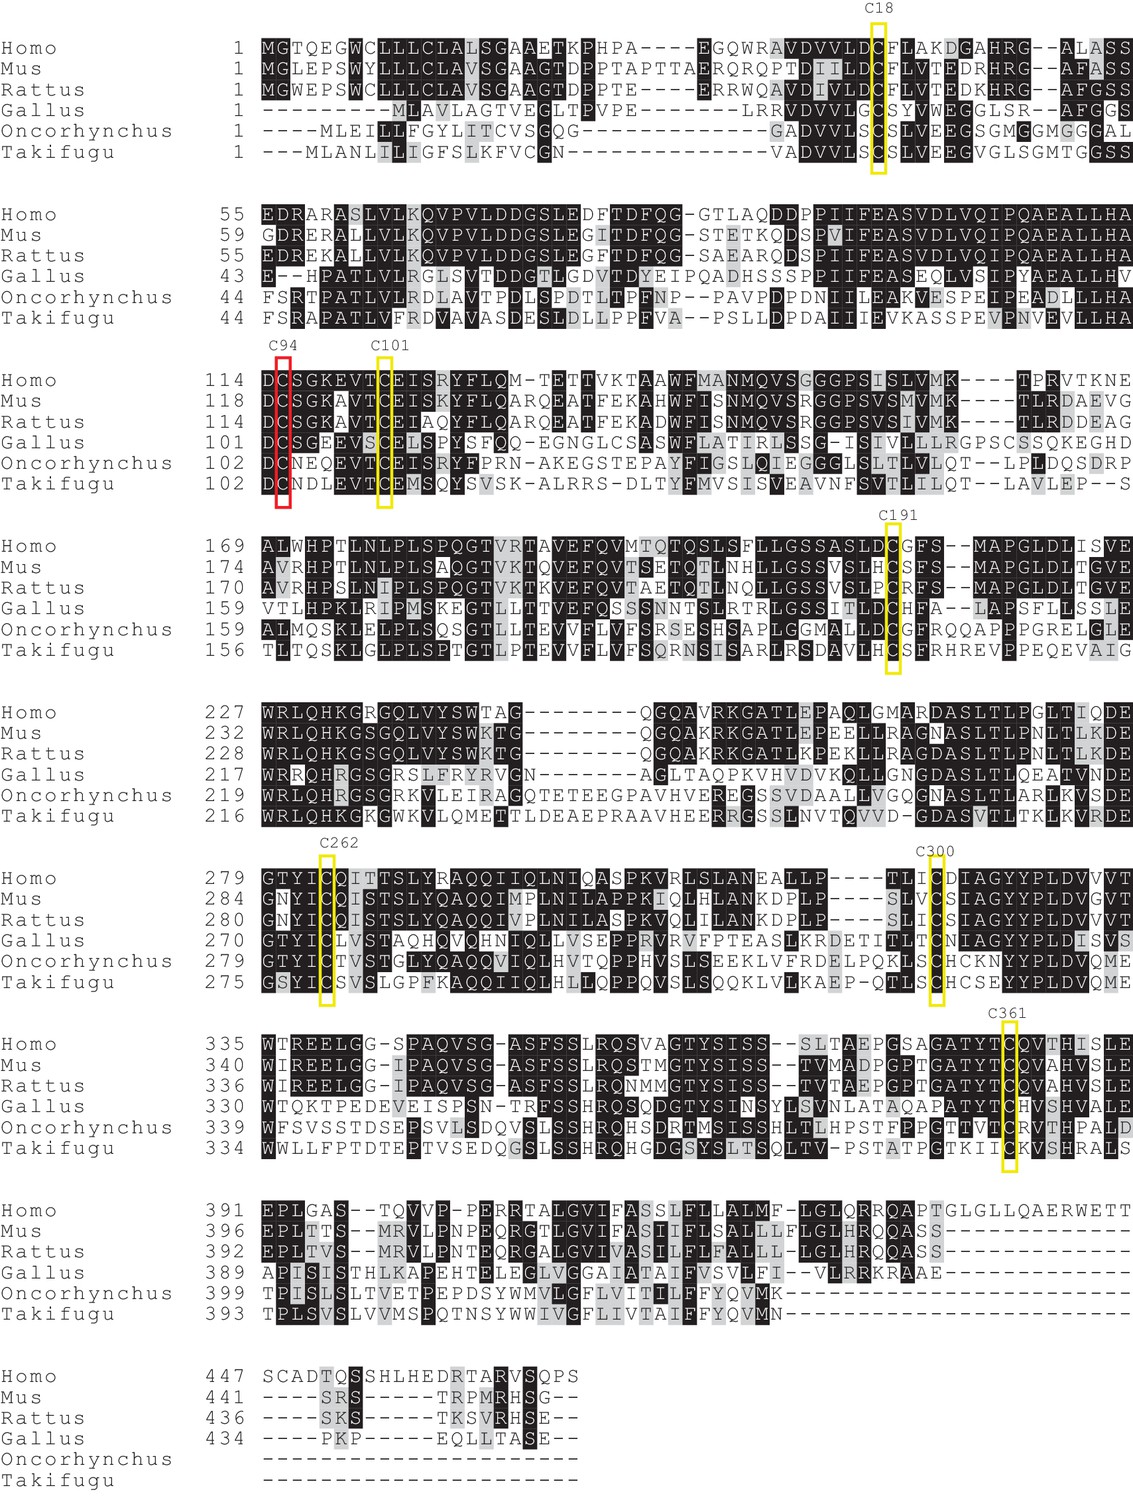
Cysteine residues are conserved in TAPBPR across different species
Amino acid sequences of TAPBPR in human (Homo, NP_060479.3), mouse (Mus, NP_663366.2), rat (Rattus, NP_001100092.1), chicken (Gallus, NP_001026543.1), rainbow trout (Oncorhynchus, NP_001118026.1), and fugu (Takifugu, XP_003966357.1) were aligned using Clustal Omega. Conserved cysteine residues predicted to be involved in intramolecular disulphide bond formation are marked in yellow boxes, while the predicted unpaired cysteine residue is highlighted in red.
Figure 3—figure supplement 2
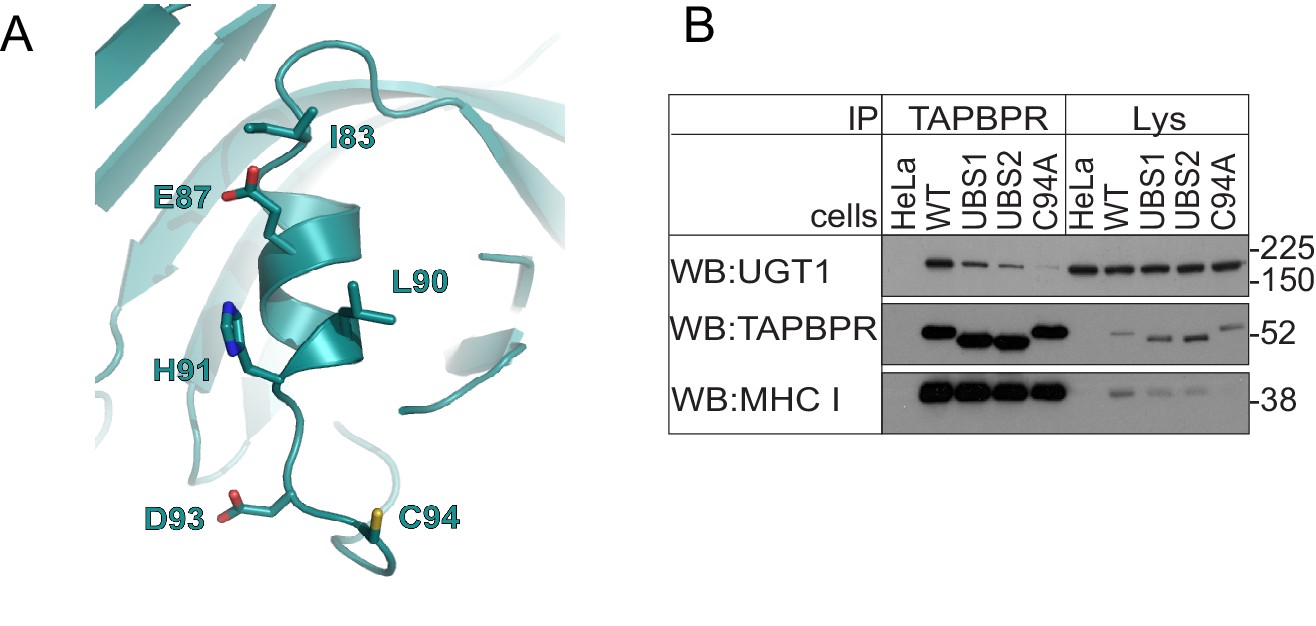
Residues in the helix next to C94 in TAPBPR influence UDP-glucose:glycoprotein glucosyltransferase 1 association
(A) Location of a predicted helix next to residues C94 in our FFAS model for TAPBPR. (B) TAPBPR was immunoprecipitated from HeLaM and HeLaM cells expressing TAPBPRWT, TAPBPRUBS1 (I83K, E87K), TAPBPRUBS2 (E87K, L90K, H91S, D93R), or TAPBPRC94A. Western blot analysis was performed for UGT1, TAPBPR (using R021), MHC class I HC (using 3B10.7), or calnexin on immunoprecipitates or lysates as indicated under reducing conditions. Data shown are representative of three independent experiments. Note: these experiments were performed in HeLaM and not HeLaM-TAPBPRKO cells; therefore, there is the possibility of residual endogenous TAPBPR expression. See Supplementary file 1 for the sequence of primers used to generate the UBS mutants. UGT1: UDP-glucose:glycoprotein glucosyltransferase 1; WT: wild-type.
Figure 4 with 1 supplement
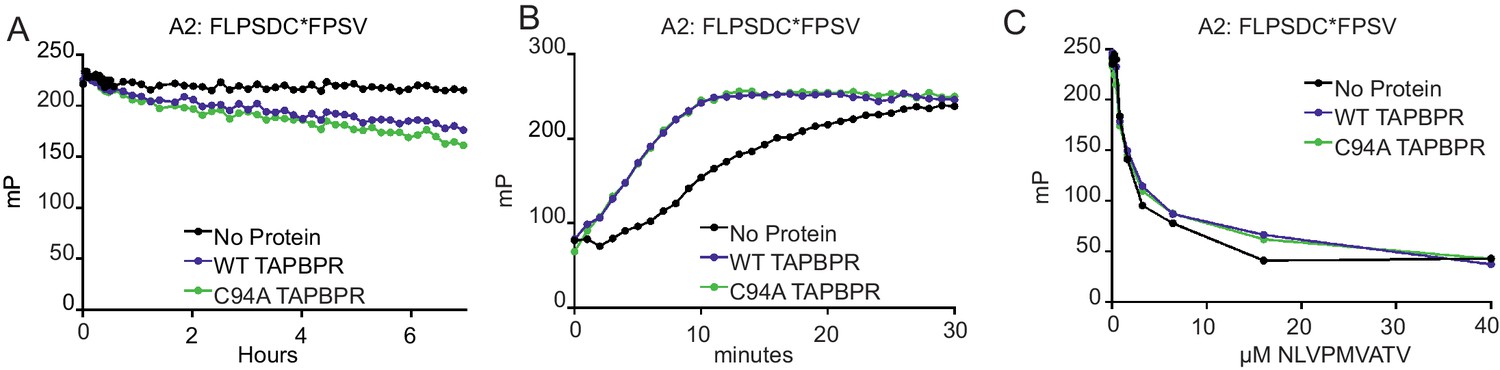
TAPBPRC94A still functions as a peptide editor in vitro
(A) Dissociation of the fluorescent peptide FLPSDC*FPSV from HLA-A*02:01 in the absence or presence of TAPBPRWT or TAPBPRC94A. 500 nM HLA-A02:01 molecules (refolded with UV-labile KILGFVFjV peptide, as described previously in Hermann et al., 2015) were exposed to 366 nm UV light at 4°C for 20 min. The UV-exposed protein was then incubated with 17.6 nM FLPSDC*FPSV (C* denotes 5-carboxytetramethylrhodamine ‘TAMRA’-labelled cysteine) overnight at room temperature. The FLPSDC*FPSV–HLA-A*02:01 complexes were then split and incubated with 1000-fold molar excess NLVPMVATV with either buffer (no protein) or supplemented with either 0.125 µM TAPBPRWT or TAPBPRC94A. The data shown are representative of three experiments. (B) Association of the fluorescent peptide FLPSDC*FPSV with HLA-A*02:01 in the absence or presence of TAPBPRWT or TAPBPRC94A. 75 nM HLA-A02:01fos molecules (refolded with UV-labile KILGFVFjV peptide) were mixed with 1.5 µM human β2m and exposed to 366-nm UV light at 4°C for 20 min, and then 5.95 nM FLPSDC*FPSV was added in the absence or presence of 0.125 µM TAPBPRWT or TAPBPRC94A immediately before fluorescence polarisation measurements were taken. One representative experiment of three is shown. (C) Competition between peptides for binding with peptide-receptive HLA-A*02:01 molecules in the presence or absence of TAPBPRWT or TAPBPRC94A as measured by fluorescence polarisation. 75 nM HLA-A02:01fos molecules (refolded with UV-labile KILGFVFjV peptide) were mixed with 1.5 µM human β2m and exposed to 366-nm UV light at 4°C for 20 min, and then incubated with 5.95 nM high-affinity peptide FLPSDC*FPSV and various concentrations of the lower-affinity competing peptide NLVPMVATV (0–100 μM) in the presence or absence of 0.0625 µM TAPBPRWT or TAPBPRC94A (see Figure 4—figure supplement 1 for a comparison of the affinity of FLPSDCFPSV or NLVPMVATV for HLA-A2). Fluorescence polarisation measurements were taken after incubation overnight at 25°C. One representative experiment of three is shown. WT: wild-type.
Figure 4—figure supplement 1
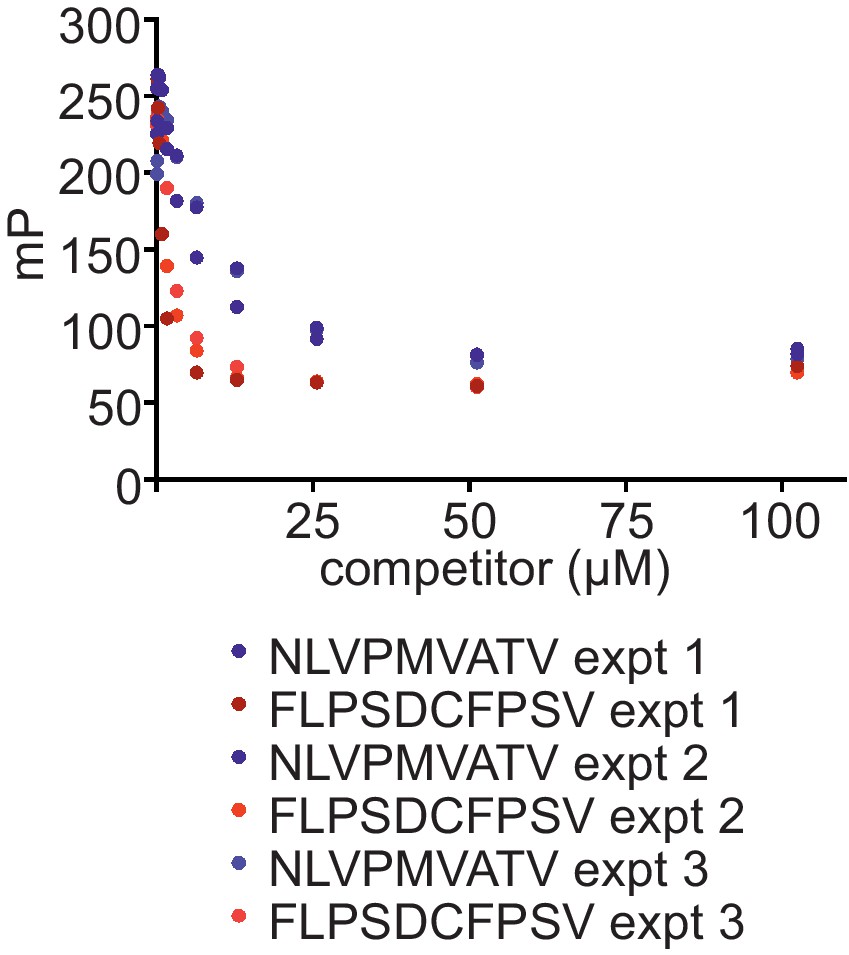
Comparison of the ability of FLPSDCFPSV or NLVPMVATV to inhibit binding of FLPSDC*FPSV to peptide-receptive HLA-A*02:01fos molecules
150 nM HLA-A02:01fos molecules (refolded with UV-labile KILGFVFjV peptide) were mixed with 1.5 µM human β2m and exposed to 366-nm UV light at 4°C for 20 min, and then incubated with 14 nM high-affinity peptide FLPSDC*FPSV and various concentrations of the competing peptides NLVPMVATV or FLPSDCFPSV (0–100 μM). Fluorescence polarisation measurements were taken after incubation overnight at 25°C. The results of three experiments are shown.
Figure 5 with 4 supplements
UDP-glucose:glycoprotein glucosyltransferase 1 bound to TAPBPR influences peptide selection on MHC class I molecules
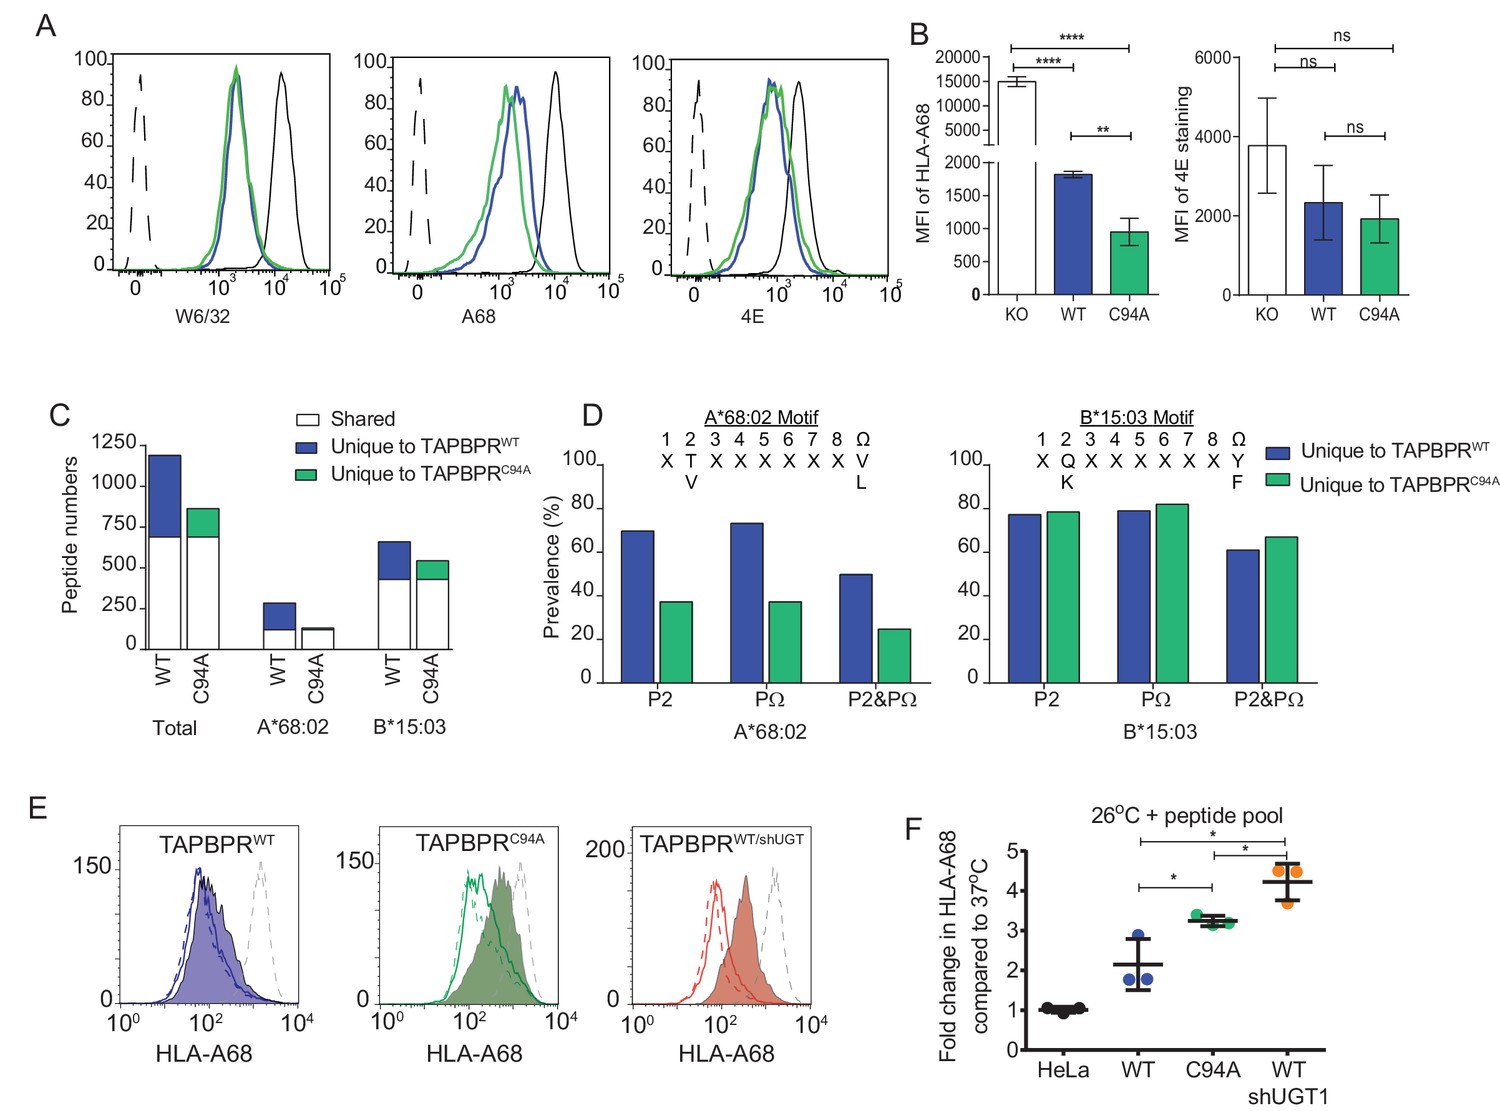
(A) Cytofluorimetric analysis of W6/32-, HLA-A68-, and 4E-reactive MHC class I molecules on HeLaMKOcells (black line), HeLaMKOcells reconstituted with TAPBPRWT (blue line) or TAPBPRC94Acells (green line). Staining of HeLaMKO cells with an isotype control is included as a negative control (black dashed histogram). (B) Bar graphs show the MFI for cell surface HLA-A68 and for HLA-B molecules using 4E antibody from three independent experiments, as performed in (A). Error bars represent SD. ****p<0.0001, **p<0.005, ns=not significant, based on unpaired t tests. The MFI for cell surface HLA-A68 on IFN-γ-treated equivalents can be seen in Figure 5—figure supplement 1. (C and D) Peptide–MHC class I complexes were isolated by affinity chromatography using W6/32 from IFN-γ-treated HeLaMKO, HeLaMKOTAPBPRWT, and HeLaMKOTAPBPRC94A cells. Eluted peptides were analysed using liquid chromatography tandem mass spectrometry (for full list see Figure 5—source data 1). (C) Bar graph displaying the number of unique and shared peptides found in IFN-γ treated HeLaMKOTAPBPRWT and HeLaMKOTAPBPRC94A cells. (D) Graphs showing the prevalence of classic peptide anchors on HLA-A*68:02 (T and V at P2, V and L at PΩ) and HLA-B*15:03 (Q and K at P2, Y and F at PΩ) for peptides unique to IFN-γ treated TAPBPRWT-expressing cells (i.e. peptides presumably permitted release by UGT1 in the context of TAPBPR) and peptides unique to IFN-γ treated TAPBPRC94A-expressing cells (i.e. peptide presumably restricted by TAPBPR:UGT1) after removal of peptides shared with IFN-γ induced HeLaMKO cells. The data in (C and D) were generated from tandem mass spectrometry analysis performed three times on one immunoprecipitate. WebLogo depictions of the peptide sequences of 9-mers isolated from TAPBPRWT- and TAPBPRC94A-expressing cells can be found in Figure 5—figure supplement 2. Further statistical analysis on the isolated peptides can be found in Figure 5—figure supplement 3. (E) Cytofluorimetric analysis of peptide-loaded HLA-A68 on HeLaM-TAPBPRWT, HeLaM-TAPBPRC94A, and shUGT1-depleted HeLaM-TAPBPRWTcells after incubation at 37°C (dashed line), 26°C (solid line), or 26°C supplemented with a pool of high-affinity peptides for HLA-A and -B (an influenza virus, Epstein-Barr virus, and cytomegalovirus [FEC] peptide pool. Individual peptides were used at a final concentration of 3 µg/ml) (filled histogram) for 90 min in media post-trypsinisation. HLA-A68 staining on non-transduced HeLaM cells incubated at 37°C for 90 min post-trypsinisation was included as a positive control (grey dashed line). y-axes = events normalised to mode. See Figure 5—figure supplement 4 for associations between TAPBPR, MHC class I, and UGT1 in these independently produced cell lines. (F) Scatter dot plot show the fold change in MFI for cell surface HLA-A68 on cells at 26°C plus FEC peptide pool compared to incubation at 37°C alone on three independent replicates as performed in (E). Error bars represent SD. *p<0.05, based on unpaired t tests. MFI: median fluorescence intensity; KO: knockout; WT: wild-type; UGT1: UDP-glucose:glycoprotein glucosyltransferase 1.
-
Figure 5—source data 1
MHC class I peptide elution from IFN-γ treated HeLaMKOTAPBPRWT and HeLaMKOTAPBPRC94A
The total peptides list shows all of the peptides that were eluted from MHC class I molecules expressed in IFN-γ treated HeLaMKO (HeLa 7.9), HeLaMKOTAPBPRWT and HeLaMKOTAPBPRC94A cells using W6/32. The HLA-A peptide subgroup 1 list shows all of the peptides that were predicted to be HLA-A binders using NetMHC, comparing IFN-γ treated HeLaMKOTAPBPRWT and HeLaMKOTAPBPRC94A cells. The HLA-B peptide subgroup 1 list shows all of the peptides that were predicted to be HLA-B binders using NetMHC, comparing IFN-γ treated HeLaMKOTAPBPRWT and HeLaMKOTAPBPRC94A cells. The HLA-A peptide subgroup 2 list shows all of the peptides that were predicted to be HLA-A binders using NetMHC, comparing IFN-γ treated HeLaMKOTAPBPRWT with HeLaMKOTAPBPRC94A cells. All A-peptides that were identified in IFN-γ treated HeLaMKO (HeLa 7.9) cells were excluded from this analysis. The HLA-B peptide subgroup 2 list shows all of the peptides that were predicted to be HLA-B binders using NetMHC, comparing IFN-γ treated HeLaMKOTAPBPRWT with HeLaMKOTAPBPRC94A cells. All B-peptides that were identified in IFN-γ treated HeLaMKO (HeLa 7.9) cells were excluded from this analysis.
- https://doi.org/10.7554/eLife.23049.013
Figure 5—figure supplement 1
Surface expression of HLA-A68 upon IFN-γ treatment
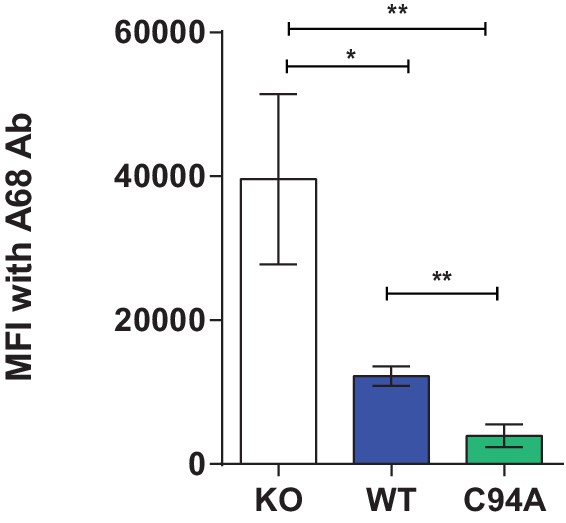
Cytofluorimetric analysis of HLA-A68 on IFN-γ-treated HeLaMKO and IFN-γ-treated HeLaKOcells reconstituted with TAPBPRWT or TAPBPRC94A. The bar graph summarises the data generated from three independent experiments. Error bars represent SD. **p<0.005, *p<0.05, based on Student t tests. KO: knockout; MFI: median fluorescence intensity; WT: wild-type.
Figure 5—figure supplement 2
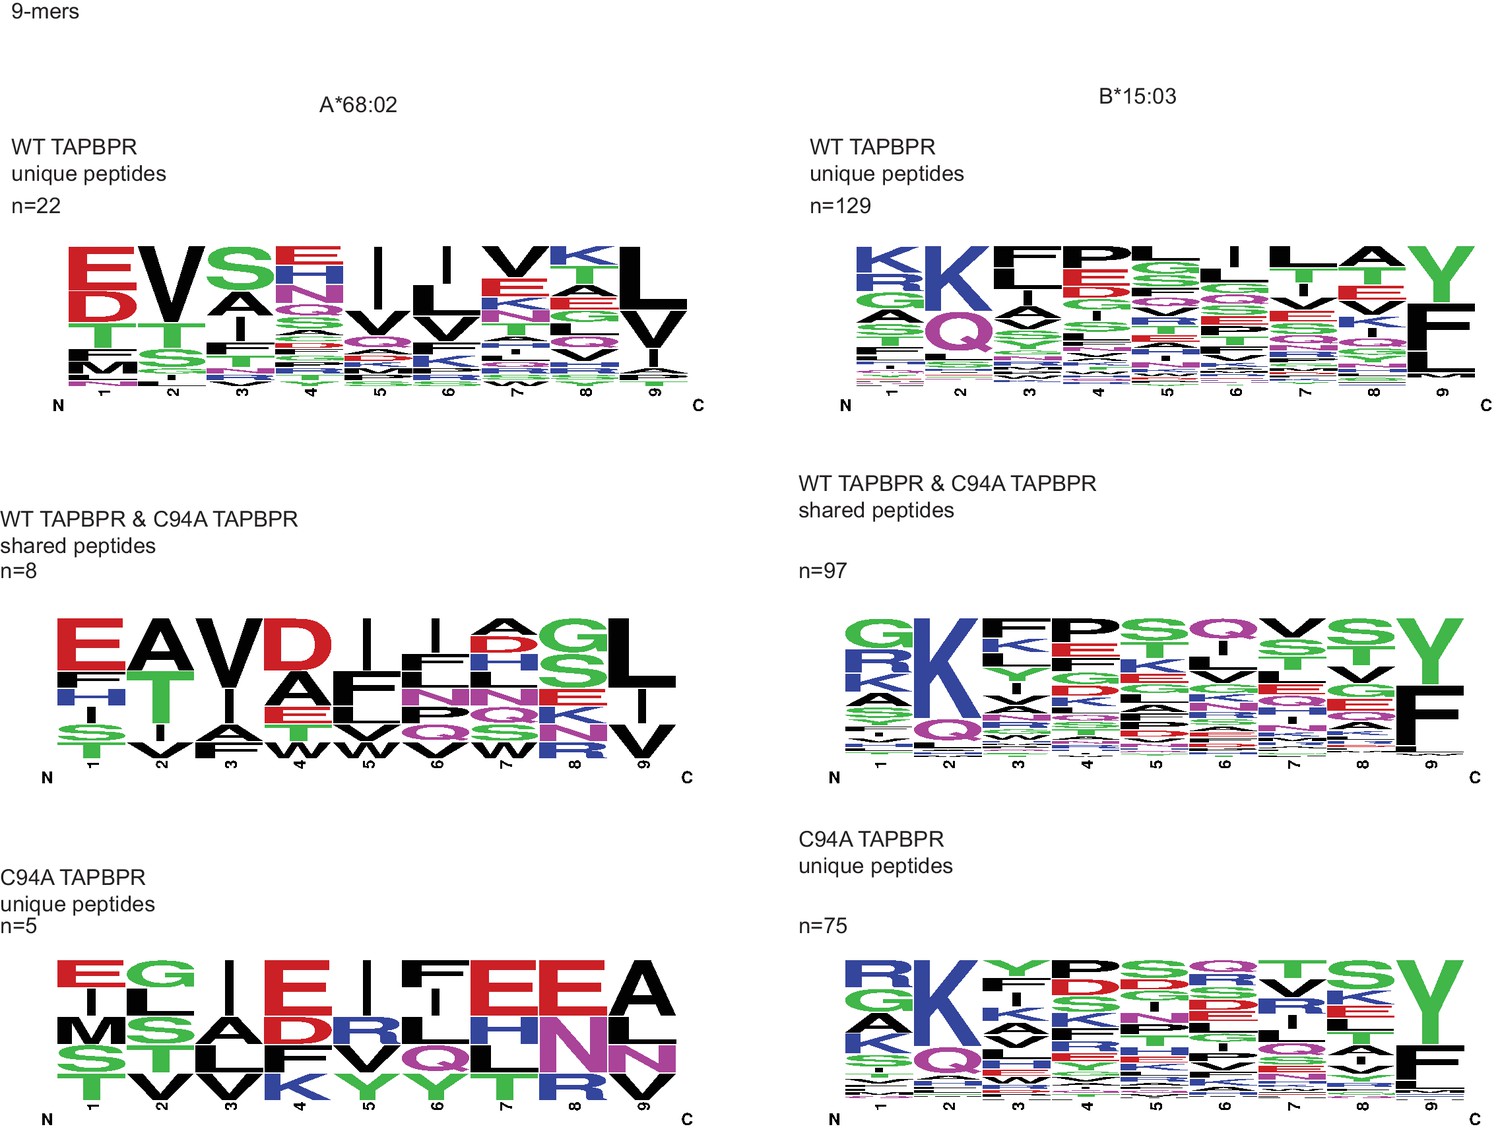
WebLogo depictions of the peptide sequences of 9-mers isolated from TAPBPRWT- and TAPBPRC94A-expressing cells WT: wild-type.
https://doi.org/10.7554/eLife.23049.015
Figure 5—figure supplement 3
Statistical analysis of peptides isolated from cells expressing TAPBPRWT and TAPBPRC94A
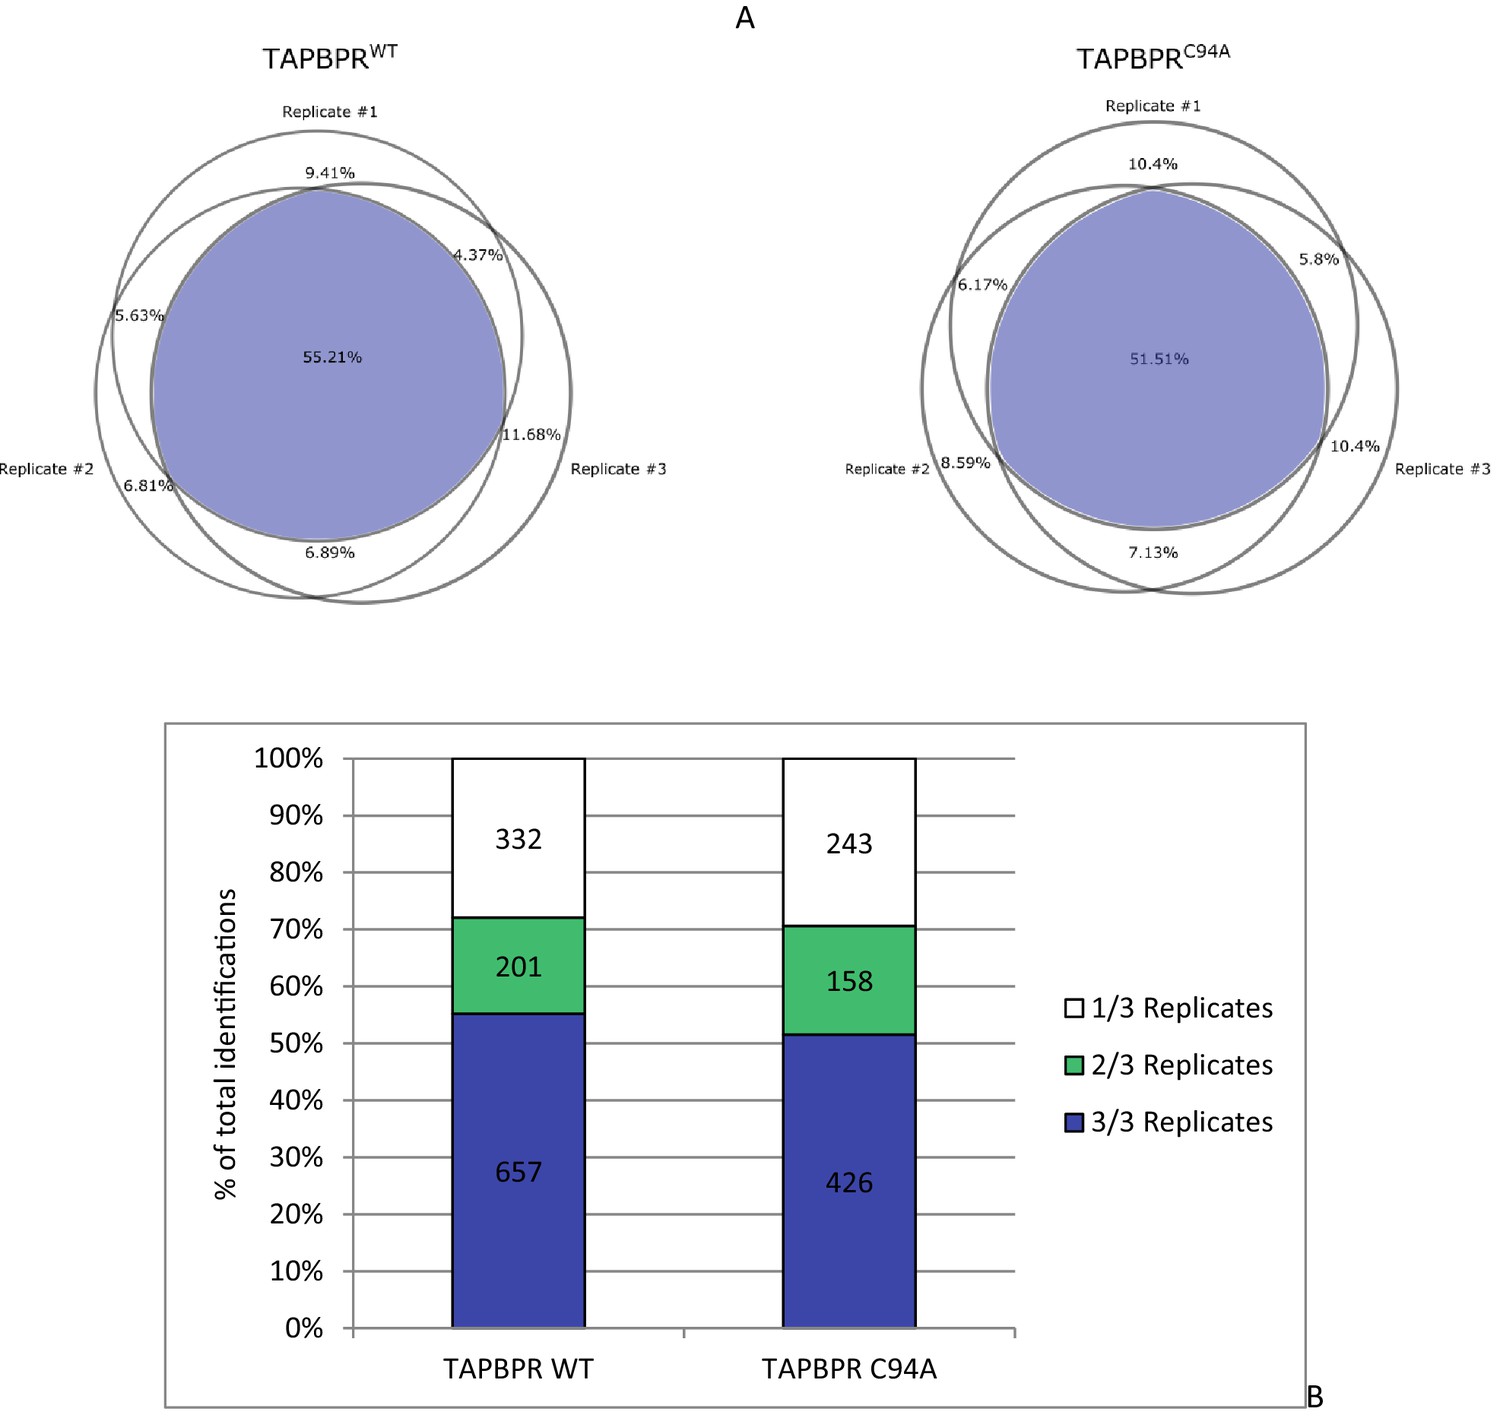
(A) The reproducibility of peptide identifications in three out of three technical liquid chromatography tandem mass spectrometry runs is 55.21% for the TAPBPRWT and 51.51% for the TAPBPRC94A mutant. (B) The reproduction of peptide identifications as defined in more than one liquid chromatography tandem mass spectrometry run is 71% for the TAPBPRWT and 72% for the TAPBPRC94A mutant. These reproducibility rates are within the expected range for data-dependent acquisition mass spectrometry on Orbitrap XL. WT: wild-type.
Figure 5—figure supplement 4

Associations between TAPBPR, MHC class I, and UDP-glucose:glycoprotein glucosyltransferase 1 in the HeLaM cell lines used to test peptide receptivity of HLA-A68
(A) TAPBPR and (B) HC10 immunoprecipitations from independently produced HeLaM, HeLaM-TAPBPRWT, or HeLaM-TAPBPRC94A cells (i.e. not in the TAPBPRKO background) are included to demonstrate that the cells used to generate the data in Figure 5E and F exhibit similar associations between TAPBPR, MHC class I , and UGT1, as is described in the HeLaM-TAPBPRKO cells used for the majority of the data shown in this paper. (C) TAPBPR was immunoprecipitated from HeLaM, HeLaM-TAPBPRWT, and HeLaM-TAPBPRWT cells depleted of UGT1 using shRNA (+shUGT1). Western blot analysis was performed for UGT1, TAPBPR (using R021), MHC class I HC (using 3B10.7), or calnexin as a loading control on immunoprecipitates or lysates as indicated. Data shown are representative of three independent experiments. WT: wild-type; UGT1: UDP-glucose:glycoprotein glucosyltransferase 1; IP: immunoprecipitation; WB: western blot.
Figure 6 with 2 supplements
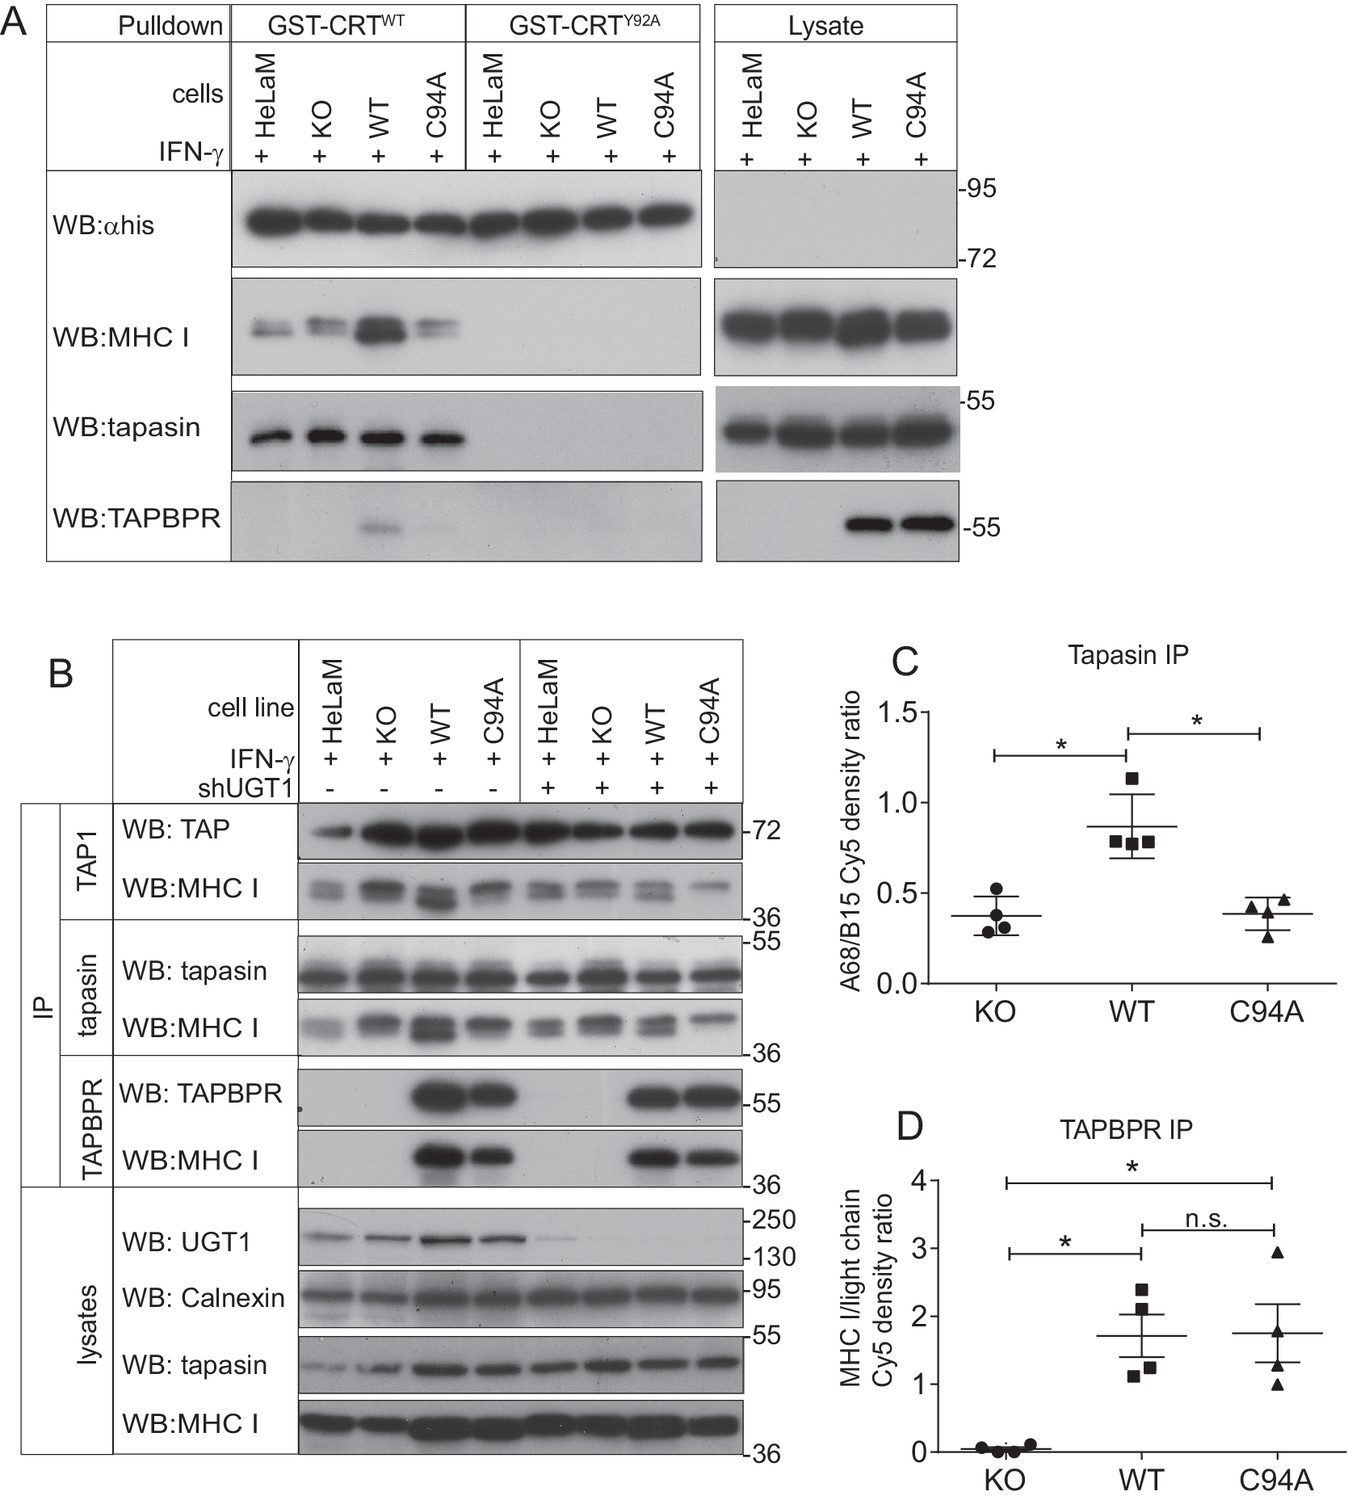
The TAPBPR:UDP-glucose:glycoprotein glucosyltransferase 1 complex promotes reglucosylation of MHC class I molecules, enhancing their association with the peptide-loading complex
(A) Lysates were prepared from IFN-γ-treated HeLaM, HeLaMKO, HeLaMKOTAPBPRWT, and HeLaMKOTAPBPRC94A cells in 1% digitonin. After preclear, pulldowns were performed with GST/6xHis-tagged exogenous WT human calreticulin (GST-CRTWT), which specifically recognises Glc1Man9GlcNAc2 glycans, or with a CRT variant in which a tyrosine at position 92 had been mutated to alanine (GST-CRTY92A), which disrupts glycan recognition. Western blot analysis was performed for the 6xHis tag, MHC class I HC, tapasin, and TAPBPR on pulldowns and lysates as indicated (see Figure 6—figure supplement 1 for densitometry analysis on these blots and the Endo H-sensitivity status on the GST-CRT-reactive MHC class I molecules). (B) TAP, tapasin, or TAPBPR were isolated by immunoprecipitation from IFN-γ-treated HeLaM, HeLaMKO, HeLaMKOTAPBPRWT, and HeLaMKOTAPBPRC94A cells with or without depletion of UGT1 using shRNA. Western blot analysis was performed for TAP, tapasin, TAPBPR, MHC class I HC, UGT1, or calnexin as a loading control on immunoprecipitates or lysates as indicated, resolved under reducing conditions. (C and D) Quantitative analysis of the MHC class I molecules bound to tapasin and TAPBPR in IFN-γ-treated HeLaMKO, HeLaMKOTAPBPRWT, and HeLaMKOTAPBPRC94A cells from four independent Cy5 experiments using the Amersham WB system (see Figure 6—figure supplement 2 for gel images and further analysis). Scatter dot plots show (C) the ratio of HLA-A68 to HLA-B15 associated with tapasin and (B) the total amount of MHC class I HC bound to TAPBPR as a ratio of the PeTe4 antibody light chain used in the immunoprecitation. *p<0.05, n.s.=not significant based on Mann–Whitney non-parametric, two-tailed tests. KO: knockout; UGT1: UDP-glucose:glycoprotein glucosyltransferase 1; WT: wild-type; IP: immunoprecipitation; WB: western blot.
Figure 6—figure supplement 1
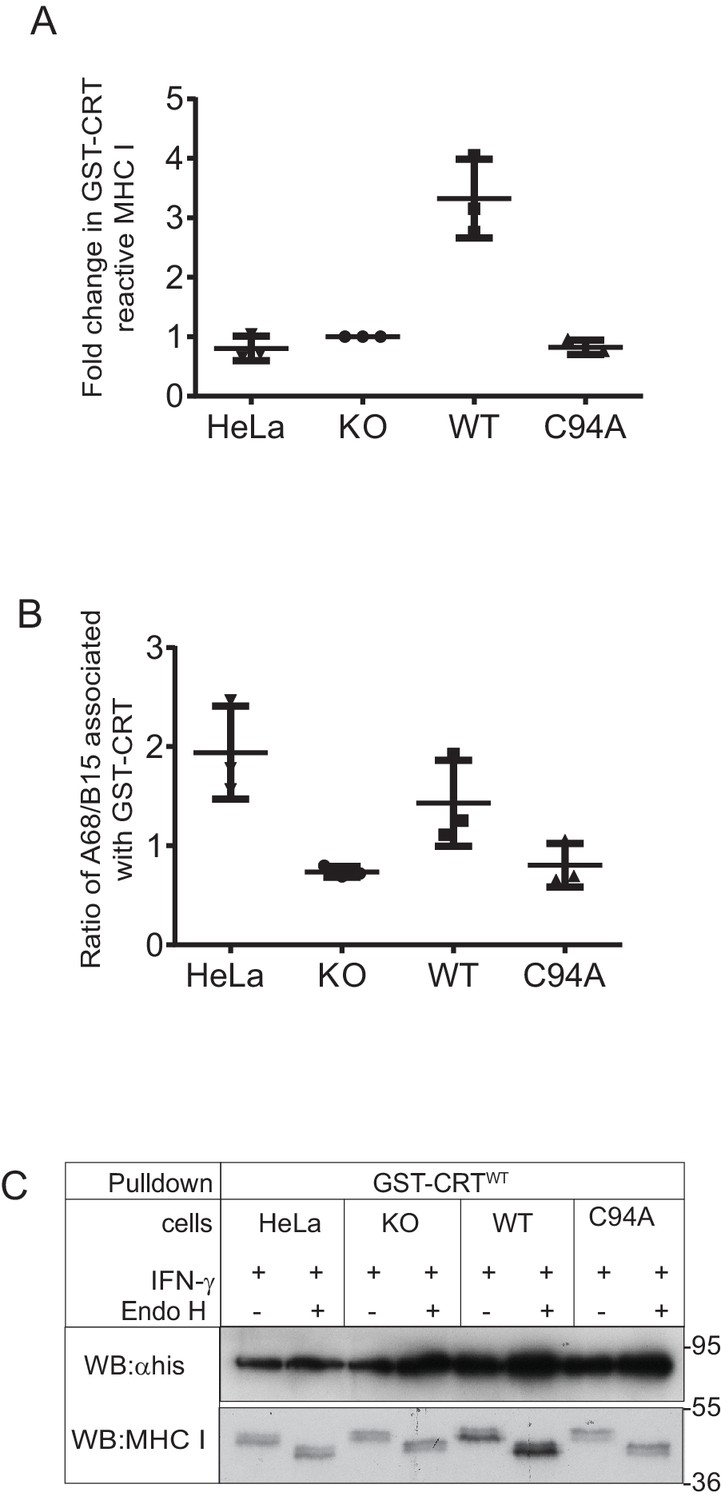
MHC class I molecules associated with GST-CRT
Scatter dot plots show (A) the fold change in the total GST-CRT-reactive MHC class I molecules relative to the IFN-γ-treated HeLaMKOcells and (B) the ratio of HLA-A68 to HLA-B15 associated with GST-CRT on triplicate results as performed in Figure 6A. Error bars show SD. Note: this analysis was performed from scans on an X-ray film following enhanced chemiluminescence (ECL) development, and this is therefore not appropriate for accurate quantification due to the signals not necessarily being on a linear scale and/or saturated, as can be seen with the TAPBPRWT samples. To further valid the increased reglucosylation of HLA-A68 in the presence of TAPBPRWT, we have performed accurate quantitative analysis on tapasin immunoprecipitation in Figure 6C. (C) Endo H digestion of GST-CRTWT pulldowns as performed in Figure 6A followed by western blotting for MHC class I molecules using HC10 and with an anti-His antibody. KO: knockout; WT: wild-type.
Figure 6—figure supplement 2
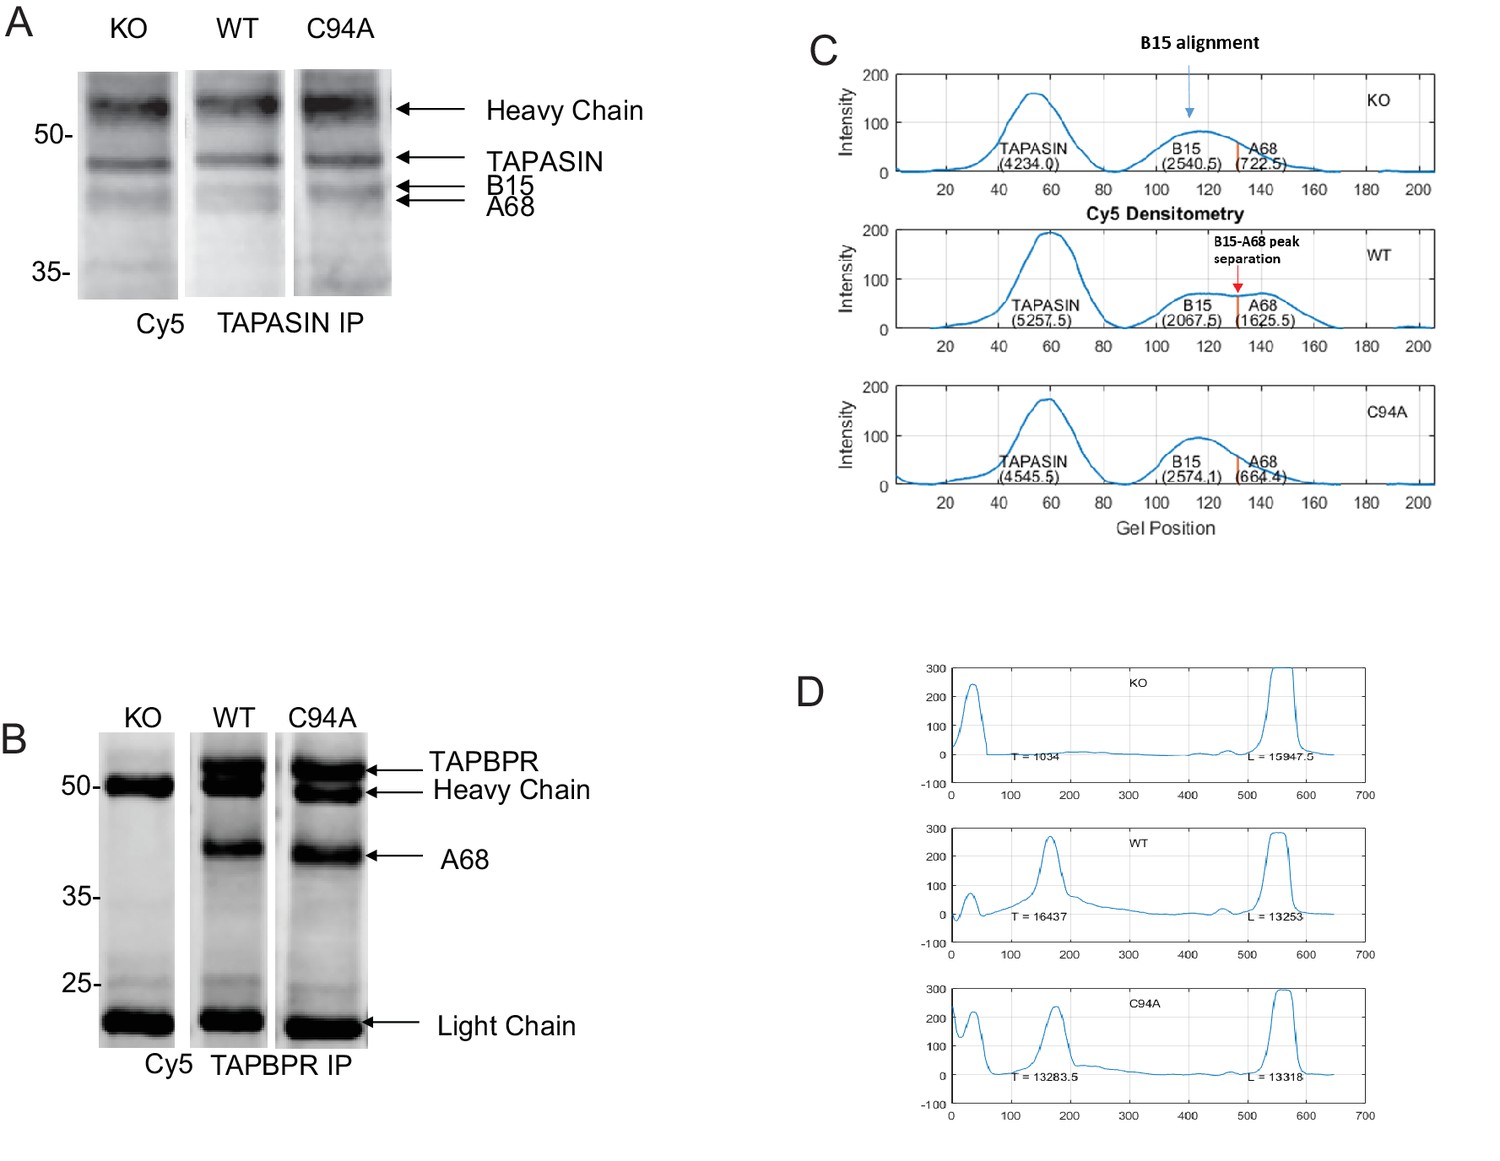
– Densitometry on the MHC class I molecules bound to tapasin and TAPBPR
Representative Cy5 total protein images of (A) tapasin and (B) TAPBPR immunoprecipitations obtained using the Amersham WB system used to generate the data displayed in Figure 6C and D. (C) Densitometry graphs from tapasin immunoprecipitates showing the signal intensities for tapasin, HLA-B15, and HLA-A68. The maximum peak corresponding to B15 was aligned relative to that of the WT track because the separation of B15 and A68 is most distinctive. The separation point between B15 and A68 was identified in the WT track as the minimum between the two peaks. This distance between the B15 peak and the B15/A68 separation point as found in WT was calculated and applied to the alignment positions on the KO and C94A tracks in order to separate B15 and A68 in these two tracks. Areas under the respective curves generated the densities of the corresponding MHC class I molecules. Statistical analysis was performed (Mann–Whitney non-parametric, two-tailed tests). (D) Densitometry graphs from TAPBPR immunoprecipitates showing HLA and antibody light chain. Areas under the curves were measured using a combination of ImageJ and MATLAB. KO: knockout; WT: wild-type; IP: immunoprecipitation; WB: western blot.
Figure 7
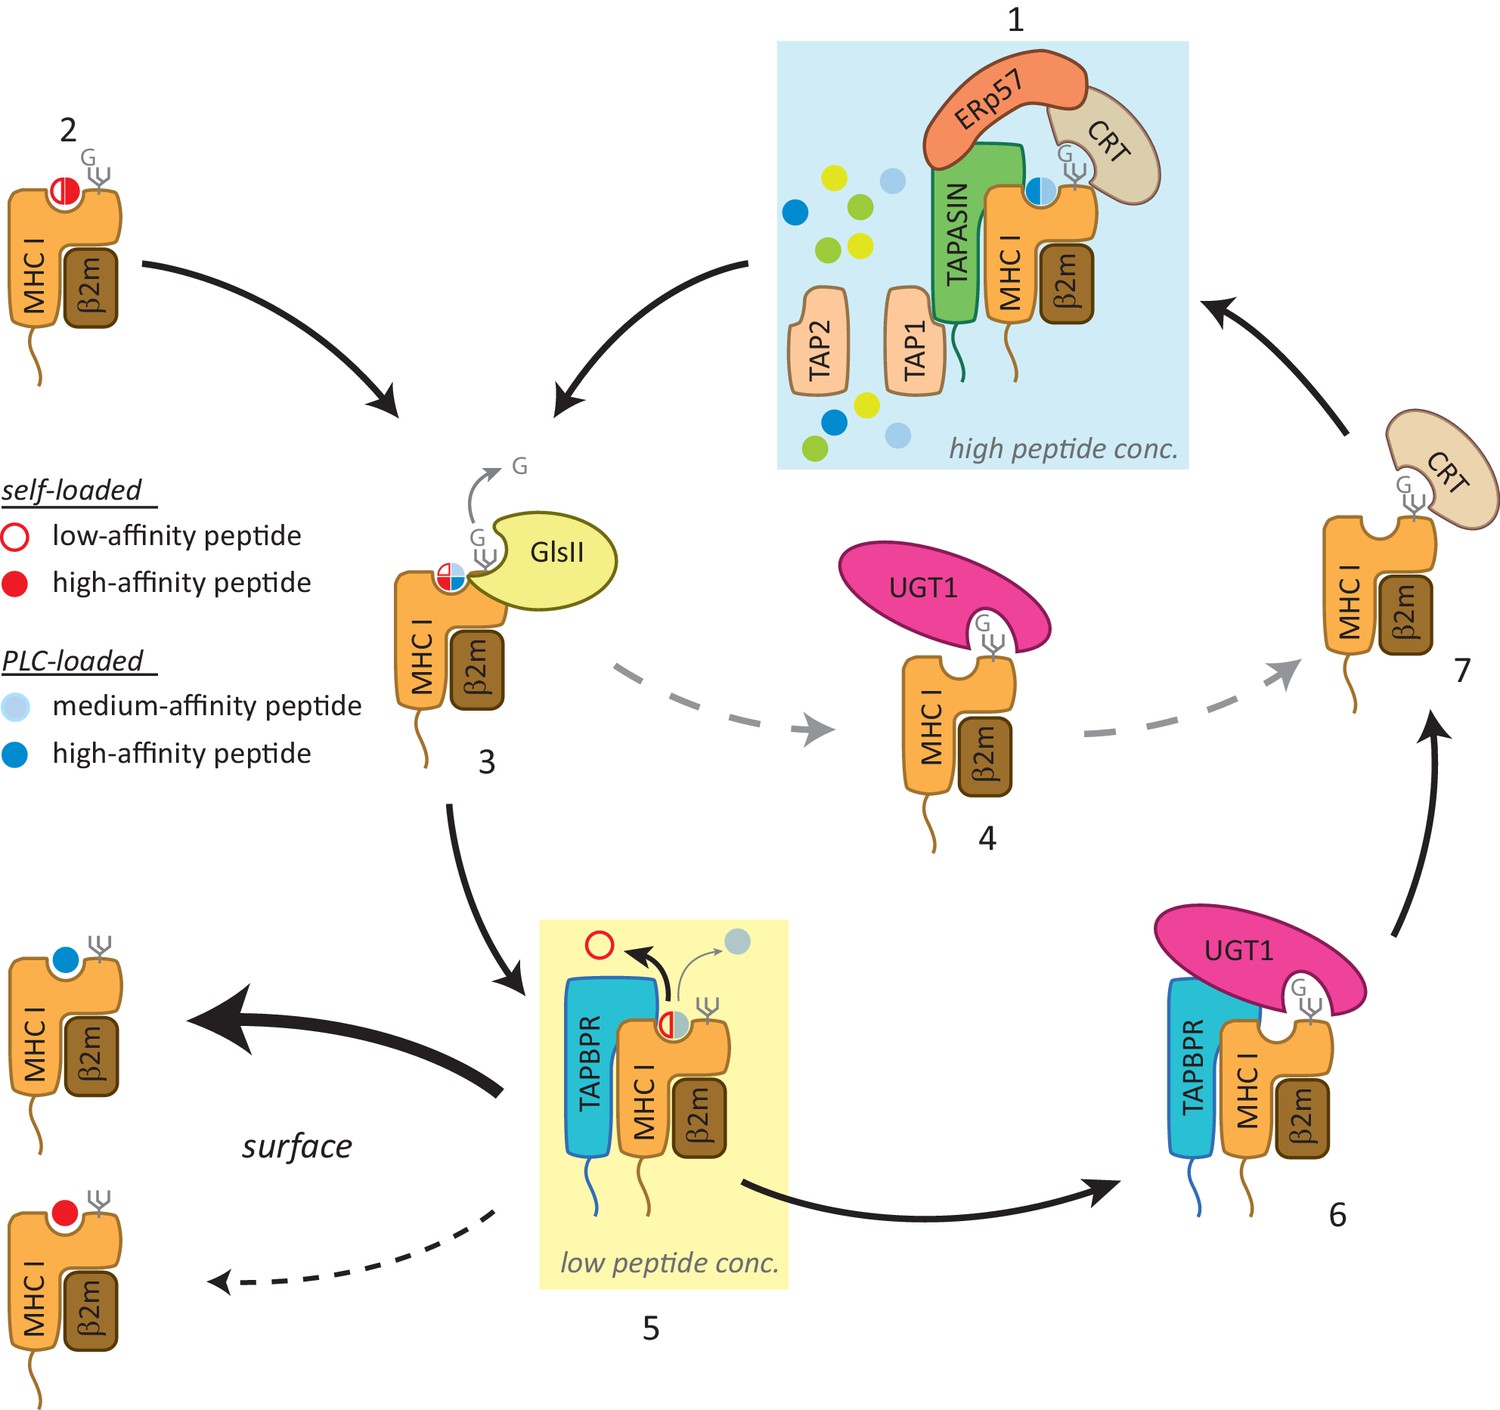
Working model of the TAPBPR:UDP-glucose:glycoprotein glucosyltransferase 1 complex in the MHC class I presentation pathway.
In addition to (1) the loading and editing of peptides (shown in blue) via tapasin in the peptide-rich milieu of the peptide-loading complex (PLC), an environment that favours MHC class I molecules associating with a broad range of optimal peptides, (2) some MHC class I molecules can also self-assemble with peptides with a wide range of affinities (shown in red) in the endoplasmic reticulum (ER) in a tapasin-independent manner. (3) Regardless of the folding state or affinity/source of the cargo occupying the peptide binding groove (reflected here as a quartered circle to signify a broad range of peptide affinity from various sources of loading), GlsII will mediate removal of the terminal glucose on the glycan in the absence of protection by calnexin/calreticulin. (4) Some conformations of MHC class I molecules will be recognised and reglucosylated by UGT1 in a TAPBPR-independent manner. (5) In order to be exported to the cell surface, MHC class I molecules need to pass through the TAPBPR-mediated quality control checkpoint. If a high-affinity peptide is bound to the MHC class I molecule, TAPBPR either does not bind to the MHC class I molecule or associates transiently and is quickly released, permitting the MHC class I molecule to proceed through the secretory pathway. If the MHC class I molecule is associated with a cargo of low or medium affinity, TAPBPR-mediated peptide editing occurs. In contrast to tapasin-mediated peptide editing in the PLC, this second TAPBPR-mediated editing step favours peptide dissociation either as a consequence of occurring in more peptide-restrictive areas of the ER, cis-Golgi, and medial Golgi or due to a distinct functionality of TAPBPR. (6) MHC class I molecules devoid of peptide are now recognised and reglucosylated by UGT1 associated with TAPBPR. (7) This modification on the N-linked glycan sends the MHC class I molecule back into the calnexin/calreticulin pathway, and consequently back to the PLC (1) for another attempt at peptide loading. In this scenario, TAPBPR may exhibit preferential binding to MHC class I molecules that associate with peptides in a tapasin-independent manner, as has been observed for many HLA-A allomorphs. GlsII: glucosidase II; UGT1: UDP-glucose:glycoprotein glucosyltransferase 1.
Tables
Table 1
Selected proteins identified in IgG-sepharose pulldowns on ZZ-TAPBPR
Affinity chromatography with IgG-sepharose was performed on HeLaM cells expressing a protein-A-tagged TAPBPR molecule (ZZ-TAPBPR) or HeLaM cells transduced with an empty vector (control). Immunoprecipitates were analysed by in gel tryptic digest followed by liquid chromatography-tandem mass spectrometry and data were processed using Scaffold. Identified proteins are shown with their exclusive unique peptide count, percentage coverage, and exclusive unique spectrum count as determined by Scaffold. Rank denotes the position when data are sorted by exclusive unique peptide count with all proteins present in the control removed. Pep: exclusive unique peptide count; Cov: percentage coverage; Count: exclusive unique spectrum count.
| Protein | Gene name | Control | ZZ-TAPBPR | Rank | ||
|---|---|---|---|---|---|---|
| Pep (Cov) | Count | Pep (Cov) | Count | |||
| Tapasin-related protein | TAPBPL | – | – | 8 (16) | 11 | 2 |
| HLA class 1, A-68 | HLA-A | – | – | 14 (35) | 21 | 1 |
| β-2-microglobulin | β2M | – | – | 1 (8.4) | 1 | 95 |
| UDP-glucose:glycoprotein glucosyltransferase 1 | UGGT1 | – | – | 10 (7.3) | 10 | 3 |
Table 2
Selected proteins identified in TAPBPR co-immunoprecipitates
TAPBPR was immunuoprecipitated using PeTe4 from IFN-γ-treated HeLaM-TAPBPRKO(HeLaMKO) cells reconstituted with either TAPBPRWT or TAPBPRC94A. Immunoprecipitates were analysed by in gel tryptic digest followed by liquid chromatography-tandem mass spectrometry and data were processed using Scaffold. Identified proteins are shown with their exclusive unique peptide count, total percentage coverage, and exclusive unique spectrum count as determined by Scaffold. Pep: exclusive unique peptide count; Cov: percentage coverage; Count: exclusive unique spectrum count.
| Protein | Gene name | TAPBPRWT | TAPBPRC94A | ||
|---|---|---|---|---|---|
| Pep (Cov) | Count | Pep (Cov) | Count | ||
| Tapasin-related protein | TAPBPL | 32 (43) | 54 | 29 (47) | 50 |
| HLA class 1, A-68 | HLA-A | 50 (64) | 88 | 41 (59) | 70 |
| β-2-microglobulin | β2M | 4 (46) | 7 | 1 (8.4) | 1 |
| UDP-glucose:glycoprotein glucosyltransferase 1 | UGGT1 | 19 (11) | 25 | – | – |
Table 3
Primer sequences used for the mutation of individual cysteine residues to alanine in TAPBPR
| Name | Primers used for site-directed mutagenesis | Predicted TAPBPR domain |
|---|---|---|
| C18A | 5'-CAGTGGACGTGGTCCTAGACGCTTTCCTGGTGAAGGACGGTG-3' 5'-CACCGTCCTTCACCAGGAAAGCGTCTAGGACCACGTCCACGT-3' | Unique N-terminal |
| C94A | 5'-GAGGCCTTGCTCCATGCTGACGCCAGTGGGAAGGAGGTGACCTG-3' 5'-CAGGTCACCTCCTTCCCACTGGCGTCAGCATGGAGCAAGGCCTC-3' | |
| C101A | 5'-CTGCAGTGGGAAGGAGGTGACCGCTGAGATCTCCCGCTACTTTCTC-3' 5'-GAGAAAGATGCGGGAGATCTCAGCGGTCACCTCCTTCCCACTGCAG-3' | |
| C191A | 5'-GGTCCTCAGCCTCCTTGGACGCTGGCTTCTCCATGGCACCGG-3' 5'-CCGGTGCCATGGAGAAGCCAGCGTCCAAGGAGGCTGAGGACC-3' | IgV domain |
| C262A | 5'-CAGGACGAGGGGACCTACATTGCCCAGATCACCACCTCTCTGTAC-3' 5'-GTACAGAGAGGTGGTGATCTGGGCAATGTAGGTCCCCTCGTCCTG-3' | |
| C300A | 5'-GCTCTGCTGCCCACCCTCATCGCCGACATTGCTGGCTATTACC-3' 5'-GGTAATAGCCAGCAATGTCGGCGATGAGGGTGGGCAGCAGAGC-3' | IgC domain |
| C361A | 5'-CTGCAGGTGCAACTTACACCGCCCAGGTCACACACATCTCTC-3' 5'-GAGAGATGTGTGTGACCTGGGCGGTGTAAGTGGCACCTGCAG-3' | |
| C427A | 5'-GAACGCTGGGAGACCACTTCCGCTGCTGACACACAGAGCTCCC-3' 5'-GGGAGCTCTGTGTGTCAGCAGCGGAAGTGGTCTCCCAGCGTTC-3' | Cytoplasmic tail |
Additional files
-
Supplementary file 1
Primers used to generated TAPBPRUBS1- and TAPBPRUBS2-variant molecules
To create the UDP-glucose:glycoprotein glucosyltransferase 1 binding site mutants, site-directed mutagenesis was performed on untagged TAPBPR in pCR-Blunt II-TOPO using Quik-Change site-directed mutagenesis (Stratagene) together with the primers specified in this table. The resultant TAPBPRUBS1 (I83K and E87K) and TAPBPRUBS2 (E87K, L90K, H91S, and D93R) variants were subsequently cloned into pHRSIN-C56W-UbEM and transduced into HeLaM cells.
- https://doi.org/10.7554/eLife.23049.023
-
Source code 1
A MATLAB script was developed and applied in order to calculate the densities of the HLA-A68 and -B15 bands bound to tapasin in Pasta1 immunoprecipitation experiments.
The maximum peak corresponding to B15 was aligned relative to that of the wild-type (WT) track because the separation of B15 and A68 is most distinctive. The separation point between B15 and A68 was identified in the WT track as the minimum between the two peaks. This distance between the B15 peak and the B15/A68 separation point as found in WT was calculated and applied to the alignment positions on the knockout and C94A tracks in order to separate B15 and A68 in these two tracks. Areas under the respective curves generated the densities of the corresponding MHC class I molecules.
- https://doi.org/10.7554/eLife.23049.024
Download links
A two-part list of links to download the article, or parts of the article, in various formats.
Downloads (link to download the article as PDF)
Open citations (links to open the citations from this article in various online reference manager services)
Cite this article (links to download the citations from this article in formats compatible with various reference manager tools)
TAPBPR bridges UDP-glucose:glycoprotein glucosyltransferase 1 onto MHC class I to provide quality control in the antigen presentation pathway
eLife 6:e23049.
https://doi.org/10.7554/eLife.23049


