Multiplex image-based autophagy RNAi screening identifies SMCR8 as ULK1 kinase activity and gene expression regulator
- Institute of Biochemistry II, Goethe University School of Medicine, Germany
- Goethe University, Germany
- PerkinElmer, Inc., Germany
- School of Medicine, University of Split, Croatia
- German Cancer Consortium, Germany
- German Cancer Research Center, Germany
- Ludwig-Maximilians-University Munich, Germany
Figures
Figure 1 with 1 supplement

RNAi screen using endogenous autophagy markers identifies novel autophagy regulators among Rab GTPases and their regulators.
(A) Parallel multiplex autophagosome monitoring. U2OS cells transfected for 72 hr with non-targeting control (sicon) or siRNA targeting known autophagy regulators, namely Raptor and RAB7A as positive controls and ATG12 and PIK3C3 as negative controls, were fixed and immunolabeled with anti-WIPI2, anti-ATG12, anti-LC3B, anti-GABARAP or anti-STX17 antibodies. Nuclei were counterstained with DRAQ5. Scale bars, 40 µm. (B) Automated quantification of number of spots and integrated spot signal (ISS) of at least 1000 cells per condition from images in (A). Error bars represent SEM. Significance was determined using one-way ANOVA compared with sicon. All experiments were performed n = 3. Calculated z’-factors are indicated for each antibody and for both spot parameters. (C) Overview of the screening strategy. Candidates that increase (arrow pointing up) or decrease (arrow pointing down) spot numbers and ISS in the primary and deconvolution screen are indicated. See Figure 1—source data 1 and Figure 1—source data 2 for complete results. (D) Correlation of number of LC3B-positive spots (normalized to sicon) from two biological replicates of the primary screen monitoring 186 siRNA pools for immunolabeled LC3B. R2, Pearson’s correlation coefficient. (E) Correlation of number of spots across all five autophagy markers (normalized to sicon) between pooled and individual siRNAs of candidates assayed in the deconvolution screen. R2, Pearson’s correlation coefficient.
-
Figure 1—source data 1
Primary image-based RNAi screen of 186 genes.
- https://doi.org/10.7554/eLife.23063.003
-
Figure 1—source data 2
Deconvolution image-based RNAi screen of 71 genes.
- https://doi.org/10.7554/eLife.23063.004
Figure 1—figure supplement 1
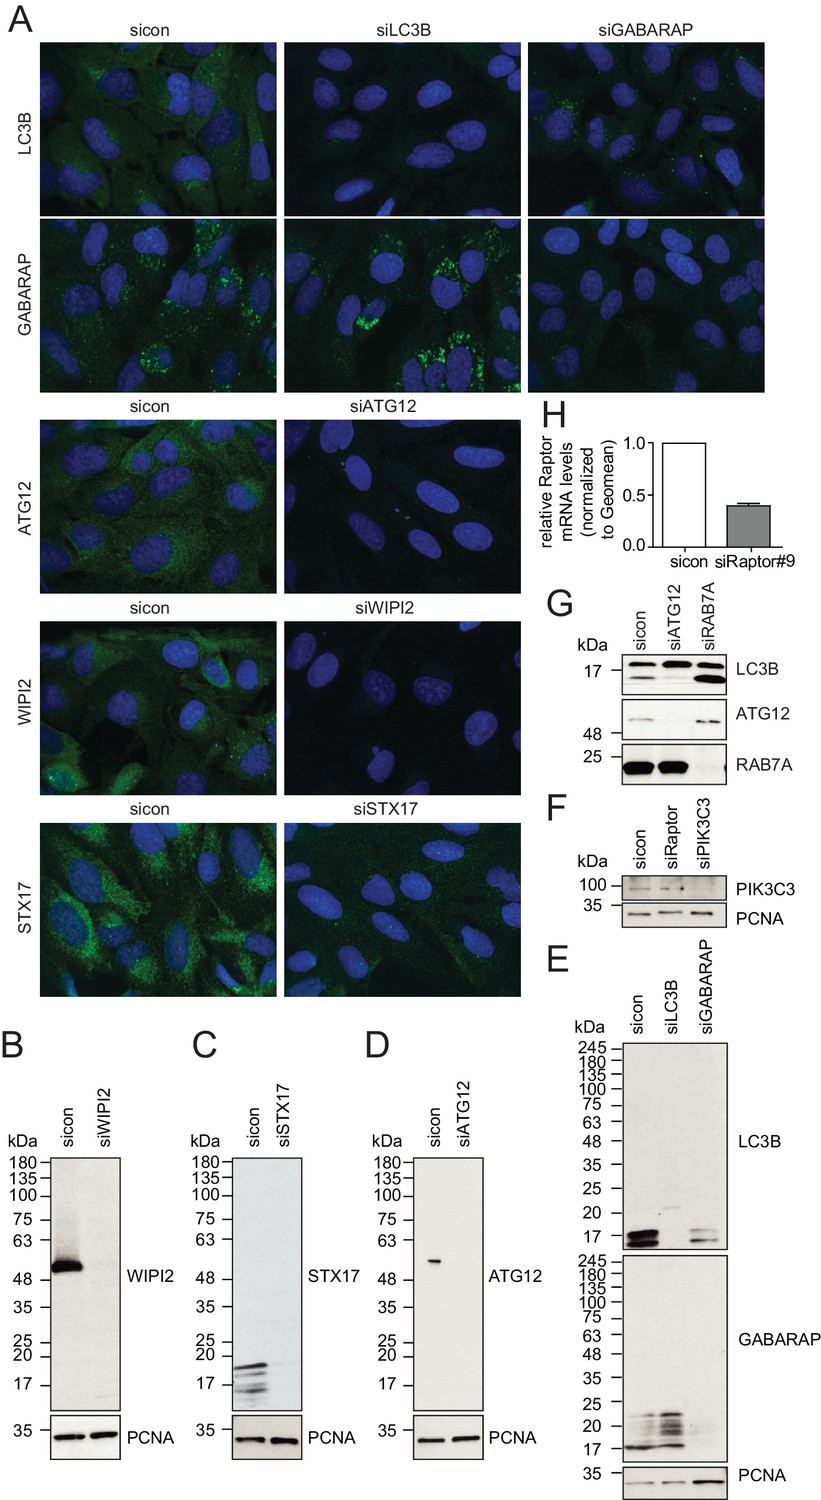
Evaluation of antibody specificity of early and late autophagosome markers.
(A–H) U2OS cells transfected with indicated siRNAs for 72 hr were either fixed and immunolabeled with anti-WIPI2, anti-ATG12, anti-LC3B, anti-GABARAP or anti-STX17 antibodies (A), lysed and analyzed by SDS-PAGE and immunoblotting with indicated antibodies (B–G) or subjected to RNA isolation and reverse cDNA transcription followed by RT-qPCR with specific primers for Raptor (H).
Figure 2 with 4 supplements
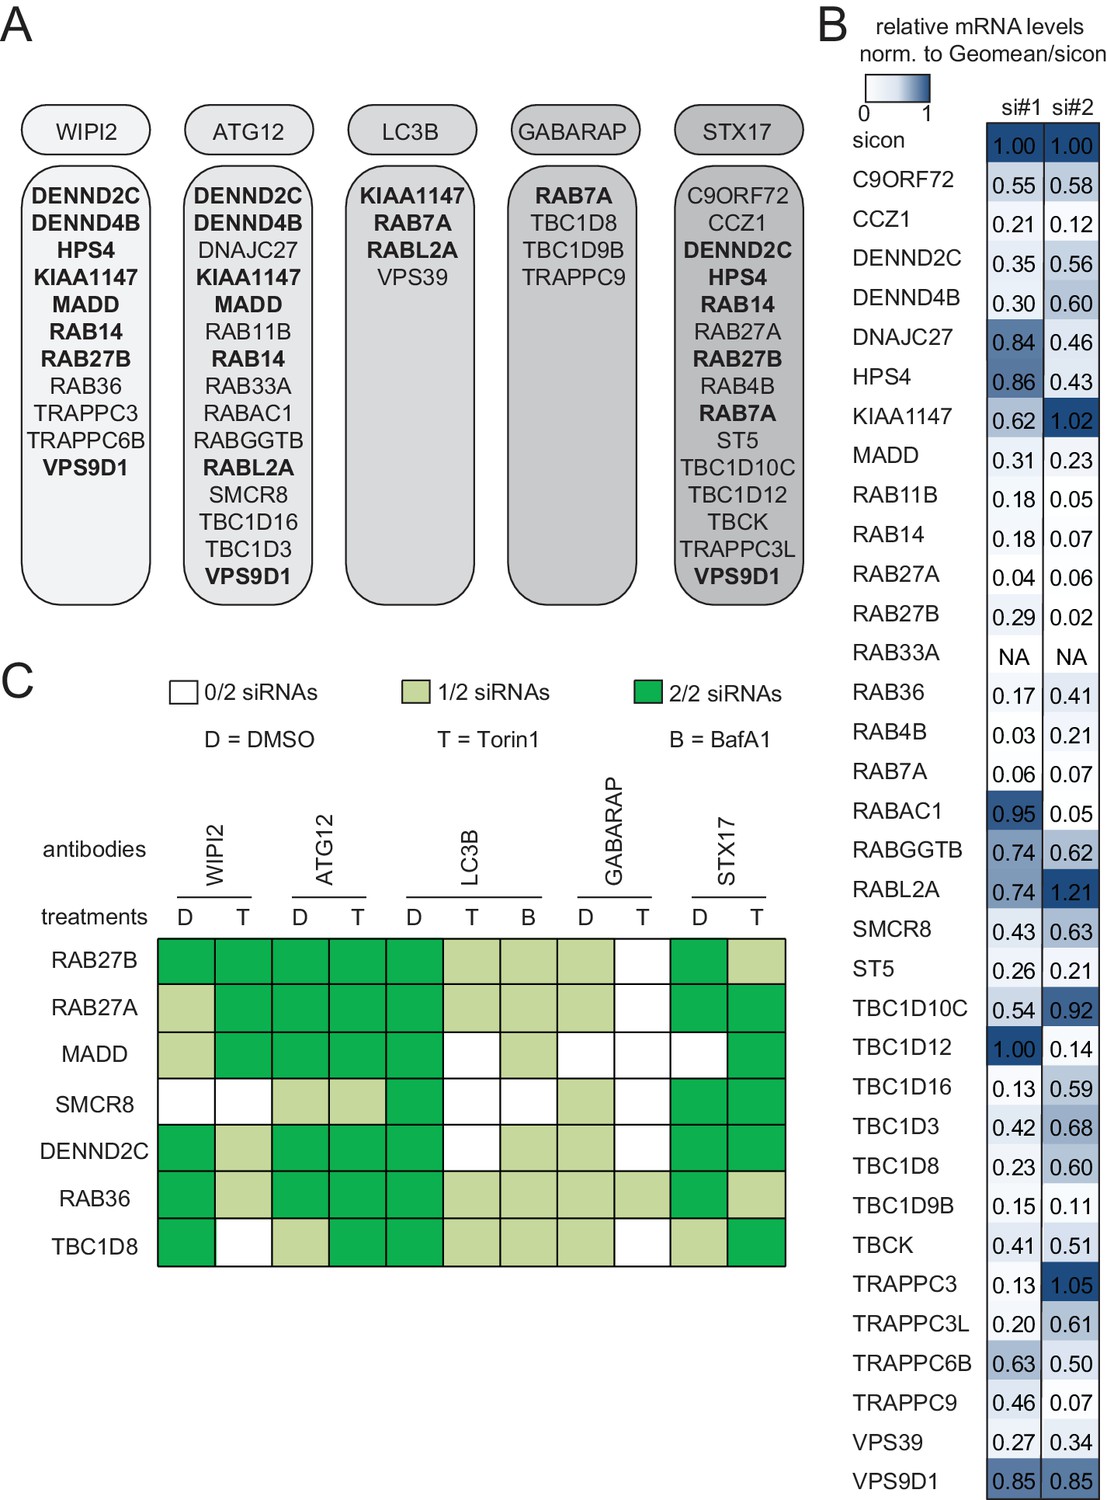
Knockdown efficiency and treatment response of validated candidates.
(A) Overview of the validated candidates from the siRNA screen for each autophagy marker. Candidates that scored with more than one marker are indicated in bold. (B) Heatmap representation showing knockdown efficiency of two siRNAs for each of the 34 validated candidates that passed deconvolution. U2OS cells transfected with non-targeting control (sicon) or siRNAs targeting indicated candidates for 72 hr were harvested and subjected to mRNA isolation, reverse cDNA transcription and RT-qPCR with primers specific for the respective candidate gene. Relative mRNA levels were normalized to sicon. NA = Not analyzed. See Figure 2—figure supplement 1 for complete results as well as Supplementary file 1 and Supplementary file 2 for siRNA and primer sequences. (C) Heatmap representation showing significant increase in WIPI2-, ATG12-, LC3B-, GABARAP- and STX17-positive spot numbers upon depletion of indicated candidates with one (light green) or two (dark green) oligos out of two siRNAs from (B). U2OS cells were transfected with non-targeting control (sicon) or siRNAs targeting indicated candidates for 72 hr and grown for 1 or 2 hr in the absence (D = DMSO) or presence of 250 nM Torin1 (T) or 100 nM BafilomycinA1 (BafA1, B), respectively. Following fixation cells were labeled with anti-WIPI2, anti-ATG12, anti-LC3B, anti-GABARAP or anti-STX17 antibodies and subjected to confocal microscopy. Number of spots were automatically quantified for at least 1000 cells per condition and normalized to sicon. See Figure 2—figure supplement 2 for example images as well as Figure 2—figure supplement 3 for complete results and statistics.
Figure 2—figure supplement 1
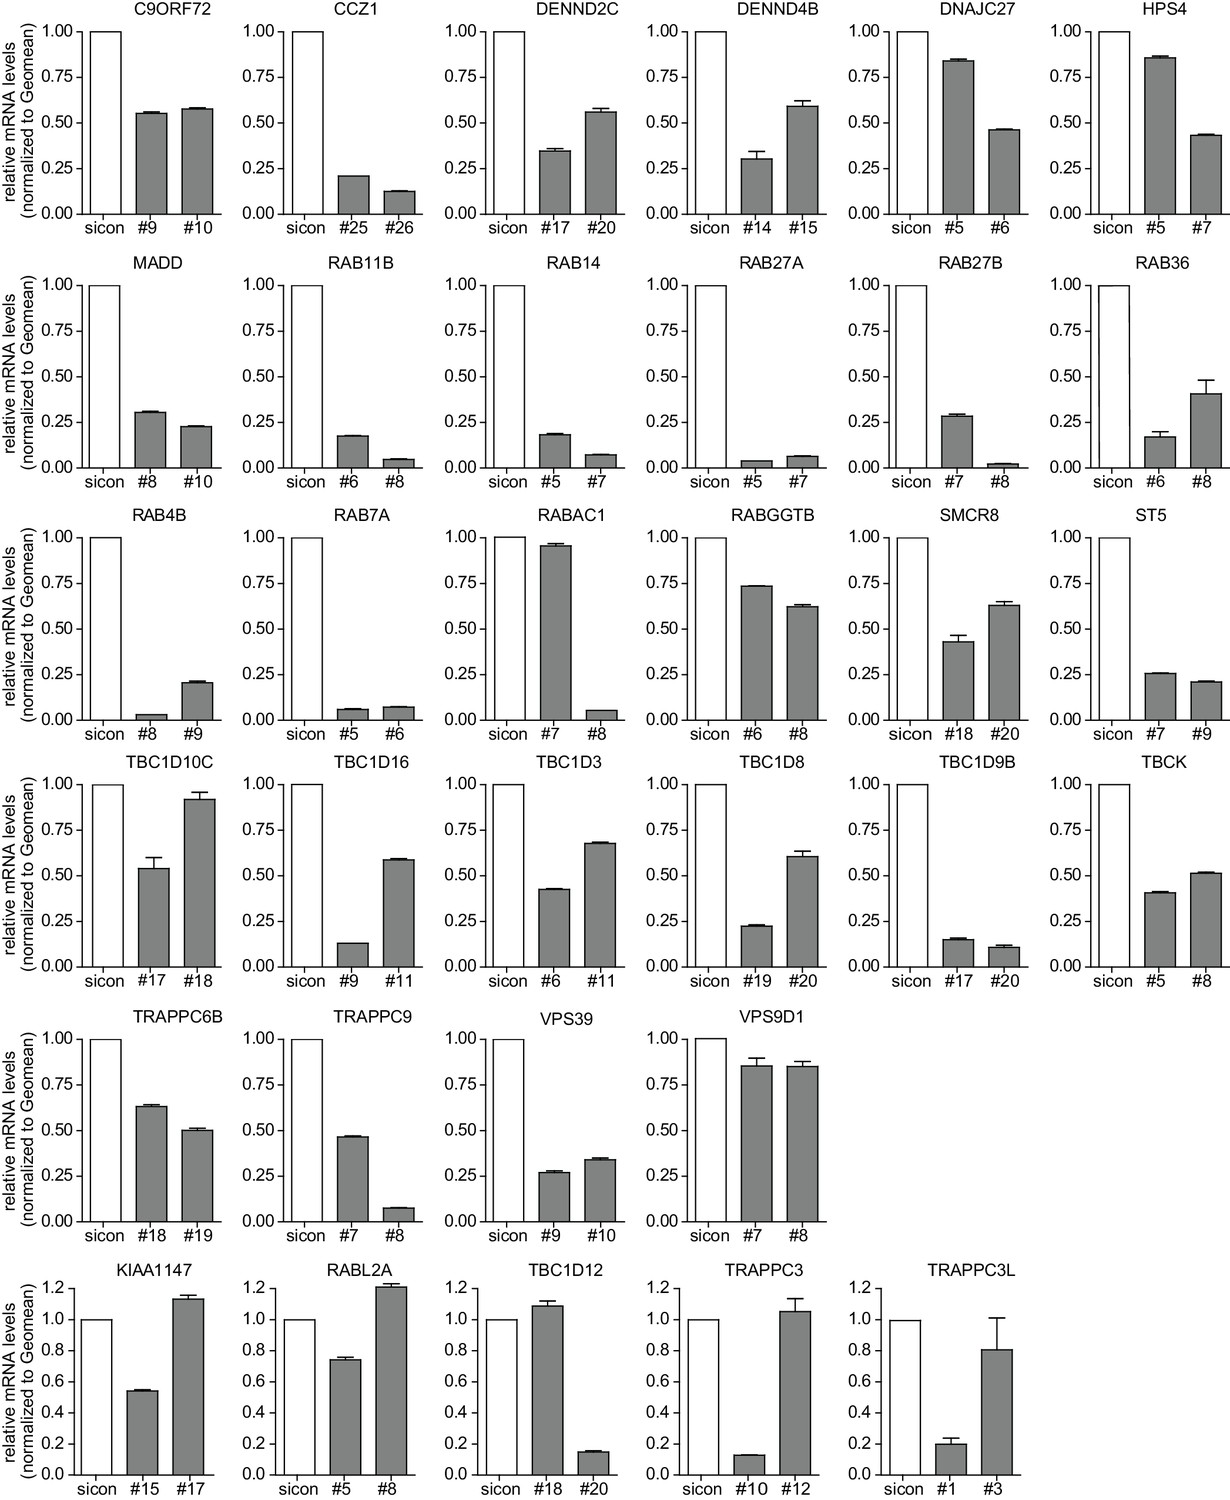
Evaluation of knockdown efficiencies of deconvoluted candidates.
U2OS cells were transfected with indicated siRNAs for 72 hr followed by RNA isolation, cDNA preparation and RT-qPCR with specific primers for 33 candidates that were assayed in the deconvolution screen. Error bars represent standard deviation of quadruplicates. RAB33A was not included since we could not obtain specific qPCR primers.
Figure 2—figure supplement 2
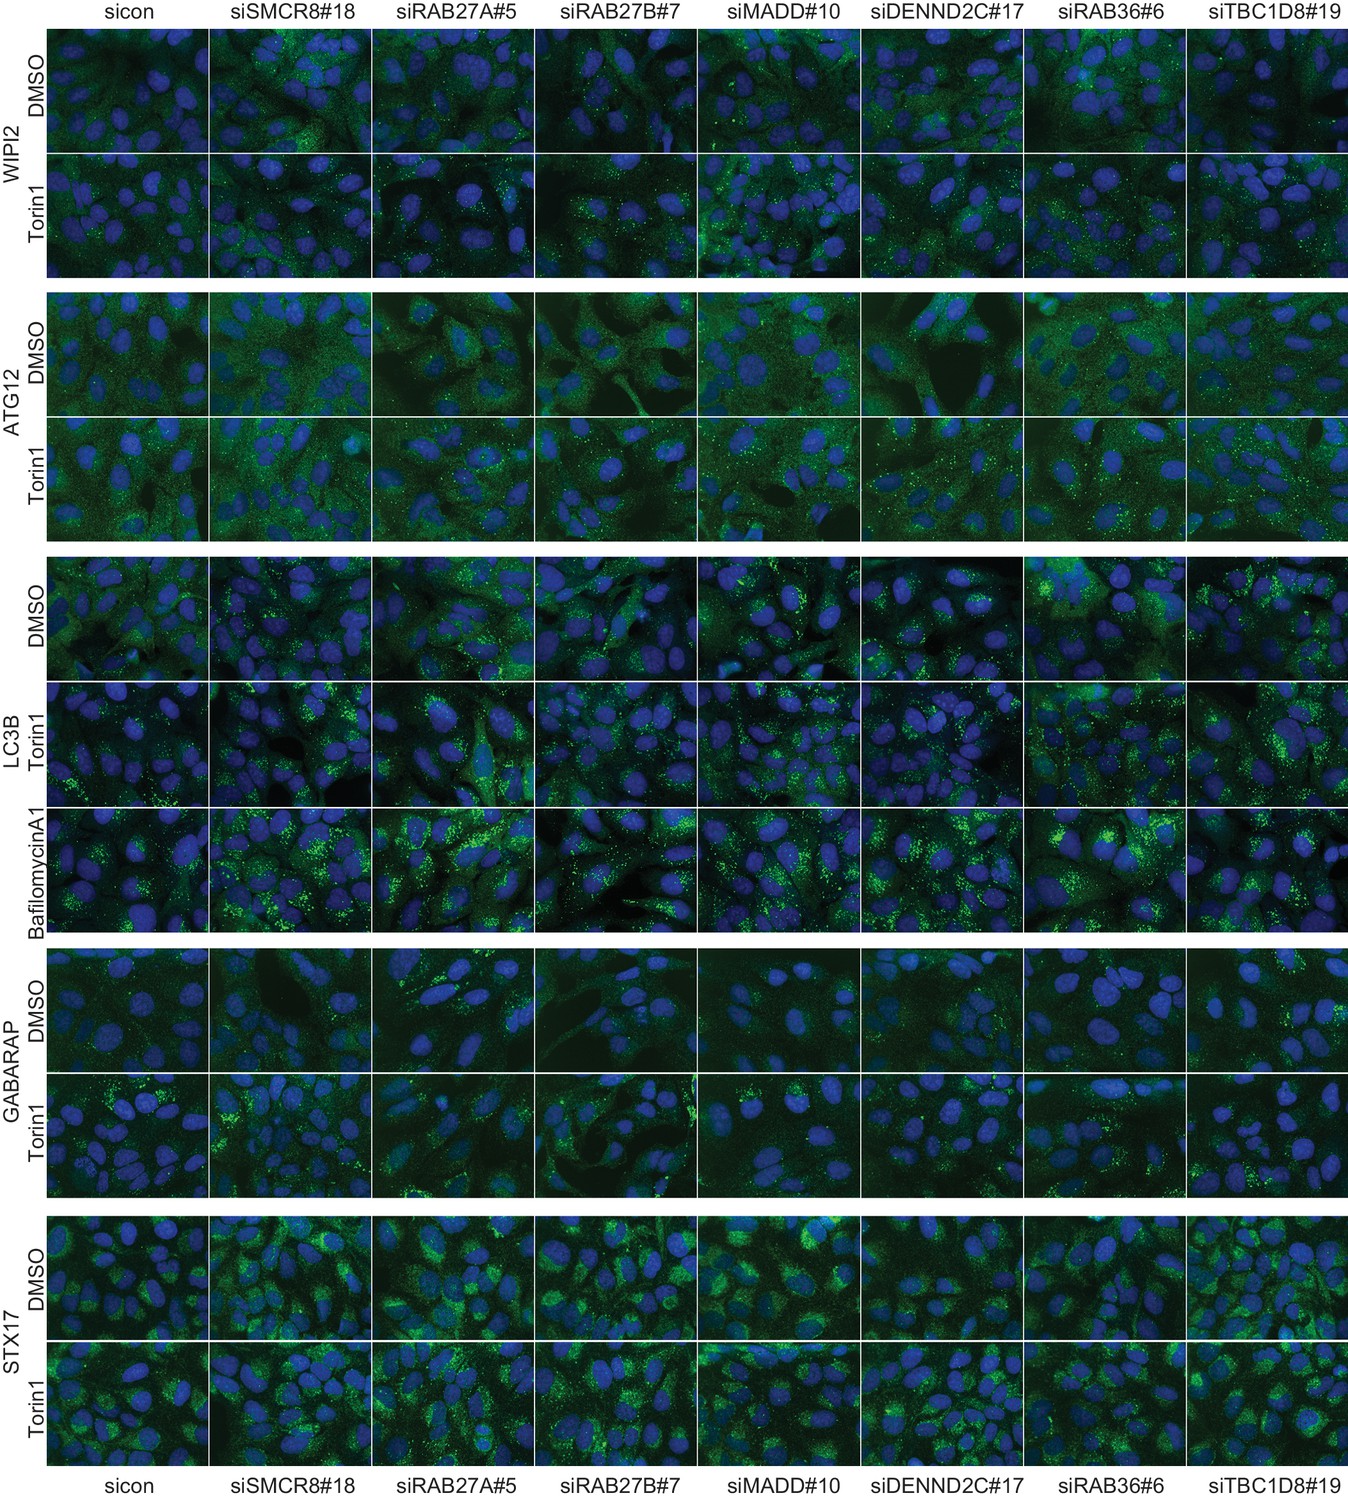
Qualitative analysis of selected validated candidates upon autophagy stimulation.
U2OS cells were transfected with indicated siRNAs for 72 hr and then grown in the absence (DMSO) or presence of 250 nM Torin1 for 1 hr or 100 nM BafA1 for 2 hr followed by fixation and immunolabeling with anti-WIPI2, anti-ATG12, anti-LC3B, anti-GABARAP or anti-STX17 antibodies. Nuclei were counterstained with DRAQ5.
Figure 2—figure supplement 3
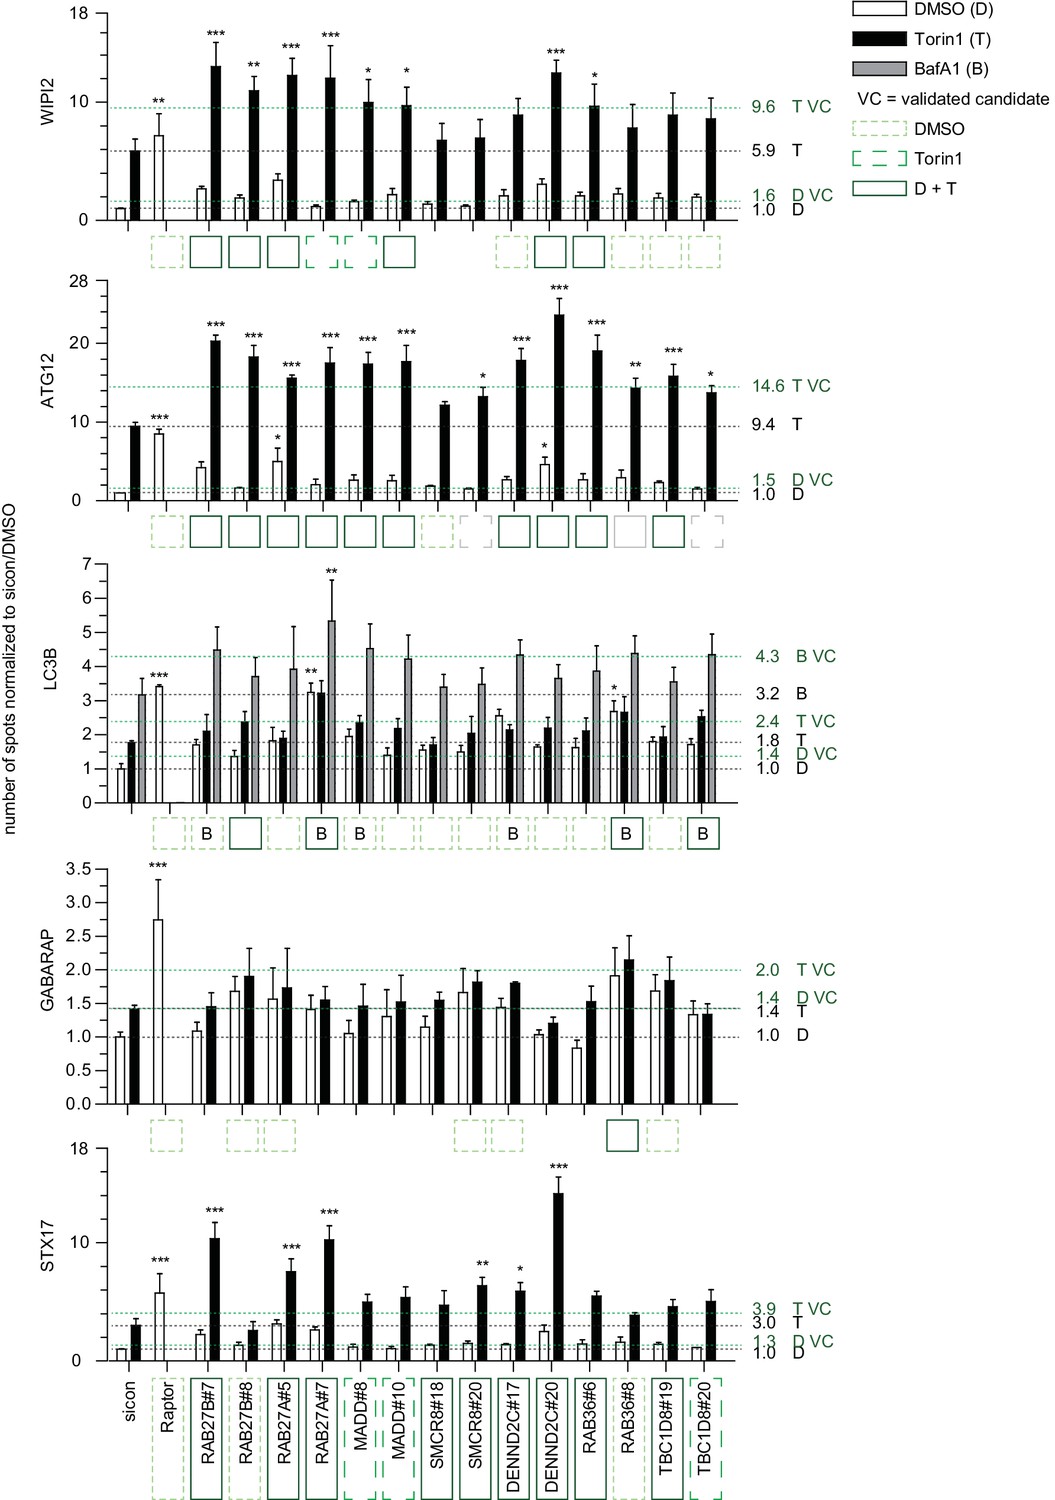
Quantitative analysis of selected validated candidates upon autophagy stimulation.
Number of spots for at least 1000 cells in images as shown in Figure 2—figure supplement 2 was determined using automated quantification software and normalized to sicon in untreated (DMSO) condition. Error bars represent SEM. Significance was determined using two-way ANOVA compared with sicon. All experiments were performed n = 3. Scoring candidate siRNAs for either BafA1 (B), DMSO (dashed line, light green), or Torin1 (long dashed line, green) alone, or both DMSO and Torin1 (solid line, dark green) were selected by applying the standard deviation criteria used in the screening approach. siRNAs marked with grey boxes did not fulfill the standard deviation criteria but were still considered as candidates since increase in number of spots was statistically significant. VC = validated candidate.
Figure 2—figure supplement 4
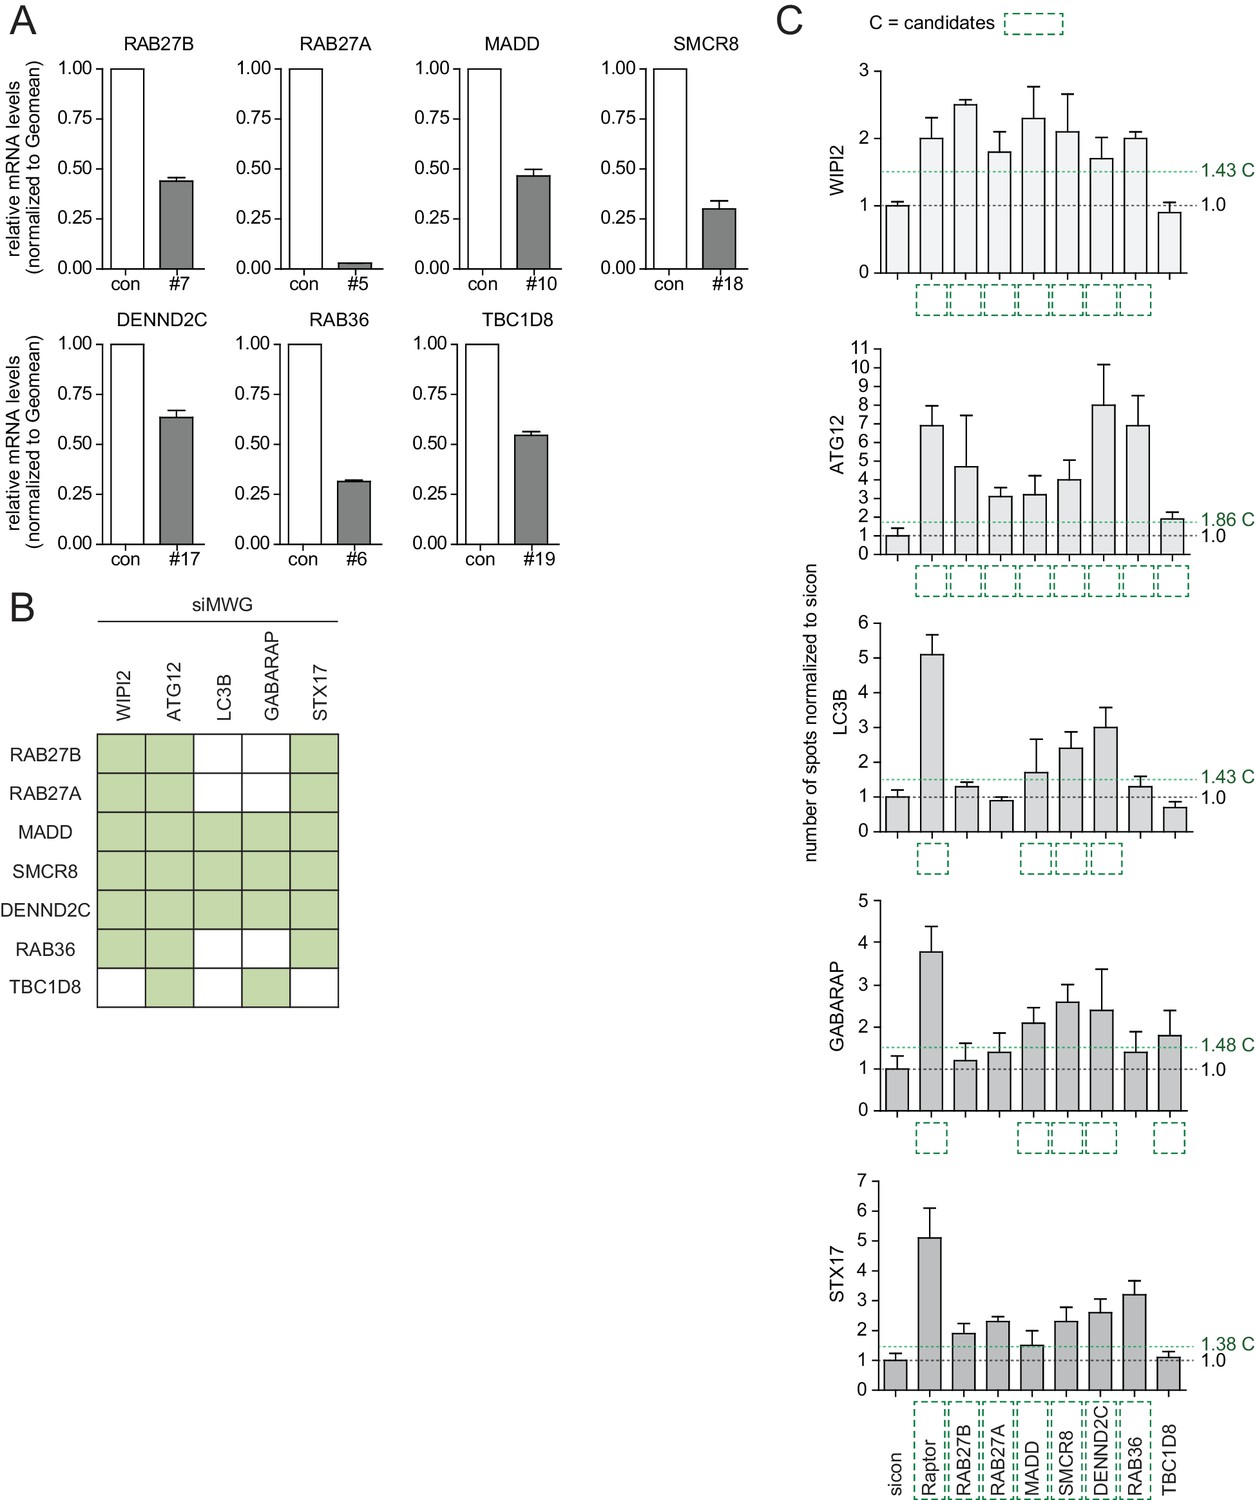
Phenotype and knockdown evaluation of selected validated candidates by alternative siRNA oligos.
(A–C) U2OS cells were transfected with indicated siRNAs for 72 hr followed by RNA isolation, cDNA preparation and RT-qPCR with gene specific primers (A) or subjected to fixation and immunolabeling with anti-WIPI2, anti-ATG12, anti-LC3B, anti-GABARAP or anti-STX17 antibodies (B,C). Nuclei were counterstained with DRAQ5. Number of spots for at least 1000 cells was determined using automated quantification software, normalized to sicon and represented as graphs (C) or heatmap (B). Error bars represent standard deviation of quadruplicates. Candidates (C) are marked by a green dashed line.
Figure 3 with 2 supplements
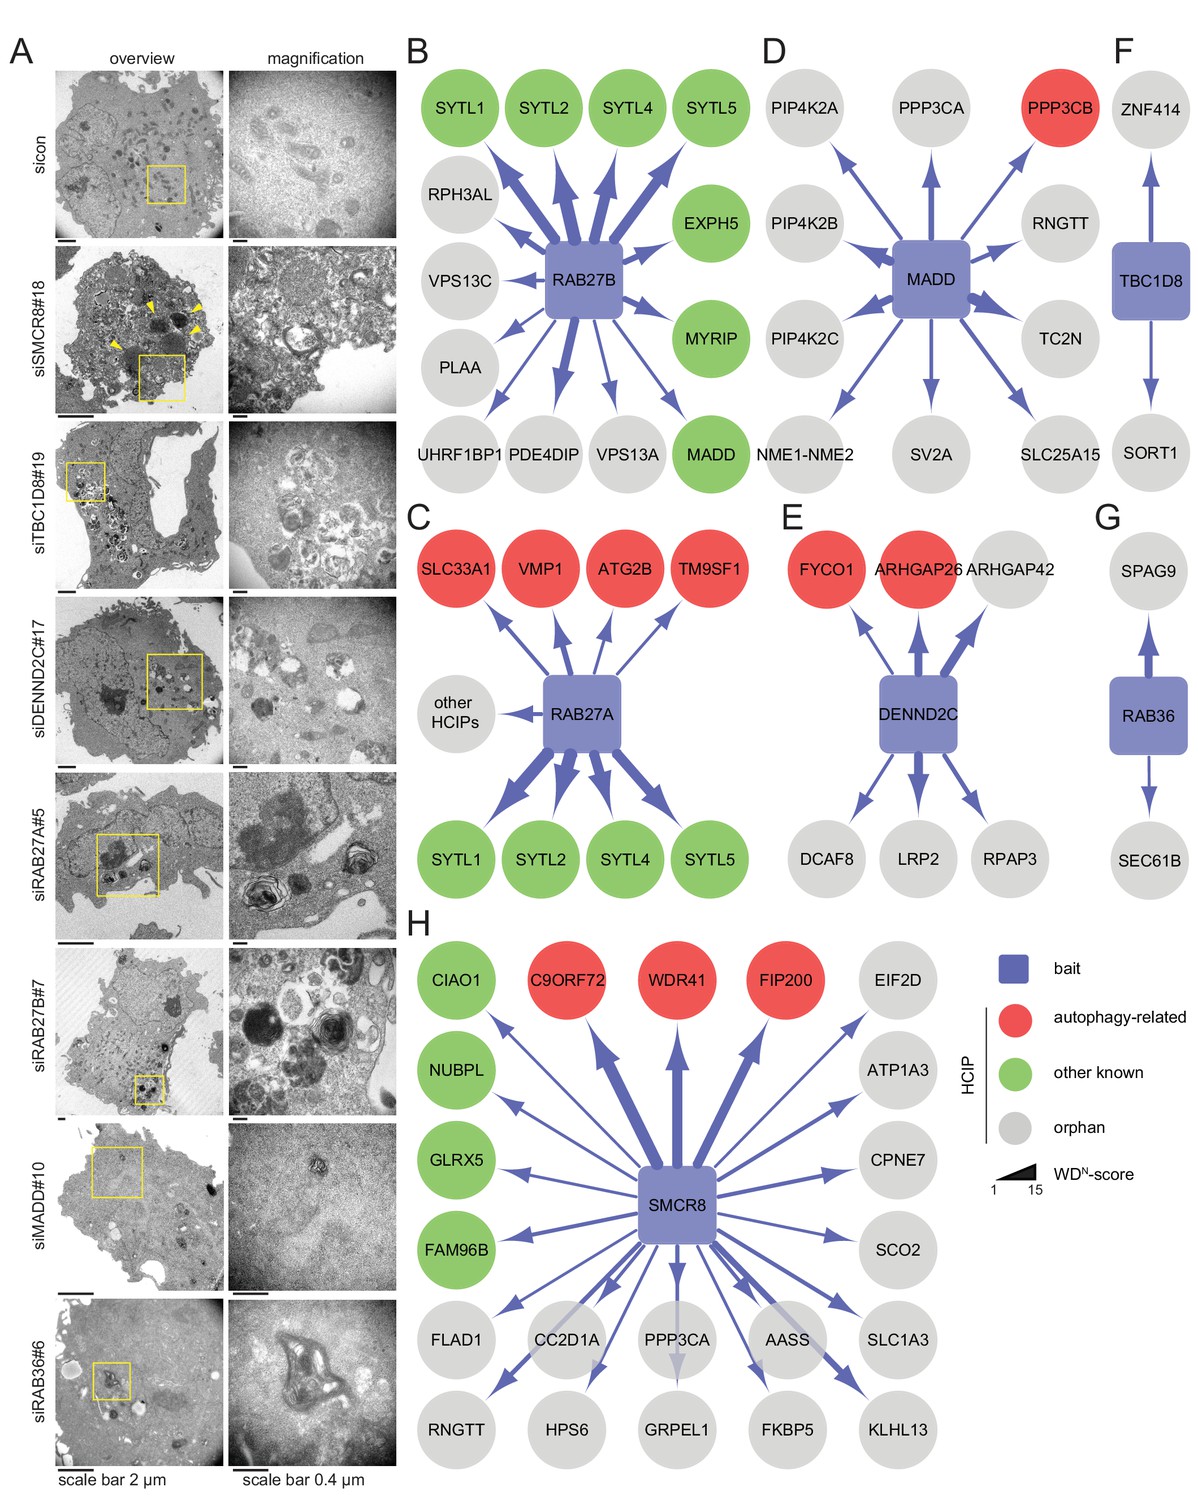
Ultrastructural analysis and interaction proteomics of selected validated candidates.
(A) U2OS cells transfected with indicated siRNAs for 72 hr were harvested and subjected to sample preparation for electron microscopy followed by image acquisition. Scale bars, 2 and 0.4 µm as indicated. Arrowheads indicate homogeneously electron-dense vesicles. (B–H) Lysates of 293T-REx cells inducibly expressing indicated HA-tagged bait proteins (RAB27B (B), RAB27A (C), MADD (D), DENND2C (E), TBC1D8 (F), RAB36 (G) and SMCR8 (H)) were subjected to HA-IP, followed by trypsin digestion and mass spectrometric analysis. Individual interaction networks of indicated bait proteins with high-confidence candidate interacting proteins (HCIPs; average APSM of ≥2 and WDN score of ≥1) are color-coded according to autophagy-related (red), other known (green) and orphan (grey) association partners. Line thickness indicates interactions with WDN scores between 1 and 15. See Figure 3—figure supplement 2 and Figure 3—source data 1 for complete proteomic data.
-
Figure 3—source data 1
Complete interaction proteomics of 7 bait proteins.
- https://doi.org/10.7554/eLife.23063.012
Figure 3—figure supplement 1
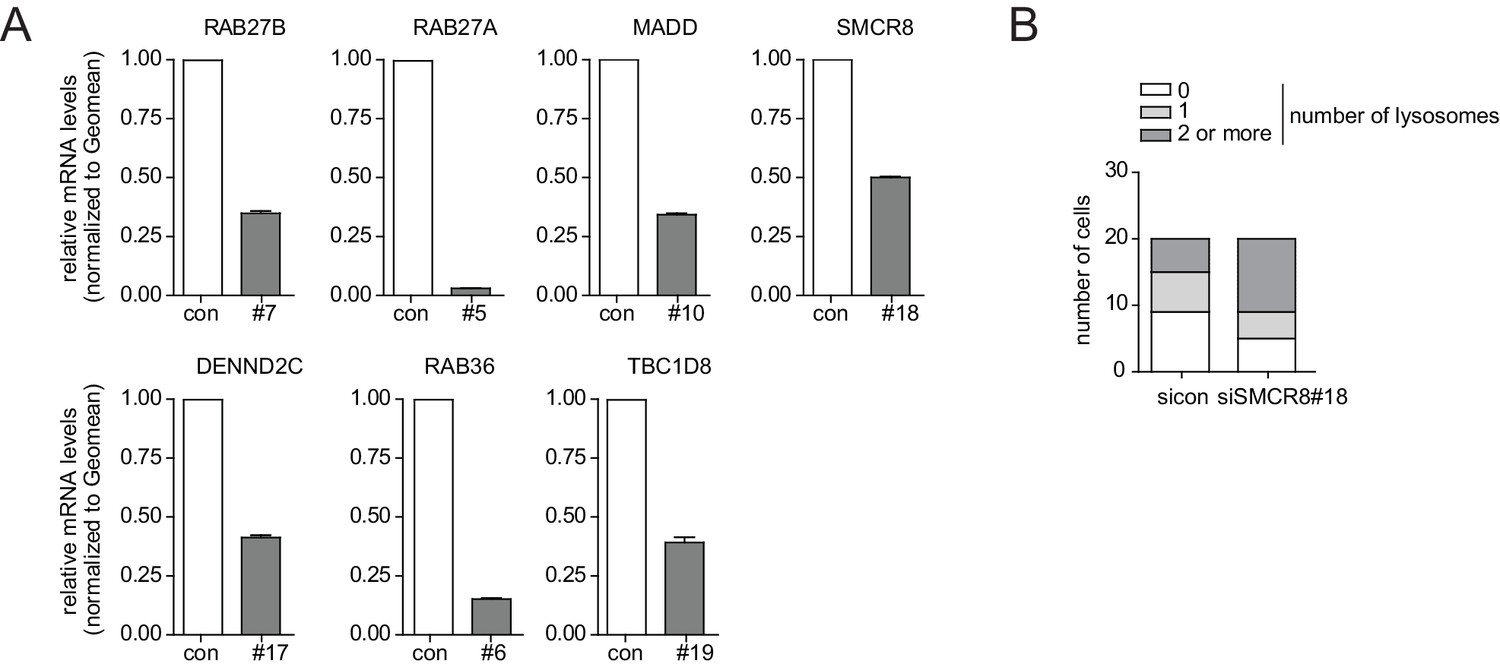
Phenotype and knockdown evaluation of selected validated candidates by alternative siRNA oligos for EM.
(A) U2OS cells were transfected with indicated siRNAs for 72 hr followed by RNA isolation, cDNA preparation and RT-qPCR with gene specific primers and in parallel samples were processed for electron microscopy analysis (Figure 3A). Error bars represent standard deviation of quadruplicates. (B) U2OS cells transfected with non-targeting control (sicon) or SMCR8 siRNA for 72 hr were harvested and subjected to sample preparation for electron microscopy followed by image acquisition (Figure 3A). Number of electron-dense vesicles (lysosomes) was counted for 20 cells per condition.
Figure 3—figure supplement 2
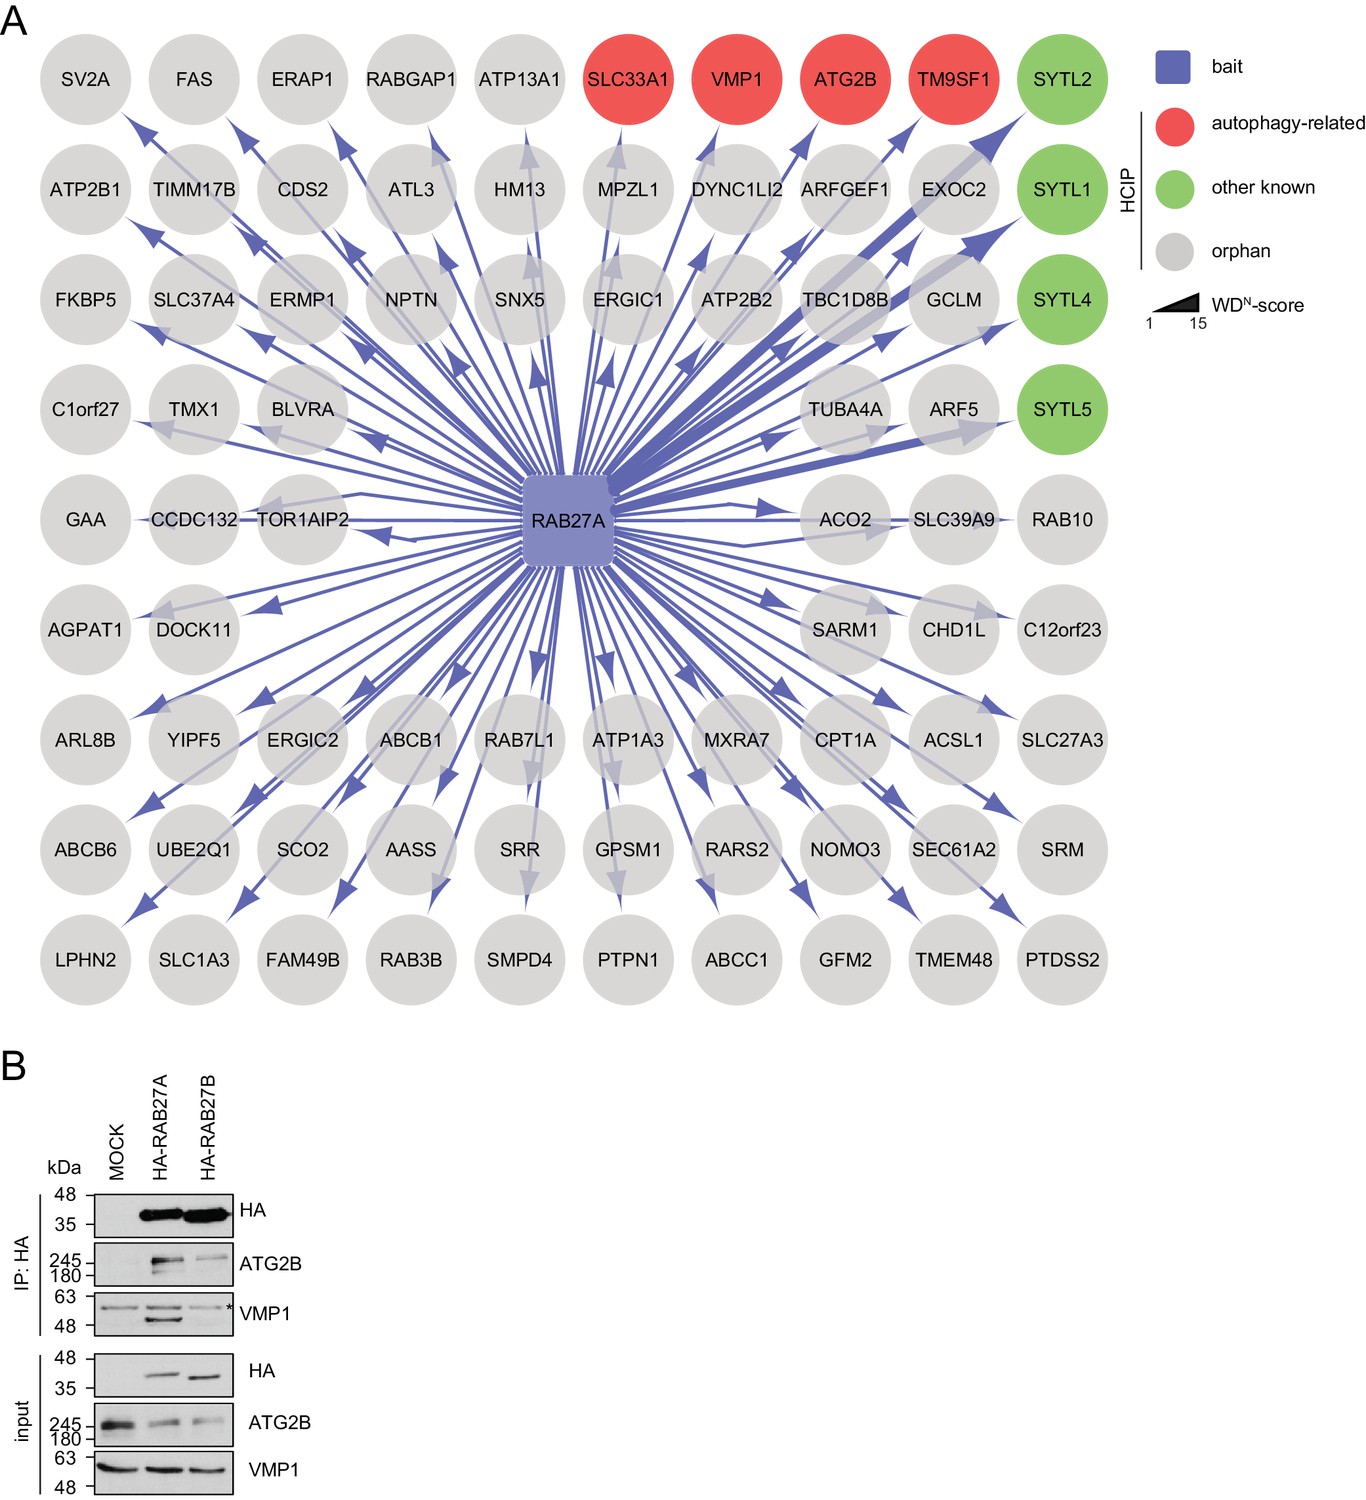
Interaction network of RAB27A reveals interaction with ATG2B and VMP1.
(A) Complete network of high-confident candidate interacting proteins (HCIPs) obtained by IP-MS analysis of RAB27A. See Figure 3—source data 1 for complete proteomic data. (B) Lysates from empty 293T-REx cells (MOCK) or from those inducibly expressing HA-tagged RAB27A or RAB27B were subjected to HA-IP followed by SDS-PAGE and immunoblotting with indicated antibodies. * Heavy chain.
Figure 4
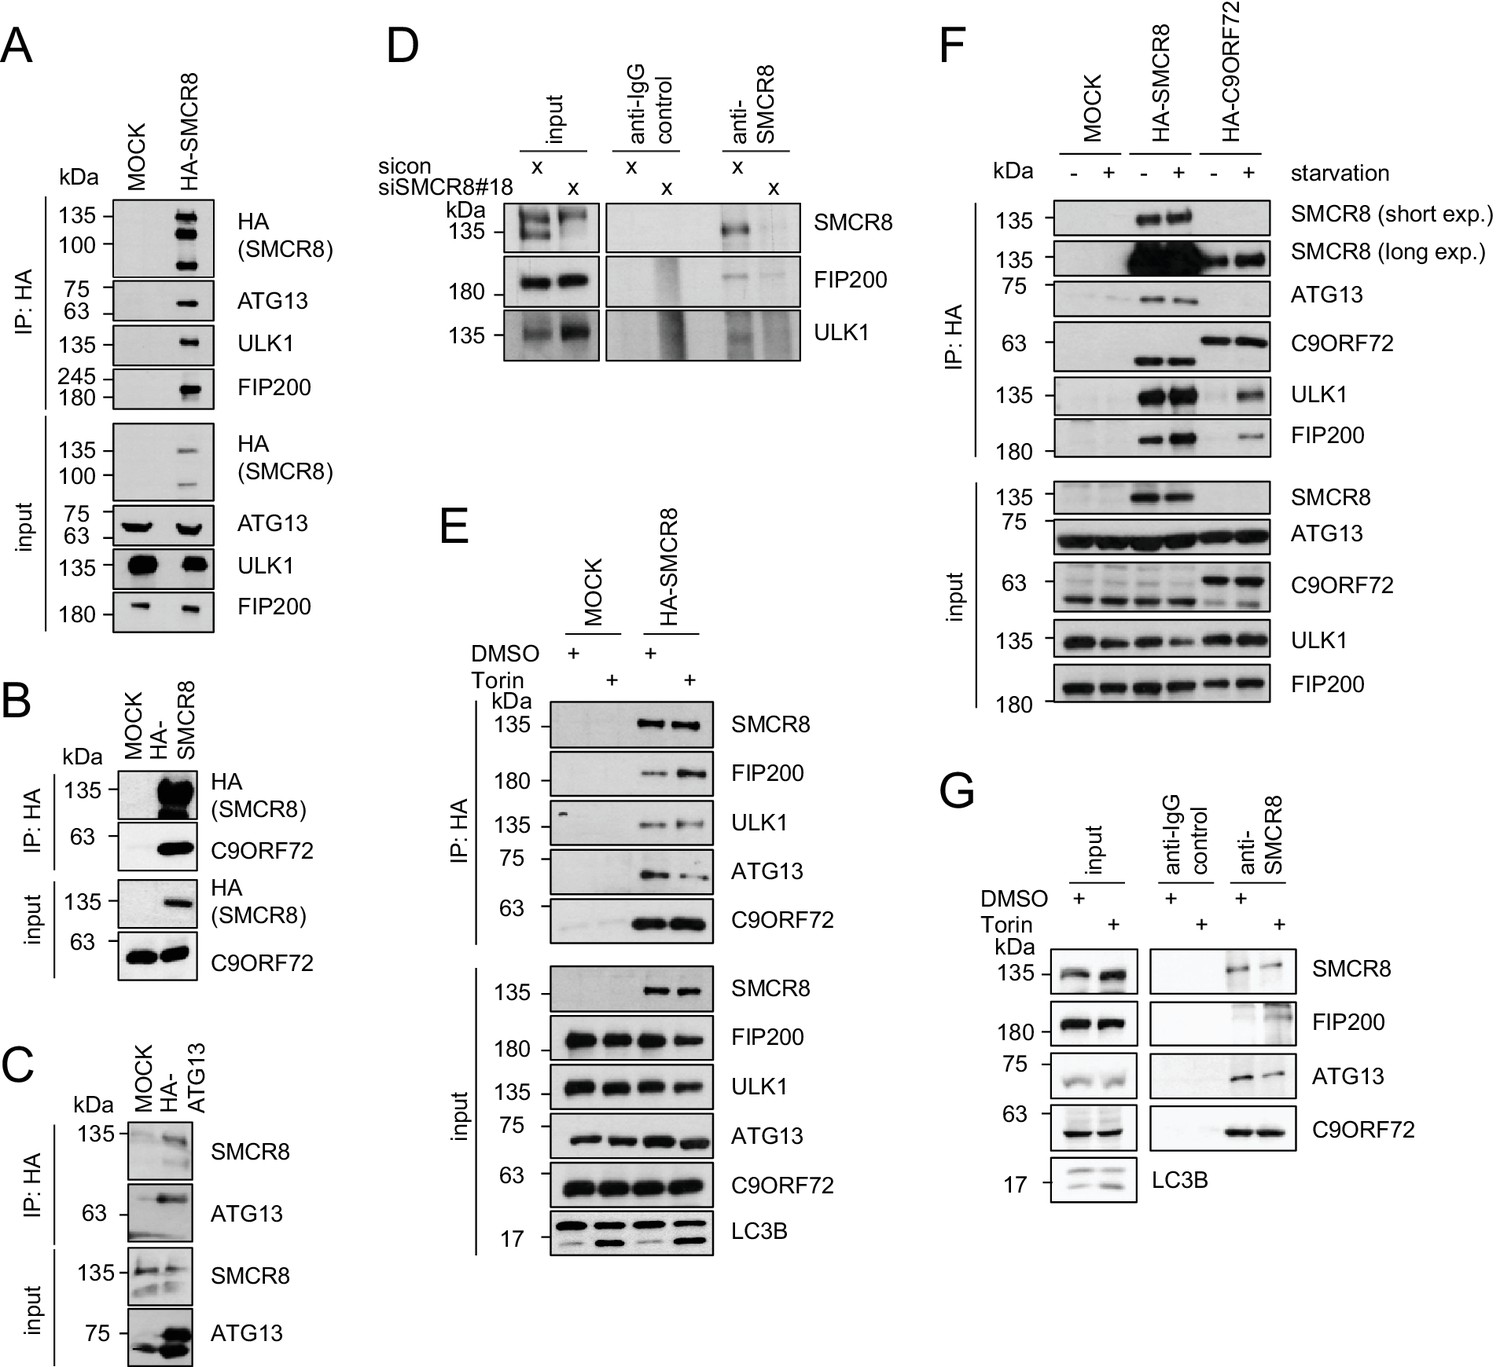
SMCR8 associates with ULK1 complex components and C9ORF72.
(A–C) Empty 293T-REx cells (MOCK) or those inducibly expressing HA-tagged SMCR8 (A,B) or ATG13 (C) were lysed and subjected to HA-IP, followed by SDS-PAGE and immunoblotting with indicated antibodies. (D) 293 T cells transfected with non-targeting control (sicon) or SMCR8 siRNA for 72 hr were lysed, followed by IP with anti-SMCR8 or anti-IgG as control. Co-immunoprecipitated proteins were separated by SDS-PAGE and analyzed by immunoblotting. (E) Empty 293T-REx cells (MOCK) or those inducibly expressing HA-tagged SMCR8 were grown in the absence (DMSO) or presence of 250 nM Torin1 for 2 hr and analyzed as in (A). (F) Empty 293T-REx cells (MOCK) or those inducibly expressing HA-tagged SMCR8 or C9ORF72 were starved with EBSS for 2 hr and analyzed as in (A). exp. = exposure. (G) 293 T cells transfected with non-targeting control (sicon) or SMCR8 siRNA for 72 hr were grown in the absence (DMSO) or presence of 250 nM Torin1 for 2 hr, prior to lysis, followed by IP with anti-SMCR8 or anti-IgG as control. Co-immunoprecipitated proteins were separated and detected by SDS-PAGE and immunoblotting, respectively.
Figure 5 with 1 supplement
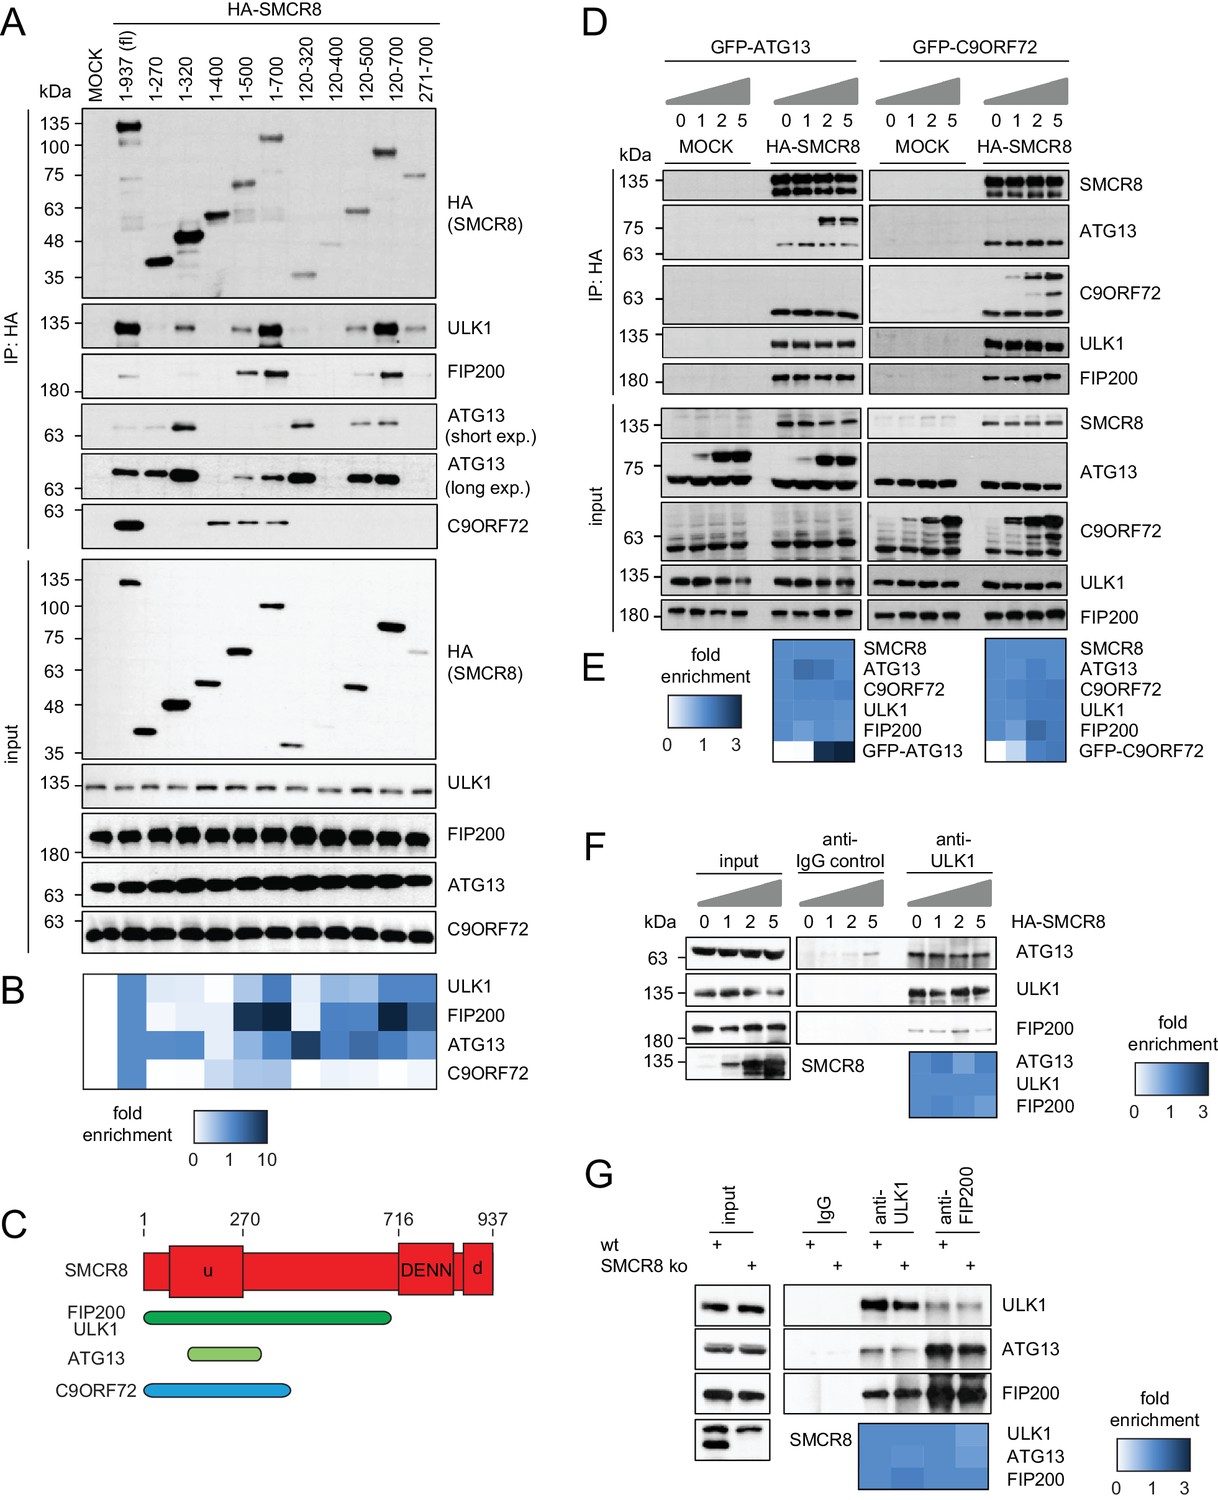
SMCR8 employs overlapping binding regions to associate with ULK1 complex components and C9ORF72.
(A) 293 T cells transiently transfected with HA-tagged full length (fl) SMCR8 or indicated fragments thereof were lysed and subjected to HA-IP and analyzed by SDS-PAGE and immunoblotting with indicated antibodies. exp. = exposure. (B) Immunoblots in (A) were quantified using ImageJ. Co-immunoprecipitated proteins were normalized to the amount of HA-tagged SMCR8 fragments. Fold enrichment compared to full length SMCR8 was calculated and displayed as heatmap. (C) Domain architecture of SMCR8 with mapped binding regions for FIP200, ULK1, ATG13 and C9ORF72. (D) Empty 293T-REx cells (MOCK) or those inducibly expressing HA-tagged SMCR8 were transfected with GFP-ATG13 or GFP-C9ORF72, lysed and subjected to HA-IP, followed by SDS-PAGE and immunoblotting with indicated antibodies. (E) Immunoblots of 3 independent experiments in (D) were quantified using ImageJ. Co-immunoprecipitated proteins were normalized to the amount of HA-tagged SMCR8. Fold enrichment compared to SMCR8 was calculated and displayed as heatmap. (F) 293 T cells transfected with increasing amounts of HA-tagged SMCR8 were lysed, followed by IP with anti-ULK1 or anti-IgG as control. Co-immunoprecipitated proteins were analyzed as in (D). Immunoblots of 3 independent experiments were quantified using ImageJ. Co-immunoprecipitated proteins were normalized to the amount of ULK1. Fold enrichment compared to ULK1 was calculated and displayed as heatmap. (G) Lysates from 293 T SMCR8 wildtype (wt) or knockout (ko) cells were subjected to IP with anti-ULK1, anti-FIP200 or anti-IgG as control. Co-immunoprecipitated proteins were analyzed as in (D). Immunoblots of 3 independent experiments were quantified using ImageJ. Co-immunoprecipitated proteins were normalized to the amount of ULK1 or FIP200, respectively. Fold enrichment compared to ULK1 or FIP200 was calculated and displayed as heatmap.
Figure 5—figure supplement 1
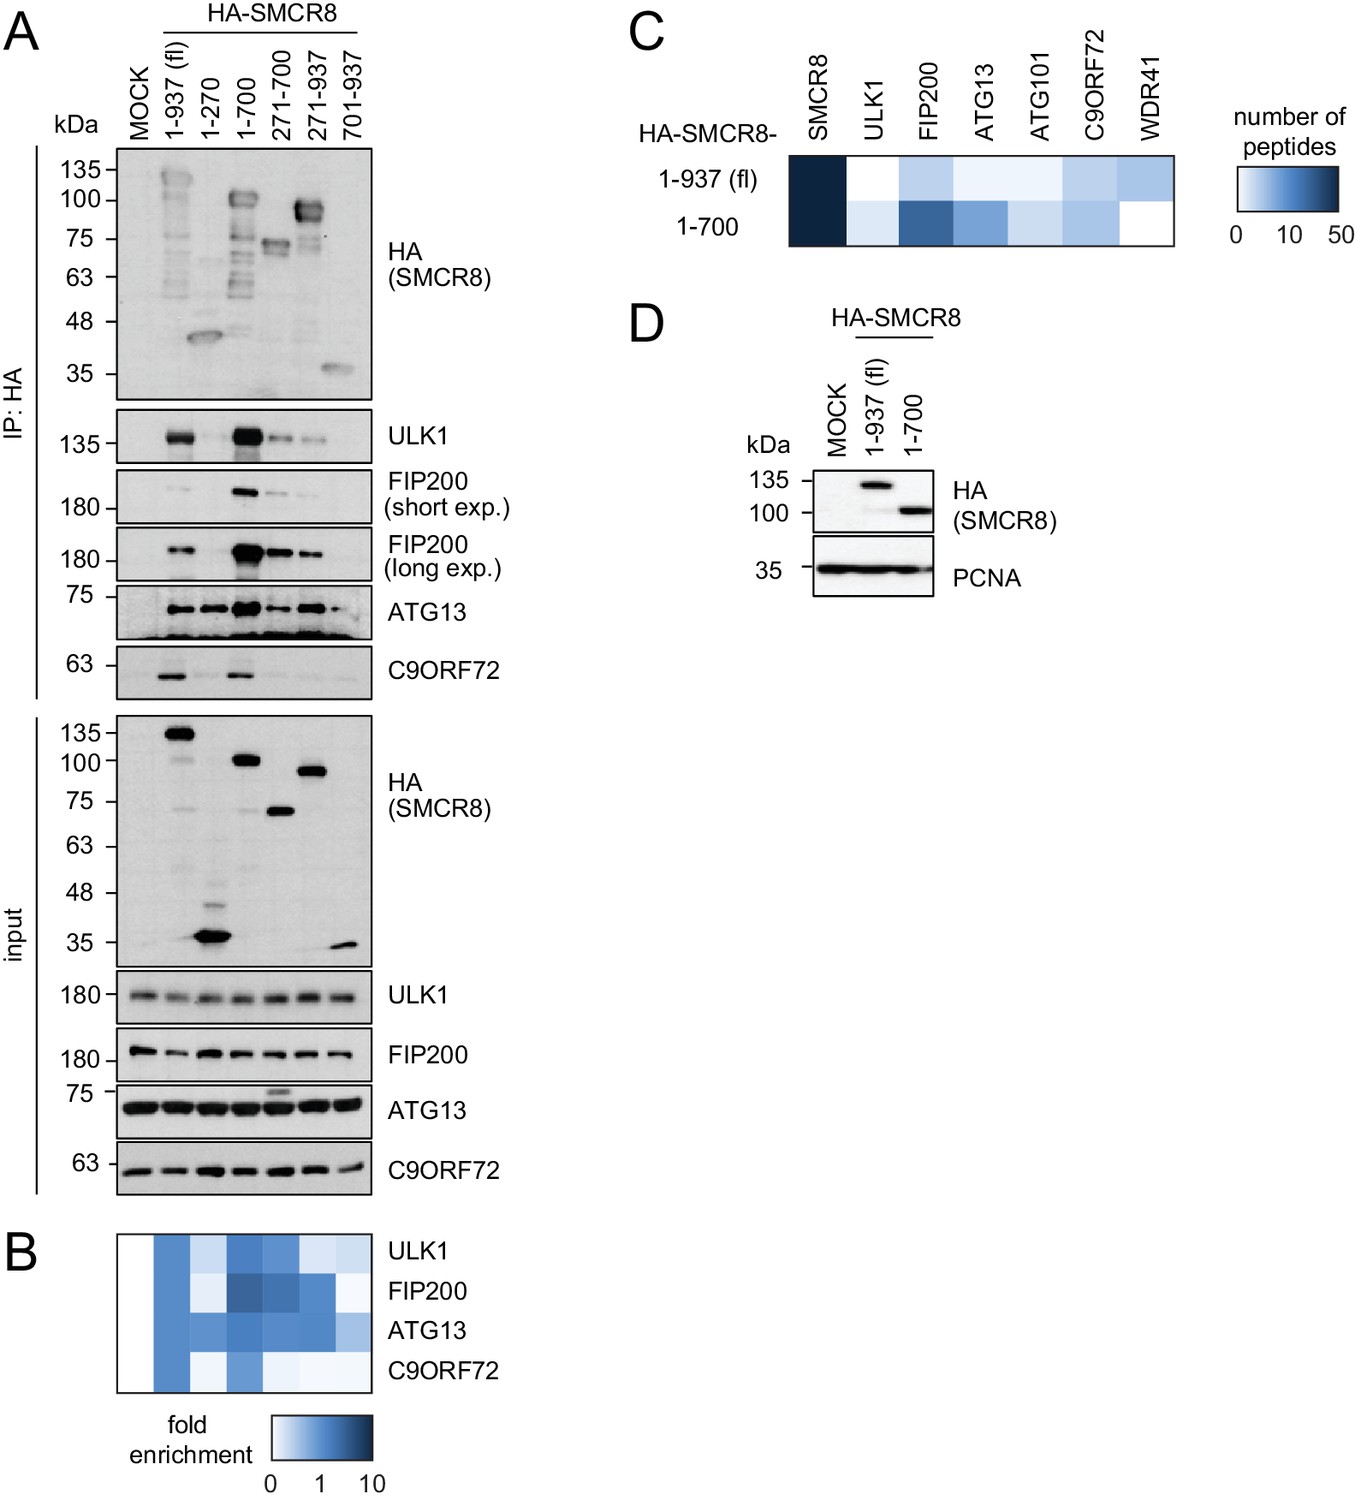
SMCR8 employs overlapping binding regions to associate with ULK1 complex components and C9ORF72.
(A) 293 T cells transiently transfected with HA-tagged full length (fl) SMCR8 or indicated fragments thereof were lysed and subjected to HA-IP, followed by SDS-PAGE and immunoblotting with indicated antibodies. exp. = exposure. (B) IP immunoblots in (A) were quantified using ImageJ. Co-immunoprecipitated proteins were normalized to the amount of HA-tagged SMCR8 fragments. Fold enrichment compared to full length SMCR8 was calculated and displayed as heatmap. (C,D) 293 T cells transiently transfected with HA-tagged full length (fl) SMCR8 or indicated fragments thereof were lysed and subjected to HA-IP followed by mass spectrometric analysis (C) or SDS-PAGE and immunoblot (D). See Figure 3—source data 1 for complete proteomic data.
Figure 6 with 3 supplements
SMCR8 is part of a C9ORF72 complex and a C9ORF72-ULK1 complex holo-assembly.
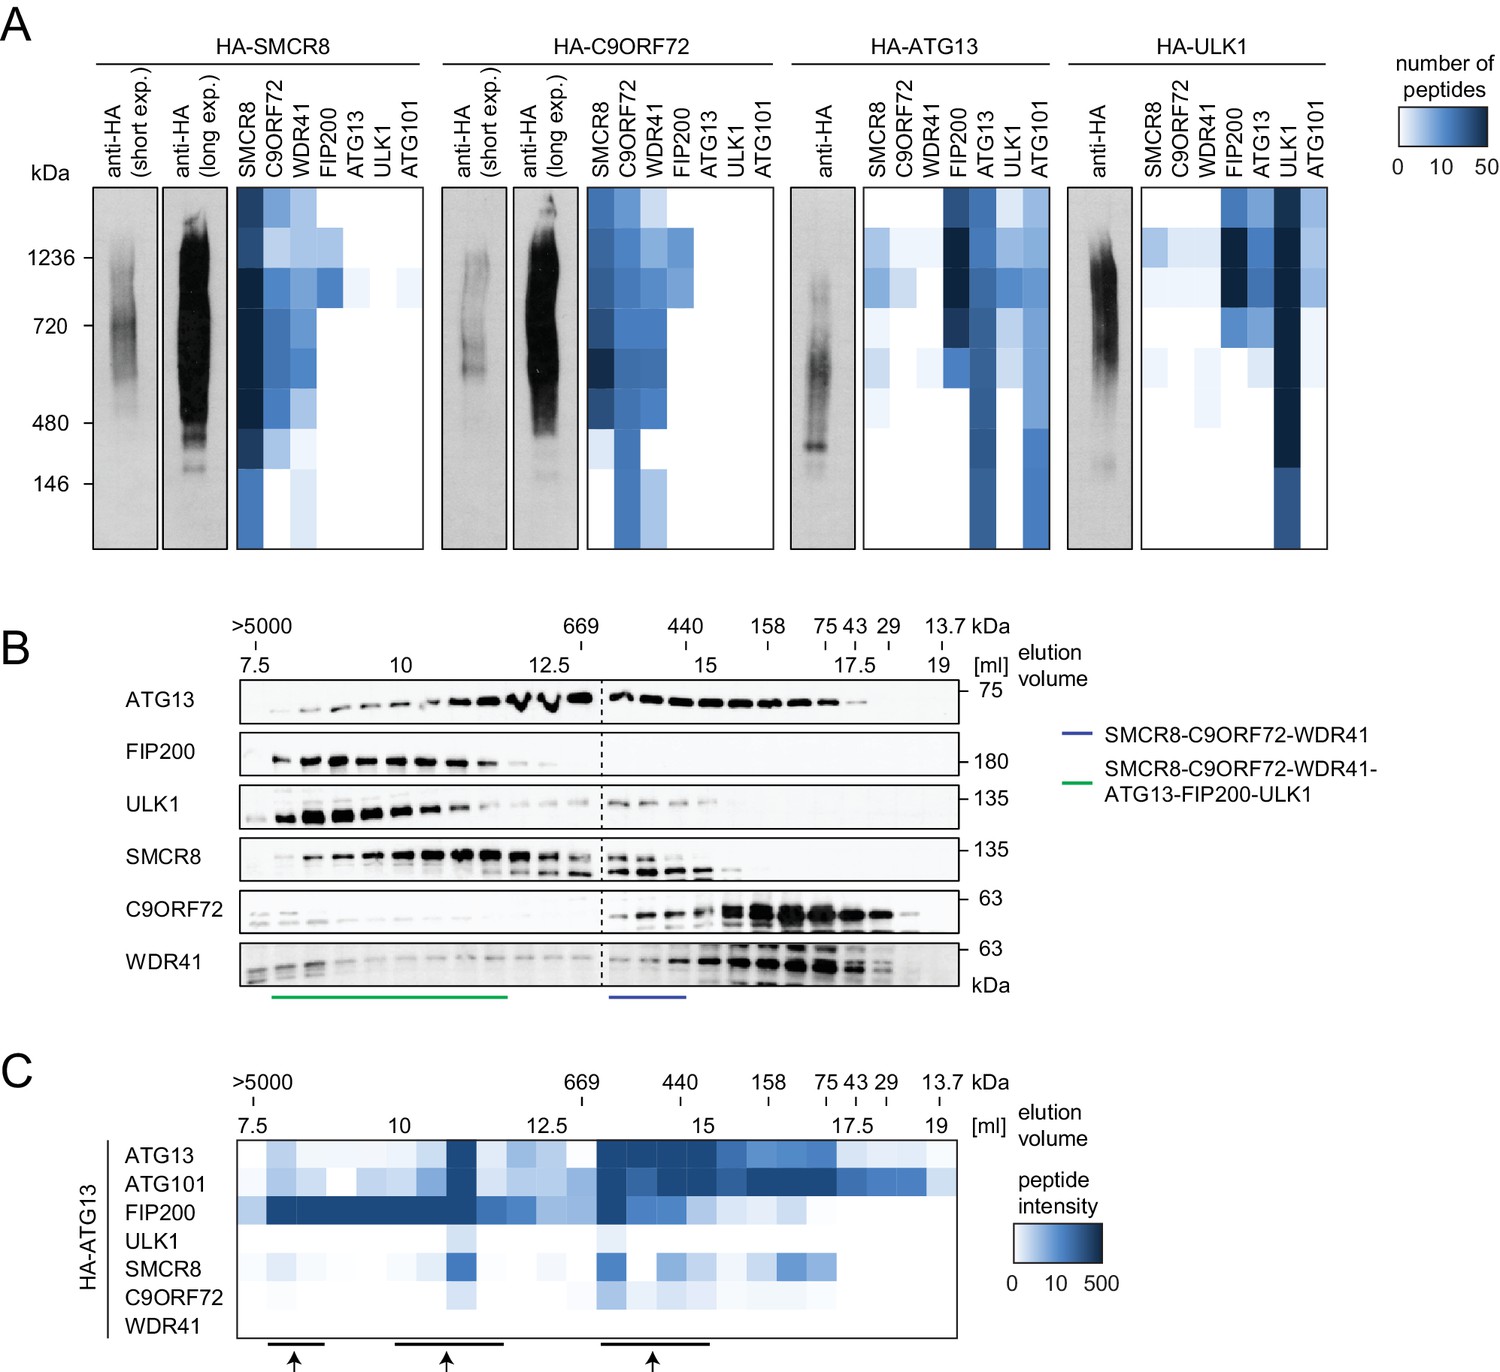
(A) 293T-REx cells inducibly expressing HA-tagged SMCR8, C9ORF72, ATG13 or ULK1 were lysed and subjected to HA-IP, followed by Native PAGE and immunoblotting or mass spectrometric analysis. Number of peptides is depicted as heatmap representation. exp. = exposure. See Figure 6—source data 1 for complete proteomic data. (B) 293 T cells were lysed via freeze-thaw cycles and subjected to SEC, followed by SDS-PAGE and immunoblot with indicated antibodies. SMCR8 complexes are indicated with bars. (C) 293T-REx cells inducibly expressing HA-tagged ATG13 were lysed and subjected to HA-IP, followed by SEC and mass spectrometric analysis. Peptide intensity is depicted as heatmap representation. Arrows indicate intensity peaks. See Figure 6—source data 2 for complete proteomic data.
-
Figure 6—source data 1
Proteomic data from Native PAGE analysis of HA-IPs.
- https://doi.org/10.7554/eLife.23063.019
-
Figure 6—source data 2
Proteomic data from SEC of immunoprecipitated HA-ATG13.
- https://doi.org/10.7554/eLife.23063.020
Figure 6—figure supplement 1
Composition of SMCR8-containing complexes is unchanged in response to Torin1 treatment.
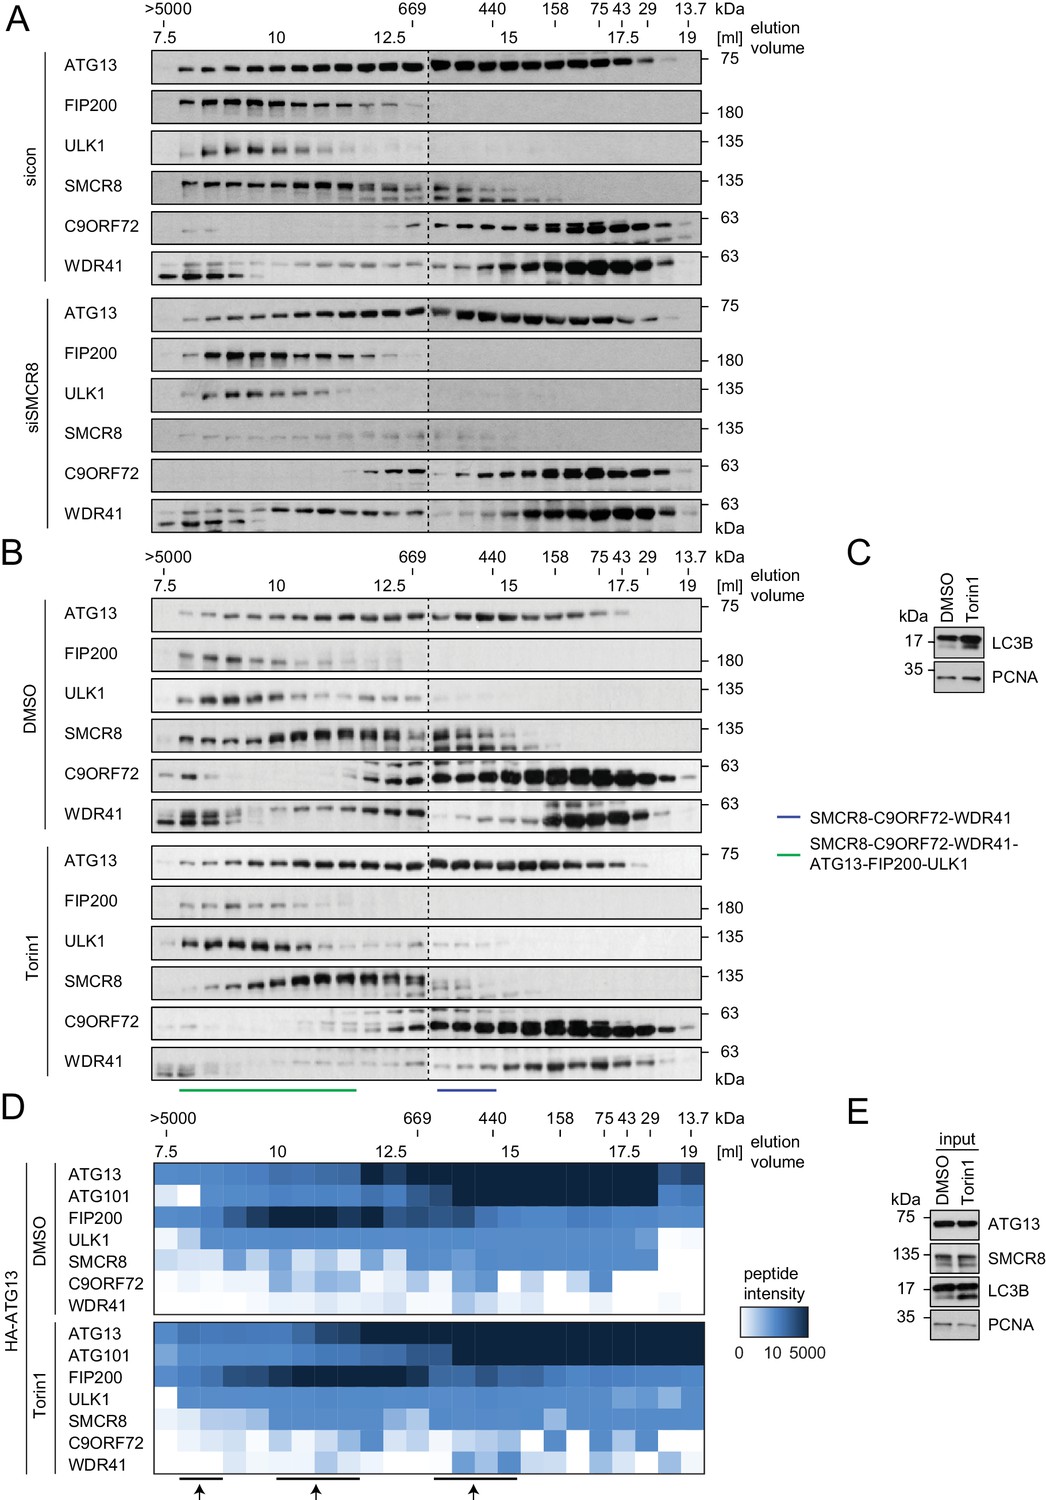
(A) 293 T cells transfected with non-targeting control (sicon) or SMCR8 siRNA were lysed via freeze-thaw cycles and subjected to SEC, followed by SDS-PAGE and immunoblot with indicated antibodies. (B,C) 293 T cells were grown in absence (DMSO) or presence of 250 nM Torin1 for 2 hr and analyzed as in (A). LC3B served as positive control for the Torin1 treatment while PCNA served as loading control. SMCR8 complexes are indicated with bars. (D,E) 293T-REx cells inducibly expressing HA-tagged ATG13 were grown in absence (DMSO) or presence of 250 nM Torin1 for 2 hr, lysed and subjected to immunoblot (E) or HA-IP, followed by SEC and mass spectrometric analysis (D). Peptide intensity is depicted as heatmap representation. Arrows indicate intensity peaks. See Figure 6—source data 2 for complete proteomic data. PCNA served as loading control.
Figure 6—figure supplement 2
Dual role of SMCR8 in regulating initiation and maturation of autophagosomes.
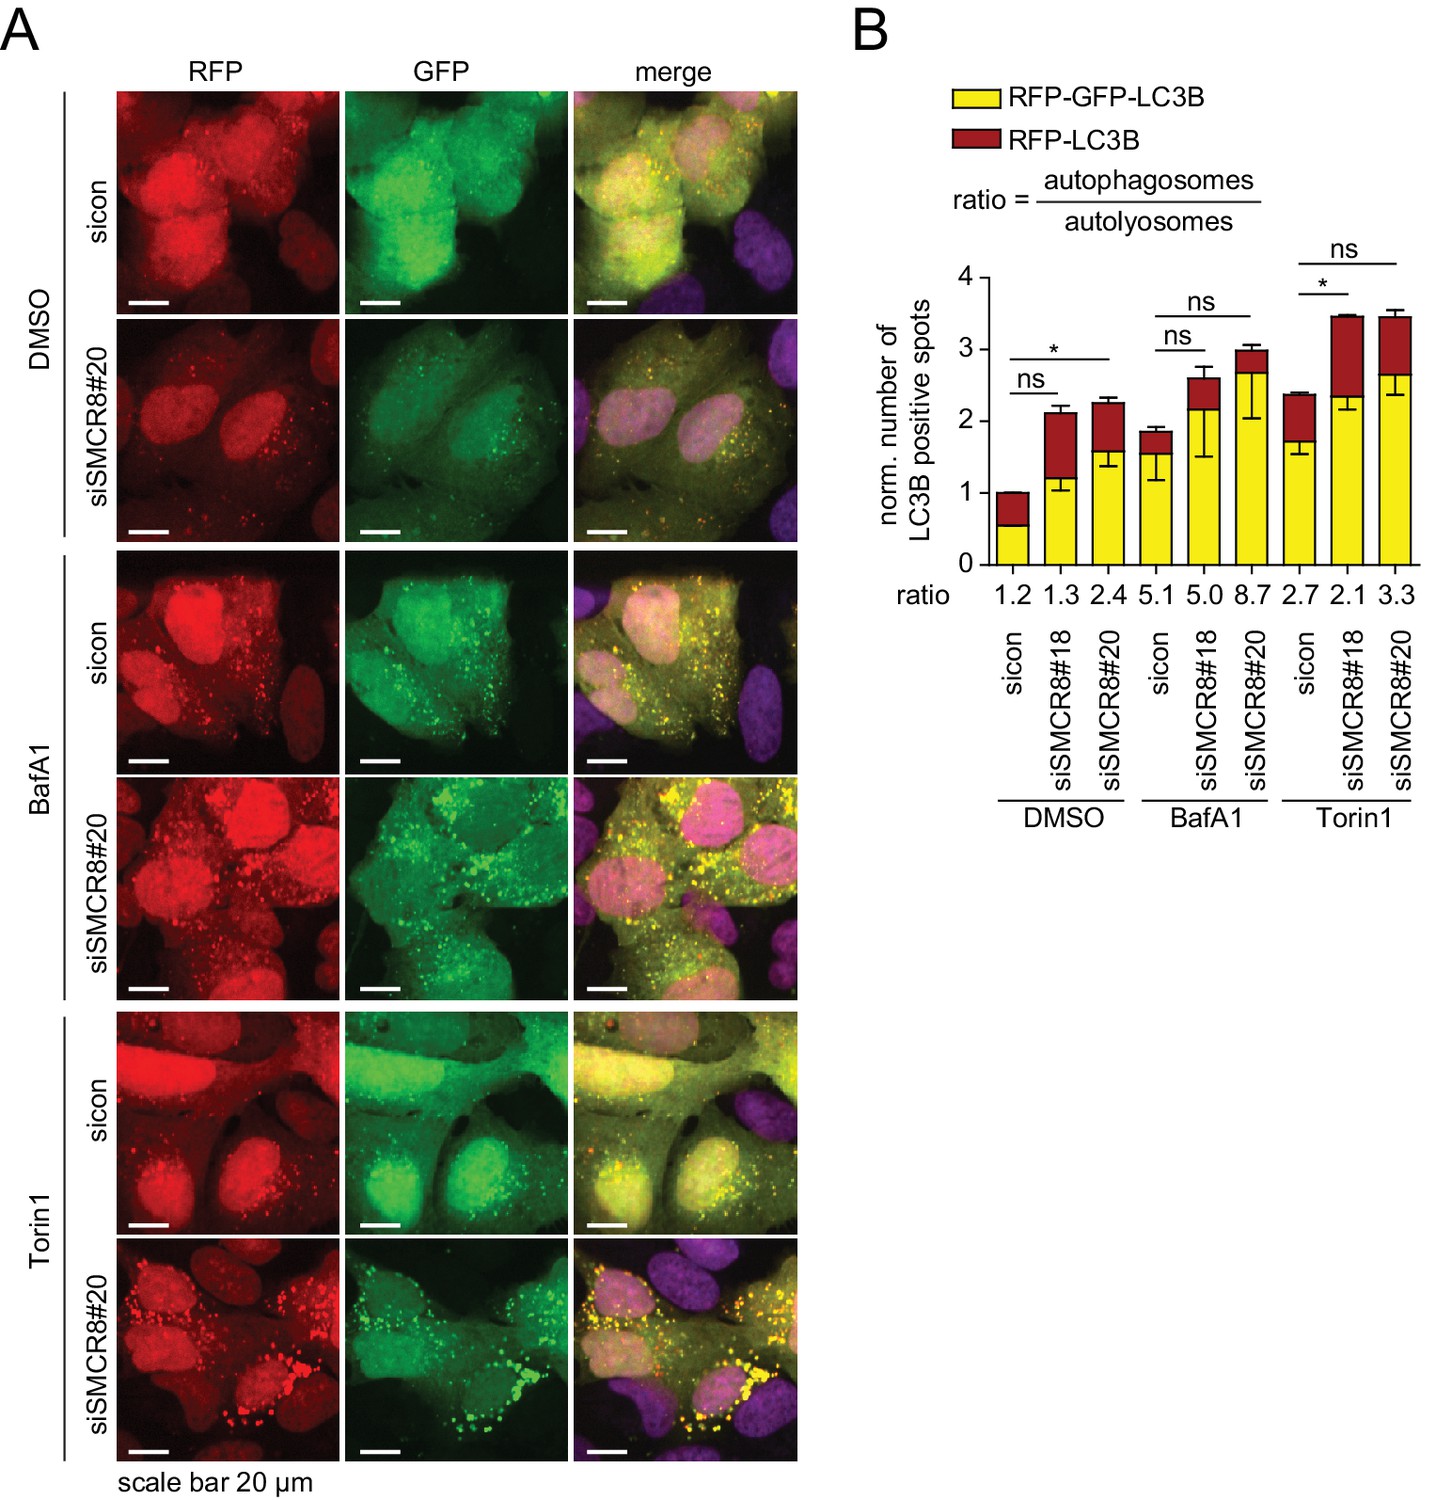
(A) U2OS cells stably expressing RFP-GFP-LC3B transfected with non-targeting control (sicon) or SMCR8 siRNA for 72 hr were grown in the absence (DMSO) or presence of 100 nM BafA1 or 250 nM Torin1 for 2 and 1 hr, respectively, prior to fixation and confocal microscopy. Scale bars, 20 µm. (B) Images from (A) were subjected to automated quantification of LC3B-positive spots for at least 200 cells per condition. Error bars represent SEM. Significance was determined using two-way ANOVA compared with sicon. All experiments were performed n = 3.
Figure 6—figure supplement 3
SMCR8 depletion induces formation and colocalization of ULK1- and WIPI2-positive structures.
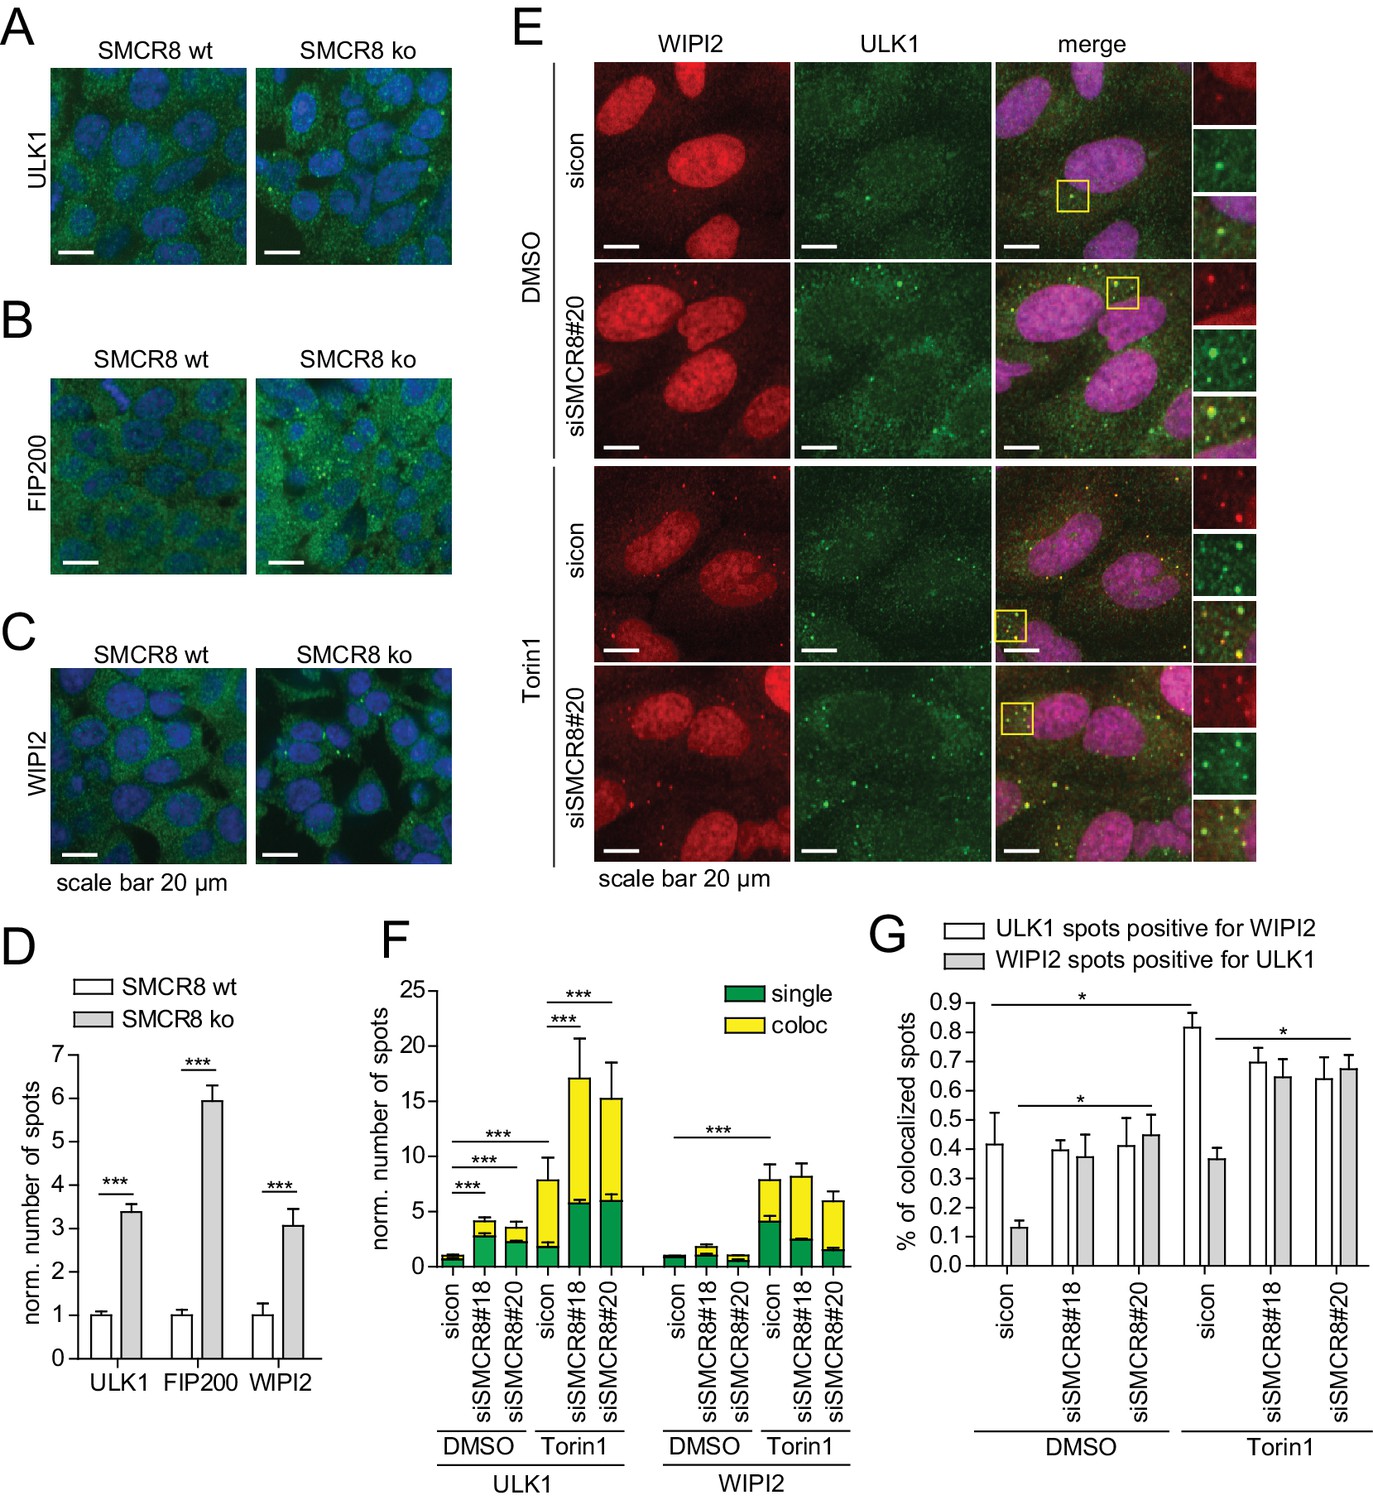
(A–C) HAP1 SMCR8 wildtype (wt) or knockout (ko) cells were fixed and immunolabeled with anti-ULK1 (A), anti-FIP200 (B) or anti-WIPI2 (C) antibodies. Nuclei were counterstained with DRAQ5. Scale bars, 20 µm. (D) Number of spots for at least 1000 cells in images from (A–C) were determined using automated quantification software and normalized to SMCR8 wt. Error bars represent SEM. Significance was determined using two-way ANOVA compared with parental cells. All experiments were performed n = 3. (E) U2OS cells transfected with non-targeting control (sicon) or SMCR8 siRNA for 72 hr were grown in absence (DMSO) or presence of 250 nM Torin1 for 1 hr prior to fixation and immunolabeling with anti-ULK1 and anti-WIPI2 antibodies. Scale bars, 20 µm. (F,G) Numbers of ULK1- and WIPI2-spots (each normalized to sicon DMSO) (F) and their coalescence (expressed for each as percentages of colocalized spots) (G) for at least 1000 cells in images from (E) were determined using automated quantification software. Error bars represent SEM. Significance was determined using two-way ANOVA compared with sicon. All experiments were performed n = 3.
Figure 7 with 1 supplement
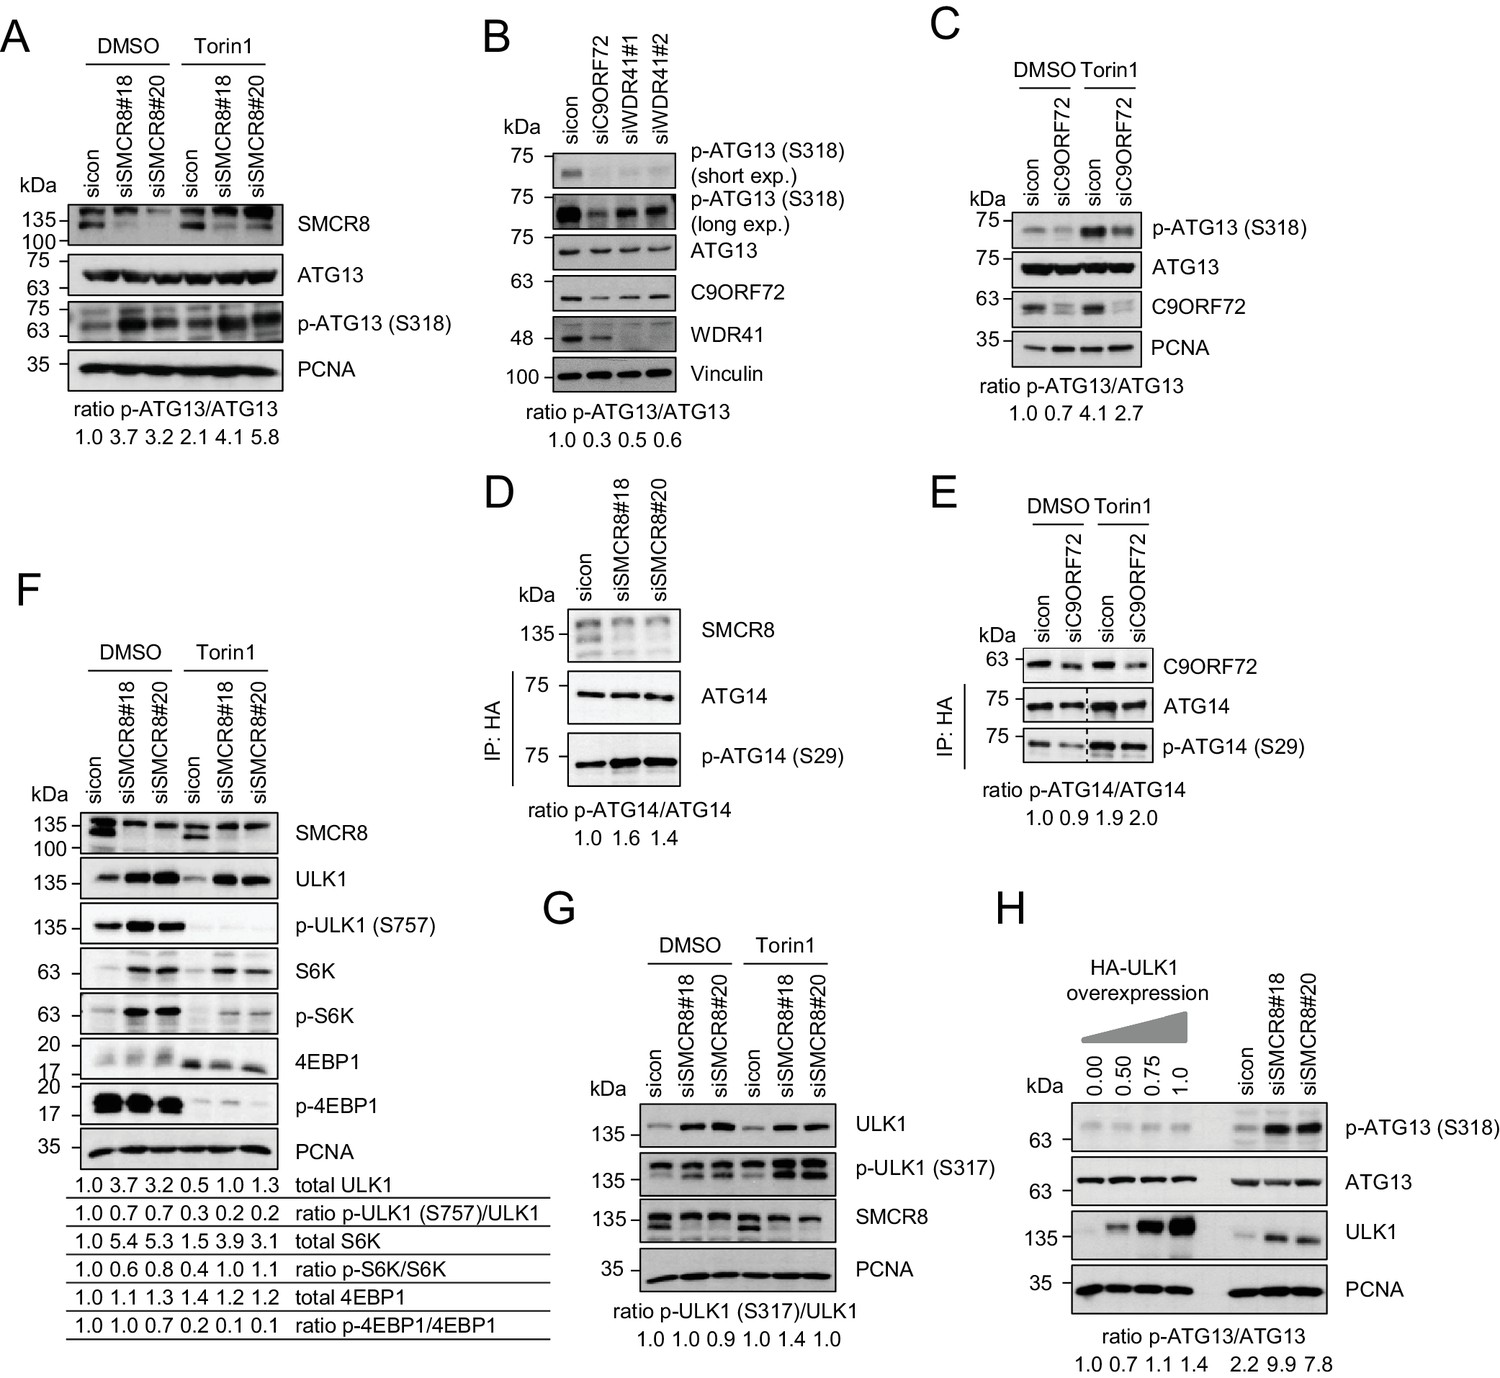
SMCR8 regulates ULK1 kinase activity.
(A) Lysates from 293 T cells transfected with non-targeting control (sicon) or SMCR8 siRNA and grown in absence (DMSO) or presence of 250 nM Torin1 for 2 hr were subjected to SDS-PAGE and immunoblotting with indicated antibodies. PCNA served as loading control. Immunoblots were quantified using ImageJ and the ratio of p-ATG13/ATG13 was calculated. (B) Lysates from 293 T cells transfected with non-targeting control (sicon), C9ORF72 or WDR41 siRNAs were subjected to SDS-PAGE and immunoblotting with indicated antibodies. Vinculin served as loading control. exp. = exposure. Immunoblots were quantified using ImageJ and the ratio of p-ATG13/ATG13 was calculated. (C) Lysates from 293 T cells transfected with non-targeting control (sicon) or C9ORF72 siRNA and grown in absence (DMSO) or presence of 250 nM Torin1 for 2 hr were subjected to SDS-PAGE and immunoblotting with indicated antibodies. PCNA served as loading control. Immunoblots were quantified using ImageJ and the ratio of p-ATG13/ATG13 was calculated. (D) Lysates from 293 T cells transfected with non-targeting control (sicon) or SMCR8 siRNA and HA-tagged ATG14 were subjected to HA-IP followed by SDS-PAGE and immunoblotting with indicated antibodies. Immunoblots were quantified using ImageJ and the ratio of p-ATG14/ATG14 was calculated. (E) Lysates from 293 T cells transfected with non-targeting control (sicon) or C9ORF72 siRNA and HA-tagged ATG14, grown in absence (DMSO) or presence of 250 nM Torin1 for 2 hr were analyzed as in (D). (F) Cells in (A) were analyzed as in (A). Immunoblots were quantified using ImageJ. Total amounts of ULK1, S6K and 4EBP1 as well as the ratio of p-ULK1(S757)/ULK1, p-S6K/S6K and p-4EBP1/4EBP1 was calculated. (G) Cells in (A) were analyzed as in (A). Immunoblots were quantified using ImageJ. The ratio of p-ULK1(S317)/ULK1 was calculated. (H) 293 T cells transfected with non-targeting control (sicon) or SMCR8 siRNA or with increasing amounts of HA-ULK1 were lysed and analyzed as in (A). Immunoblots were quantified using ImageJ and the ratio of p-ATG13/ATG13 was calculated.
Figure 7—figure supplement 1
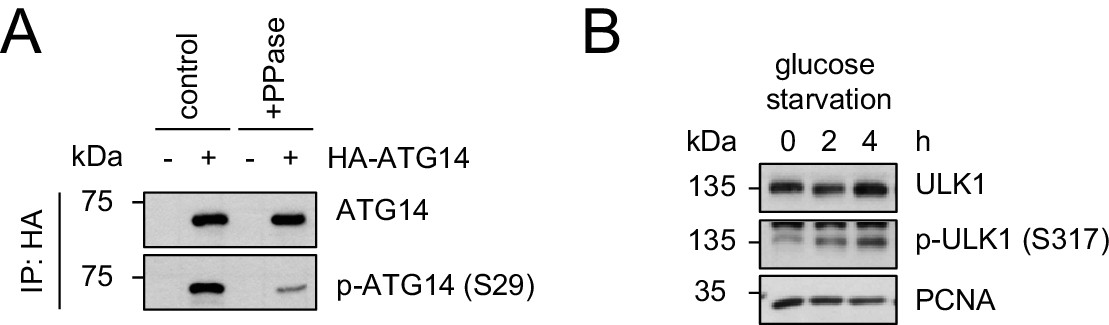
Evaluation of the phospho-antibody specificity.
(A) Lysates from 293 T cells transfected with HA-tagged ATG14 were subjected to HA-IP followed by Lambda Protein Phosphatase (PPase) treatment for 1 hr and SDS-PAGE and immunoblotting with indicated antibodies. (B) 293 T cells were grown in absence of glucose for 2 or 4 hr or full medium and subjected to SDS-PAGE and immunoblotting with indicated antibodies. PCNA served as loading control.
Figure 8 with 1 supplement
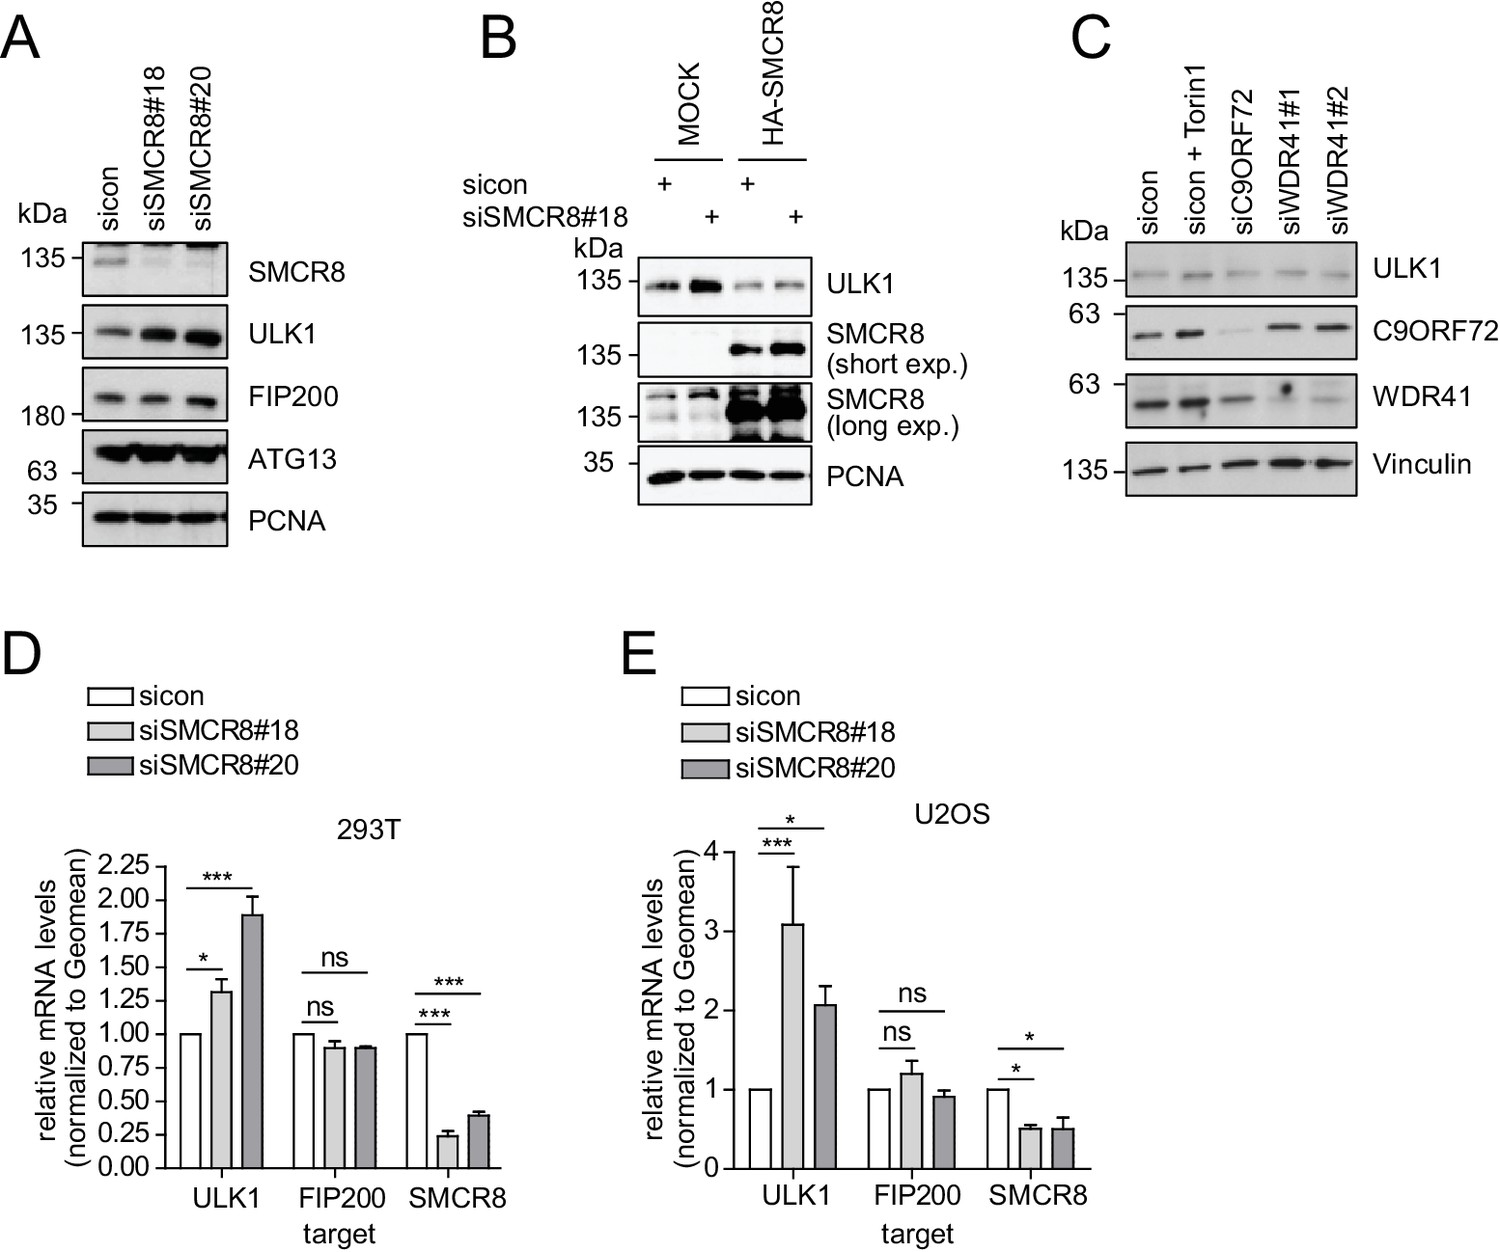
SMCR8 regulates ULK1 gene expression.
(A) Lysates from 293 T cells transfected with non-targeting control (sicon) or SMCR8 siRNA were subjected to SDS-PAGE and immunoblotting with indicated antibodies. PCNA served as loading control. (B) Lysates from 293 T cells transfected with non-targeting control (sicon) or SMCR8 siRNA as well as with HA-tagged SMCR8 were subjected to SDS-PAGE and immunoblotting with indicated antibodies. PCNA served as loading control. exp. = exposure. (C) Lysates from 293 T cells transfected with indicated siRNAs and grown in absence (DMSO) or presence of 250 nM Torin1 for 2 hr were lysed and analyzed as in (A). Vinculin served as loading control. (D,E) 293T (D) or U2OS (E) cells were transfected with indicated siRNAs for 72 hr prior to RNA isolation, preparation of cDNA and RT-qPCR with ULK1, FIP200 and SMCR8 specific primers. Error bars represent SEM. Significance was determined using two-way ANOVA compared with sicon. All experiments were performed n = 3.
Figure 8—figure supplement 1
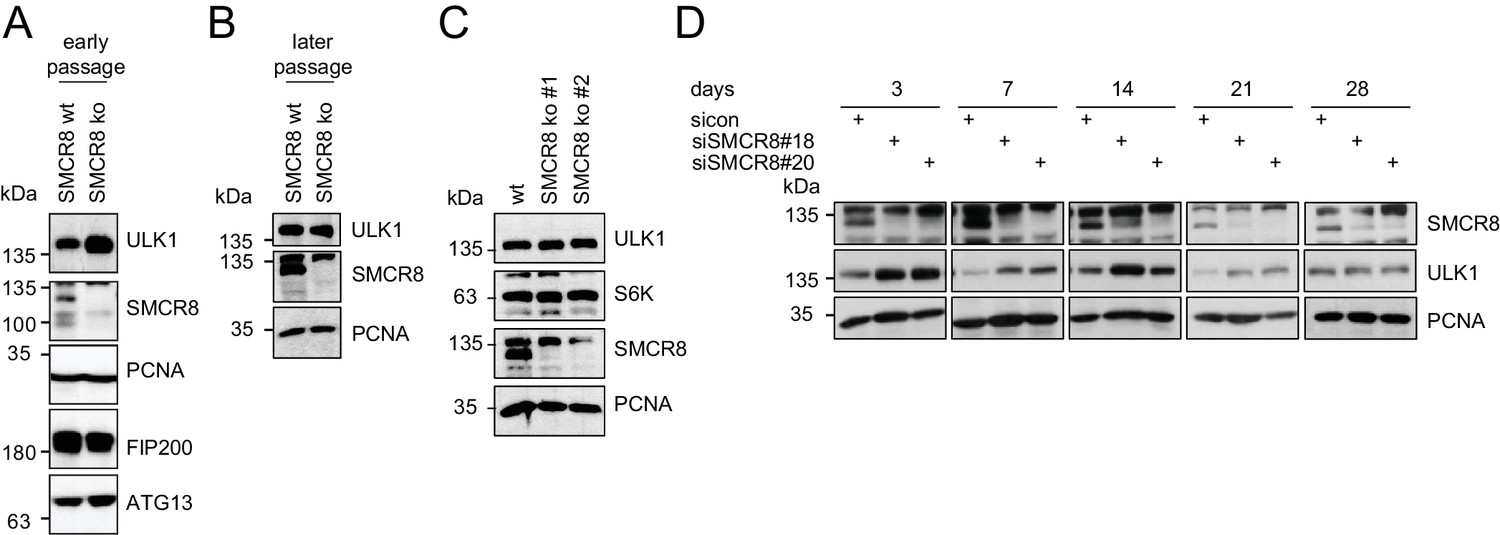
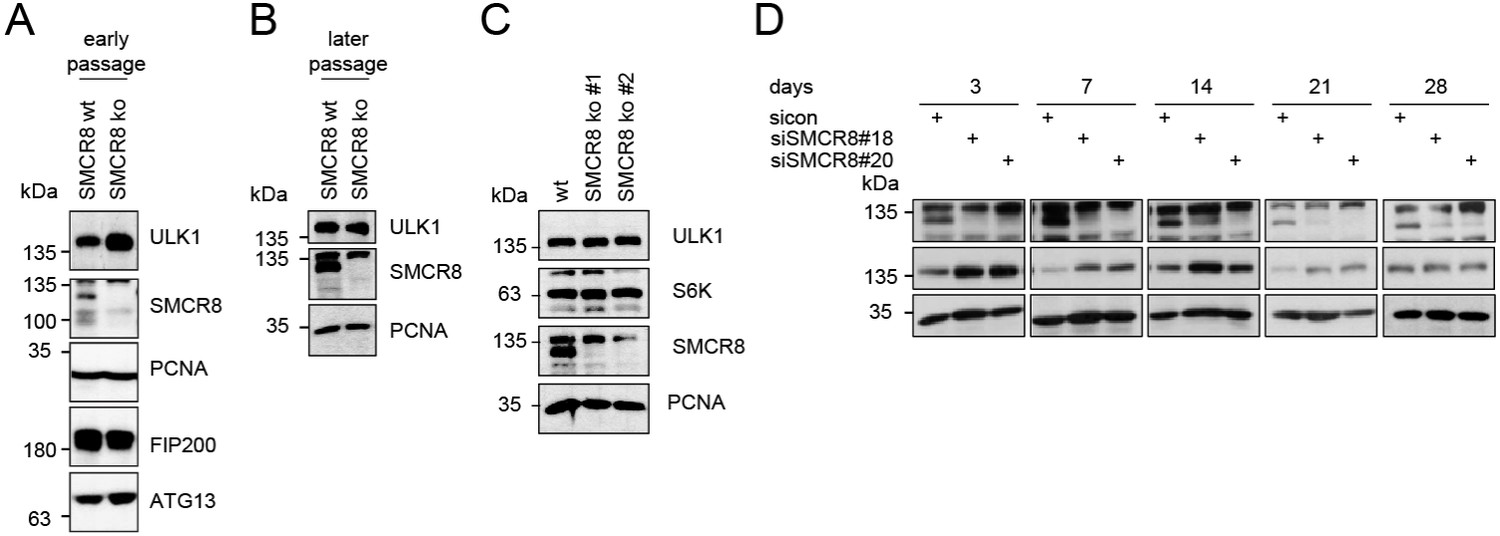
Restored regulation of ULK1 protein levels in SMCR8 knockout cells.
(A,B) Early (A) or late (B) passages of HAP1 SMCR8 wildtype (wt) or knockout (ko) cells were subjected to SDS-PAGE and immunoblot with indicated antibodies. PCNA served as loading control. (C) 293T SMCR8 wildtype (wt) or knockout (ko) cells were analyzed as in (A). (D) 293 T cells were transfected with non-targeting control (sicon) or SMCR8 siRNA. Half of the cells were re-transfected every 2–3 days with non-targeting control (sicon) or SMCR8 siRNA while the other half was harvested and subjected to SDS-PAGE and immunoblotting with indicated antibodies. PCNA served as loading control.
Figure 9 with 1 supplement
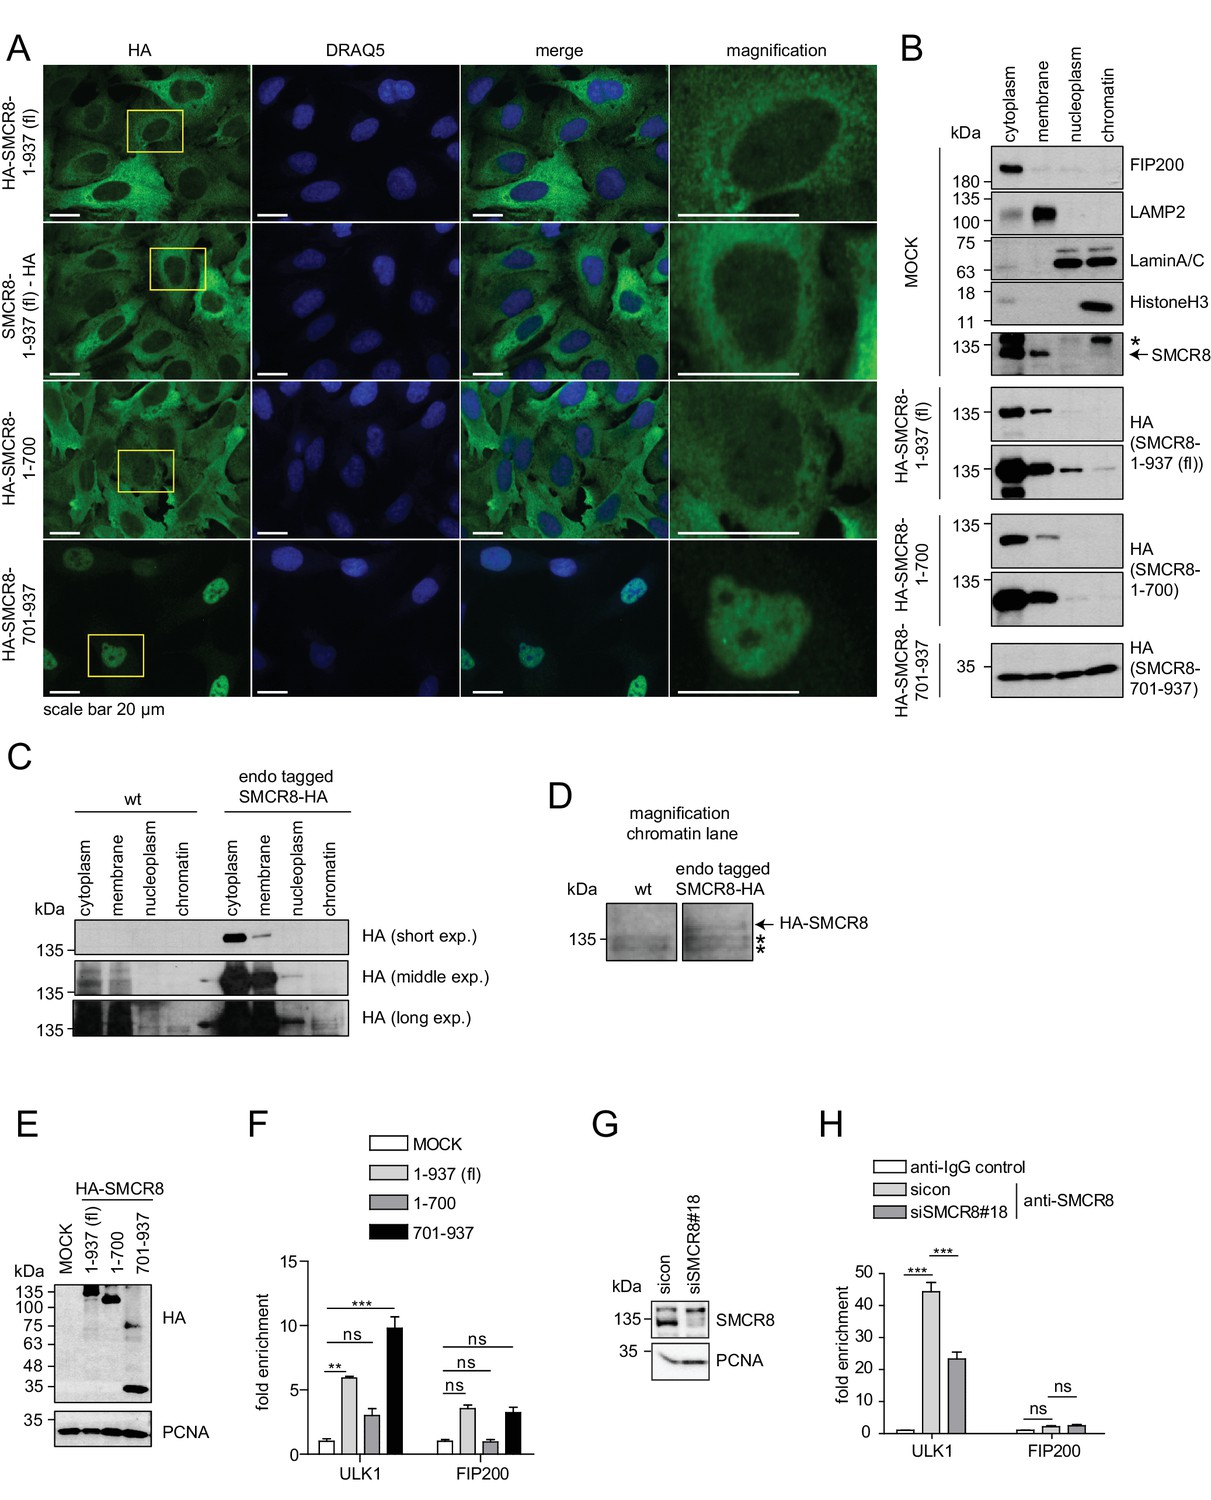
The C-terminal part of SMCR8 mediates nuclear localization and associates with the ULK1 gene locus.
(A) U2OS cells stably expressing N- or C-terminal HA-tagged full-length (fl) SMCR8 or indicated fragments thereof were fixed and immunolabeled with anti-HA antibody. Scale bars, 20 µm. (B) 293 T cells were transiently transfected with HA-tagged full-length (fl) SMCR8 or indicated fragments thereof followed by subcellular fractionation, SDS-PAGE and immunoblot analysis with indicated antibodies. * or arrow indicate non-specific or specific bands, respectively. (C) 293 T wildtype (wt) cells or those with endogenously HA-tagged SMCR8 were subjected to subcellular fractionation followed by HA-IP, SDS-PAGE and immunoblot analysis with indicated antibodies. exp. = exposure. (D) Magnification of the chromatin lane in (C) for better visualization. * indicates non-specific bands. (E,F) Cells transfected with SMCR8 variants as in (B) were lysed and analyzed by SDS-PAGE and immunoblotting (E) or subjected to chromatin immunoprecipitation (ChIP) with an anti-HA-antibody and qPCR with primers specific for ULK1 and FIP200 (F). Percentages of input were calculated and normalized to MOCK. Error bars represent SEM. Significance was determined using two-way ANOVA compared with MOCK. All experiments were performed n = 3. (G,H) 293 T cells transfected with non-targeting (sicon) or SMCR8 siRNA for 72 hr were lysed and analyzed as in (E) (G) or subjected to ChIP with anti-SMCR8-antibody and qPCR with primers specific for ULK1 and FIP200 (H). Percentages of input were calculated and normalized to IgG control. Error bars represent SEM. Significance was determined using two-way ANOVA compared with sicon. All experiments were performed n = 3.
Figure 9—figure supplement 1
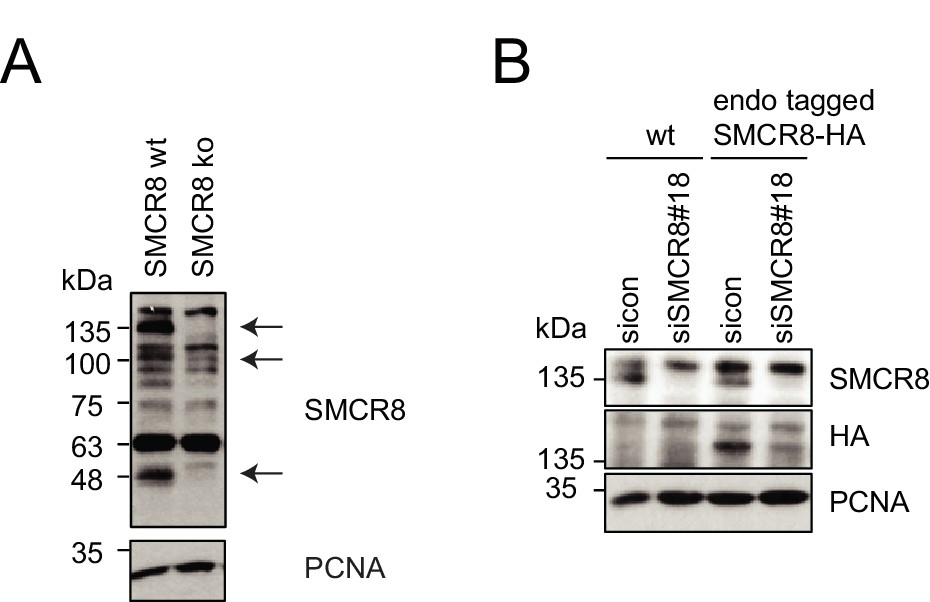
Evaluation of SMCR8 antibody specificity and SMCR8 cell line.
(A) HAP1 SMCR8 wildtype (wt) or knockout (ko) cells were subjected to SDS-PAGE and immunoblotting with anti-SMCR8 antibody. PCNA served as loading control. Arrows indicate specific SMCR8 bands. (B) 293T wildtype (wt) cells or those with endogenously tagged SMCR8 transfected with non-targeting control (sicon) or SMCR8 siRNA were subjected to SDS-PAGE and immunoblotting with indicated antibodies. PCNA served as loading control.
Figure 10 with 1 supplement

SMCR8 regulates gene expression of autophagosomal proteins.
(A) 293 T cells were transfected with non-targeting control (sicon) or SMCR8 siRNA prior to RNA isolation and microarray analysis. Representation of normalized ratios of siSMCR8/sicon of three independent experiments. See Figure 10—source data 1 for complete microarray analysis. (B) Selected autophagosomal and lysosomal genes from data in (A) are shown as heatmap representation. Genes upregulated more than 1.3 fold or downregulated more than 0.7 fold are marked with a green or red bar, respectively. Genes selected for validation are marked in bold and italic. WIPI2 is marked in grey, due to our stringent quality control. (C) 293 T cells were transfected with non-targeting control (sicon) or SMCR8 siRNA for 72 hr prior to RNA isolation, preparation of cDNA and RT-qPCR with indicated specific primers or subjected to SDS-PAGE and immunoblotting with indicated antibodies. Error bars represent SEM. Significance was determined using unpaired t-test. All experiments were performed n = 3. (D) 293 T cells transiently transfected with HA-tagged full-length (fl) SMCR8 or indicated fragments thereof were lysed and subjected to chromatin immunoprecipitation (ChIP) with anti-HA-antibody and qPCR with primers specific for WIPI2. Percentages of input were calculated and normalized to MOCK. Error bars represent SEM. Significance was determined using one-way ANOVA compared with MOCK. All experiments were performed n = 3. (E) 293 T cells transfected with non-targeting (sicon) or SMCR8 siRNA for 72 hr were lysed and subjected to ChIP with an anti-SMCR8-antibody and qPCR with primers specific for WIPI2. Percentages of input were calculated and normalized to IgG control. Error bars represent SEM. Significance was determined using one-way ANOVA compared with sicon. All experiments were performed n = 3.
-
Figure 10—source data 1
mRNA expression microarray analysis of control and SMCR8 depleted cells.
- https://doi.org/10.7554/eLife.23063.031
Figure 10—figure supplement 1
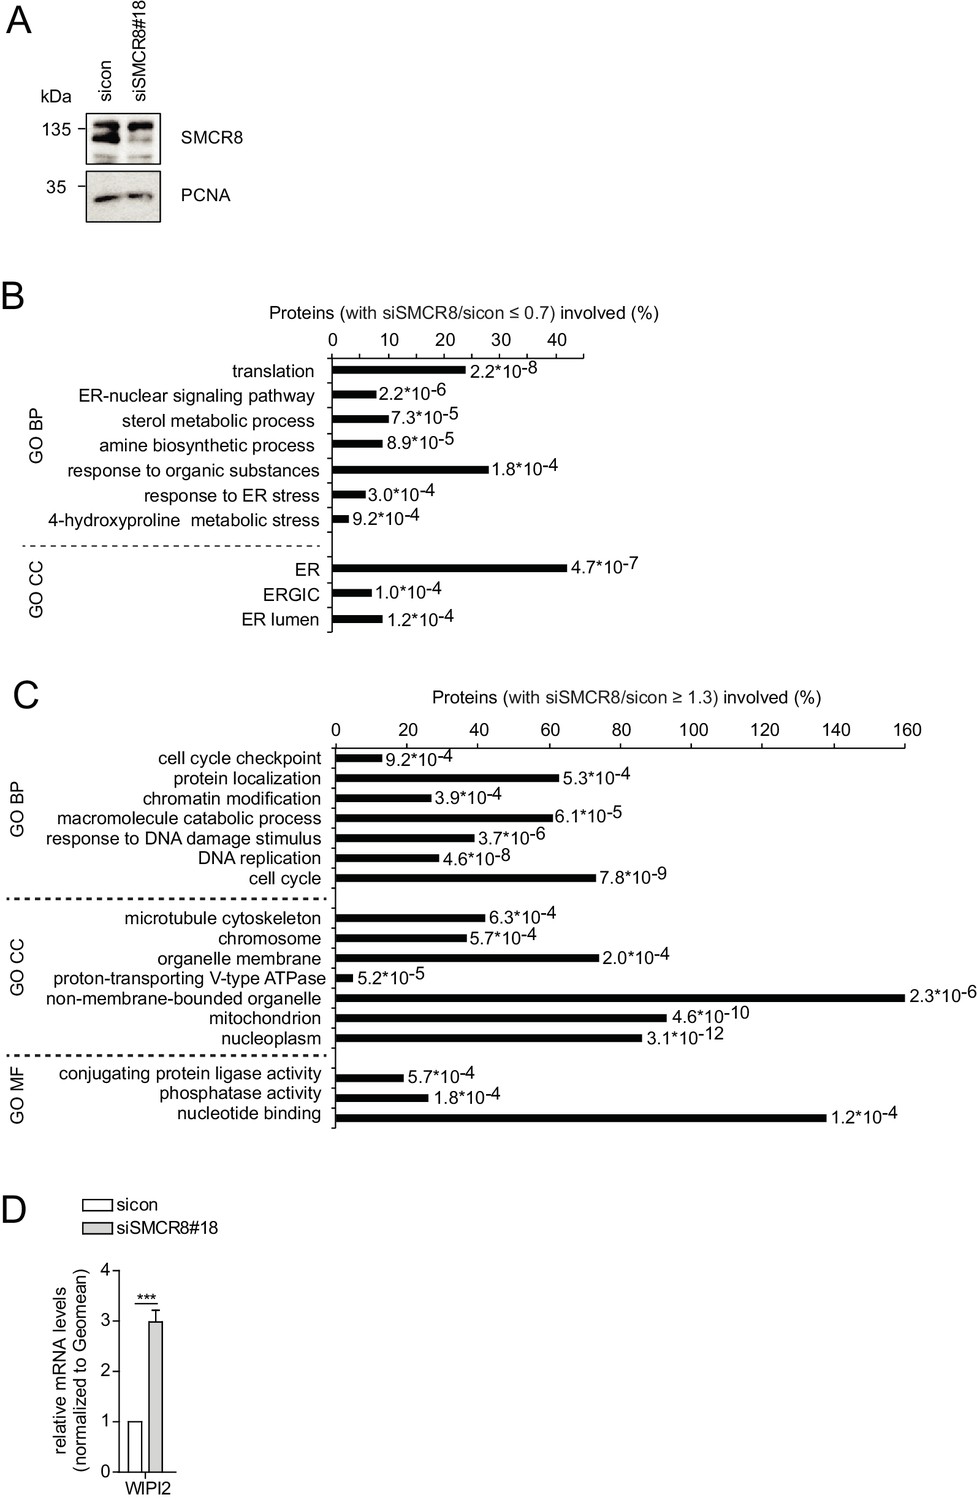
SMCR8 regulates gene expression of autophagosomal proteins.
(A) Lysates of 293 T cells transfected with non-targeting control (sicon) or SMCR8 siRNA were subjected to SDS-PAGE and immunoblot with anti-SMCR8 antibody. PCNA served as loading control. (B,C) Down- (B) or upregulated (C) genes from the microarray analysis (Figure 10A) were analyzed with DAVID using GO term categorization. (D) U2OS cells were transfected with non-targeting control (sicon) or SMCR8 siRNA for 72 hr prior to RNA isolation, preparation of cDNA and RT-qPCR with specific primers for WIPI2. Error bars represent SEM. Significance was determined using unpaired t-test. All experiments were performed n = 3.
Figure 11

Working model for the multifaceted function of SMCR8 during autophagy.
On one hand, SMCR8 promotes autophagosome maturation as part of a trimeric RAB39B GEF complex together with C9ORF72 and WDR41 as previously shown Sellier et al. (2016). On the other hand, this SMCR8 complex regulates autophagosome formation by binding ULK1 complex components and modulating the kinase activity of ULK1. Furthermore, SMCR8 associates with the ULK1 and WIPI2 gene locus and represses ULK1 and WIPI2 gene expression and additionally regulates transcription of several other autophagy-related genes.
Author response image 1
(A-B) Early (A) or late (B) passages of HAP1 SMCR8 wildtype (wt) or knockout (ko) cells were subjected to SDS-PAGE and immunoblot with indicated antibodies.
PCNA serves as loading control. (C) 293T SMCR8 wildtype (wt) or knockout (ko) cells were analyzed as in (A). (D) 293T cells were transfected with non-targeting control (sicon) or SMCR8 siRNA. Half of the cells were re-transfected every 2-3 days with non-targeting control (sicon) or SMCR8 siRNA while the other half was harvested and subjected to SDS-PAGE and immunoblotting with indicated antibodies. PCNA served as loading control.
Author response image 2
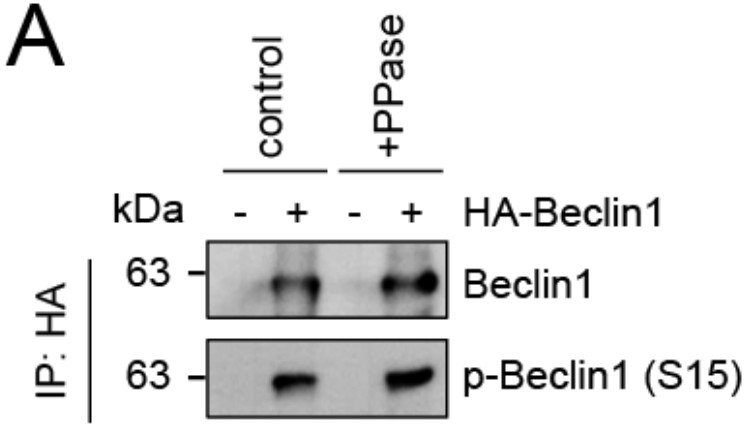
Evaluation of phospho-antibody specificity.
(A) Lysates from 293T cells transfected with HA-tagged Beclin1 were subjected to HA-IP followed by Lambda Protein Phosphatase (PPase) treatment for 1 h and SDS-PAGE and immunoblotting with indicated antibodies.
Additional files
-
Supplementary file 1
siRNA sequences.
- https://doi.org/10.7554/eLife.23063.034
-
Supplementary file 2
Primer sequences.
- https://doi.org/10.7554/eLife.23063.035
Download links
A two-part list of links to download the article, or parts of the article, in various formats.
Downloads (link to download the article as PDF)
Open citations (links to open the citations from this article in various online reference manager services)
Cite this article (links to download the citations from this article in formats compatible with various reference manager tools)
Multiplex image-based autophagy RNAi screening identifies SMCR8 as ULK1 kinase activity and gene expression regulator
eLife 6:e23063.
https://doi.org/10.7554/eLife.23063


