Competition between Tropomyosin, Fimbrin, and ADF/Cofilin drives their sorting to distinct actin filament networks
- The University of Chicago, United States
- Robert Wood Johnson Medical School, Rutgers University, United States
Figures
Figure 1 with 2 supplements
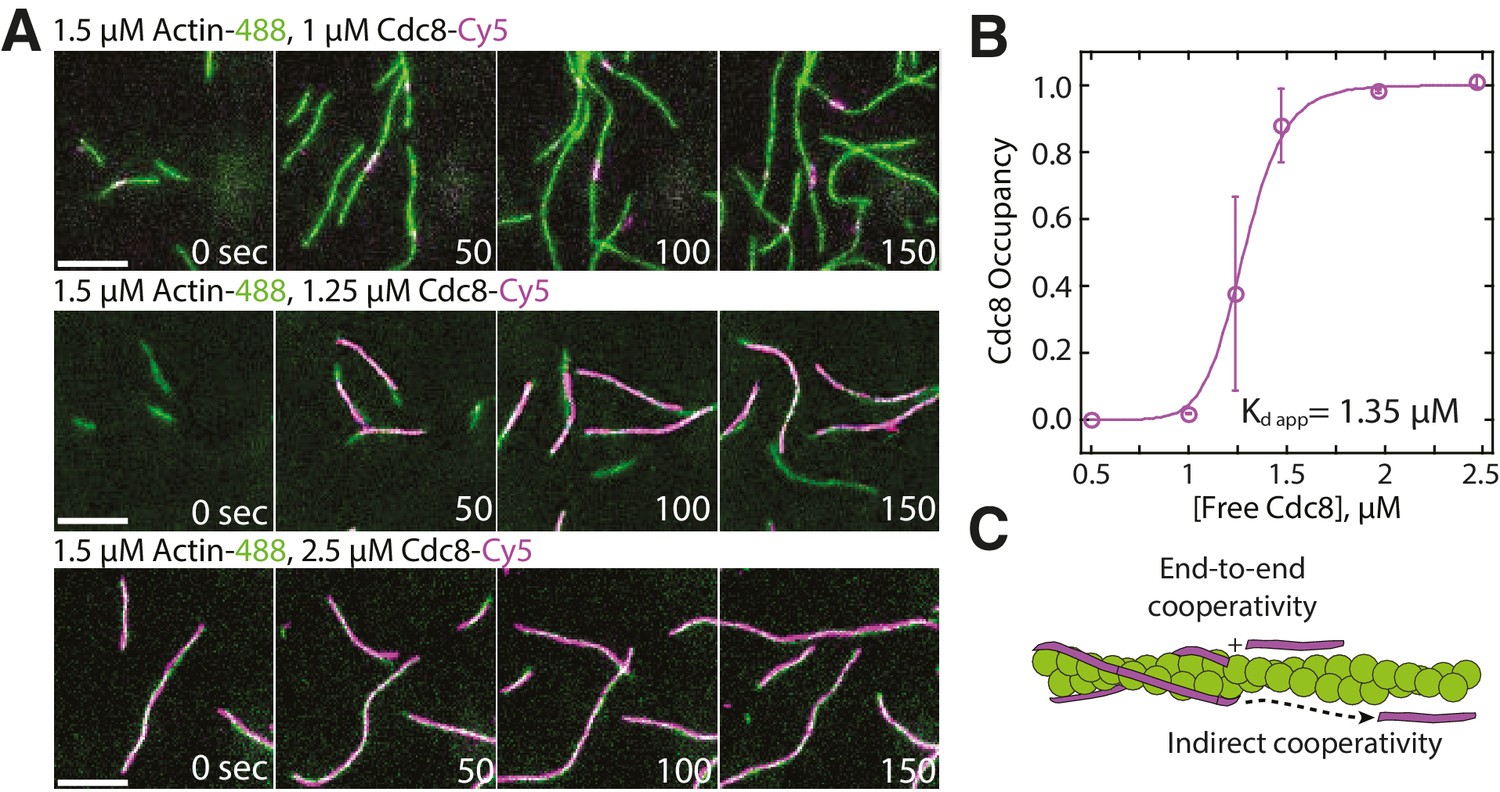
Tropomyosin Cdc8 loads cooperatively onto actin filaments.
(A) Two-color TIRFM of 1.5 μM Mg-ATP actin (15% Alexa 488 labeled) with a range of concentrations of tropomyosin Cdc8 (Cy5-labeled). Scale bar, 5 µm. (B) Plot of the fraction of actin filament bound by Cdc8 (‘Cdc8 occupancy’) over free Cdc8 dimer concentration. Data were fit to a Hill function, revealing a Hill coefficient >1 (Hill=14.6), that indicates cooperativity. Error bars represent standard error of the mean; n = 2 reactions. (C) Schematic of Cdc8 loading onto an actin filament. Observed cooperativity of Cdc8 could be the result of end-to-end binding of tropomyosin molecules (‘End-to-end cooperativity’) and/or indirect interactions between tropomyosin molecules via changes in the actin filament (‘Indirect cooperativity’).
Figure 1—figure supplement 1
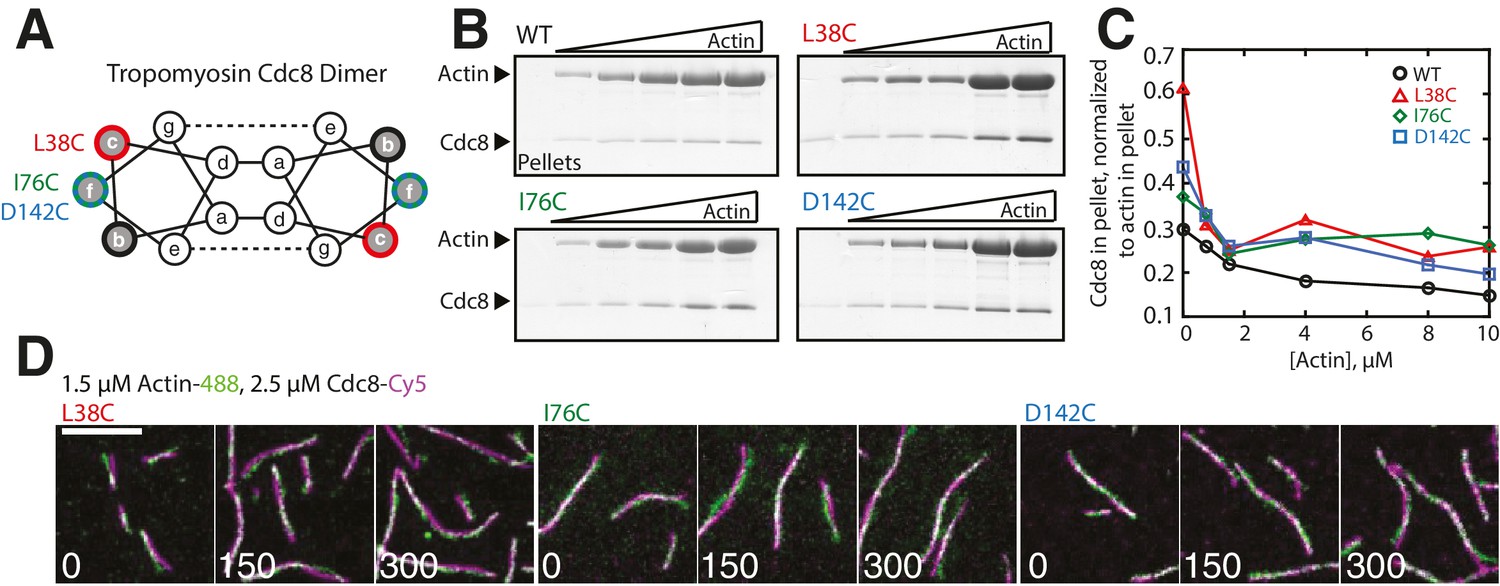
Characterization of Tropomyosin Cdc8 mutants L38C, I76C, and D142C in vitro.
(A) Characteristic tropomyosin coiled-coil heptad repeat organization. Residues with low sequence conservation localized at b-, c-, or f-sites on the outside of the coiled-coil were chosen for mutation to cysteine. (B–C) High-speed sedimentation assay of 1 μM of wild-type (WT) or mutant (L38C, I76C, or D142C) tropomyosin Cdc8 dimer binding to increasing (0–10 μM) concentrations of actin (B) and quantification of Cdc8 in pellet normalized to actin in pellet (C). (D) Two-color TIRFM of 1.5 μM Mg-ATP actin (15% Alexa 488-labeled) and 2.5 μM Cdc8 mutants L38C (left), I76C (middle), or D142C (right) (Cy5-labeled).
Figure 1—figure supplement 2
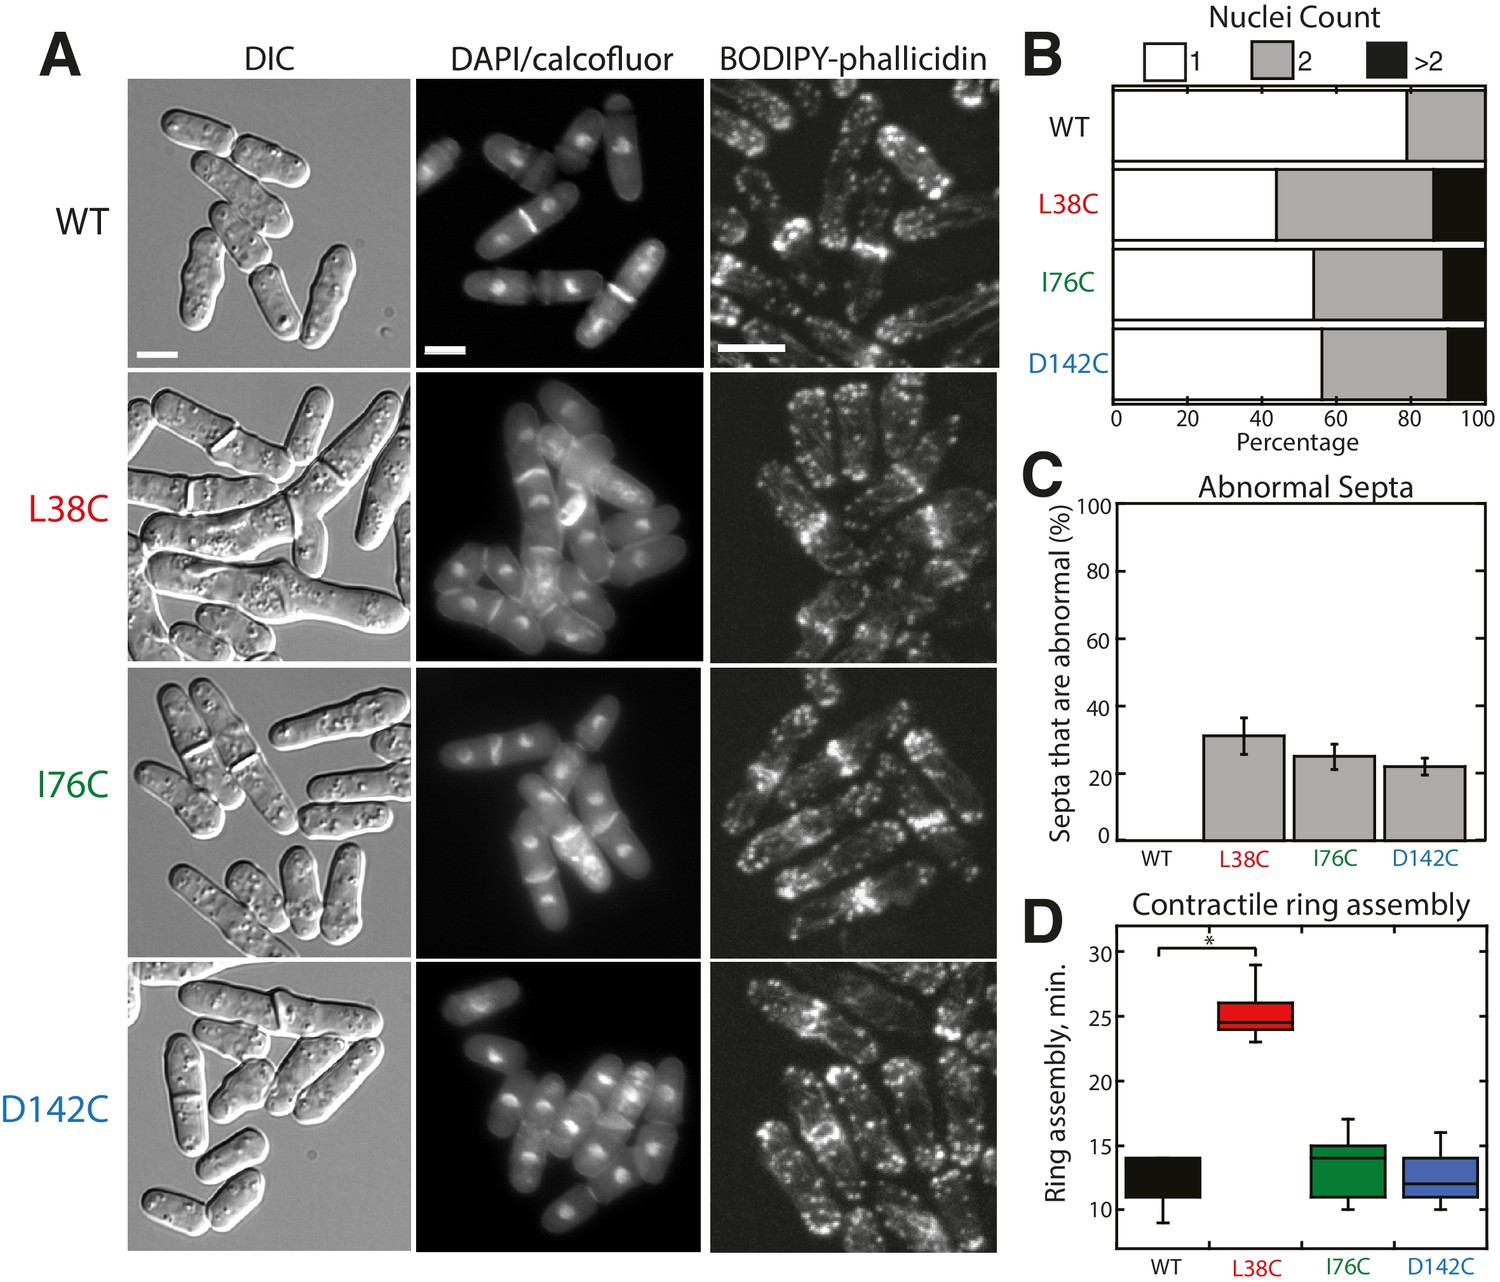
Characterization of Tropomyosin Cdc8 mutants L38C, I76C, and D142C in vivo.
(A) Morphology (DIC and DAPI/calcofluor) and actin organization (BODIPY-phallicidin) of cells with Cdc8 mutants replacing the endogenous cdc8 gene. Scale bars, 5 μm. (B–D) Quantification of the number of nuclei (B), abnormal septa (C), and the time of ring assembly (D) in cells expressing tropomyosin cdc8 mutants. Two-tailed t-tests for data sets with equal variance yielded p-values: WT vs. L38C: *p-value=1.80×10⁻¹⁰; WT vs. I76C: p-value=0.27, WT vs. D142C: p-value=0.57. n ≥ 10 cells for each condition.
Figure 2

Two distinct Tropomyosin Cdc8 cables load cooperatively onto a single actin filament.
(A–B) Two-color TIRFM of 1.5 μM Mg-ATP actin (15% Alexa 488) with 1.25 μM tropomyosin Cdc8 dimer (Cy5-labeled). (A) Timelapse of an elongating actin filament (left) and Cdc8 loading and spreading events (right). Scale bar, 5 μm. (B) Kymograph of the elongating actin filament and associated Cdc8 events. The first Cdc8 cable loading event (i), second Cdc8 cable loading event (ii), and Cdc8 cable spreading event (iii) are boxed. Scale bar, 5 μm. Time bar, 30 s. (C) Fluorescent images and corresponding fluorescence intensity line scans of actin (green) and Cdc8 (magenta) from the boxed regions in (B). Scale bar, 1 μm. (Ci) A single Cdc8 cable on an actin filament segment. The dotted line (1) marks one Cdc8 cable on the actin filament segment. (Cii) A second Cdc8 cable loading event on an actin filament. Dotted (1) and solid (2) lines mark the first and second tropomyosin cables on the actin filament segment. (Ciii) A spreading Cdc8 cable. Arrows denote spreading direction of first (dotted line, 1) and second (solid line (2) Cdc8 cables. Scale bars, 1 µm.
Figure 3 with 1 supplement
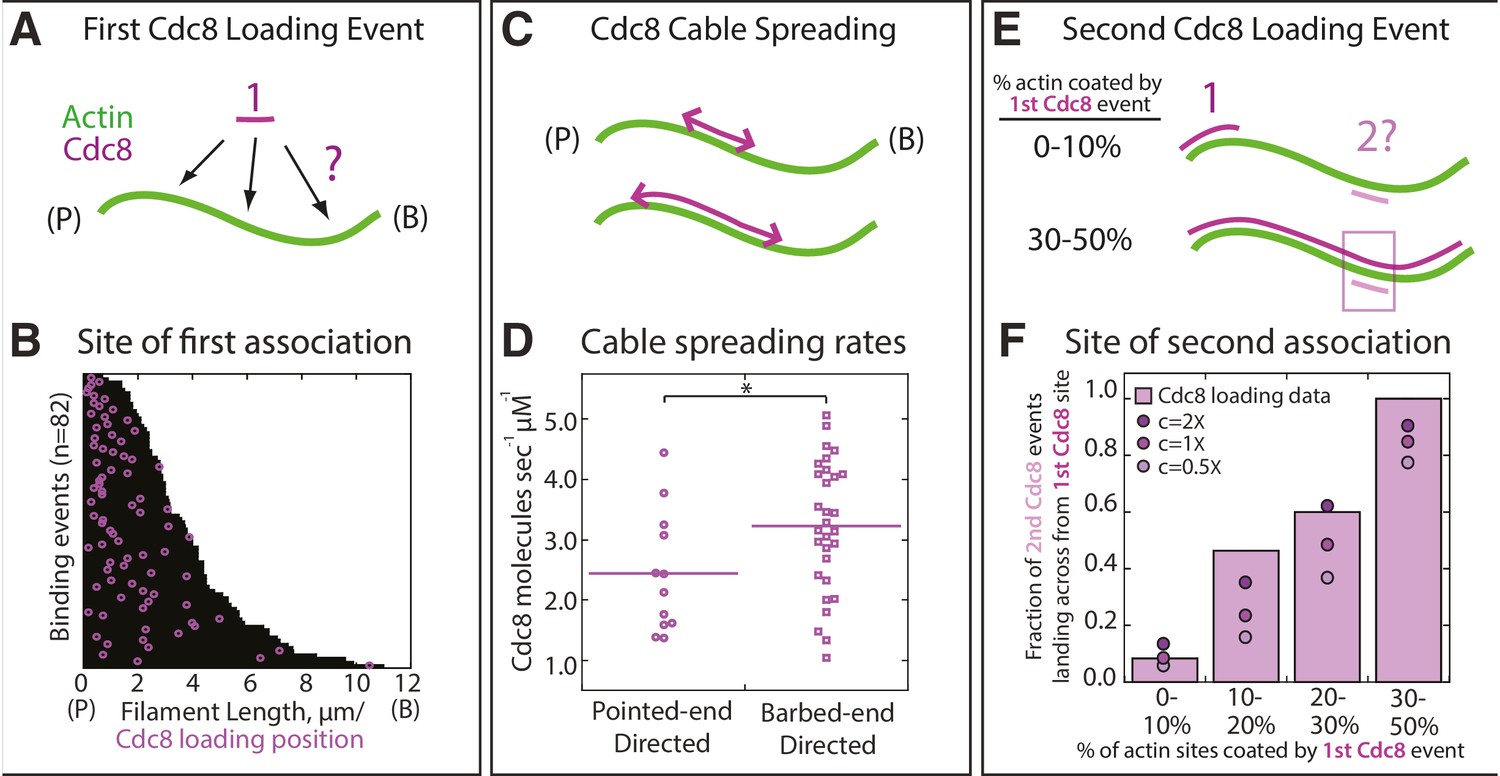
Quantification of loading and spreading of first and second Tropomyosin Cdc8 cables.
Two-color TIRFM of 1.5 μM Mg-ATP actin (15% Alexa 488) with 1.25 μM tropomyosin Cdc8 dimer (Cy5-labeled). (A) Depiction of potential sites for the first Cdc8 loading event. The actin filament and Cdc8 molecule are depicted by green and purple lines, respectively. (B) Plot of the first Cdc8 association event (purple circles) on actin filaments (black lines), with F-actin pointed ends (P) aligned at the left. n = 82 events. (C) Depiction of Cdc8 cable spreading toward the barbed (B) and pointed (P) ends of actin filaments. (D) Spreading rates of Cdc8 cables toward the barbed or pointed end. Purple line denotes mean. Two-tailed t-test for data sets with equal variance yielded p-value *p=0.037. n > 12 elongation events. (E) Depiction of site of second Cdc8 loading event, which can occur at a naked actin site (top cartoon) or across from the first-bound Cdc8 cable (bottom cartoon). The larger percentage of the F-actin surface coated by the initial Cdc8 cable (1) increases the probability that the second Cdc8 cable (2) will associate across from a site already bound by Cdc8. (F) Plot of the fraction of second Cdc8 events that associate with a F-actin site already coated by Cdc8, binned by percentage of F-actin already coated by Cdc8 (light purple bars). n = 38 events. Modeling of predicted degree of association given no indirect cooperativity (c = 1X, purple circles), positive indirect cooperativity (c = 2X, dark purple circles), and negative indirect cooperativity (c = 0.5X, light purple circles).
Figure 3—figure supplement 1
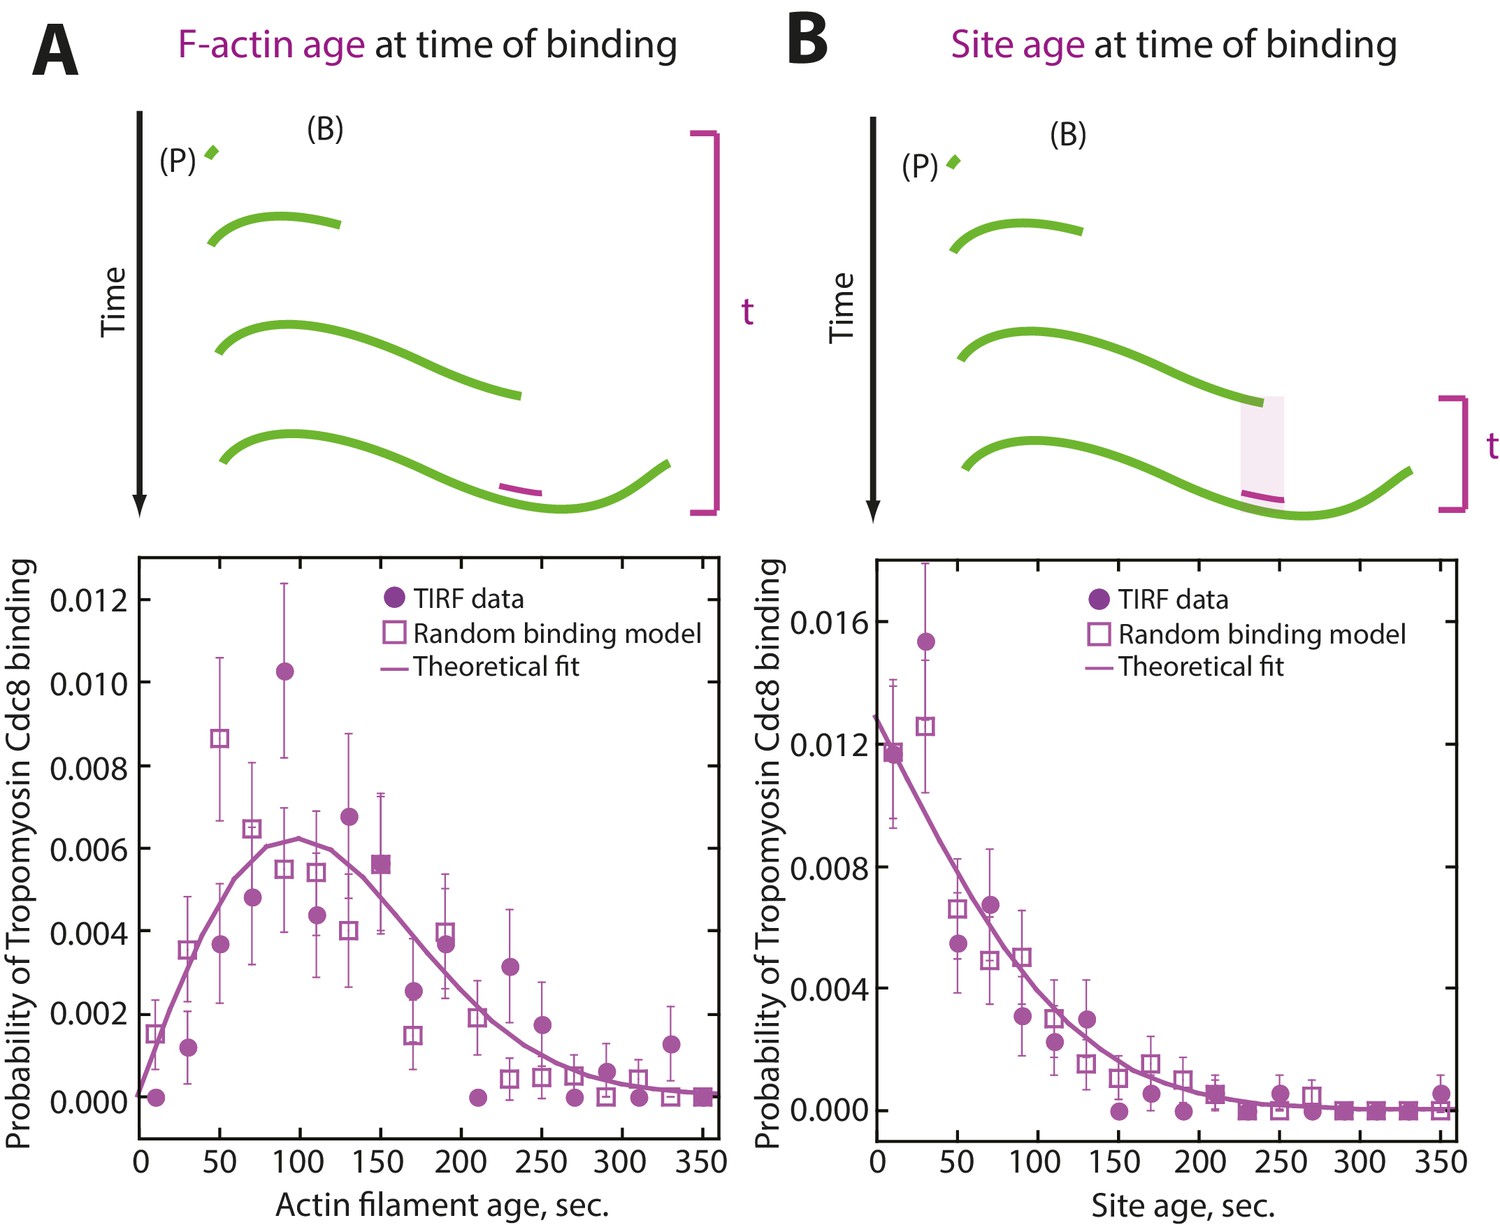
Tropomyosin Cdc8 first-binding events are consistent with random binding.
(A–B) Modeling of random binding compared to experimental data of first tropomyosin Cdc8 binding events. Experimental TIRFM data (purple filled circles), theoretical fit of random binding (purple line) and random binding model with generated noise (purple open square). (A) (Top) Depiction of actin filament age at time of initial Cdc8 binding. (Bottom) Analysis and modeling of age of the actin filament at time of initial Cdc8 binding. (B) (Top) Depiction of age of site first bound by Cdc8 at time of Cdc8 binding. (Bottom) Analysis and modeling of age of Cdc8-bound site at the time of binding.
Figure 4 with 1 supplement
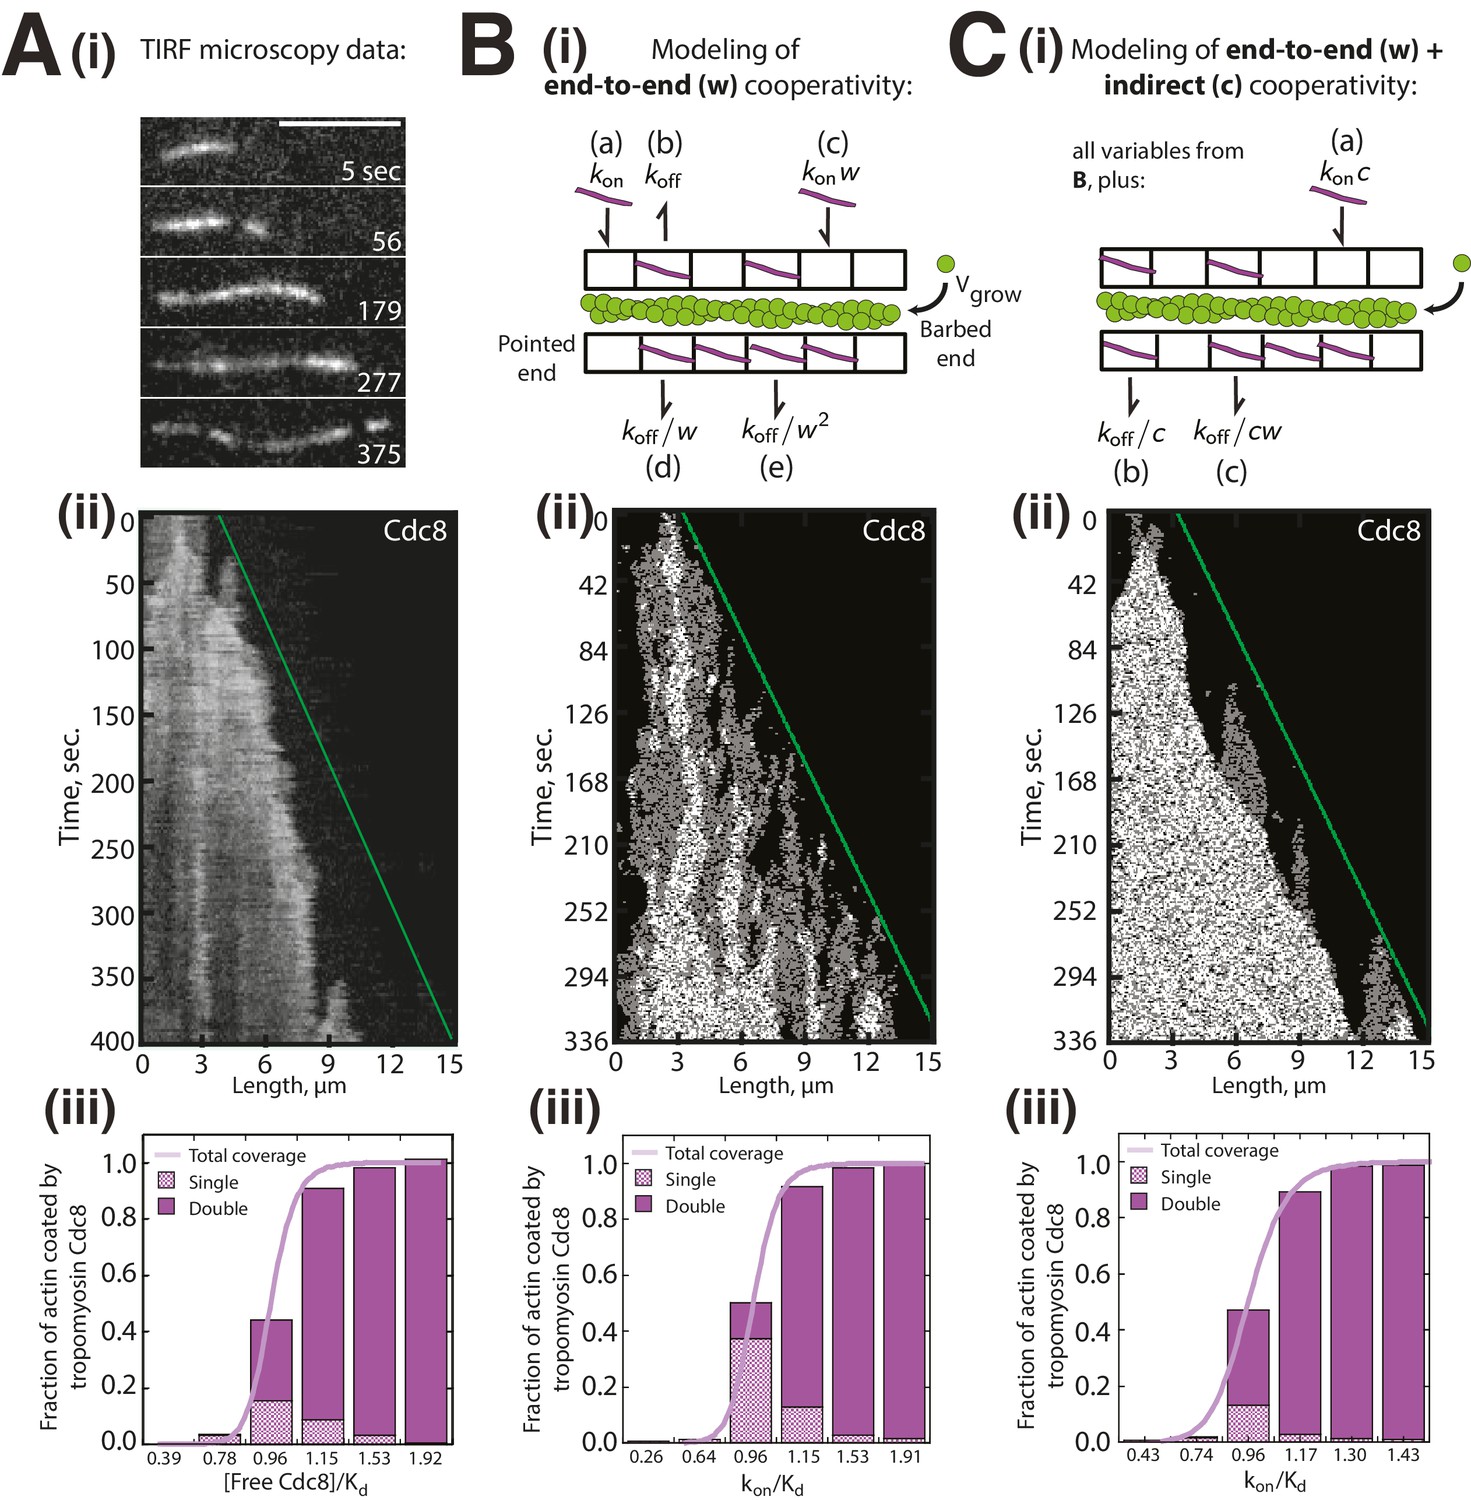
Modeling of Tropomyosin Cdc8 dynamics on growing actin filaments.
(Ai-iii) Two-color TIRFM of 1.5 μM Mg-ATP actin (15% Alexa 488) with 1.25 μM tropomyosin Cdc8 dimer (Cy5-labeled). (Ai-ii) Timelapse and corresponding kymograph of Cdc8 loading and spreading. The green line indicates the actin filament barbed end. Scale bar, 5 μm. (Aiii) Quantification of the fraction of F-actin coated by one (Single, checkered purple) or two (Double, solid purple) Cdc8 cables. Total coverage (purple line) is from initial quantification in Figure 1B. Hill=14.6. n = 2 reactions. (Bi-iii) Modeling of Cdc8 association with an actin filament with exclusively end-to-end interactions. (Bi) Lattice model schematic with parameters for actin elongation (vgrow), rates of association (kon, (a)) or dissociation (koff, (b)) of single Cdc8 molecules with the actin filament, and rates of association (kon*w (c), kon*w2) and dissociation (koff/w (d), koff/w2 (e)) at sites within a Cdc8 cable. (Bii) Kymograph of simulated loading and spreading of modeled Cdc8 under parameters in (Bi). The green line indicates the actin filament barbed end. (Biii) Quantification of simulated data from end-to-end cooperativity model. Hill=14.9. (Ci-iii) Modeling of Cdc8 association with an actin filament that includes both end-to-end interactions and indirect cooperativity. (Ci) Schematic of lattice model, which includes all parameters from (B) as well as additional parameters added for (C): rates of association (kon*c, (a)) and dissociation (koff/c, (b)) of Cdc8 molecules across from a site already bound by a Cdc8 molecule, and rates of association (koff*cw) and dissociation (koff/cw (c)) of Cdc8 molecules within a cable and across from an already-bound Cdc8. (Cii) Kymograph of simulated loading and spreading of modeled Cdc8 under parameters in (Ci). (Ciii) Quantification of simulated data from end-to-end with indirect cooperativity model. Hill=13.4.
Figure 4—figure supplement 1
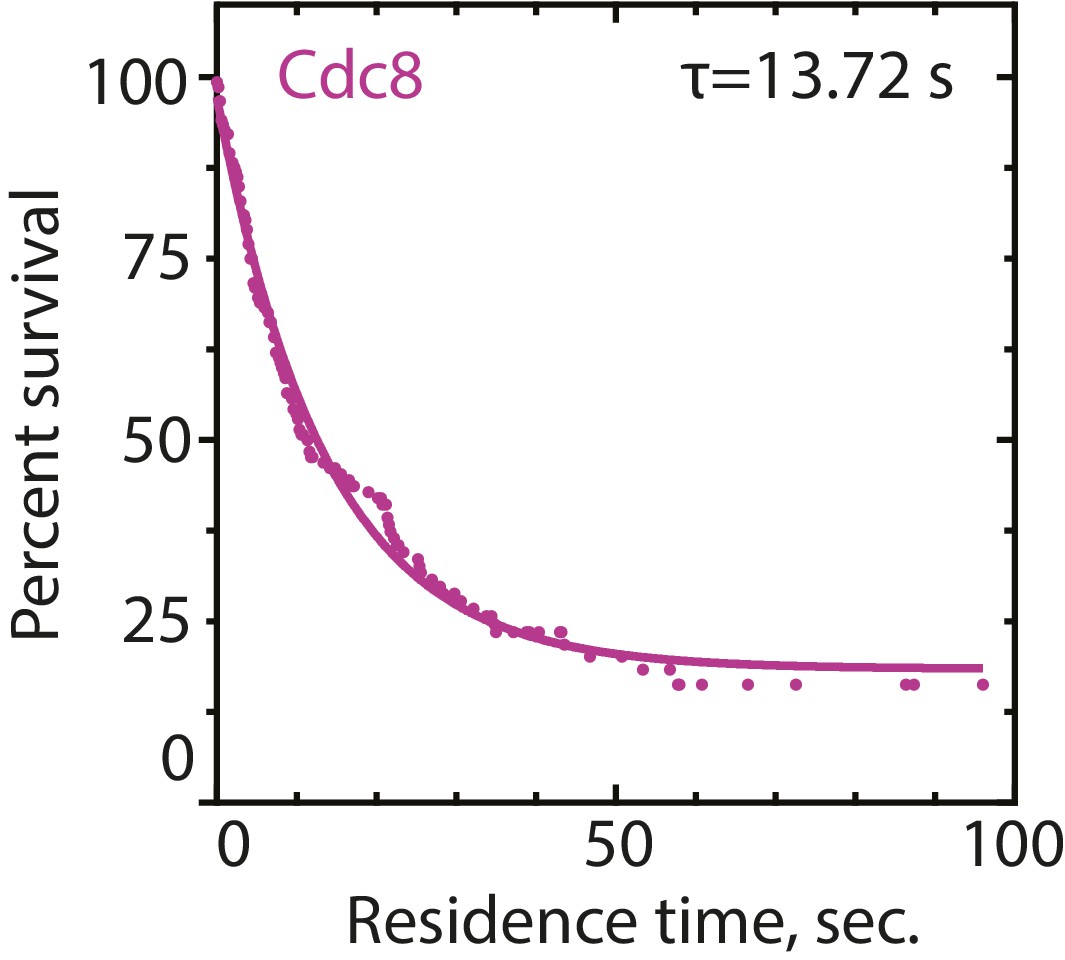
Residence time of tropomyosin Cdc8 on actin filaments.
Three-color TIRFM of 1.5 μM Mg-ATP actin (15% Alexa 488-labeled) and 2.5 μM tropomyosin Cdc8 (0.5% TMR-labeled and 30% Cy5-labeled). Residence time of single Cdc8-TMR molecules on F-actin was quantified in the presence of Cdc8-Cy5 in order to determine that full Cdc8 coverage of F-actin occurred. n = 102 events.
Figure 5
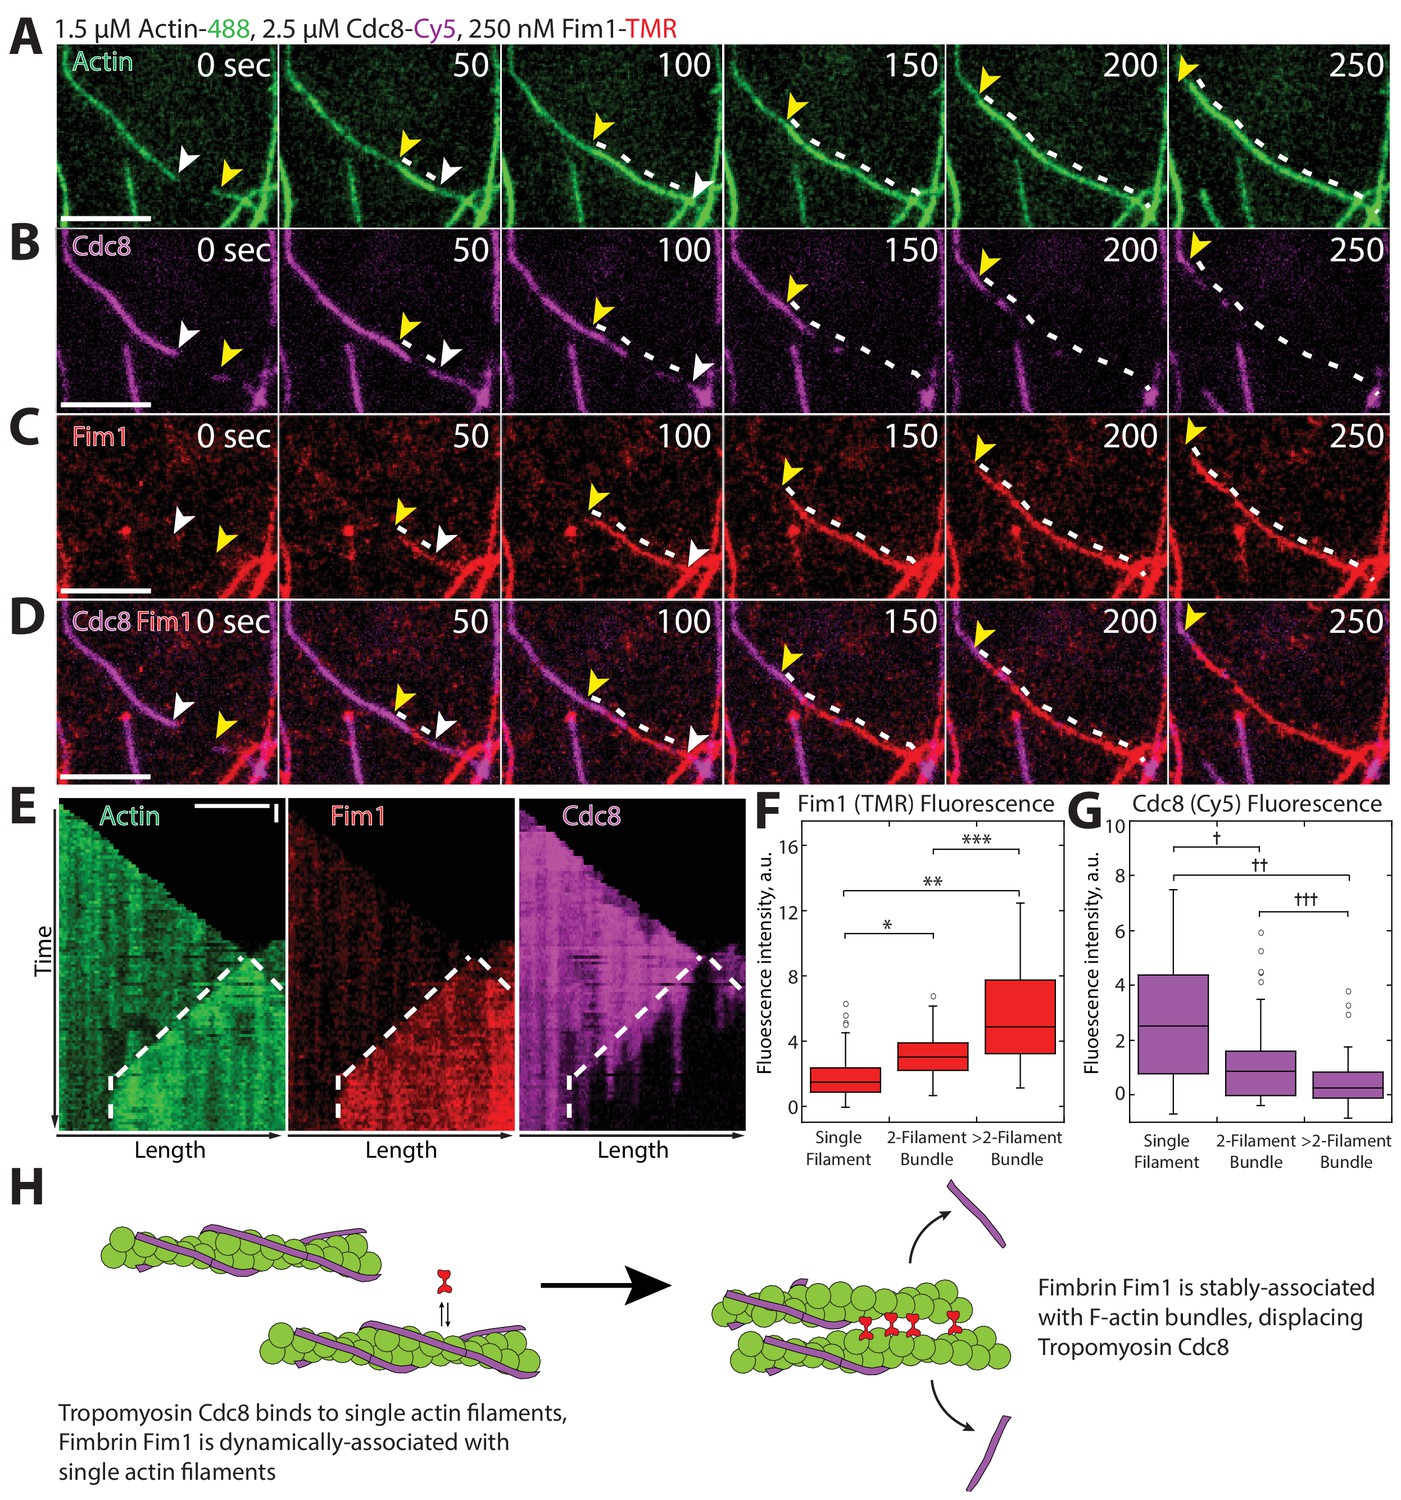
Fimbrin Fim1-mediated bundling induces cooperative removal of Tropomyosin Cdc8.
(A–E) Timelapse of three-color TIRFM of 1.5 μM Mg-ATP actin (15% Alexa 488-labeled) with 2.5 μM tropomyosin Cdc8 (Cy5-labeled) and 250 nM fimbrin Fim1 (TMR-labeled). Arrowheads and dotted line mark actin filament barbed ends and bundled region, respectively. (E) Kymographs of actin, Fim1, and Cdc8 during bundle formation. Dotted lines indicate the bundled region. Scale bars, 5 μm. Time bar, 30 s. (F–G) Box plots of the amount of Fim1-TMR (F) or Cdc8-Cy5 (G) fluorescence on single actin filaments, two-filament bundles, or bundles containing more than two filaments. Open circles indicate outliers. Two-tailed t-tests for data sets with unequal variance yielded p-values: *p-value=4.67 × 10⁻¹⁰, **p-value=4.74 × 10⁻¹¹, ***p-value=1.38 × 10⁻⁵, †p-value=4.52 × 10⁻⁷, ††p-value=1.16 × 10⁻¹², †††p-value=0.01. n > 42 measurements. (H) Cartoon model of how Fim1 and Cdc8 affect each other’s association with single and bundled actin filaments.
Figure 6 with 1 supplement

Tropomyosin Cdc8 inhibits initial binding of ADF/cofilin Adf1 to actin filaments.
(A–C) Two-color TIRFM of 1.5 μM Mg-ATP actin (15% Alexa 488 labeled) with 5 μM ADF/cofilin Adf1 (TMR-labeled) in the presence or absence of 2.5 μM tropomyosin Cdc8 (unlabeled). (A) Micrograph of Adf1 association with actin filaments in the absence or presence of Cdc8. (B) Kymograph of an elongating actin filament (top) and associated Adf1 (bottom) in the absence or presence of unlabeled Cdc8. Scale bar, 5 μm. Time bar, 30 s. (C) Box plot of average Adf1 fluorescence intensity on actin filaments in the absence or presence of unlabeled Cdc8. Open circles indicate outliers. Two-tailed t-test for data sets with unequal variance yielded *p-value: 6.77 × 10−82. n ≥ 145 measurements. (D) Residence time of single Adf1 (TMR-labeled) molecules in the absence or presence of unlabeled Cdc8. n ≥ 81 events. (E–F) Three-color TIRFM of 1.5 μM Mg-ATP actin (15% Alexa 488 labeled) with 5 μM Adf1 (TMR-labeled) and 2.5 μM Cdc8 (Cy5-labeled). (E) Micrograph of actin filaments associated with Adf1 and Cdc8. Scale bar, 5 μm. (F) Timelapse of Adf1 association with an actin filament, and subsequent dissociation of Cdc8. Scale bar, 5 μm. Time in sec. (G) Cartoon model of how Cdc8 and Adf1 affect each other’s association with F-actin.
Figure 6—figure supplement 1
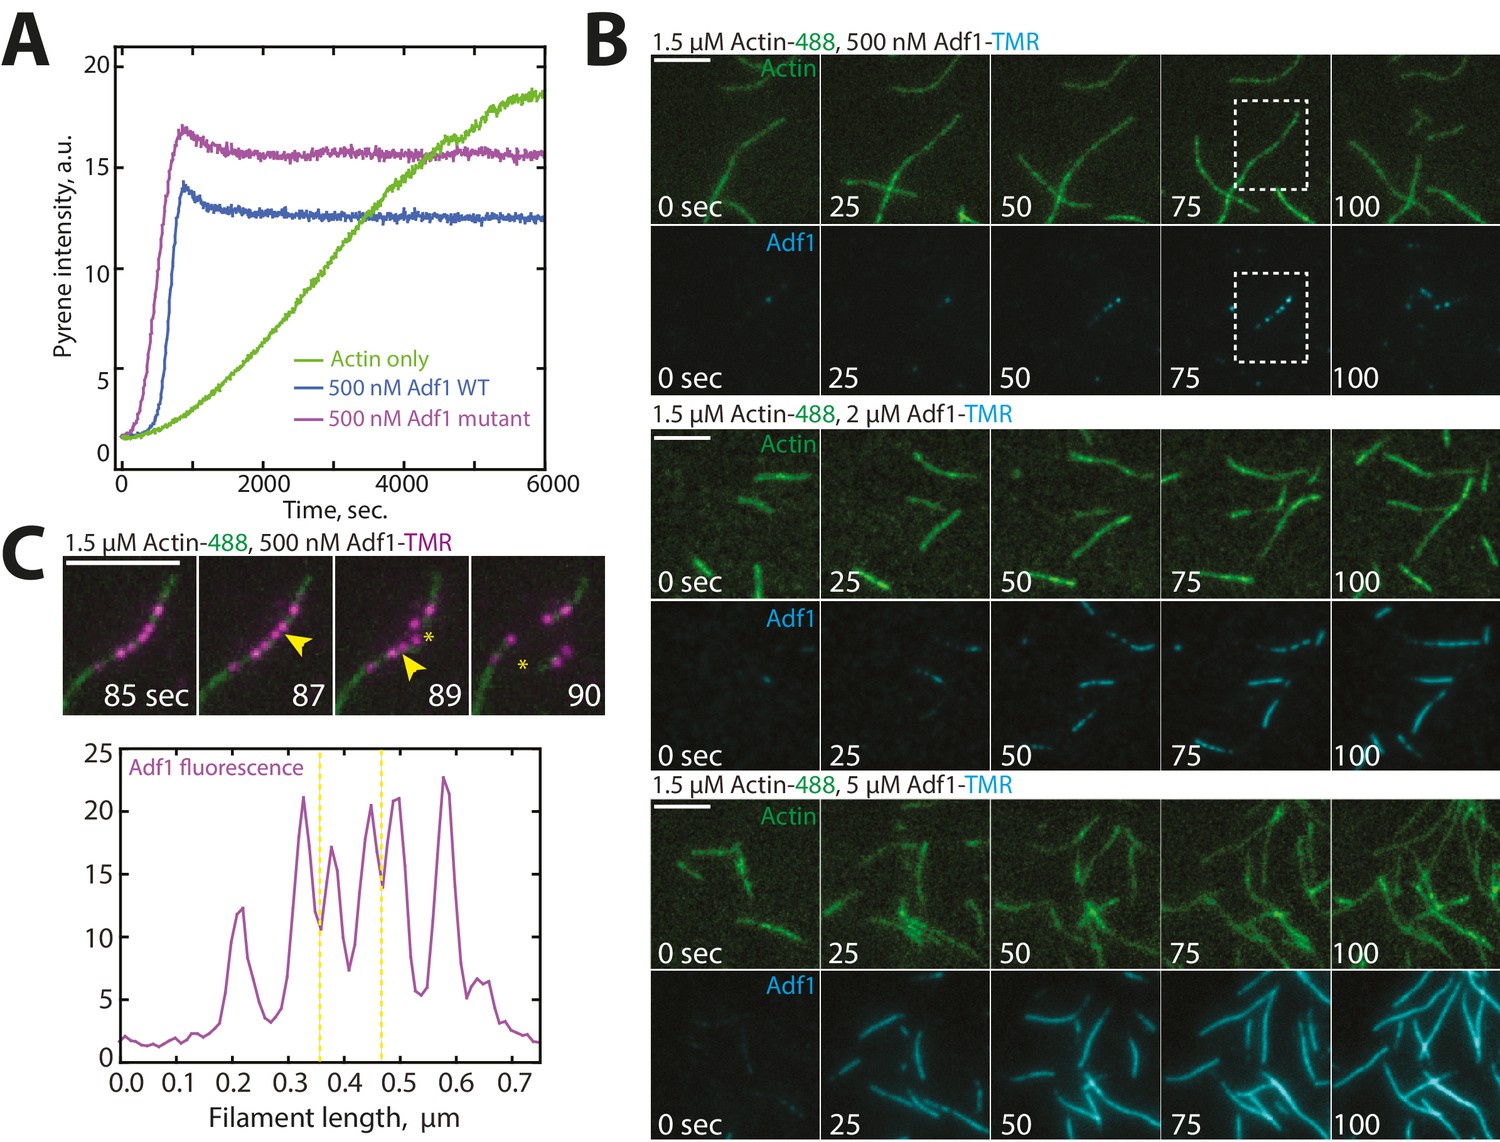
Characterization of Cofilin Adf1 labeling mutant.
(A) Spontaneous assembly assay of 1.5 μM actin (10% pyrene-labeled) and 50 or 500 nM of WT Adf1 (green lines) or Adf1 labeling mutant (blue lines). (C) Actin filament severing occurs at Adf1 boundaries. (B) Two-color TIRFM of 1.5 μM Mg-ATP actin (15% Alexa 488) with a range of concentrations of cofilin Adf1 mutant (C12S, C62A, D34C) (TMR-labeled). Scale bar, 5 μm. (C) (Top) Two-color TIRF microscopy of 1.5 μM Mg-ATP actin (15% Alexa 488) 500 nM Adf1 mutant (C12S, C62A, D34C) (TMR-labeled). Yellow arrowhead and asterisks indicate future sites of severing and severing events, respectively. Scale bar, 5 μm. (Bottom) Linescan of Adf1 fluorescence (purple) along actin filament before severing. Yellow dotted line indicates sites of severing.
Figure 7
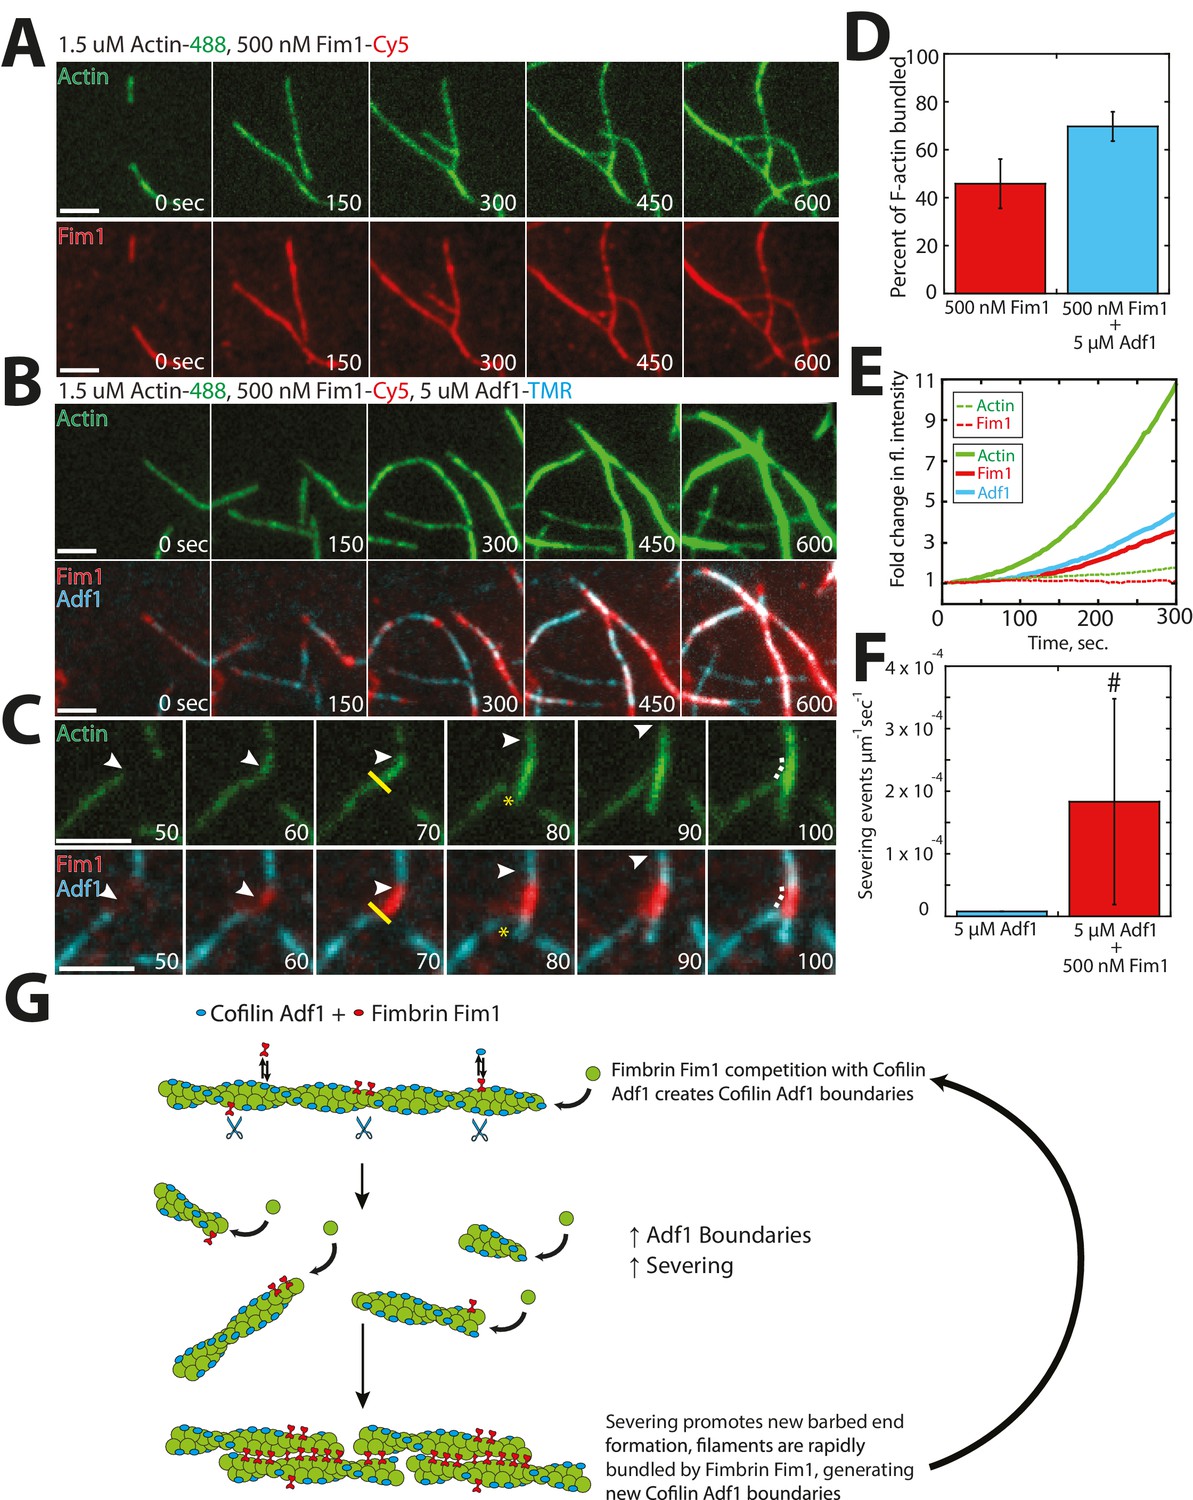
Fimbrin Fim1 and ADF/cofilin Adf1 competition generates a dense F-actin network.
(A) Timelapse of two-color TIRFM of 1.5 μM Mg-ATP actin (15% Alexa 488-labeled) with 500 nM fimbrin Fim1 (Cy5-labeled). (B) Timelapse of three-color TIRFM of 1.5 μM Mg-ATP actin (15% Alexa 488-labeled) with 500 nM Fim1 (Cy5-labeled) and 5 μM ADF/cofilin Adf1. (C) Timelapse showing severing at the boundary between a Fim1-mediated bundle and a single actin filament. White arrow indicates the elongating actin filament barbed end. A yellow line and asterisk indicate the severing site and severing event, respectively. (D) Quantification of percent of total actin filaments bundled with Fim1 alone or Fim1 and Adf1. Error bars represent standard deviation of the mean; n = 2 reactions. (E) Fold-change over time in total fluorescence intensity for either actin (dotted green line) and Fim1 (dotted red line) in the absence of Adf1, or for actin (solid green line), Fim1 (solid red line), and Adf1 (solid blue line) in the presence of Adf1. (F) Severing rate of high concentrations of Adf1 alone or in the presence of Fim1. # indicates under-reporting, as severing events could not be measured on dense bundles. Error bars represent standard deviation of the mean; n = 2 reactions. (G) Cartoon model of how Adf1 and Fim1 influence each other’s interactions with actin and affect F-actin network formation.
Figure 8
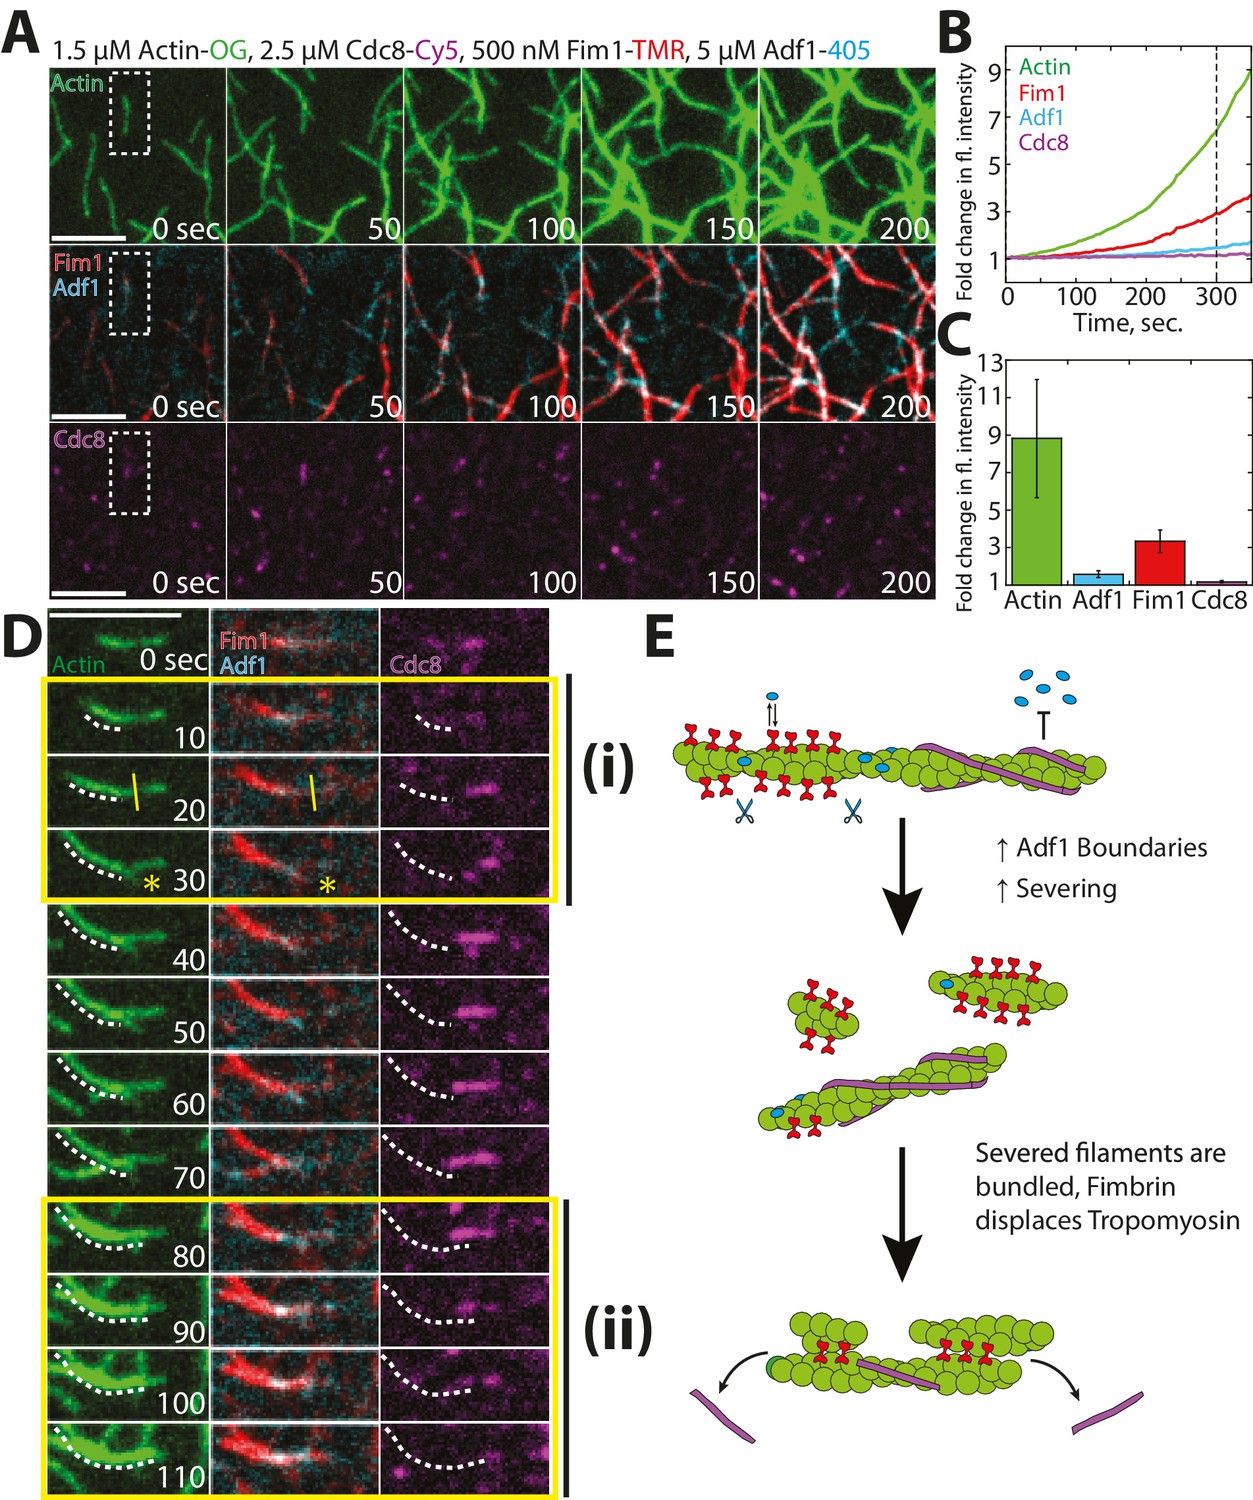
Competitive interactions between Cofilin Adf1 and Fimbrin Fim1 result in rapid displacement of Tropomyosin Cdc8 from F-actin networks.
(A–D) Four-color TIRFM of 1.5 μM Mg-ATP actin (15% Alexa 488 labeled) with 2.5 μM tropomyosin Cdc8 (Cy5-labeled), 500 nM fimbrin Fim1 (TMR-labeled), and 5 μM cofilin Adf1 (Alexa 405-labeled). (A) Timelapse of F-actin network generation in the presence of actin (green), Fim1 (red), Adf1 (cyan), and Cdc8 (magenta). (B) Fold-change over time in fluorescence intensity of actin (green line), Fim1 (red line), Adf1 (blue line), and Cdc8 (purple line). (C) Fold change in fluorescence intensity of each ABP after 300 s. Error bars represent standard deviation of the mean. n = 2 independent experiments. (D) Enlargement of the area within the dotted box in (A). Fim1 and Adf1 synergize to create a dense F-actin bundle (white dotted line), while Cdc8 associates with a single actin filament. Severing occurs at the boundary of the single actin filament and F-actin bundle (i, yellow asterisk), creating a new elongating F-actin barbed end. The bundle extends to incorporate the single actin filament and Cdc8 is displaced (ii). Scale bar, 5 μm. (E) Cartoon model of events occurring in (D).
Videos
Video 1
Tropomyosin Cdc8 loads cooperatively onto F-actin, related to Figure 1.
Two-color TIRF microscopy of 1.5 μM actin (Alexa-488 labeled) with a range of concentrations of tropomyosin Cdc8 (Cy5-labeled). Scale bar, 5 μm. Time in sec.
Video 2
Two distinct cables of Tropomyosin Cdc8 load onto a single actin filament, related to Figure 2.
Two-color TIRF microscopy of 1.5 μM actin (Alexa-488 labeled) with 1.25 μM tropomyosin Cdc8 (Cy5-labeled). Green arrowhead indicates elongating F-actin barbed end. Purple arrowhead indicates the loading and spreading of Cdc8 cables. Scale bar, 5 μm. Time in sec.
Video 3
Fimbrin Fim1 actively displaces Tropomyosin Cdc8 from F-actin bundles, related to Figure 5.
Three-color TIRF microscopy of 1.5 μM actin (Alexa-488 labeled) with 250 nM fimbrin Fim1 (TMR-labeled) and 2.5 μM tropomyosin Cdc8 (Cy5-labeled). Arrowheads indicating two distinct F-actin elongating barbed ends. Scale bar, 5 μm. Time in sec.
Video 4
Tropomyosin Cdc8 prevents initial association of Cofilin Adf1 with F-actin.
Two-color TIRF microscopy of 1.5 μM actin (Alexa-488 labeled) with 5 μM cofilin Adf1 (TMR-labeled). Scale bar, 5 μm. Time in sec.
Video 5
Fimbrin Fim1 and Cofilin Adf1 synergize to generate a dense F-actin network, related to Figure 7.
Three-color TIRF microscopy of 1.5 μM actin (Alexa-488 labeled) with 500 nM fimbrin Fim1 (Cy5-labeled) and 5 μM cofilin Adf1 (TMR-labeled). Arrowheads indicate sites of severing. Scale bar, 5 μm. Time in sec.
Video 6
Fimbrin Fim1 and Cofilin Adf1 work together to displace Tropomyosin Cdc8 from the F-actin network.
Four-color TIRF microscopy of 1.5 μM actin (Alexa 488-labeled) with 500 nM fimbrin Fim1 (TMR-labeled), 2.5 μM tropomyosin Cdc8 (Cy5-labeled) and 5 μM cofilin Adf1 (Alexa 405-labeled). Scale bar, 5 μm. Time in sec.
Tables
Table 1
Fission yeast strains used in this study
| Strain name | Genotype | Reference |
|---|---|---|
| FY527 | h-, leu1-32, his3-D1, ura4-D18, ade6-M216 | Forsburg lab |
| MBY6663 | h+, pAct1 Lifeact-GFP::Leu+; ade6-m216; leu1-32; ura4-D18 | Huang et al. (2012) |
| KV920 | h?, cdc8-D142C::KanMX6, ade6-m216; ura4-D18 | This study |
| KV921 | h?, cdc8-I76C::KanMX6, ade6-m216; ura4-D18 | This study |
| KV922 | h?, cdc8-L38C::KanMX6, ade6-m216; ura4-D18 | This study |
| KV969 | h? cdc8-I76C::KanMX6, pAct1 Lifeact-GFP::Leu+, ade6-m216; ura4-D18 | This study |
| KV970 | h? cdc8-D142C::KanMX6, pAct1 Lifeact-GFP::Leu+, ade6-m216; ura4-D18 | This study |
| KV971 | h? cdc8-L38C::KanMX6, pAct1 Lifeact-GFP::Leu+, ade6-m216; ura4-D18 | This study |
Download links
A two-part list of links to download the article, or parts of the article, in various formats.
Downloads (link to download the article as PDF)
Open citations (links to open the citations from this article in various online reference manager services)
Cite this article (links to download the citations from this article in formats compatible with various reference manager tools)
Competition between Tropomyosin, Fimbrin, and ADF/Cofilin drives their sorting to distinct actin filament networks
eLife 6:e23152.
https://doi.org/10.7554/eLife.23152


