Gene regulatory network plasticity predates a switch in function of a conserved transcription regulator
- University of California, United States
Figures
Figure 1 with 4 supplements
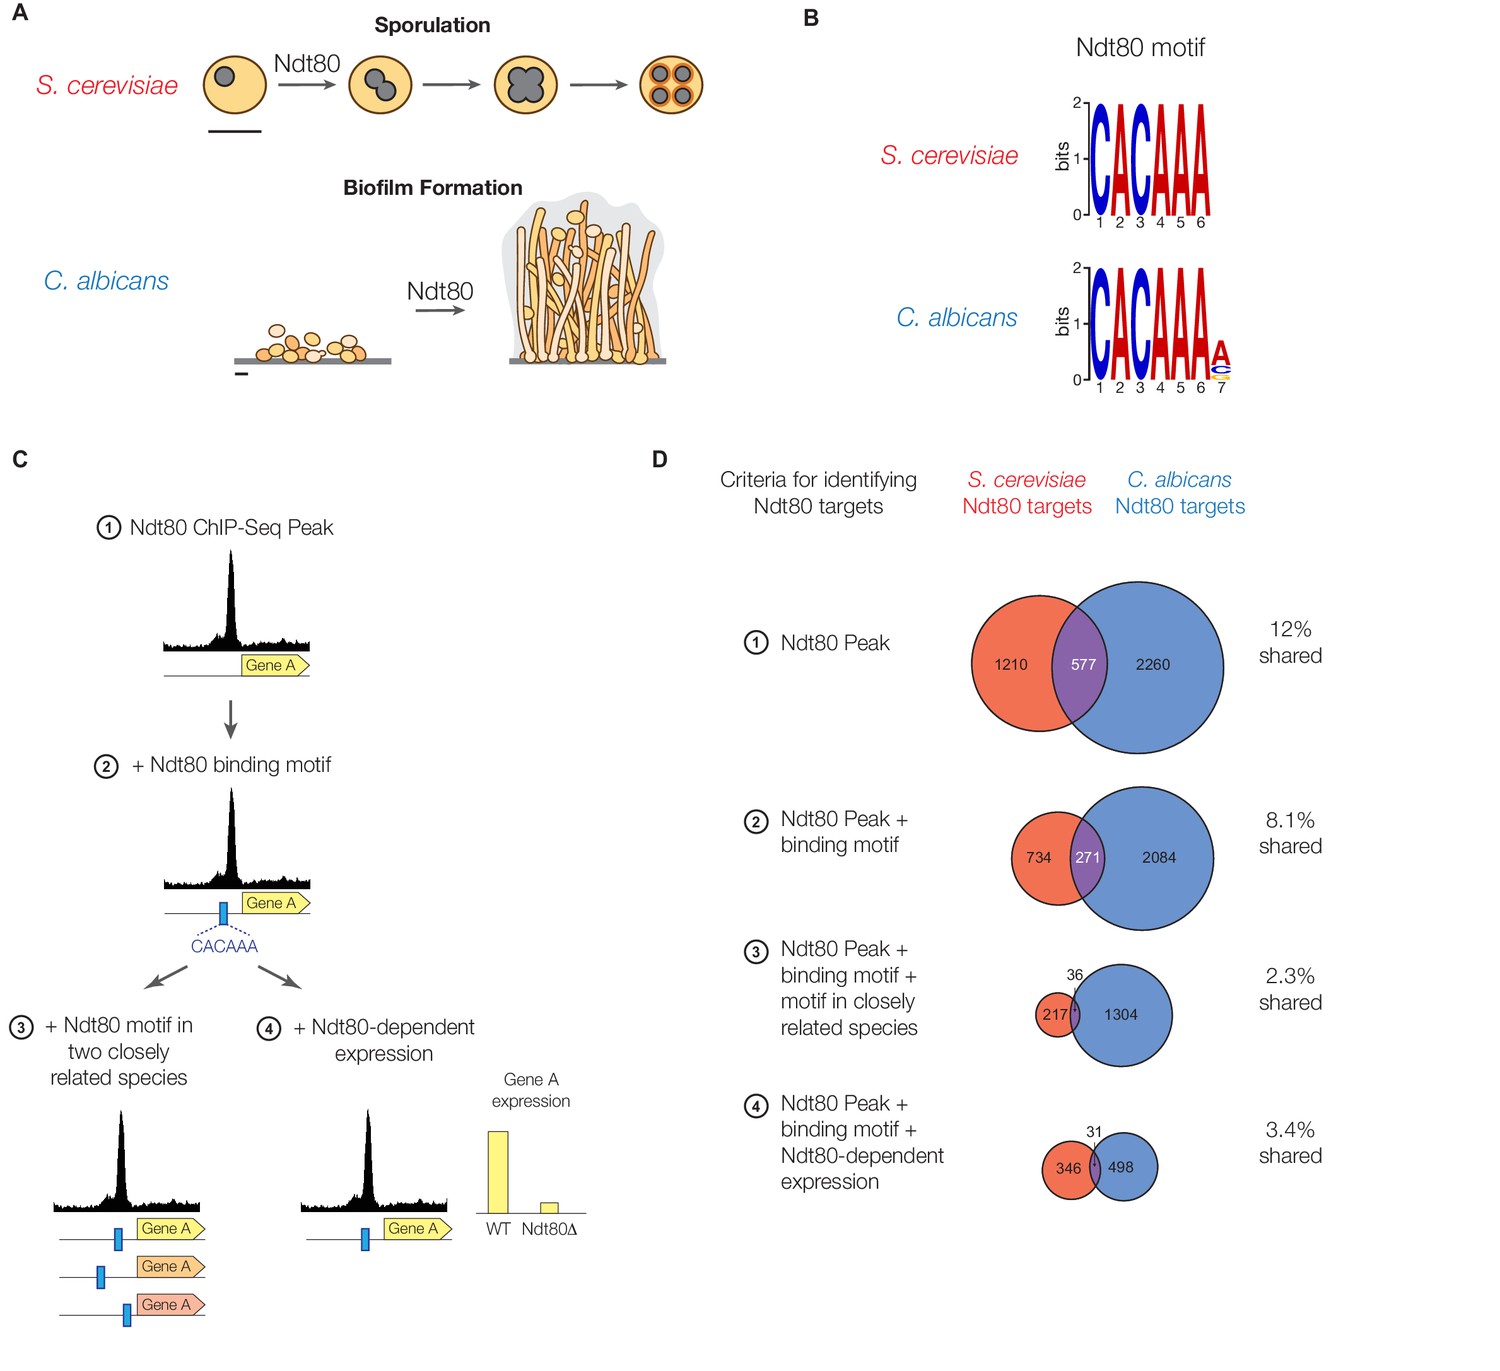
Ndt80 target genes differ between S. cerevisiae and C. albicans.
(A) Diagram of sporulation in S. cerevisiae and biofilm formation in C. albicans. Scale bars represent 5 µm. (B) The cis-regulatory motif most highly enriched at locations of Ndt80 ChIP binding in S. cerevisiae and C. albicans. Motifs were generated independently for each species using DREME. The Ndt80 motifs determined de novo in this study closely match those identified previously for Ndt80 (Chu and Herskowitz, 1998; Jolly et al., 2005; Nobile et al., 2012). (C) Diagram of the four criteria used to identify Ndt80 regulatory targets. Criteria 1: significant ChIP-Seq enrichment in the intergenic region upstream of a gene relative to untagged control experiments. Criteria 2: ChIP-Seq enrichment and the presence of an Ndt80 motif in the intergenic region. Criteria 3: ChIP-Seq enrichment with the Ndt80 motif present in the intergenic region and also in orthologous intergenic regions of two very closely related species, suggesting the motif has been maintained by selection. Criteria 4: ChIP-Seq enrichment with the Ndt80 motif present in the intergenic region and Ndt80-dependent expression of the nearby gene, indicating that expression of the gene is under Ndt80 control. (D) Overlap in targets of S. cerevisiae Ndt80 (red) and C. albicans Ndt80B (blue), using the four different criteria from (C) to identify targets, when Ndt80 is highly expressed in each species (Materials and methods). Venn diagrams are roughly area-proportional (Hulsen et al., 2008).
Figure 1—figure supplement 1

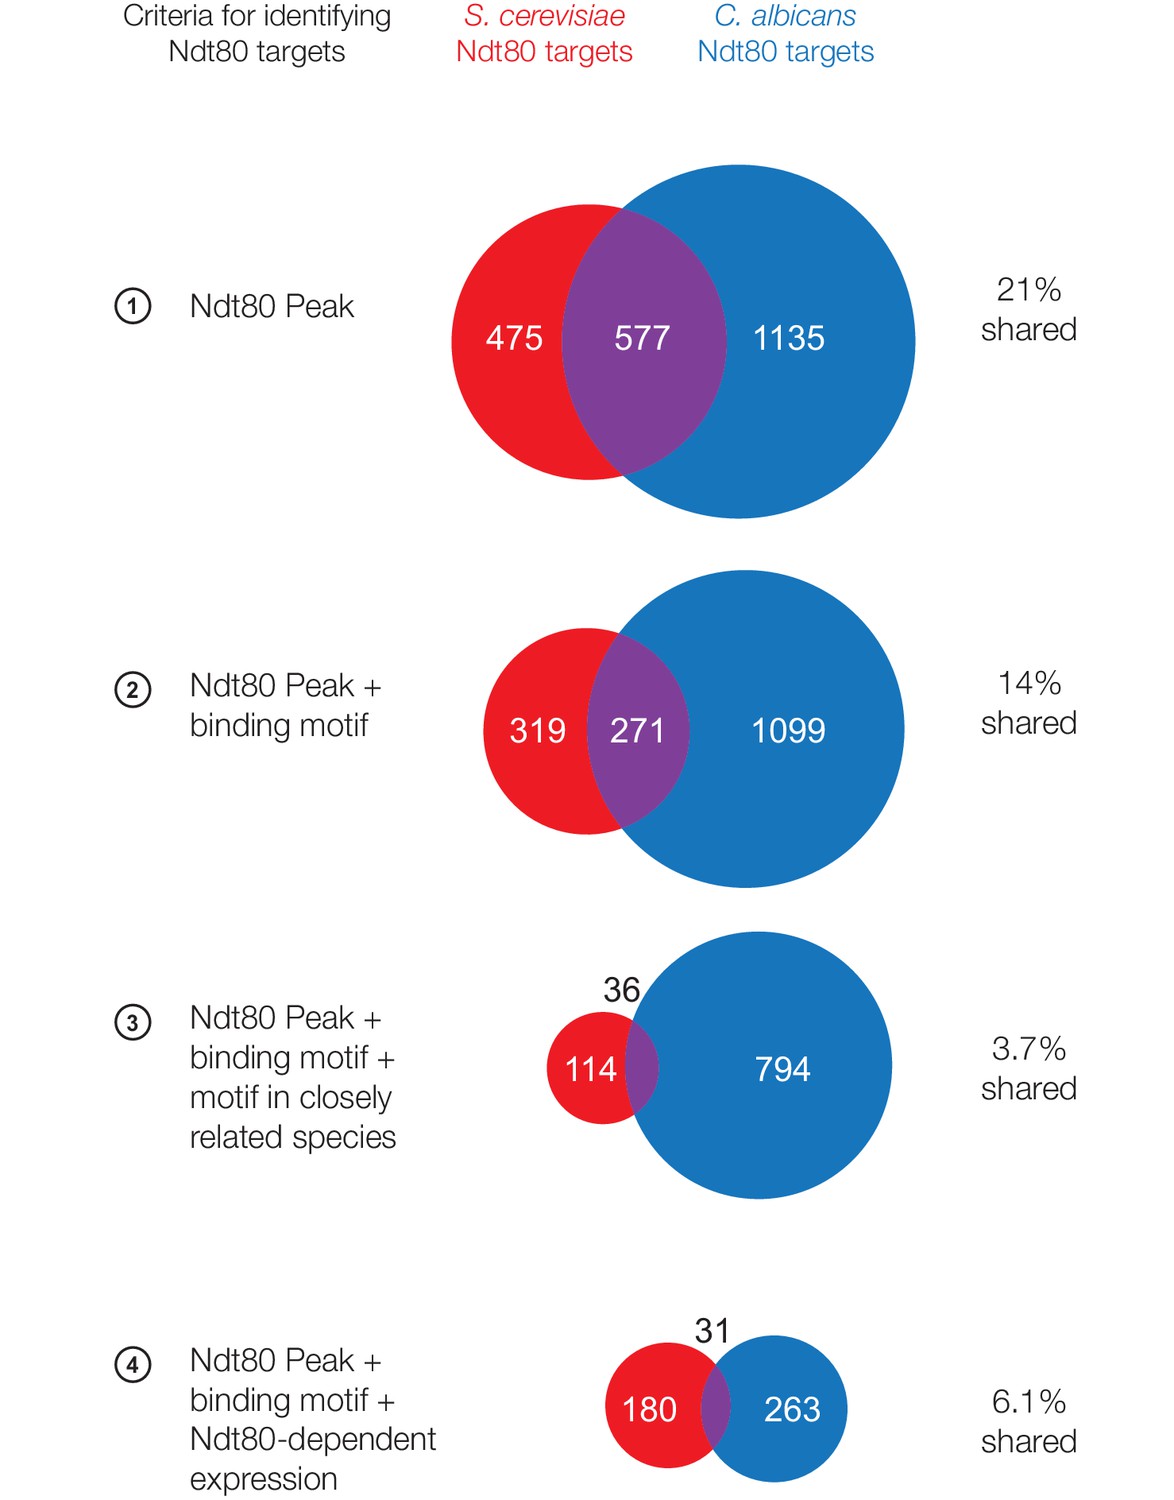
Ndt80 targets in S. cerevisiae and C. albicans when Ndt80 is endogenously expressed.
Ndt80 targets identified for S. cerevisiae Ndt80 (red) and C. albicans Ndt80B (blue), using four different criteria to identify targets (Figure 1C). Ndt80 expression in each species is driven by the native promoter (S. cerevisiae ChIP performed during sporulation, C. albicans ChIP performed during mitotic growth). As the sizes of the regulons are dramatically different between the species, the percent of targets shared is shown for each species individually. The black numbers above the Venn diagrams represent the number of overlapping targets.
Figure 1—figure supplement 2
Ndt80 targets in S. cerevisiae and C. albicans considering only 1:1 orthologs between species.
Ndt80 targets identified for S. cerevisiae Ndt80 (red) and C. albicans Ndt80B (blue), using four different criteria to identify targets (Figure 1C). Ndt80 expression in each species is driven by a high-expression promoter, and ChIP experiments were performed as in Figure 1. Only genes with 1:1 orthologs between S. cerevisiae and C. albicans are shown.
Figure 1—figure supplement 3
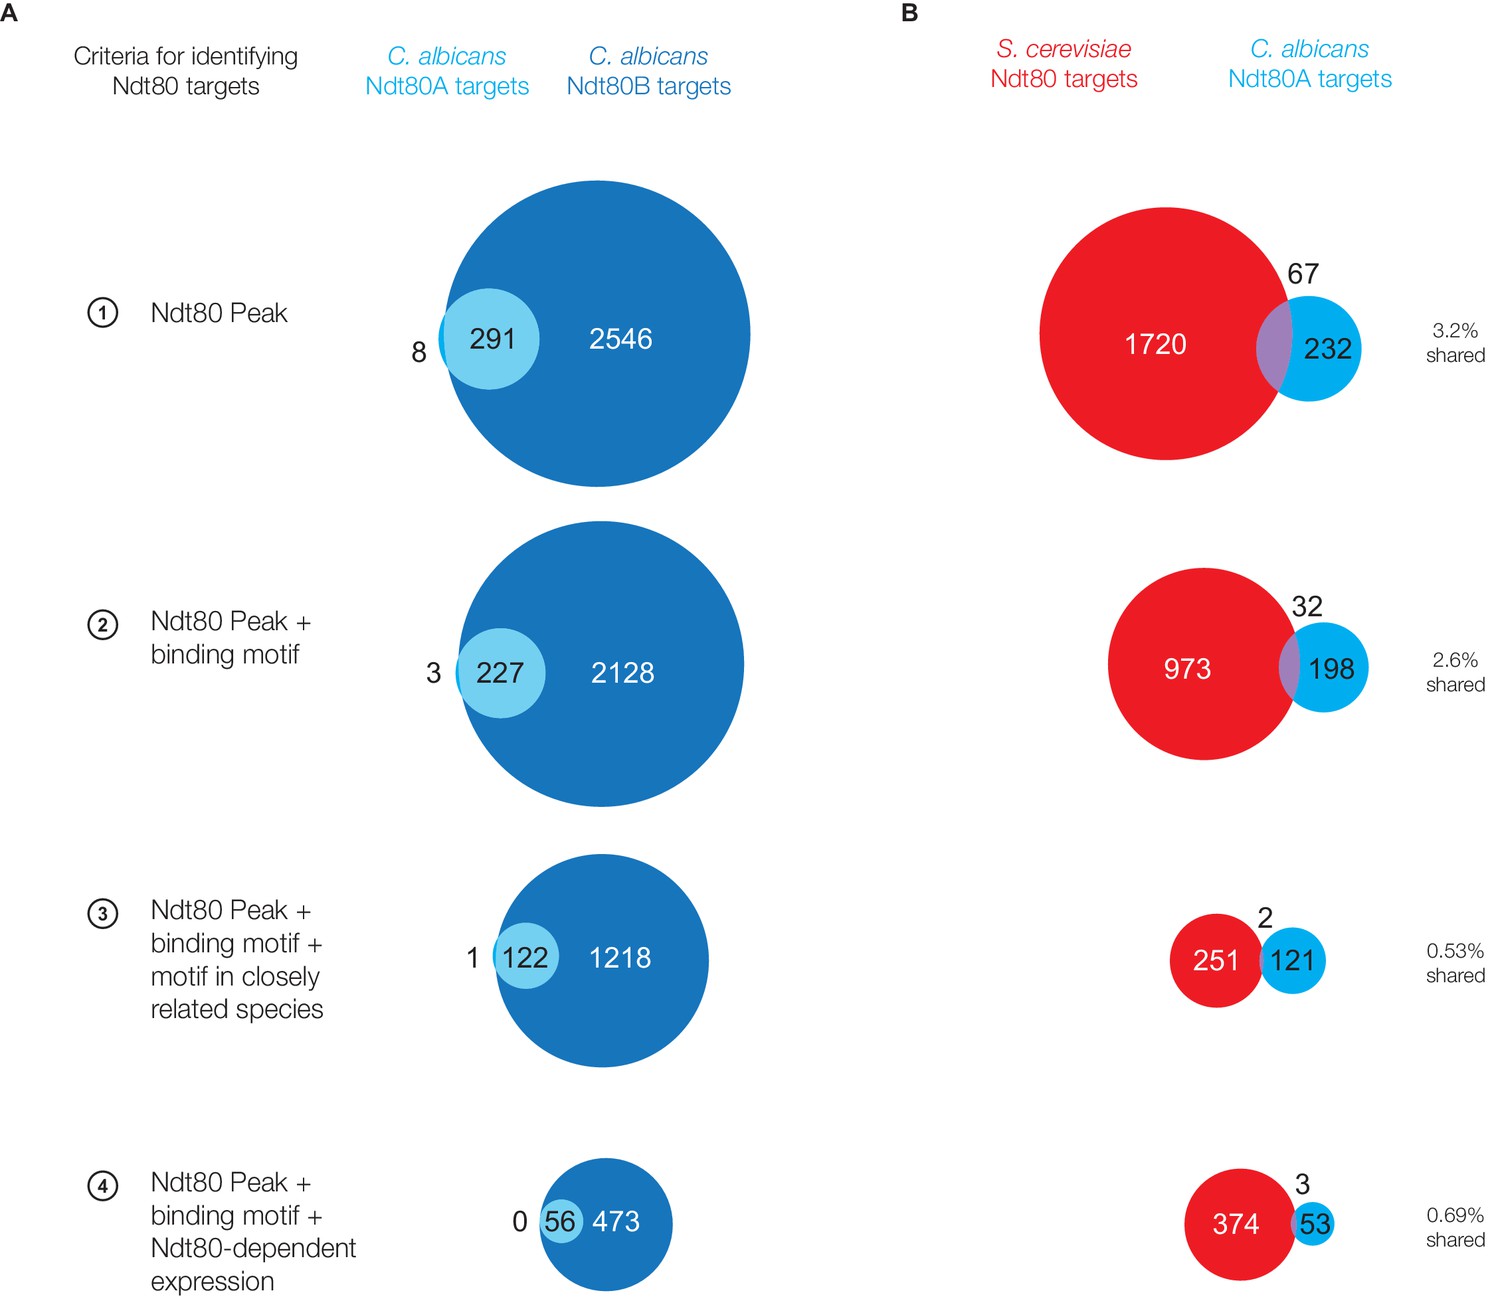
Ndt80 targets for paralogs Ndt80A and Ndt80B in C. albicans.
(A) Ndt80 targets identified for Ndt80A (light blue) and Ndt80B (dark blue) in C. albicans using four different criteria (Figure 1C). (B) Targets of Ndt80A in C. albicans compared to the targets of Ndt80 in S. cerevisiae.
Figure 1—figure supplement 4
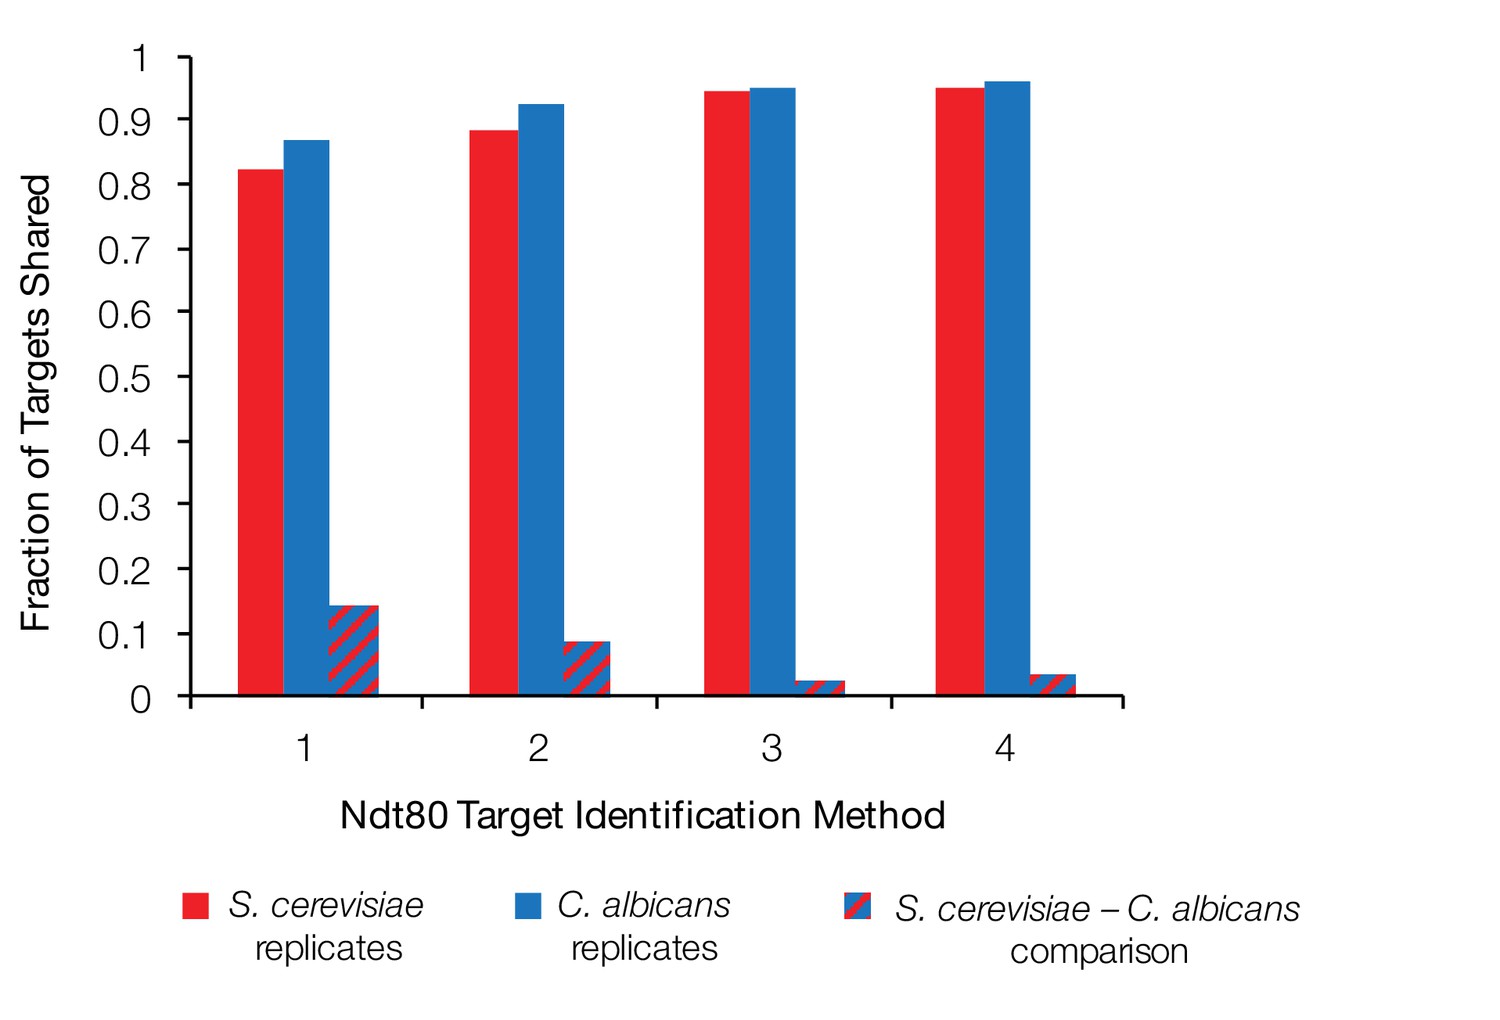
Fraction of Ndt80 targets shared between biological replicates and between S. cerevisiae and C. albicans.
Fraction of Ndt80 ChIP-Seq targets shared between two biological replicates of S. cerevisiae (red), two biological replicates of C. albicans (blue), and between the intersections of the replicates for each species (dashed), using four different criteria (Figure 1C). Ndt80 expression in each species is driven by a high-expression promoter, and ChIP experiments were performed as in Figure 1.
Figure 2 with 4 supplements
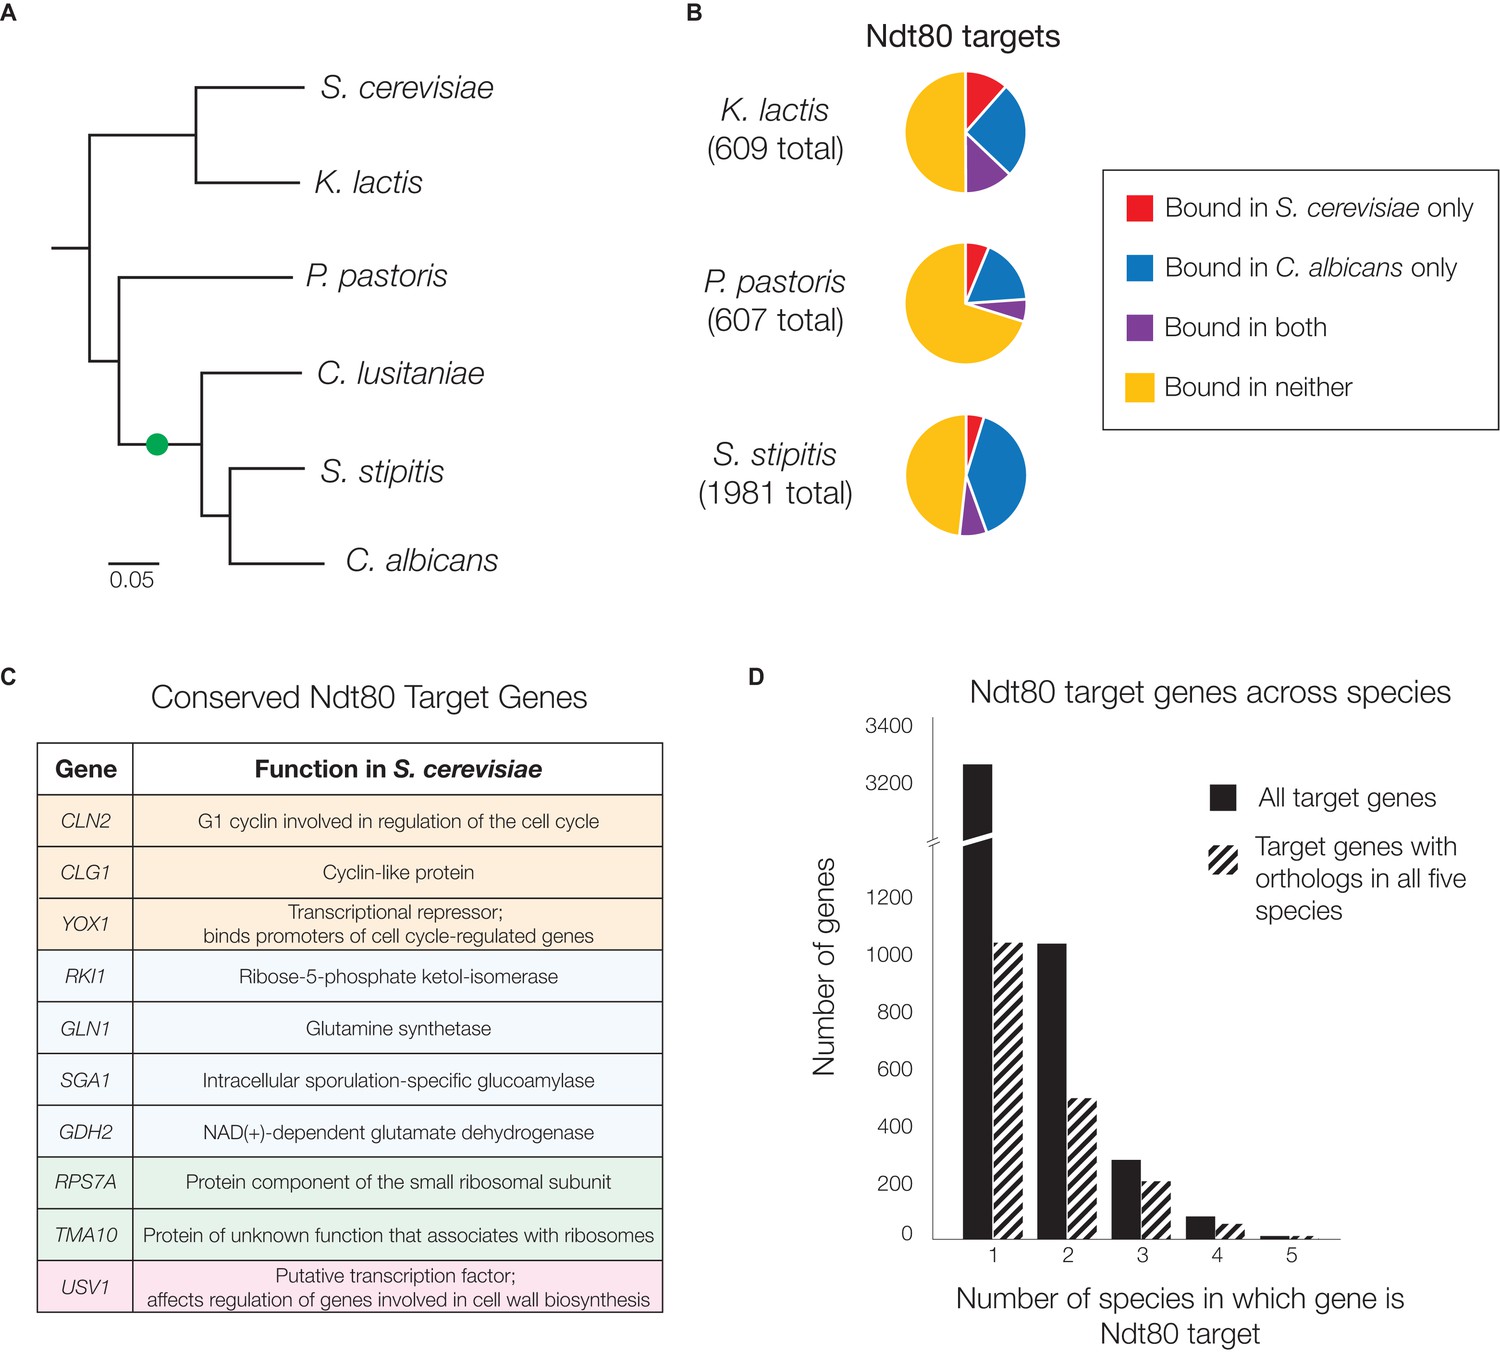
Ndt80 target genes differ across species descending from the S. cerevisiae - C. albicans common ancestor.
(A) Phylogenetic tree of the species investigated, inferred from protein sequences of 73 highly conserved genes (Lohse et al., 2013) with the scale representing the number of substitutions per site. The likely position of the NDT80 gene duplication is indicated with a green circle. Ndt80 protein tree shown in Figure 2—figure supplement 1. (B–D) Ndt80 targets identified by Criteria 2 (Figure 1C). (B) The proportion of Ndt80 targets in K. lactis, P. pastoris, and S. stipitis that are shared with the Ndt80 targets in S. cerevisiae, C. albicans, or both. The proportion of targets shared, using all four different criteria for identifying targets (Figure 1C) shown in Figure 2—figure supplement 2. (C) List of genes bound by Ndt80 in all five species tested with functional annotations (color-coded) from S. cerevisiae, as described in the text (SGD, [Cherry et al., 2012]). (D) Histogram of all Ndt80 targets in the five species tested (S. cerevisiae, K. lactis, P. pastoris, S. stipitis, and C. albicans) according to the number of species in which that gene is a target. All target genes (black) and those with 1:1 orthologs across all five species (dashed) are shown. For (B–D), the union of Ndt80A and Ndt80B bound genes were used for S. stipitis and C. albicans. The cis-regulatory site bound by Ndt80 in each species shown in Figure 2—figure supplement 4.
Figure 2—figure supplement 1

Similarity of Ndt80 protein sequences across many yeast species.
(A) Phylogenetic tree of Ndt80 proteins in diverse ascomycetes, built using MUSCLE (Edgar, 2004) and PHYML (Guindon et al., 2010). Scale bar indicates substitutions per site. (B) List of genes used in the phylogenetic tree, and in the manuscript. (C) Similarity matrix of Ndt80 proteins for species discussed in this work, calculated using MUSCLE.
Figure 2—figure supplement 2
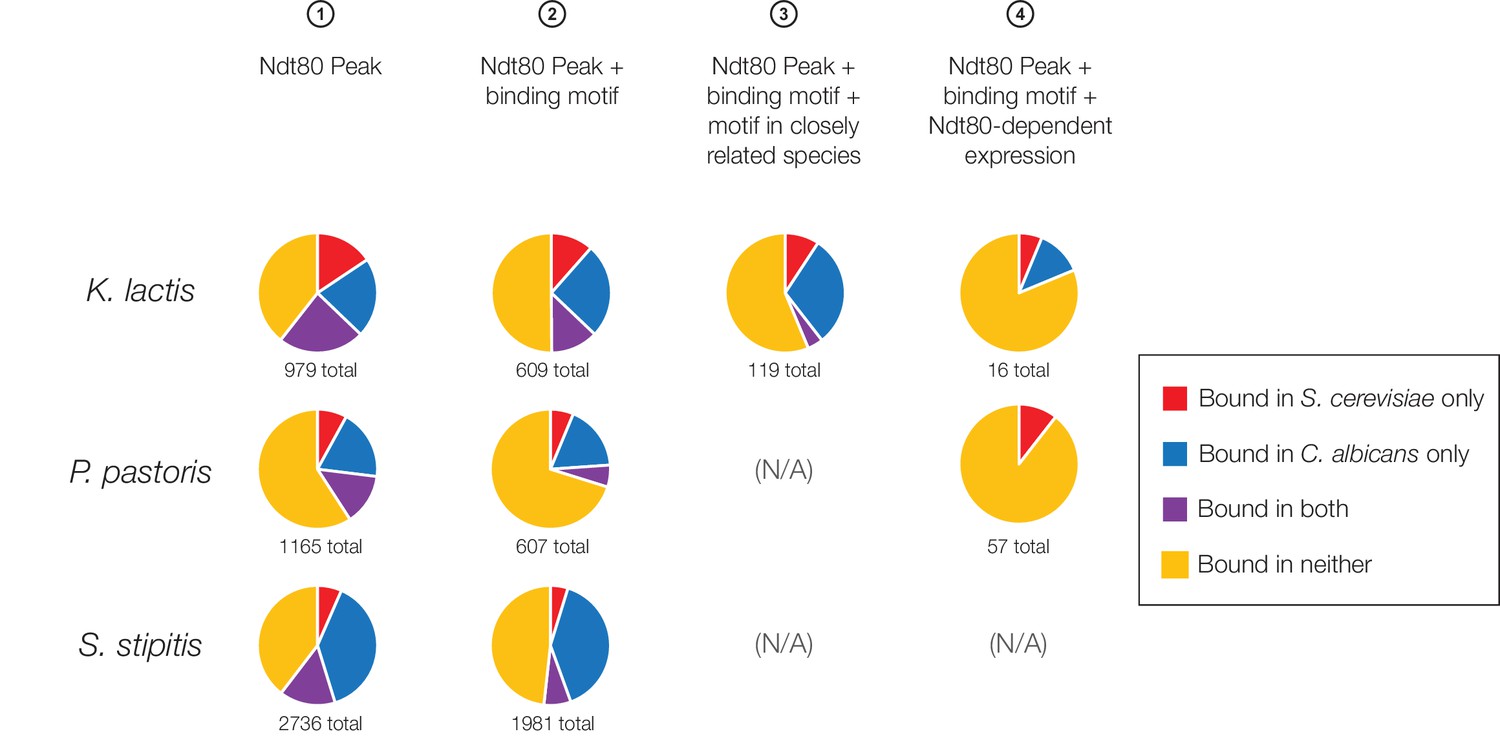
Ndt80 targets in K. lactis, P. pastoris, and S. stipitis categorized according to overlap with S. cerevisiae and C. albicans, using all four methods of target identification.
The proportion of Ndt80 targets in K. lactis, P. pastoris, and S. stipitis shared with Ndt80 in S. cerevisiae and C. albicans. Different criteria for Ndt80 target identification (Figure 1C) were used to identify targets in K. lactis, P. pastoris, and S. stipitis, where possible. Criteria 3 could not be used for P. pastoris and S. stipitis, as it requires two closely related species with mapped orthologs, while Criteria 4 could not be used for S. stipitis as expression profiling was not performed in this species.
Figure 2—figure supplement 3
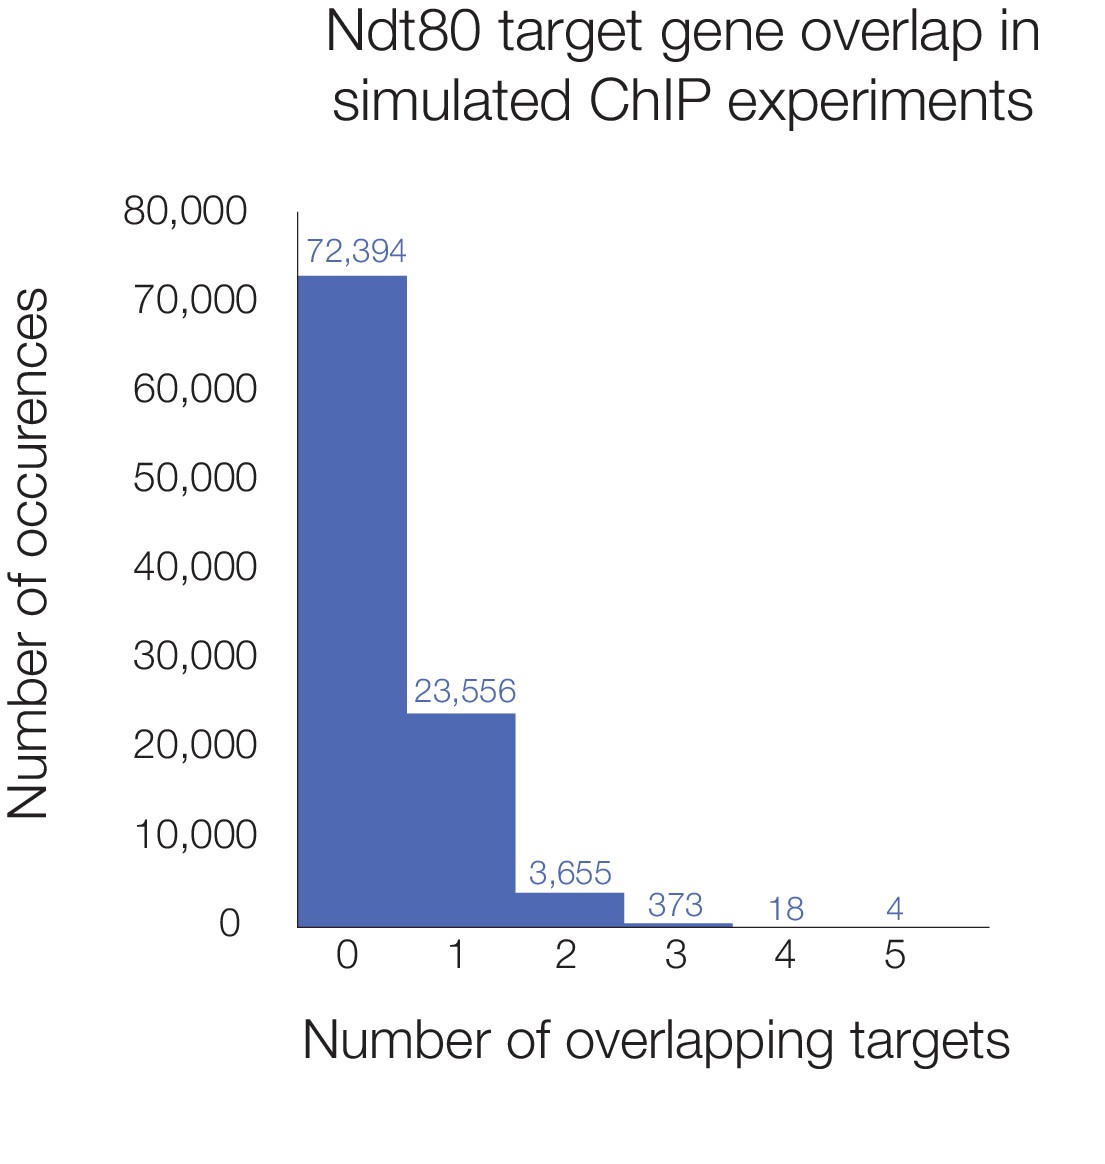
Histogram of simulated overlap in Ndt80 targets across five species.
Number of shared Ndt80 targets shown for 100,000 simulations of ChIP experiments. Genes were randomly selected from the set of genes with orthologs in all five species (3171 in total) to make target sets for each species corresponding to the number of actual ChIP targets we observed (using Criteria 2 from Figure 1C; 424 for S. cerevisiae, 269 for K. lactis, 300 for P. pastoris, 958 for S. stipitis, and 989 for C. albicans). Histogram shows the number of genes found as targets in all five species in 100,000 simulations, with the number of runs shown above each bar; five genes was the maximum overlap found.
Figure 2—figure supplement 4
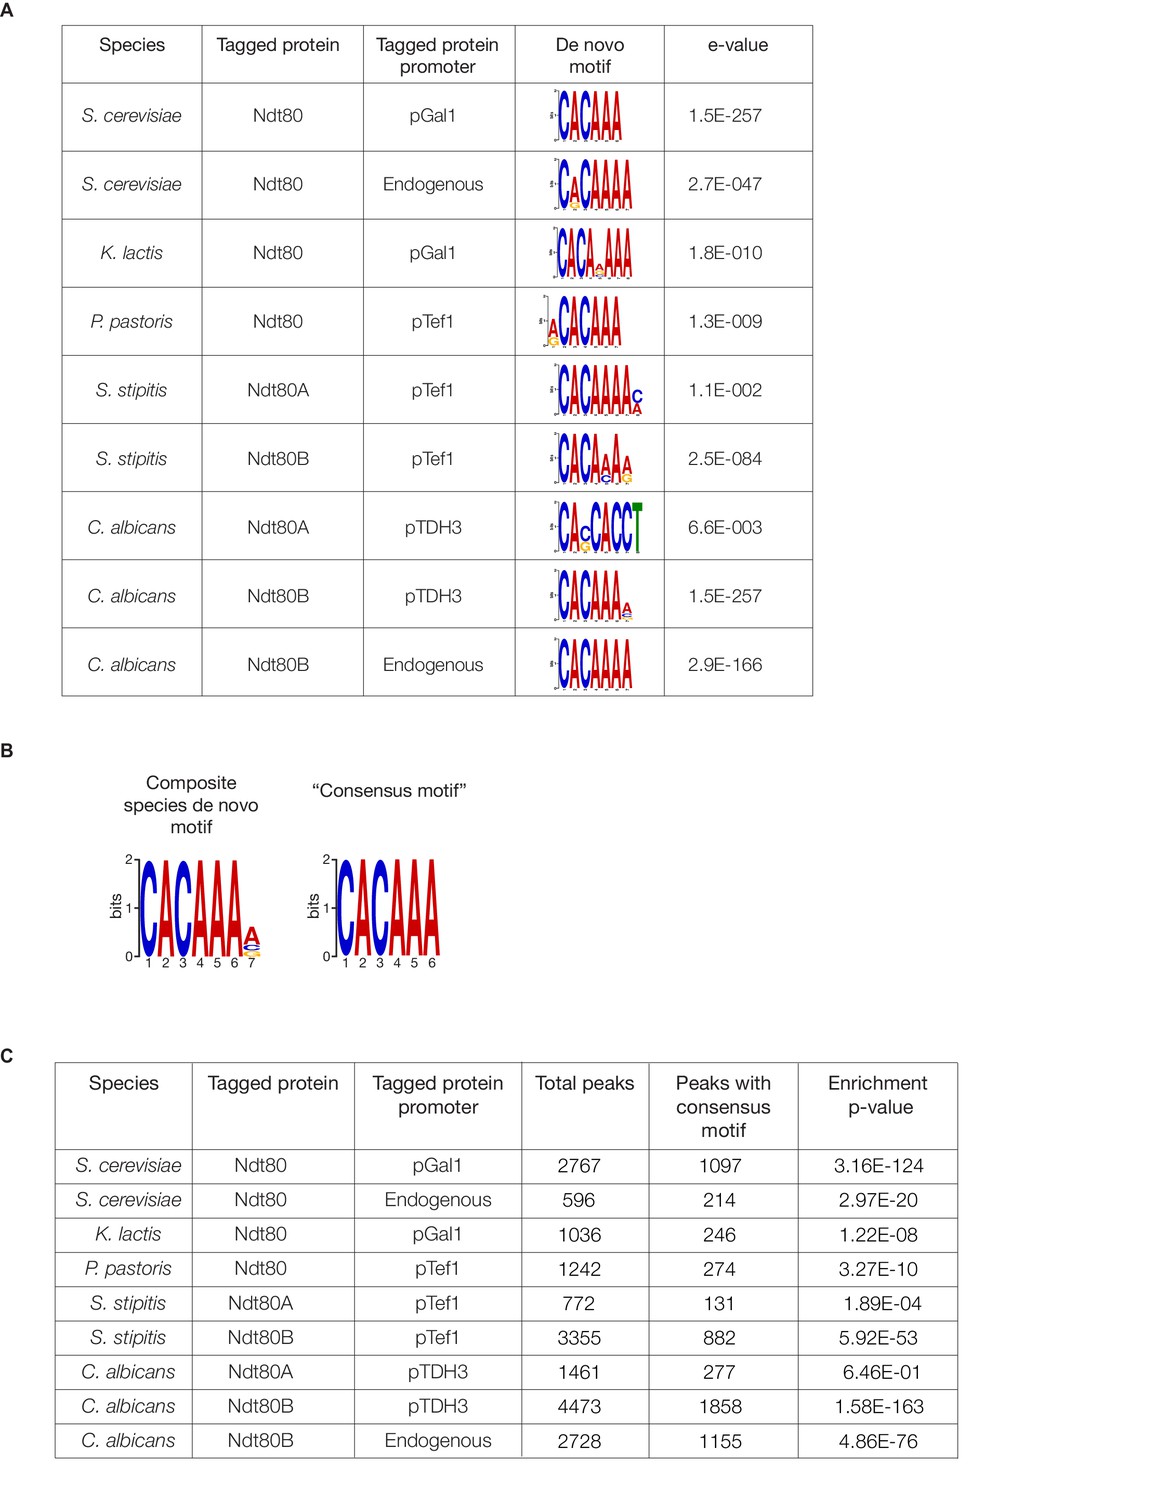
Ndt80 cis-regulatory motifs identified in ChIP-Seq experiments.
(A) De novo motifs were generated for Ndt80 for each ChIP-Seq experiment performed, using DREME (Bailey, 2011), with the union of replicate peak locations compared to a random set of genomic sequences of the same lengths, for each species. The e-values generated by DREME represent the enrichment p-value multiplied by the number of candidate motifs tested. Shown are the motifs most closely resembling the known Ndt80-binding motif in S. cerevisiae and C. albicans (Jolly et al., 2005; Nobile et al., 2012). (B) A composite motif for all species was generated, using peak locations for Ndt80 ChIP-Seq in all five species tested. For species with two Ndt80 paralogs, the intersection of replicates was taken and the union of the paralogs was taken to represent all binding locations and submitted to DREME. These sequences were scrambled as a background for the analysis. From this analysis, a ‘consensus motif’ sequence was inferred to use for later analyses. (C) Enrichment of the consensus motif (CACAAA) for each ChIP-Seq experiment. Motifs were counted in the peak locations compared to a random set of genomic sequences, for each species, and a p-value was generated using a Fisher’s one-tailed exact test.
Figure 3 with 1 supplement
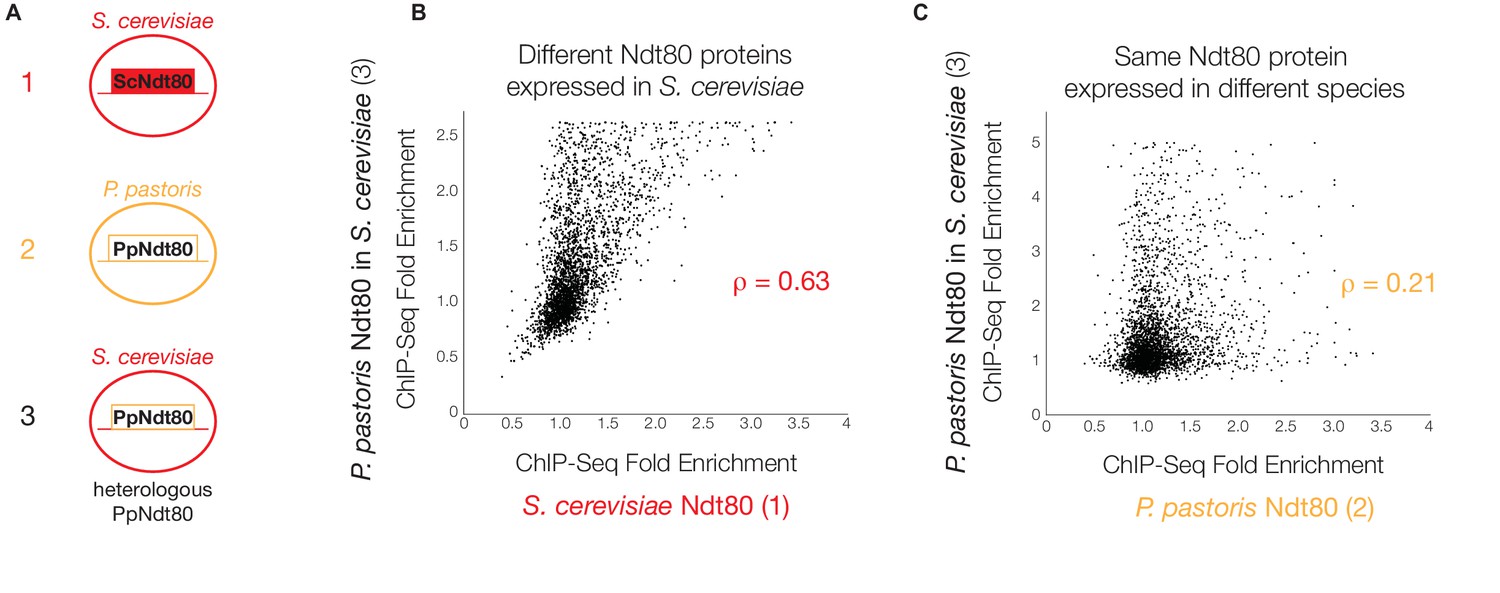
P. pastoris Ndt80 binds to regions bound by S. cerevisiae Ndt80 when expressed in S. cerevisiae.
(A) Diagram of strains used to generate data in (B) and (C): (1) tagged native Ndt80 in S. cerevisiae, (2) tagged native Ndt80 in P. pastoris, and (3) tagged heterologous P. pastoris Ndt80 expressed in S. cerevisiae. (B and C) Comparisons of the maximum ChIP-Seq fold enrichment for the intergenic regions of all genes with 1:1 orthologs in S. cerevisiae and P. pastoris, with Spearman’s rank correlation coefficient shown (p-value=7.2×10−117 for (B), 1.02 × 10−296 for (C)). Numbers in axis labels correspond to simplified diagrams in (A). (B) S. cerevisiae Ndt80 vs. P. pastoris Ndt80 expressed in S. cerevisiae. (C) P. pastoris Ndt80 expressed in P. pastoris vs. P. pastoris Ndt80 expressed in S. cerevisiae. A comparison of Ndt80 targets identified in each experiment using Criteria 1 shown in Figure 3—figure supplement 1.
Figure 3—figure supplement 1

Heterologous P. pastoris Ndt80 targets compared to native P. pastoris and S. cerevisiae Ndt80 targets.
(A and B) Ndt80 targets, defined by ChIP-Seq enrichment alone (Criteria 1), for P. pastoris Ndt80 when expressed in S. cerevisiae, compared to targets of Ndt80 in S. cerevisiae (A) and P. pastoris (B) when expressed endogenously. Genes that are Ndt80 targets in both S. cerevisiae and P. pastoris have been omitted from this analysis.
Figure 4
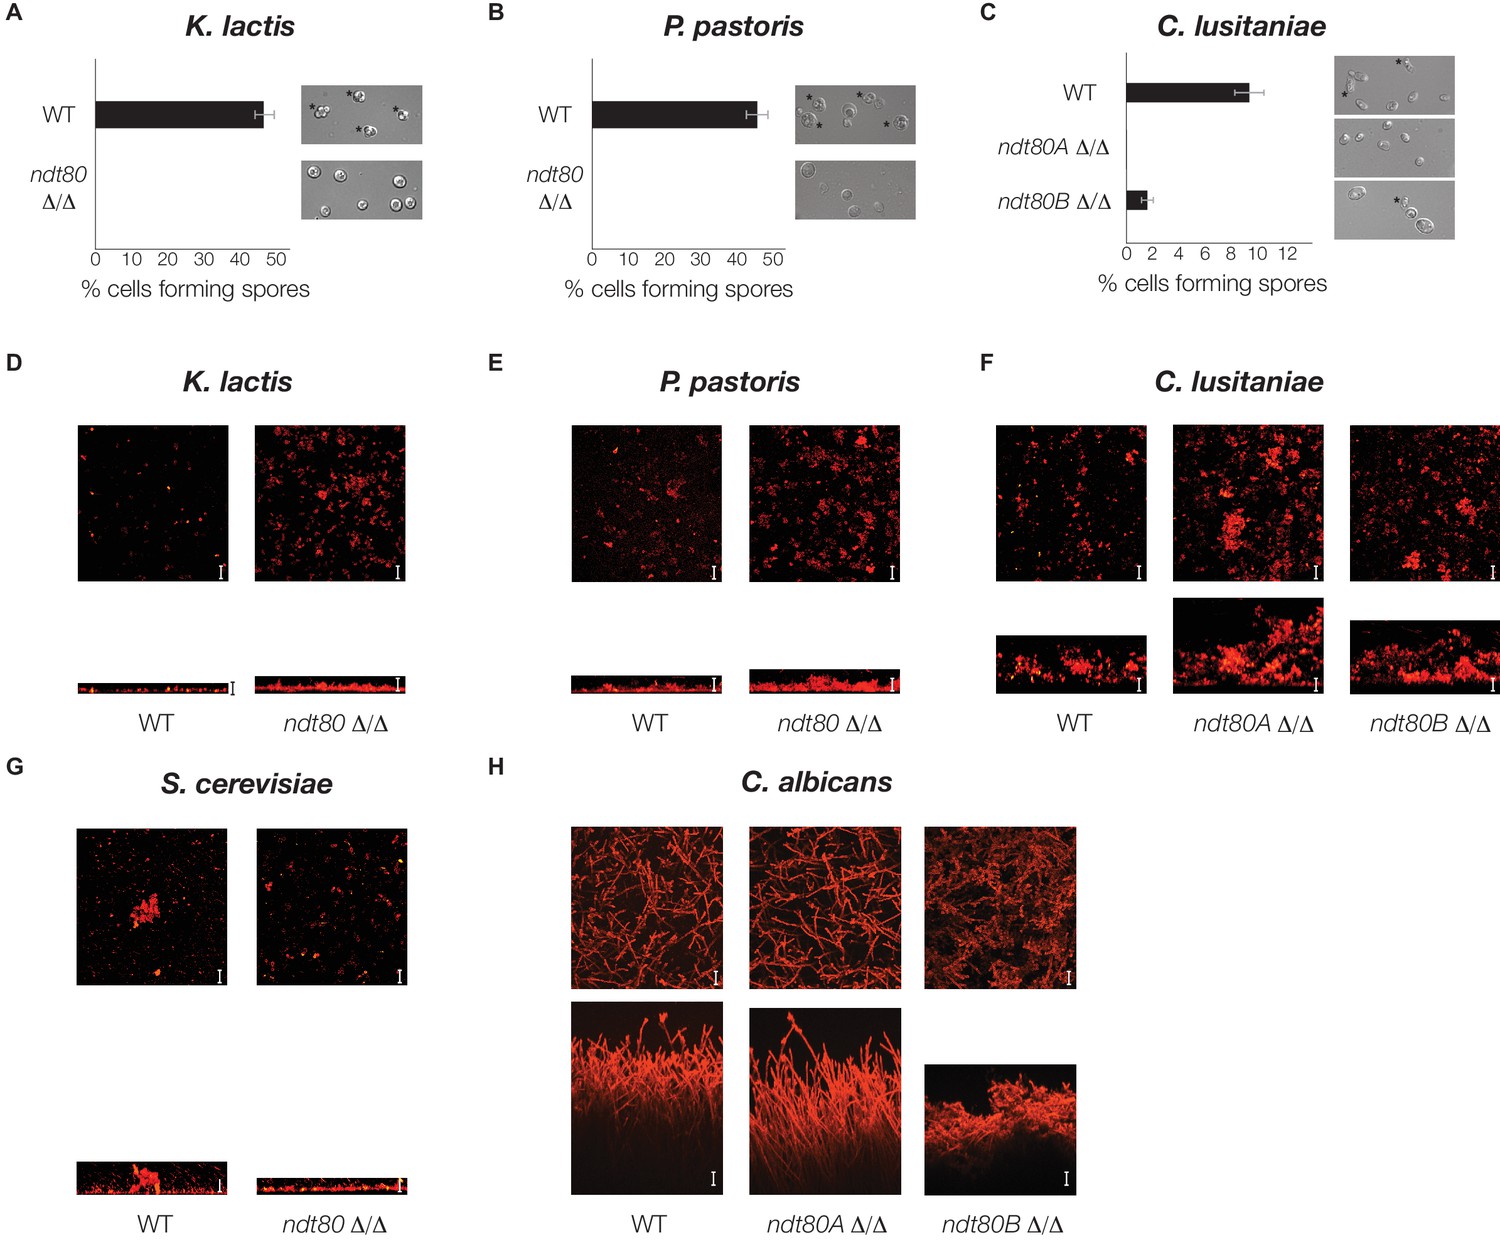
Ndt80 is required for sporulation but is dispensable for biofilm formation, in K. lactis, P. pastoris, and C. lusitaniae.
(A–C) Light microscope images of genetically matched wild-type and ndt80 deletion strains (Stars indicate diploid cells that have undergone sporulation) and quantification of the percent of cells exhibiting spores, as measured by microscopy (200 cells counted for each strain). (D–H) Confocal scanning laser microscopy images of biofilm formation for genetically matched wild-type and ndt80 deletion strains. Top view of biofilm shown above side view for each, with scale bars representing 25 µm.
Figure 5 with 1 supplement

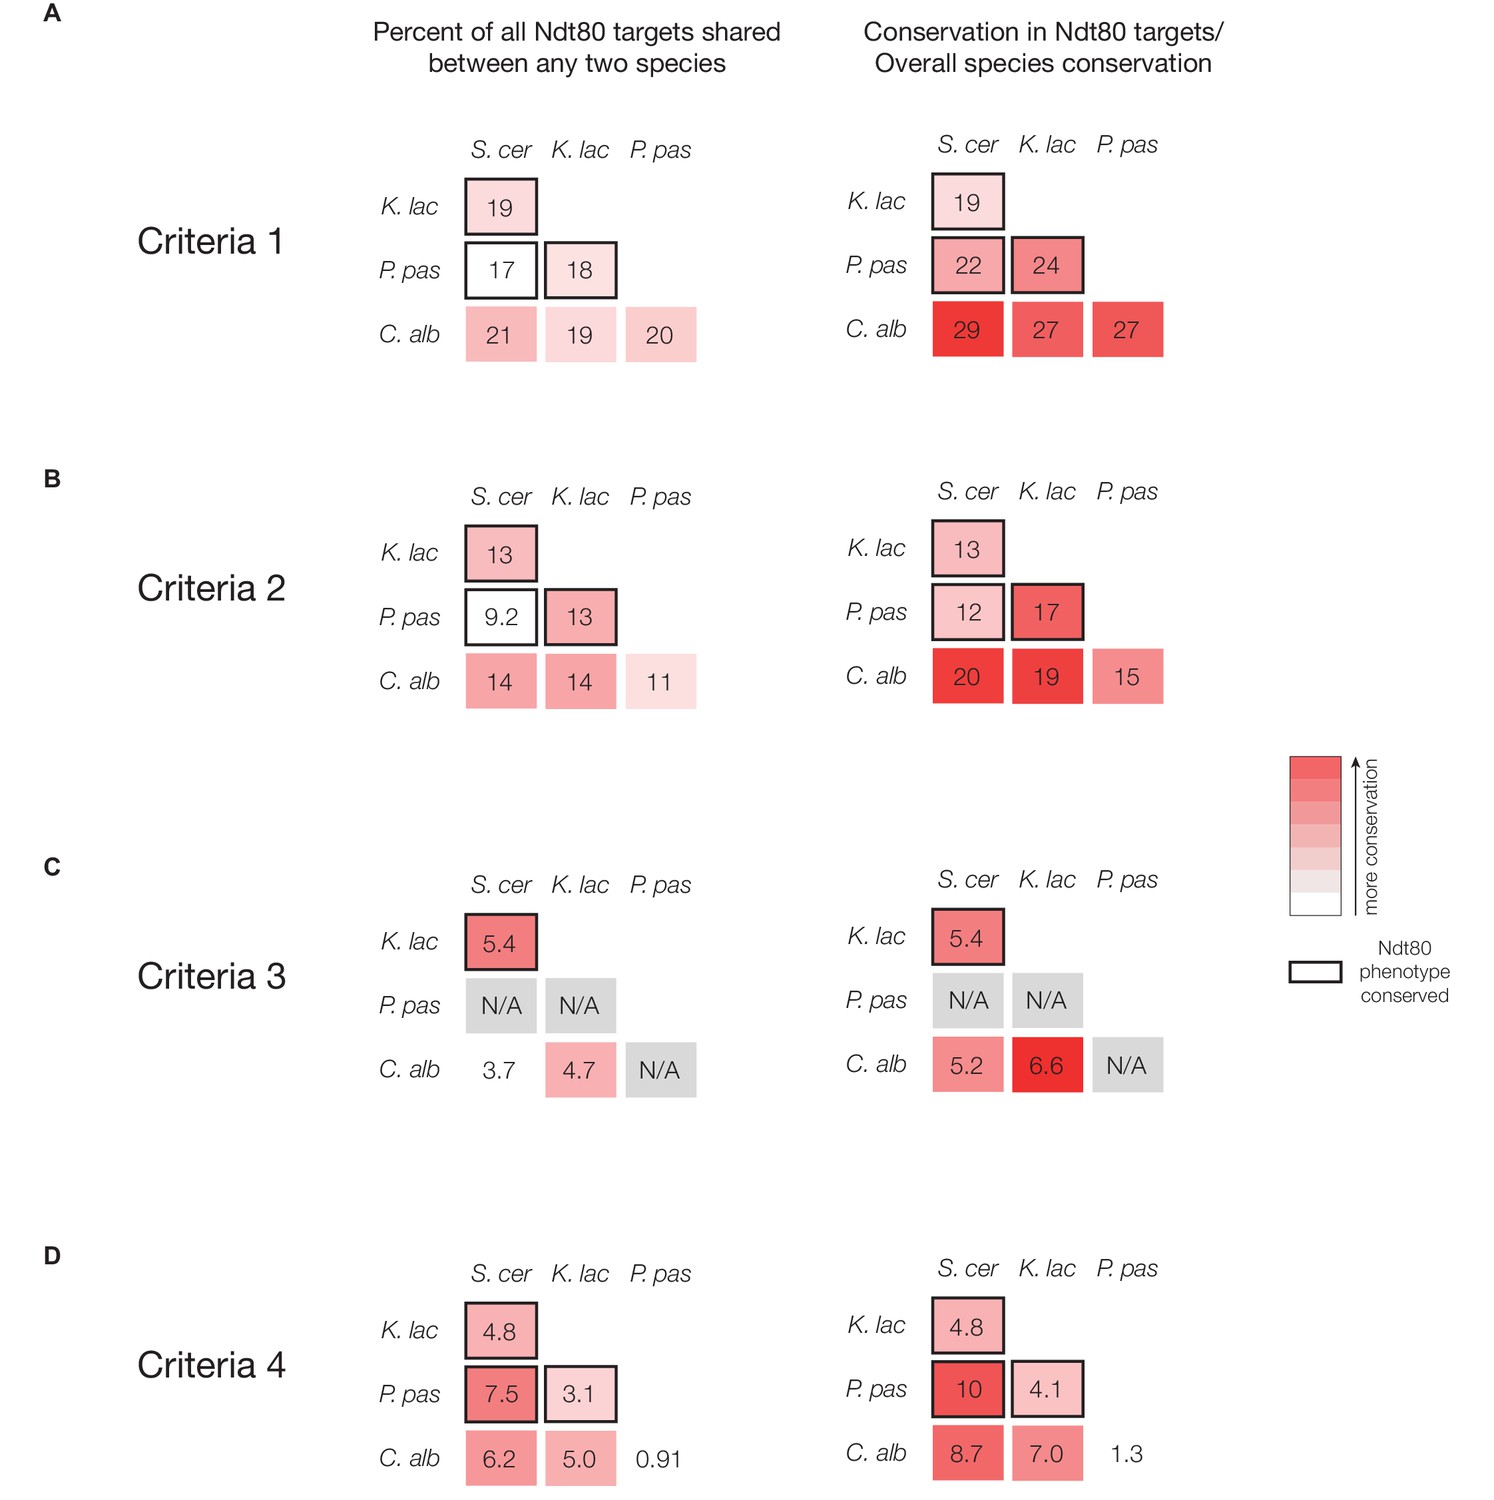
The targets of Ndt80 differ among species even with a conserved Ndt80 phenotype.
(A) Percent of all Ndt80-bound genes (identified using Criteria 2) shared between any two species tested; for this analysis, only 1:1 orthologs in each two-species comparison were considered. (B) Percent of all Ndt80-bound genes shared between any two species, normalized to the genome-wide substitutions per site (S. cerevisiae – K. lactis set to 1). Species comparisons between two species with a conserved Ndt80 phenotype shown with black outline for (A) and (B). Percent overlap and normalized percent overlap for targets identified using all four criteria (Figure 1C) shown in Figure 5—figure supplement 1. (C) Cladogram of species for which Ndt80 phenotype and target genes have been identified, with simplified cartoons representing Ndt80 ChIP-Seq targets in each species. The grey circle in the center represents Ndt80, while the smaller circles represent genes present in all four species, with each small circle representing ~100 genes. The arrows indicate that Ndt80 binds to those genes in that species.
Figure 5—figure supplement 1
Percent overlap in Ndt80 targets across different species, using all four methods of target identification.
(A–D) Percent of all Ndt80-bound genes shared between any two species tested (left column) and the percent shared normalized to the genome-wide substitutions per site between species (right column) (S. cerevisiae – K. lactis set to 1). Targets identified using Criteria 1 (A), Criteria 2 (B), Criteria 3 (C), or Criteria 4 (D) (Figure 1C). For this analysis, only 1:1 orthologs in each two-species comparison were considered. Species comparisons between two species with a conserved Ndt80 phenotype shown with black outline.
Figure 6 with 2 supplements

Genes induced during sporulation differ significantly across S. cerevisiae, K. lactis, and P. pastoris.
(A) Gene expression in meiotic growth compared to mitotic growth. Genes with significant upregulation in meiosis in at least one species shown. (B) Gene expression in a wild-type strain compared with an ndt80 △/△ strain for all three species. Genes with significant upregulation in wild-type in at least one species shown. For (A) and (B), each line represents a single gene with the color of the line representing the ratio of expression in the two conditions. Numbers below represent the number of genes shared in all three species (left), in two species (middle), or in just one species (right). Data for S. cerevisiae from Chu et al. (1998), data for K. lactis and P. pastoris generated in this study. A comparison of the 25 shared sporulation genes (A) and the seven shared Ndt80-dependent genes (B) shown in Figure 6—figure supplement 1.
Figure 6—figure supplement 1
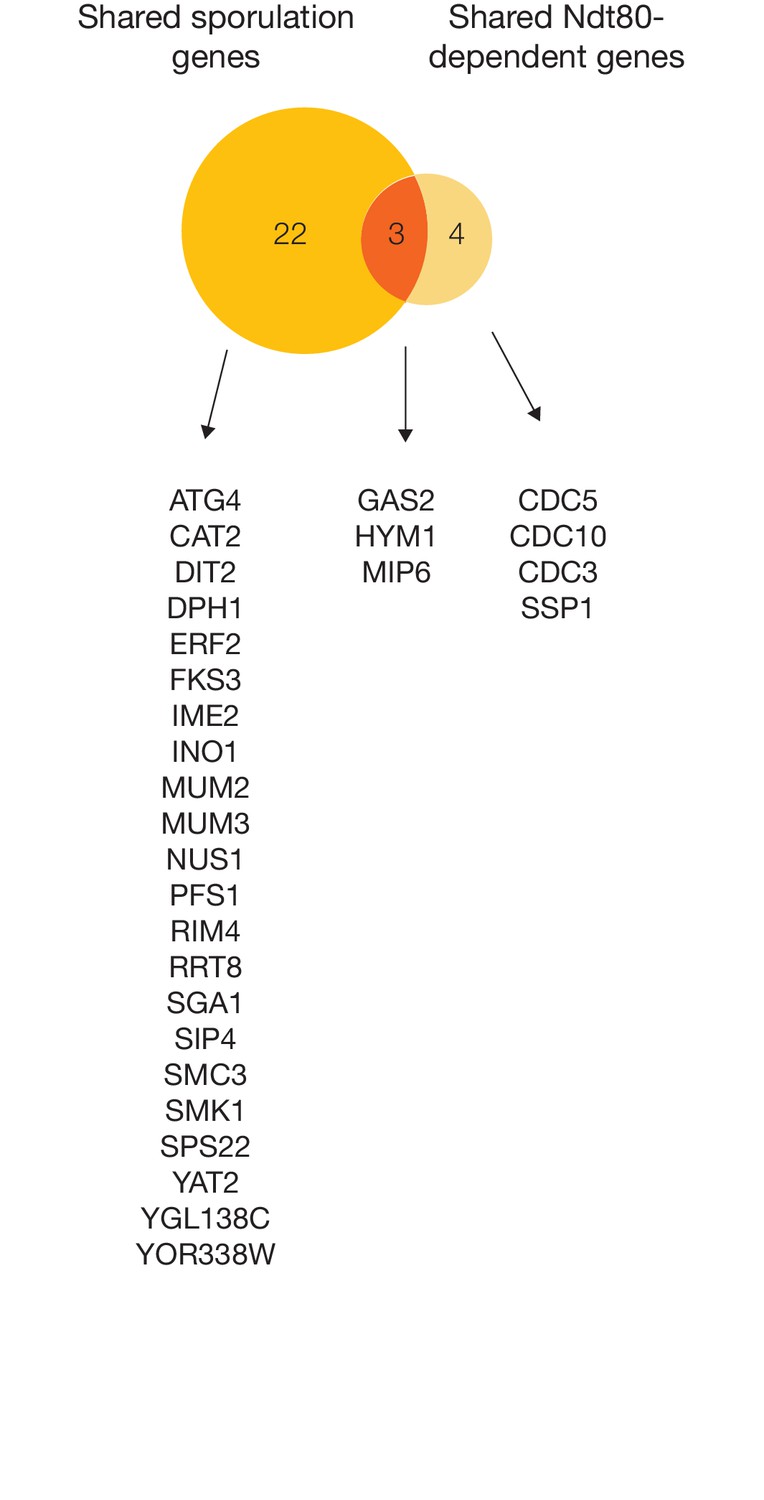
Comparing sporulation-induced genes and Ndt80-dependent genes across S. cerevisiae, K. lactis, and P. pastoris.
Venn diagram comparison of shared sporulation genes (upregulated in all three species, Figure 6A) with shared Ndt80-dependent genes (downregulated in ndt80 deletion in all three species, Figure 6B), with corresponding gene names from S. cerevisiae listed. Only genes with 1:1:1 orthologs in all three species were considered in this analysis.
Figure 6—figure supplement 2
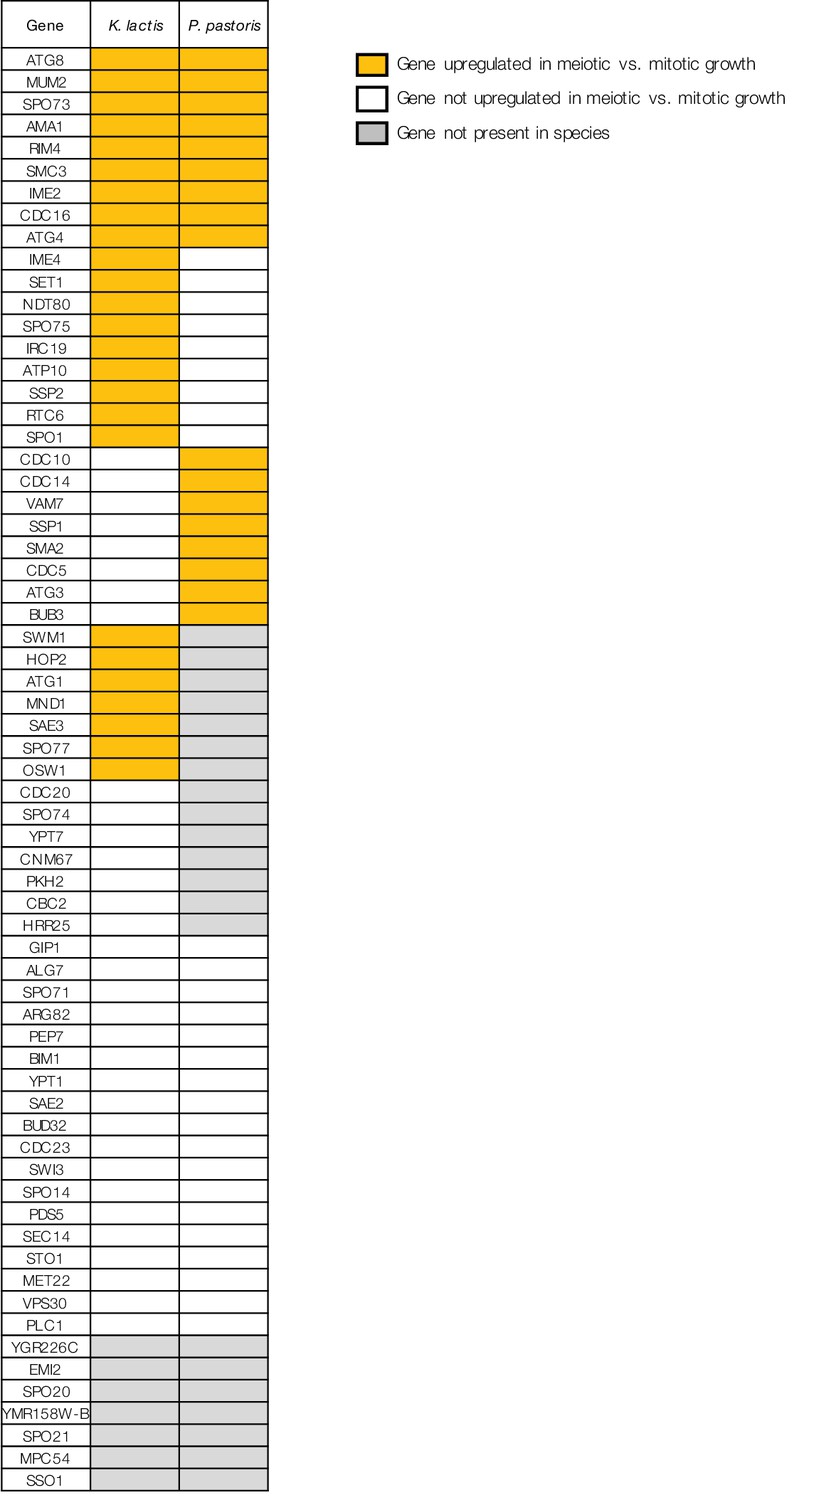
Comparing patterns of meiotic expression for genes required for sporulation in S. cerevisiae.
Table shows the 65 genes required for sporulation in S. cerevisiae (SGD, [Cherry et al., 2012]) that exhibit meiotic upregulation in S. cerevisiae ([Chu et al., 1998], Materials and methods), along with meiotic expression data from K. lactis and P. pastoris. Yellow indicates the gene is present and up-regulated in meiotic vs. mitotic growth in that species (Materials and methods), white indicates the gene is present but not significantly upregulated, and grey indicates that an ortholog of the gene cannot be found in that species.
Additional files
-
Supplementary file 1
Excel spreadsheet containing processed data for all ChIP-Seq, RNA-Seq, and expression array experiments performed.
Rows correspond to groups of orthologous genes. Columns show results of all genomic experiments discussed here, colors correspond to experiments in different species. Cell value of ‘N/A’ indicates no orthologous gene for that orthogroup in that species.
- https://doi.org/10.7554/eLife.23250.020
-
Supplementary file 2
Excel spreadsheet containing strains and primers used in this study.
(A) Strains used in this study. (B) Primers used in this study.
- https://doi.org/10.7554/eLife.23250.021
Download links
A two-part list of links to download the article, or parts of the article, in various formats.
Downloads (link to download the article as PDF)
Open citations (links to open the citations from this article in various online reference manager services)
Cite this article (links to download the citations from this article in formats compatible with various reference manager tools)
Gene regulatory network plasticity predates a switch in function of a conserved transcription regulator
eLife 6:e23250.
https://doi.org/10.7554/eLife.23250


