Analogous mechanism regulating formation of neocortical basal radial glia and cerebellar Bergmann glia
- University of Connecticut School of Medicine, United States
- University of Connecticut, United States
Figures
Figure 1 with 2 supplements
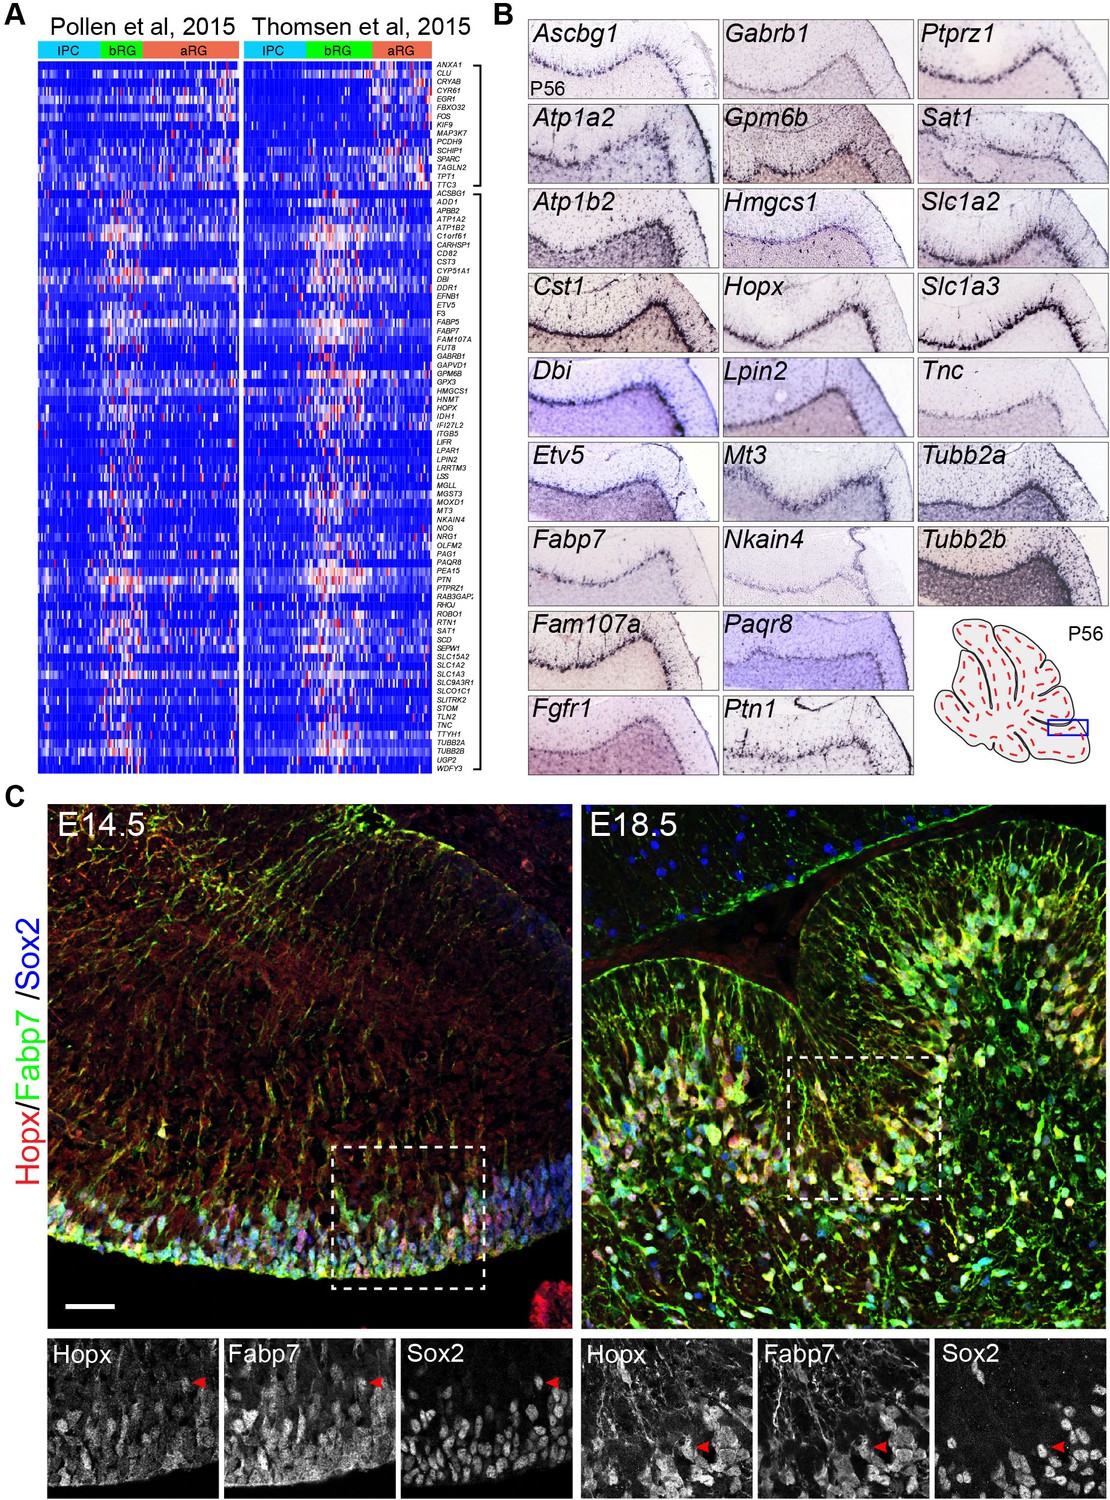
Mouse orthologs of human basal radial glia (bRG)-signature genes are specifically or highly expressed in Bergmann glia (BG) of mouse cerebella.
(A) Heatmap showing the consensus signature gene sets for apical radial glia (aRG, top bracket to the left) and bRG (lower bracket to the left) in the single-cell RNA-seq datasets of Pollen et al. and Thomsen et al. Genes of the aRG and bRG gene sets are mostly not expressed in intermediate progenitor cells (IPC). (B) In situ hybridization of selected bRG-specific genes in BG of P56 mouse cerebella. The images were generated by the Allen Institute for Brain Science (Lein et al., 2007). (C) Immunofluorescent staining of Hopx, Fabp7, and Sox2 shows that Hopx is expressed in BG in E14.5 and E18.5 mouse cerebella. The boxed areas are enlarged and shown in separate channels below; arrowheads point to BG triple-labeled with Hopx, Fabp7, and Sox2. Scale bar: 40 µm.
Figure 1—figure supplement 1
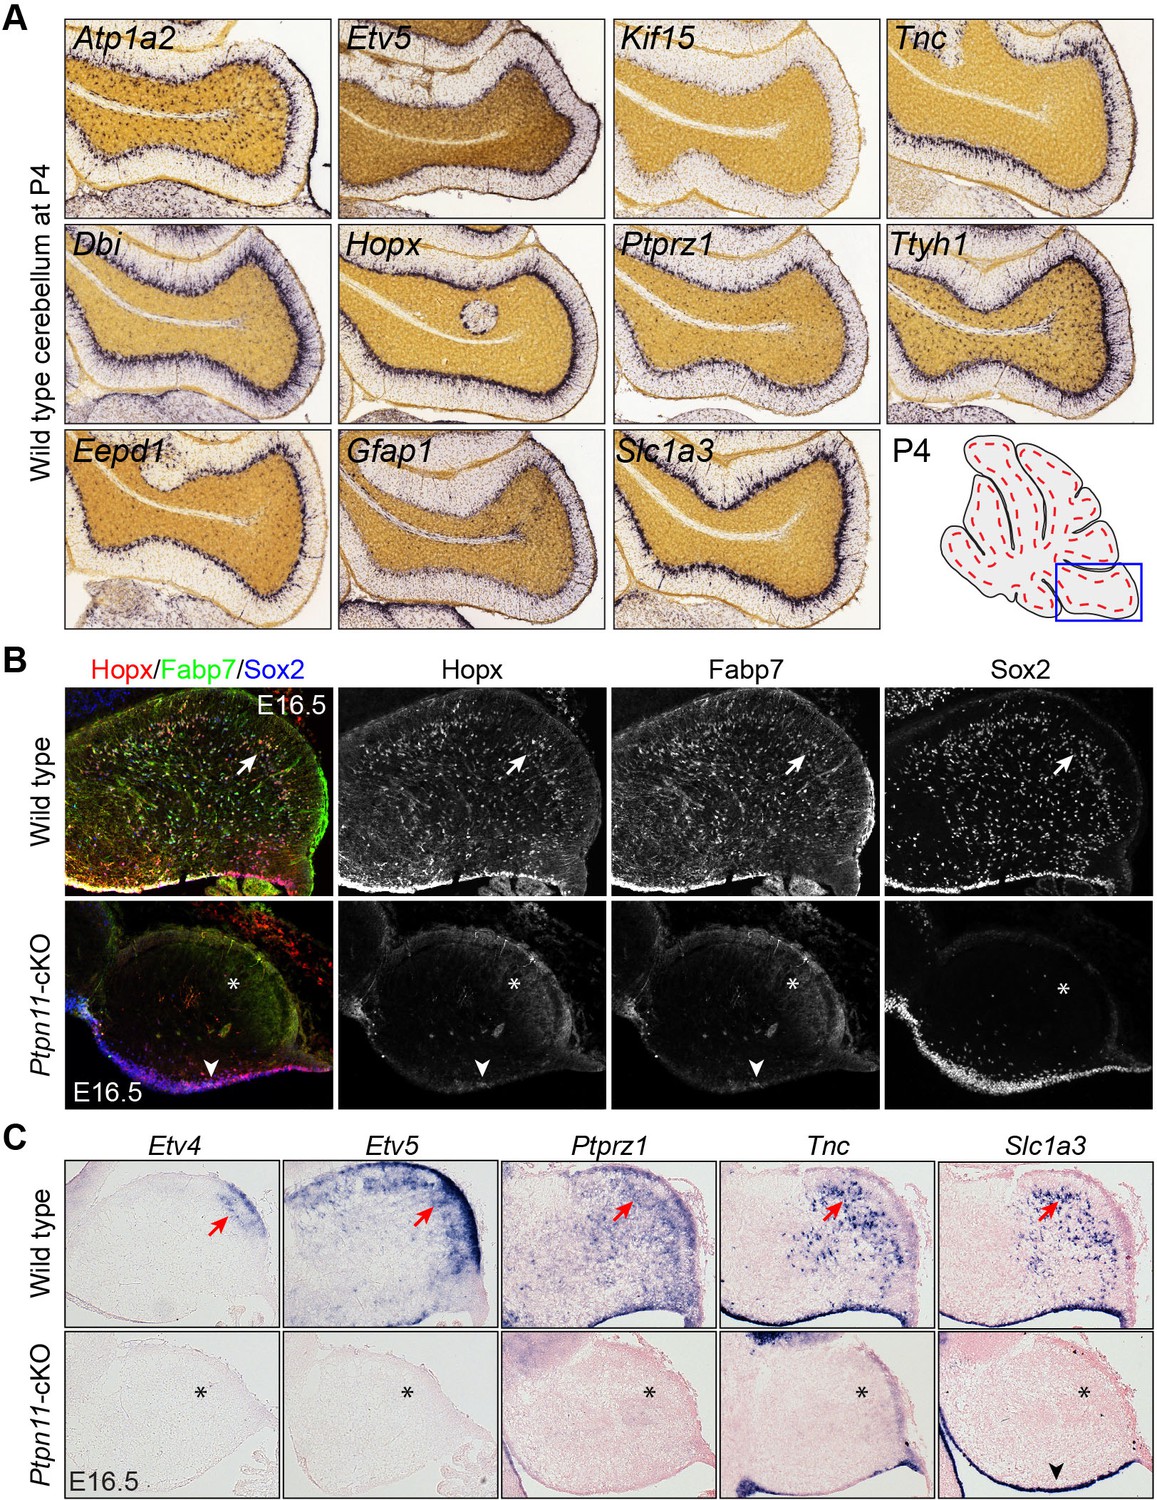
bRG-specific genes are expressed in wild-type but not Ptpn11-cKO cerebella.
(A) In situ hybridization of selected bRG-specific genes in BG of P4 mouse cerebellum. The images were obtained from the Allen Developmental Mouse Brain (Thompson et al., 2014). (B and C). Immunohistochemistry (B) and in situ hybridization (C) on sagittal sections of E16.5 wild-type and Ptpn11-cKO cerebella. The arrows indicate the transcript in presumptive BG in the cerebellar cortex; asterisks show the absence of transcripts; arrowheads denote sporadic Hopx and Fabp7 expression in the ventricular zone.
Figure 1—figure supplement 2
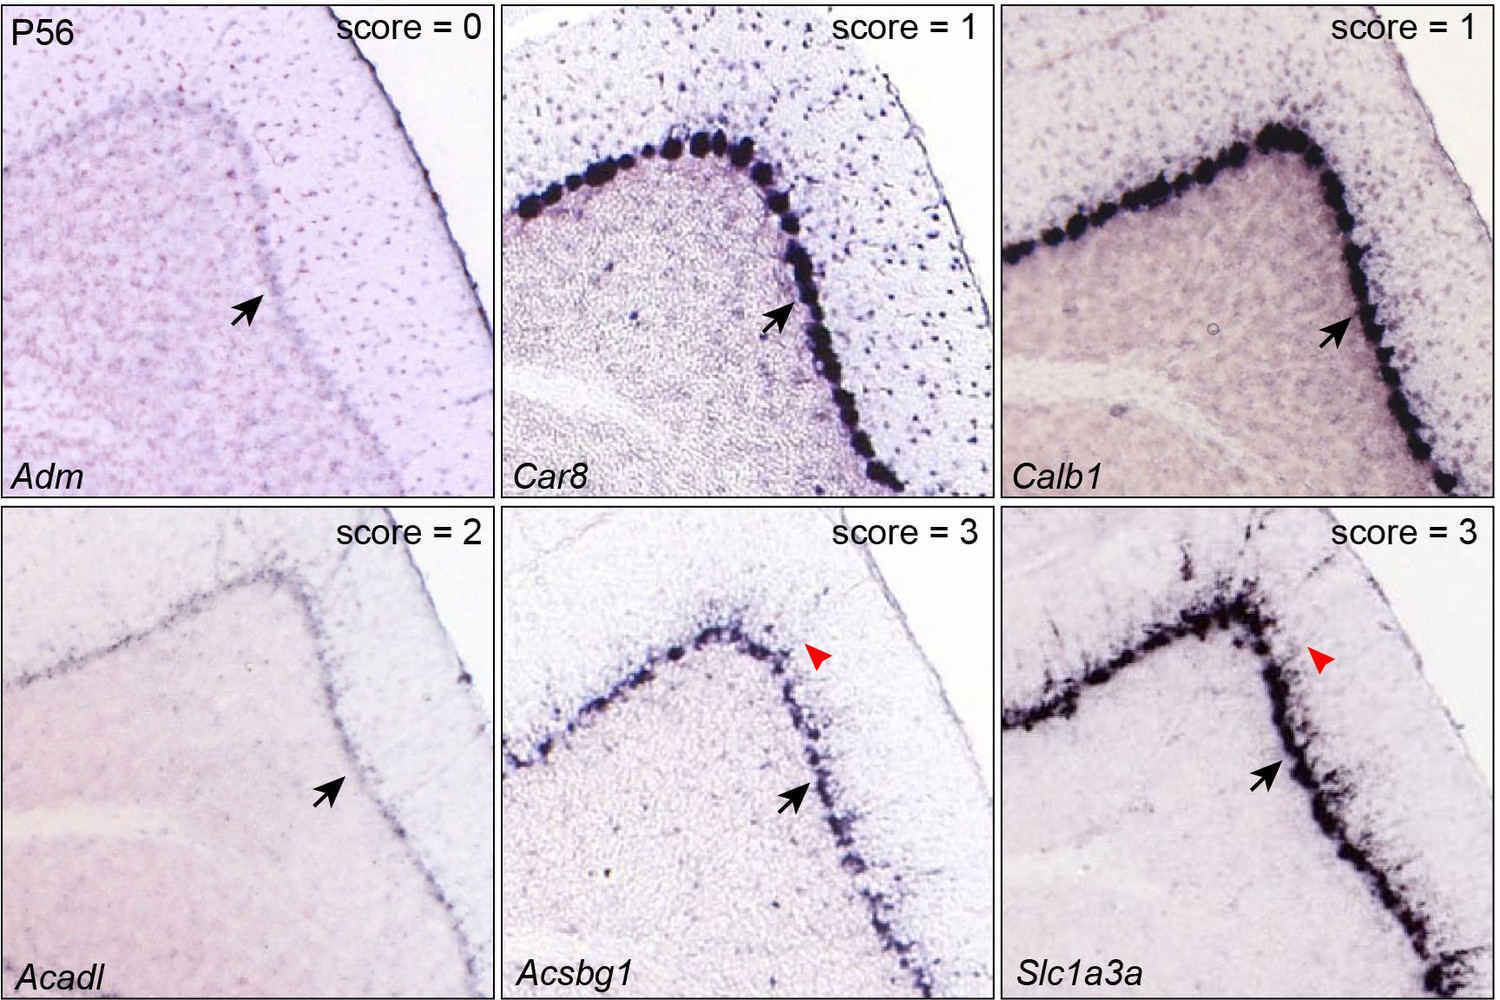
Inspection of gene expression in P56 mouse cerebella.
Examples of validation of BG markers based on ISH on sagittal section of P56 mouse cerebella (from Allen Brain Atlas). Arrows indicate the Purkinje cell layer; arrowheads denote signals in radial fibers in the molecular layer. Note that the soma of Purkinje cells are noticeably larger than those of BG.
Figure 2 with 2 supplements
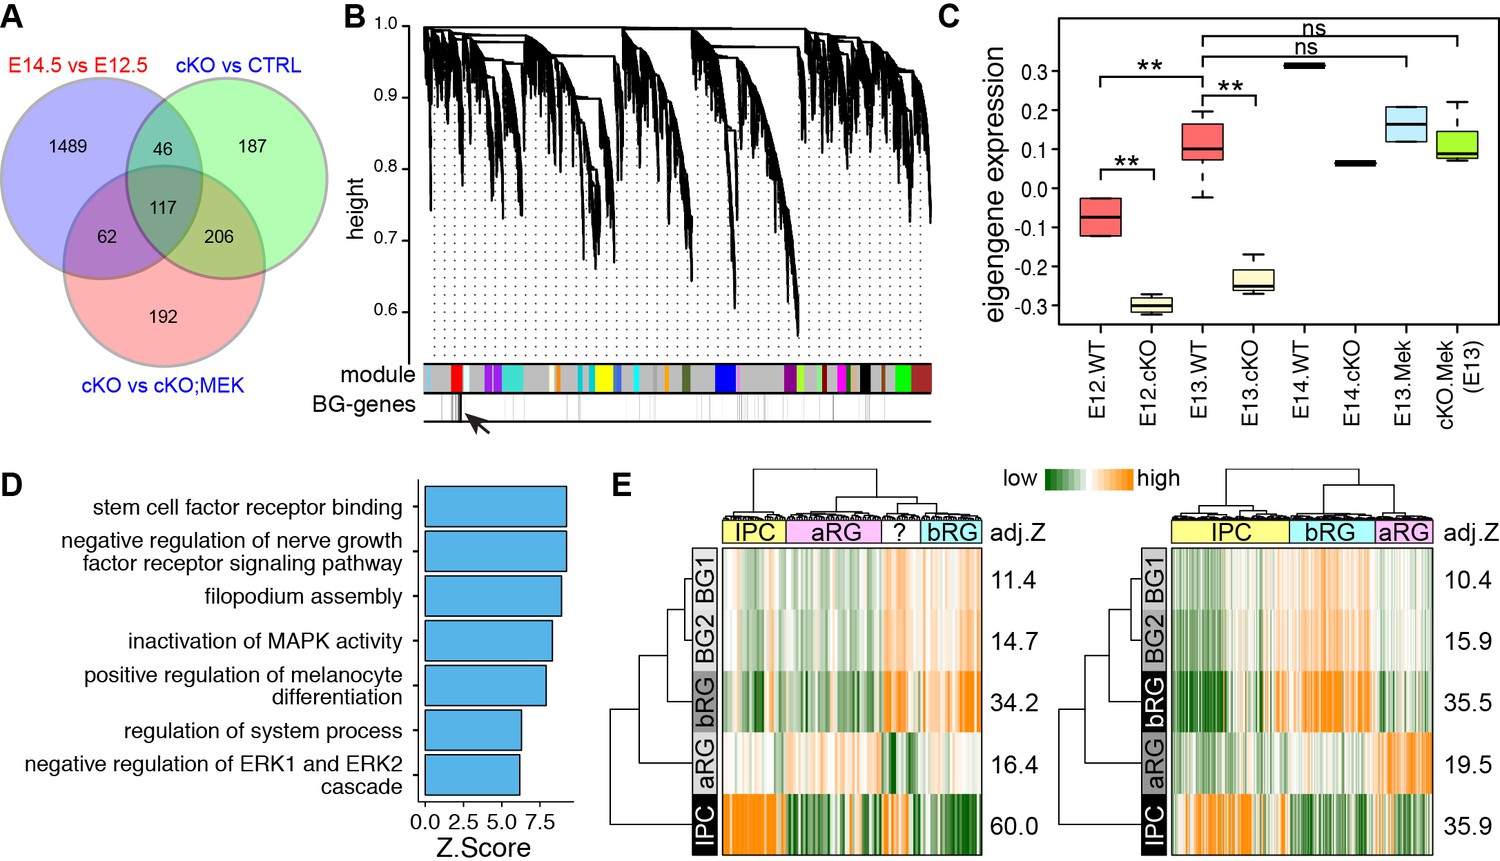
The molecular features of newly generated BG are similar to those of human bRG.
(A) Identification of BG candidate genes by intersecting significantly up- (red) and down- (blue) regulated genes between different embryonic stages and/or genotypes as indicated. (B) Dendrograms showing average linkage hierarchical clustering of genes on the basis of topological overlap. Modules of coexpressed genes are assigned in color blocks, as indicated by the horizontal bar beneath the dendrograms; the second bar shows BG-specific genes, indicated by individual vertical lines; the arrow indicates the aggregation of vertical lines – enrichment of BG-specific genes – corresponding to the BG module. (C) Boxplots showing module eigengene expression of the BG-module in different genotypes and embryonic stages. **p<0.01 (ANOVA with a post-hoc Turkey-Kramer multiple comparison test); ns, not significant (p>0.05). (D) Functional enrichment of BG-module hub genes. (E) PAGODA analyses of Pollen’s (left) and Thomsen’s (right) single-cell RNA-seq datasets show that human cortical bRG are significantly enriched for the BG-module genes detected by PAGODA. The question mark indicates an undefined cell type. Adjusted Z-scores (a Z-score >1.96 is equivalent to p<0.05) are shown to the left of the heatmap.
Figure 2—figure supplement 1
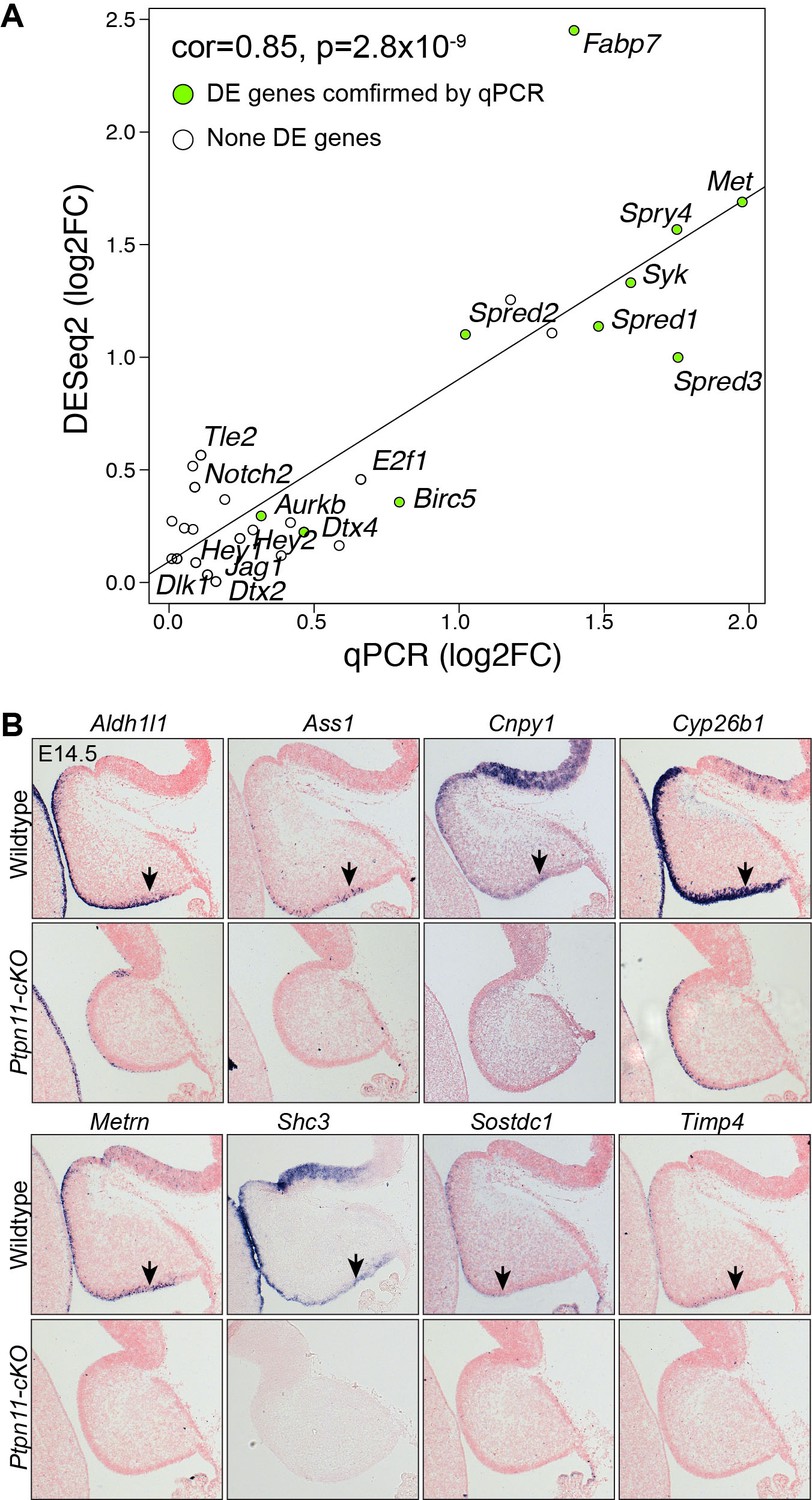
Validation of RNA-seq data.
(A) Correlation between qPCR and RNA-seq data. Pearson correlation test. (B) In situ hybridization on sagittal sections of wild-type and Ptpn11-cKO cerebella at E14.5. Arrowheads indicate transcripts in the VZ.
Figure 2—figure supplement 2

The loss of Ptpn11 greatly reduces the expression of BG, but not non-BG, marker genes.
(A and B) Bar plots of log2 fold changes of molecular markers for different cerebellar cell types at E13.5 (A) and E14.5 (B). Note that RNA-seq data suggest no significant change in Slc1a3, a known BG marker, in agreement with our ISH data that show abundant Slc1a3 transcripts in aRG in Ptpn11-cKO cerebella (Figure 2— figure supplementary 1B). Furthermore, the slight increase in the mRNA of Atoh1 and Pax6 in Ptpn11-cKO cerebella at E14.5 compared to the control are in agreement with the thickened EGL found in Ptpn11-cKO mutants as described previously (Li et al., 2014). (C and D) Gene set enrichment analysis plot (C) and heatmap (D) show the significant downregulation of mouse homologues of human bRG markers in Ptpn11-cKO cerebella at E13.5 and E14.5 compared to the control. The color blocks in the horizontal bar beneath the dendrograms indicate the sample genotype.
Figure 3 with 1 supplement
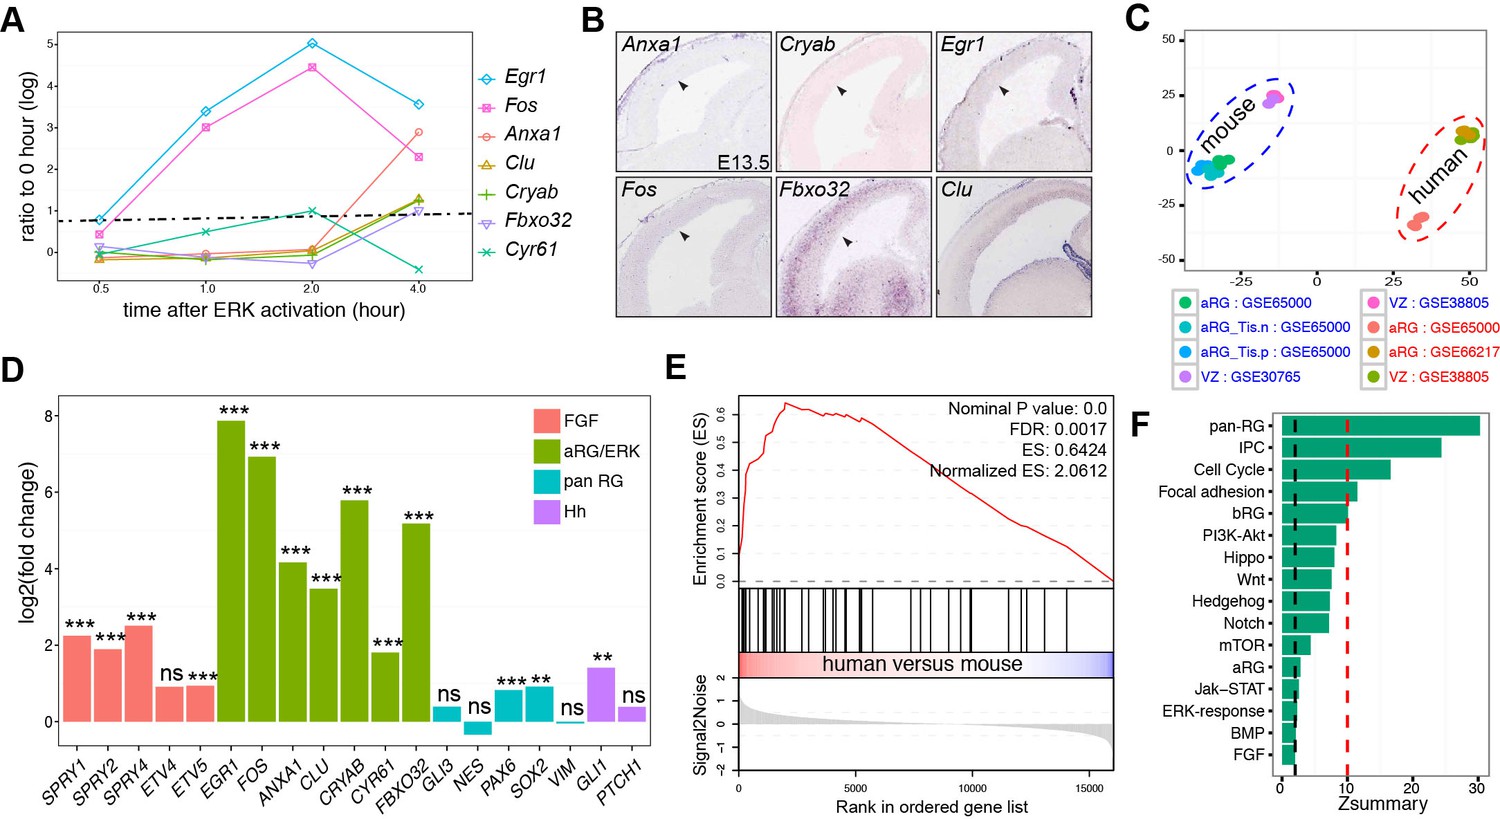
Heightened ERK signaling activity in human aRG.
(A) Line-graph showing the fold increases (log2 scale) in ERK-responding genes between time zero and the indicated time points after ERK activation, based on a microarray time course analysis (Hamilton and Brickman, 2014). The fold changes above the dashed line are statistically significant (adjusted p<0.05). (B) In situ hybridization of mouse cortical sections at E14.5. Images were obtained from GenePaint (Visel et al., 2004). (C) Principal component plot showing the relationship among samples: GSE30765 (Ayoub et al., 2011), GSE38805 (Fietz et al., 2012), GSE65000 (Florio et al., 2015), and GSE66217 (Johnson et al., 2015). (D) RNA-seq analysis of FGF-ERK read-out genes in aRG from human and mouse neocortex. **p<0.005; ***p<0.001; ns, not significant. (E) Gene Set Enrichment Analysis plot shows the significant enrichment of early-response (within 2 hr) genes induced by ERK activation in human versus mouse aRG. (F) Preservation of pathways and gene sets in human and mouse cortical coexpression networks. The blue and red dashed lines indicate Zsummary at 2 and 10, which are the cutoff for not significant and highly significant, respectively.
Figure 3—figure supplement 1
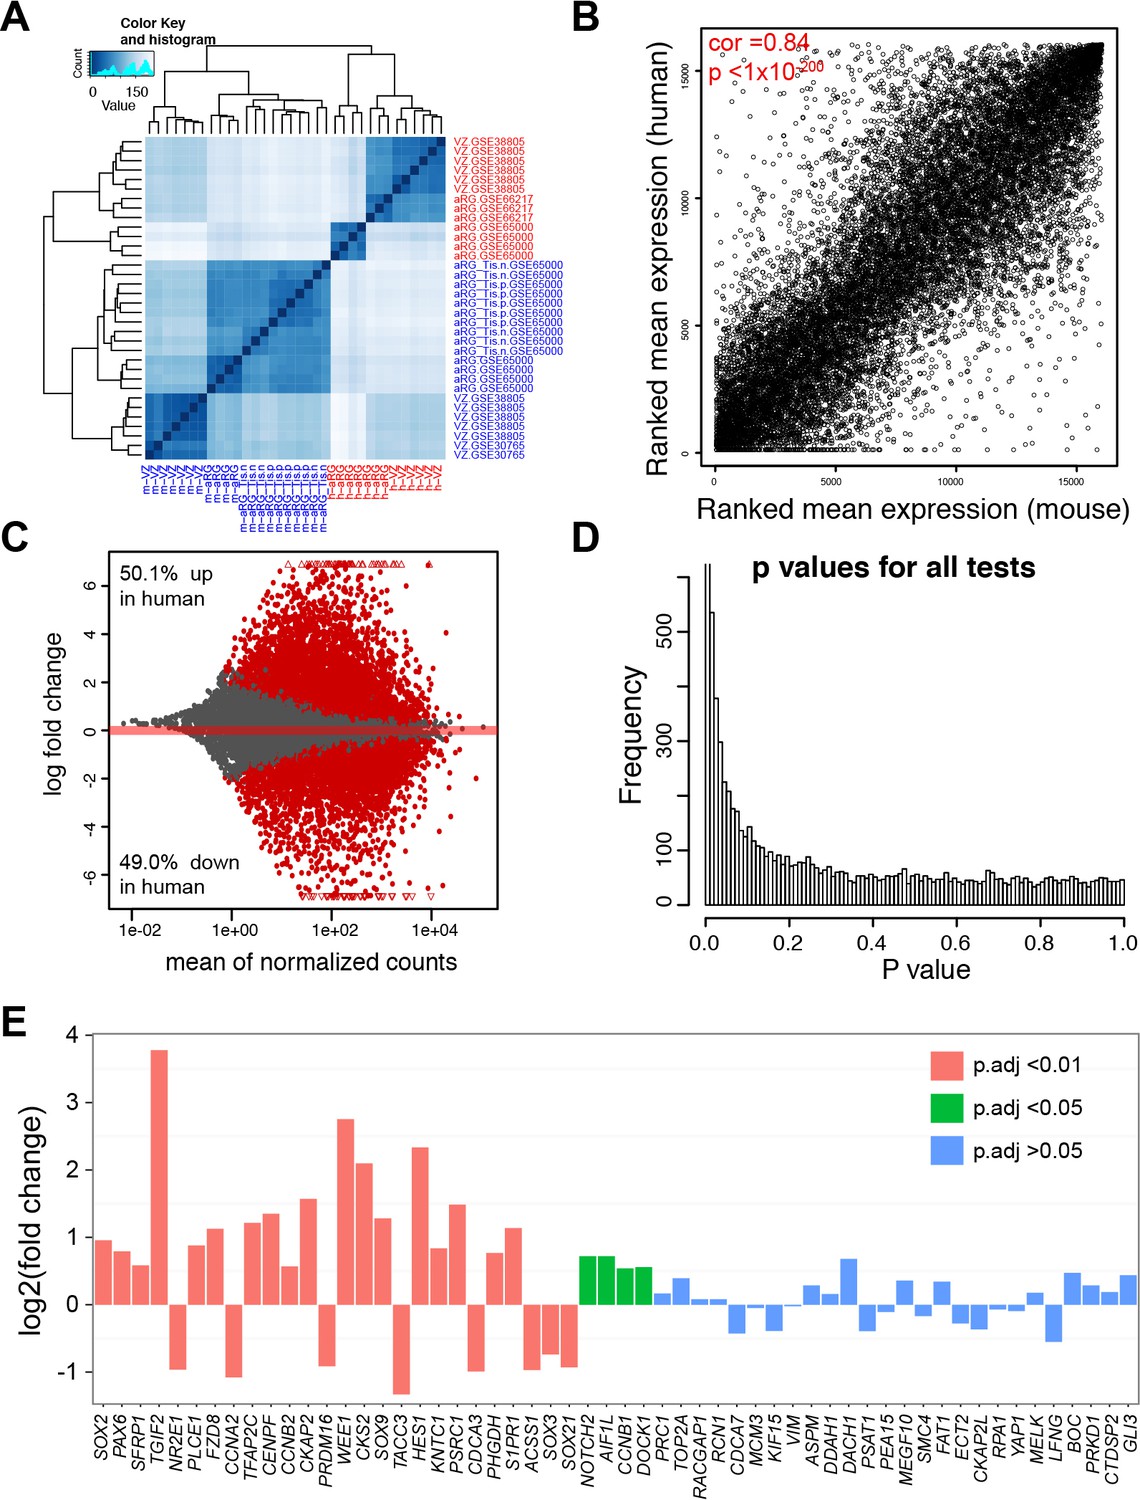
Comparison of gene expression in aRG/VZ between human and mouse neocortex.
(A) Heatmap showing the relationship among samples, GSE30765 (Ayoub et al., 2011), GSE38805 (Fietz et al., 2012), GSE65000 (Florio et al., 2015), and GSE66217 (Johnson et al., 2015), as calculated from the variance stabilizing transformation of the gene counts. (B) Scatterplot of ranked average gene expression between human and mouse. (C) MAplot showing log2 fold changes attributable to a given variable over the mean of normalized counts. Red points indicate the adjusted p<0.05, triangles indicate points outside the range. (D) Histogram of p value distribution. Note the anti-conservative p value distribution as expected. (E) Barplots showing human versus mouse fold changes (log2) in levels of pan radial glial markers identified previously (Lui et al., 2014).
Figure 4
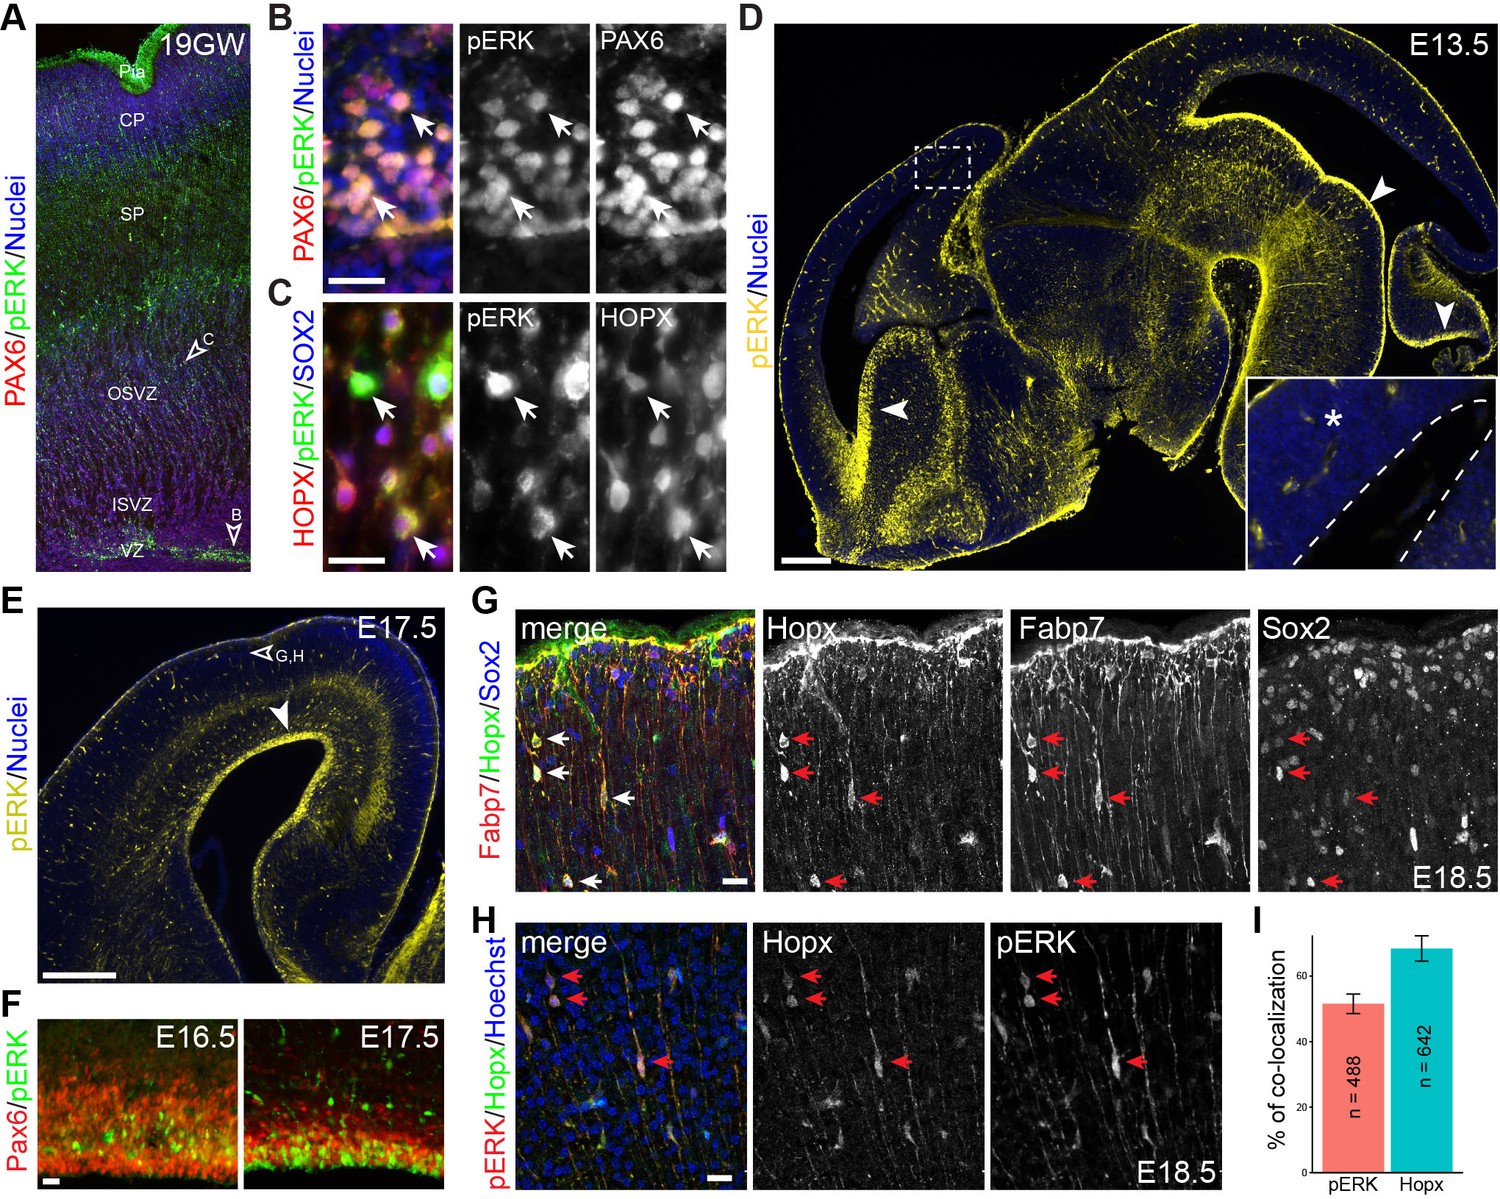
Activation of ERK signaling is associated with bRG formation.
(A–H) Immunofluorescence on sections of human (A–C, 19 gestational week) and mouse (D–H) fetal brains. Arrowheads indicate the regions that are enlarged in B and C and show pERK immunoreactivity in Pax6-positive aRG (B) and Hopx/Sox2 doubled-labeled bRG (C); the boxed areas in D are enlarged in the inset; the dashed line demarcates the ventricle; arrowheads point to robust pERK staining in the ventricular zone (VZ); the unfilled arrowhead in E indicates the area enlarged in G and H. Note that pERK signals are increased at the apical surface of VZ from E16.5 to E17.5 (F). Arrows indicate Hopx/Fabp7/Sox2 triple-positive cells (G) and Hopx/pERK double-labeled cells (H) on E18.5 cortical sections. Nuclei are stained with Hoechst 33342. (I) Bar charts showing the percentage of Hopx/pERK double-labeled cells relative to the total number of counted pERK (n = 642) or Hopx (n = 488) cells. Abbreviations: cp, cortical plate; ISVZ, inner subventricular zone; OSVZ, outer subventricular zone; Pia, pial surface; SP, cortical subplate. Scale bars: 20 µm (B, C, G, H and F), 200 µm (D), and 100 µm (E).
Figure 5 with 2 supplements
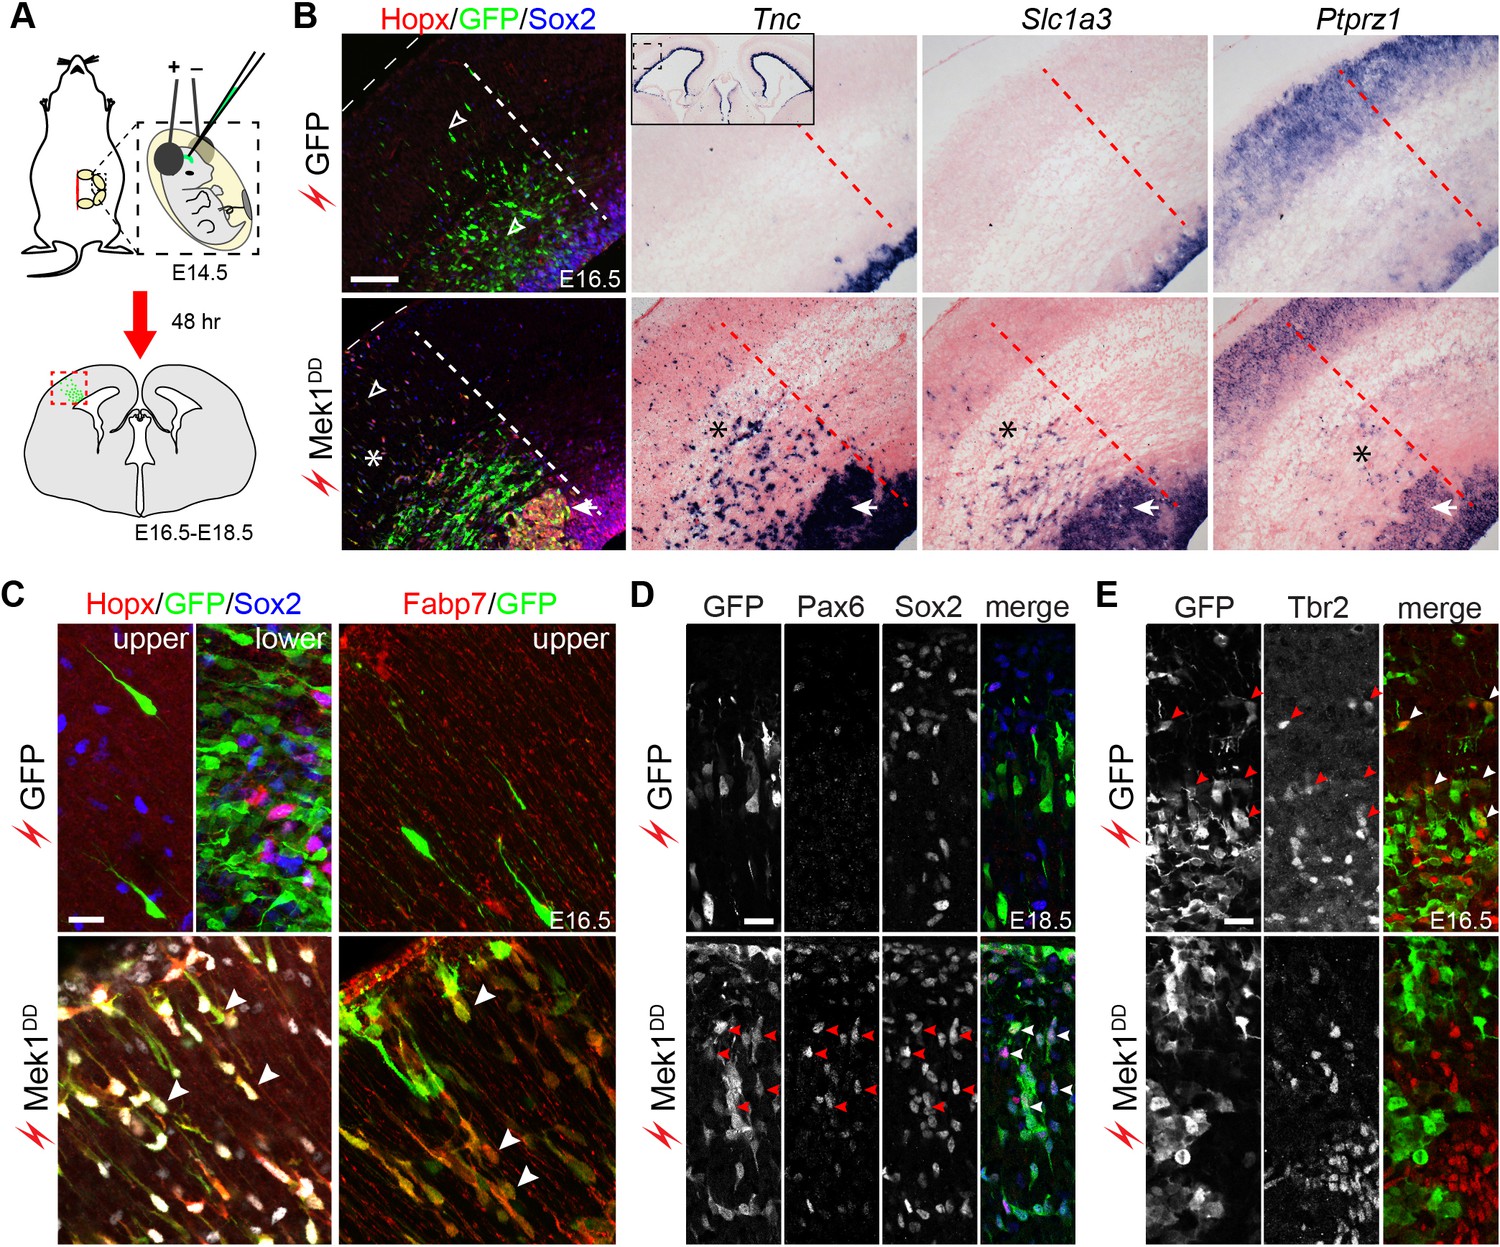
Hyperactivation of ERK signaling induces bRG in the mouse neocortex.
(A) Schematic of the electroporation experiment. The box with the dotted lines indicates the approximate cortical area shown in the rest of the figure. (B–E) Immunofluorescence and in situ hybridization images of adjacent coronal sections of mouse cortices 48 hr (B, C, and E) and 96 hr (D) after the in utero electroporation of the indicated transgene. The thin dotted lines demarcate the pial surface; and the thick dotted lines separate the areas with and without electroporated cells; asterisks indicate the induction of bRG; the arrowheads in D indicate the heterotopia above the VZ; the inset in B is a low-magnification image showing Tnc expression in the cortical VZ on both the transfected and untransfected sides. A three-dimensional rendering of the induced bRG is shown in Video 1. Nuclei are stained with Hoechst 33342. Scale bars: 200 µm (B), 20 µm (C–E).
Figure 5—figure supplement 1
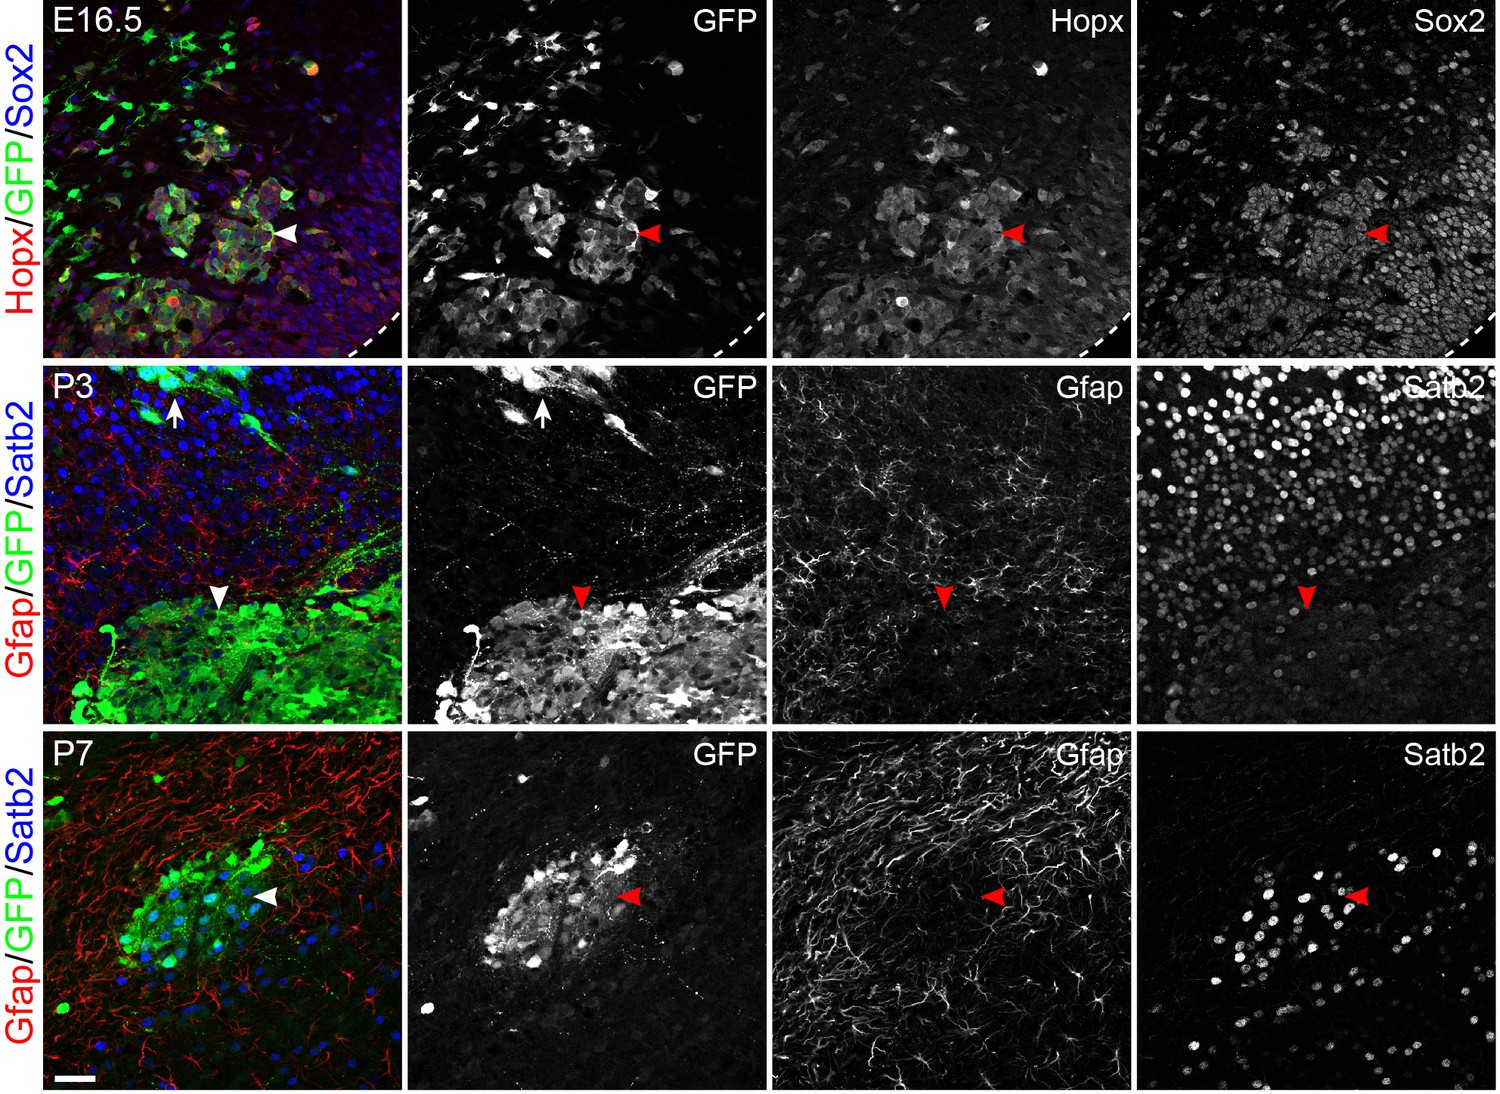
Mek1DD-induced bRG form heterotopia in the lower layer of the cortex.
Immunofluorescence on coronal section of mouse cortices at E16.5, P3, and P7 as indicated after in utero electroporation at E14.5. The dashed line demarcates the ventricular surface; arrowheads indicate the cluster of Mek1DD-transfected cells in the lower layer of the cortex; the arrow shows that a cluster of Sabt2+ neurons derived from Mek1DD-transfected cells. Note that Mek1DD-transfected cells in the heterotopia mostly express Sabt2 but not Gfap. Scale bars: 40 µm.
Figure 5—figure supplement 2
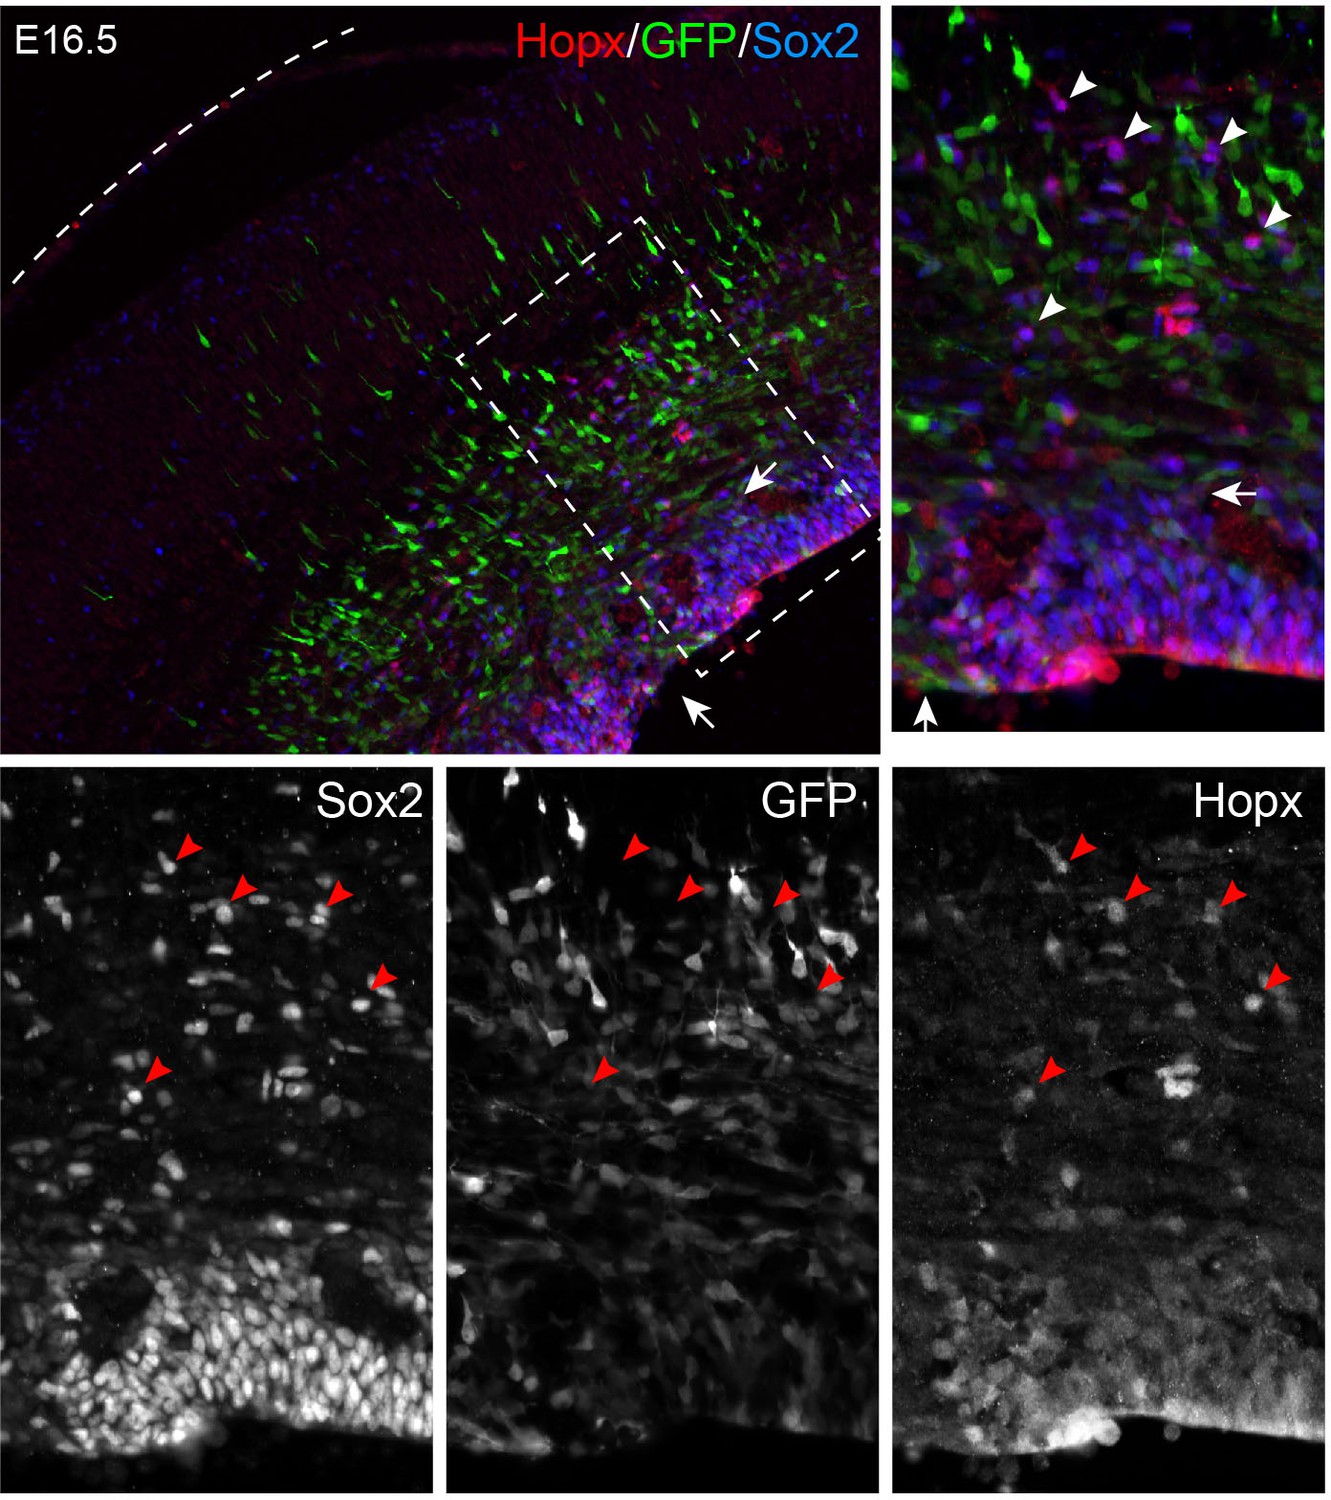
Electroporation of EGFP does not induce bRG.
Immunofluorescence on coronal sections of E16.5 neocortex following in utero electroporation of EGFP at E14.5. The boxed area is enlarged; the dashed line outlines the pial surface. Arrows indicate the perturbed VZ due to electroporation. Arrowheads show bRG that are positive for Hopx and Sox2, but lack GFP expression.
Figure 6
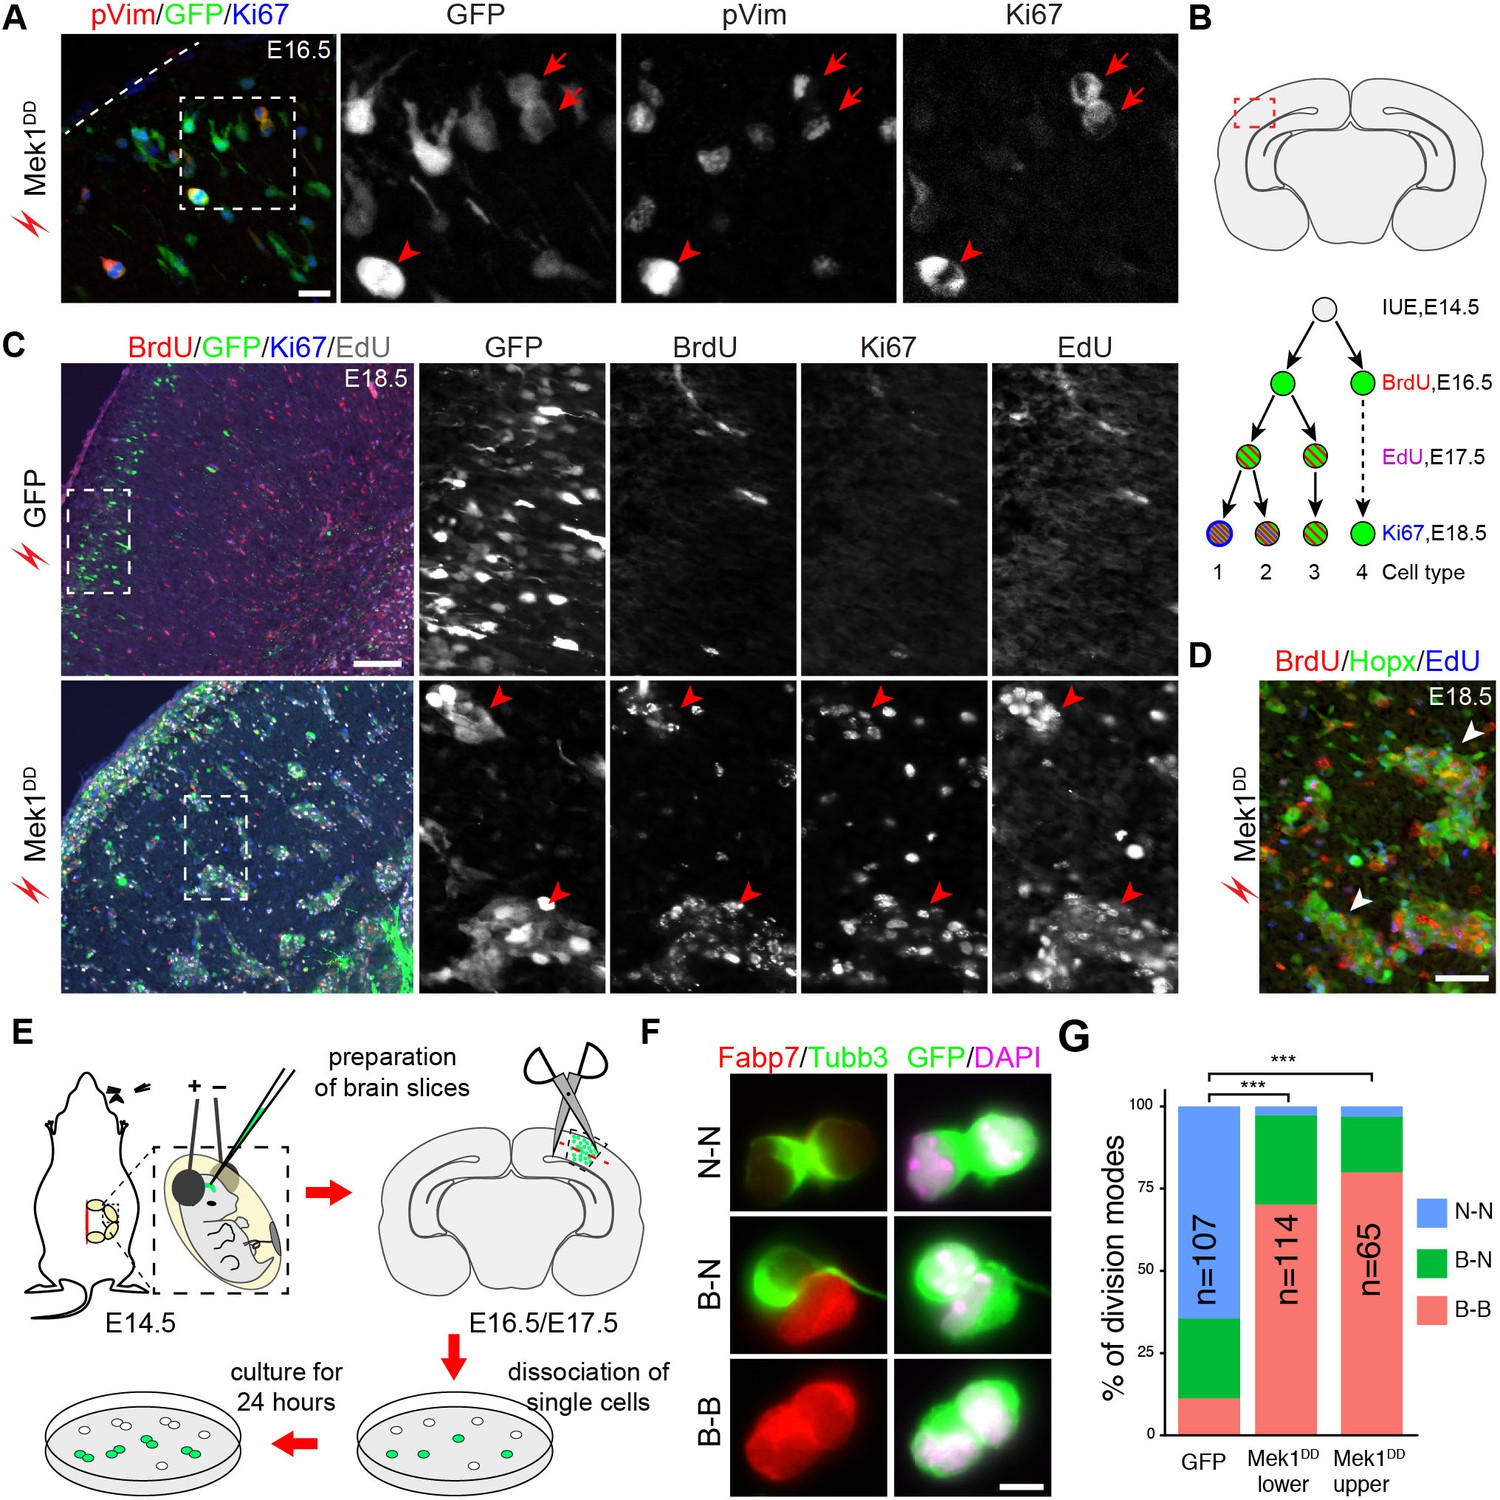
Mek1DD-induced bRG undergo multiple rounds of self-renewing divisions.
(A) Immunofluorescence of phosphorylated vimentin (pVim), GFP, and Ki67 on coronal sections of E14.5 mouse cortex 48 hr after their electroporation. Dashed lines demarcate the pial surface; arrowheads indicate pVim-positive transfected cells (marked by GFP); arrows indicate a doublet of bRG at the end of mitosis. (B) Illustrations showing the boxed area that is corresponding to the images in this figure (upper) and the protocol used to study the proliferation of transfected cells (lower). BrdU/EdU/Ki67 triple labeling identifies four types of cells with distinct proliferation history. (C and D) Immunofluorescence on coronal sections of E18.5 mouse cortex electroporated in utero with EGFP or Mek1DD at E14.5. The boxed areas are enlarged and shown in individual channels. Arrowheads denote clusters of Mek1DD-transfected cells (C) and the induced Hopx-positive cells (D), which are mostly BrdU/EdU double (type 2) and BrdU/EdU/Ki67 triple (type 1) positive. (E) Illustration of the cell-pair assay procedure. The red dashed line indicates separation of the upper and lower parts of the cortex transfected with Mek1DD. (F) Immunocytochemistry of transfected cells (GFP+) and daughter-cell pairs. (G) Quantification of the percentage of transfected cells marked by GFP that underwent different modes of divisions. P values were calculated using a χ2 test. Scale bars: 20 µm (A), 200 µm (C), 50 µm (D), and 5 µm (F).
Figure 7
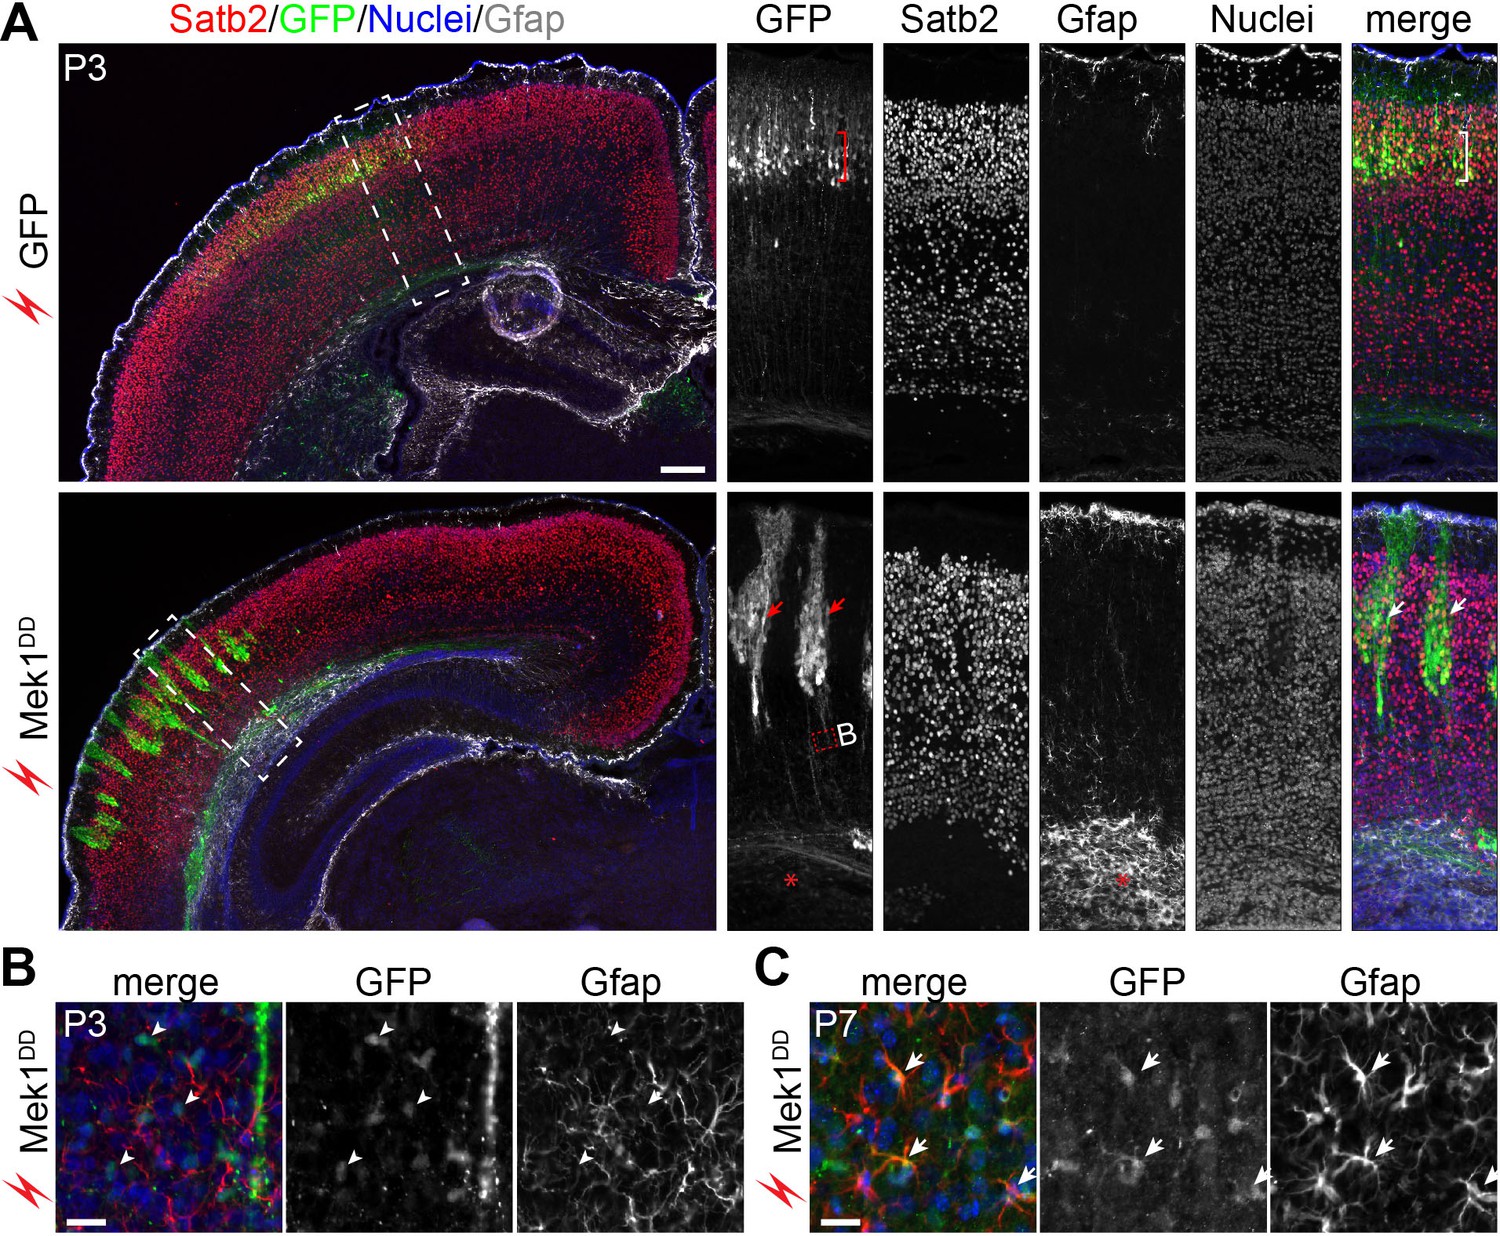
Mek1DD-induced bRG form neurons and astrocytes.
(A) Immunofluorescence of Satb2, GFP, and Gfap on coronal sections of mouse cortex 8 days after electroporation. The bracket indicates layers of Satb2-positive neurons derived from GFP-transfected cells; the arrows show clusters of Satb2-positive neurons formed by Mek1DD-transfected cells; the asterisk denotes the accumulation of astrocytes; arrowheads indicate scattered Mek1DD -transfected cells with weak GFP and negative for Gfap. (B and C) Immunofluorescence of Gfap and GFP on coronal sections of P3 (B) and P7 (C) brains electroporated at E14.5. Arrowheads and arrows point to absence and presence, respectively, of GFP in Gfap+ cells. Nuclei were stained with Hoechst 33342 and are shown in the blue channel.
Figure 8 with 3 supplements
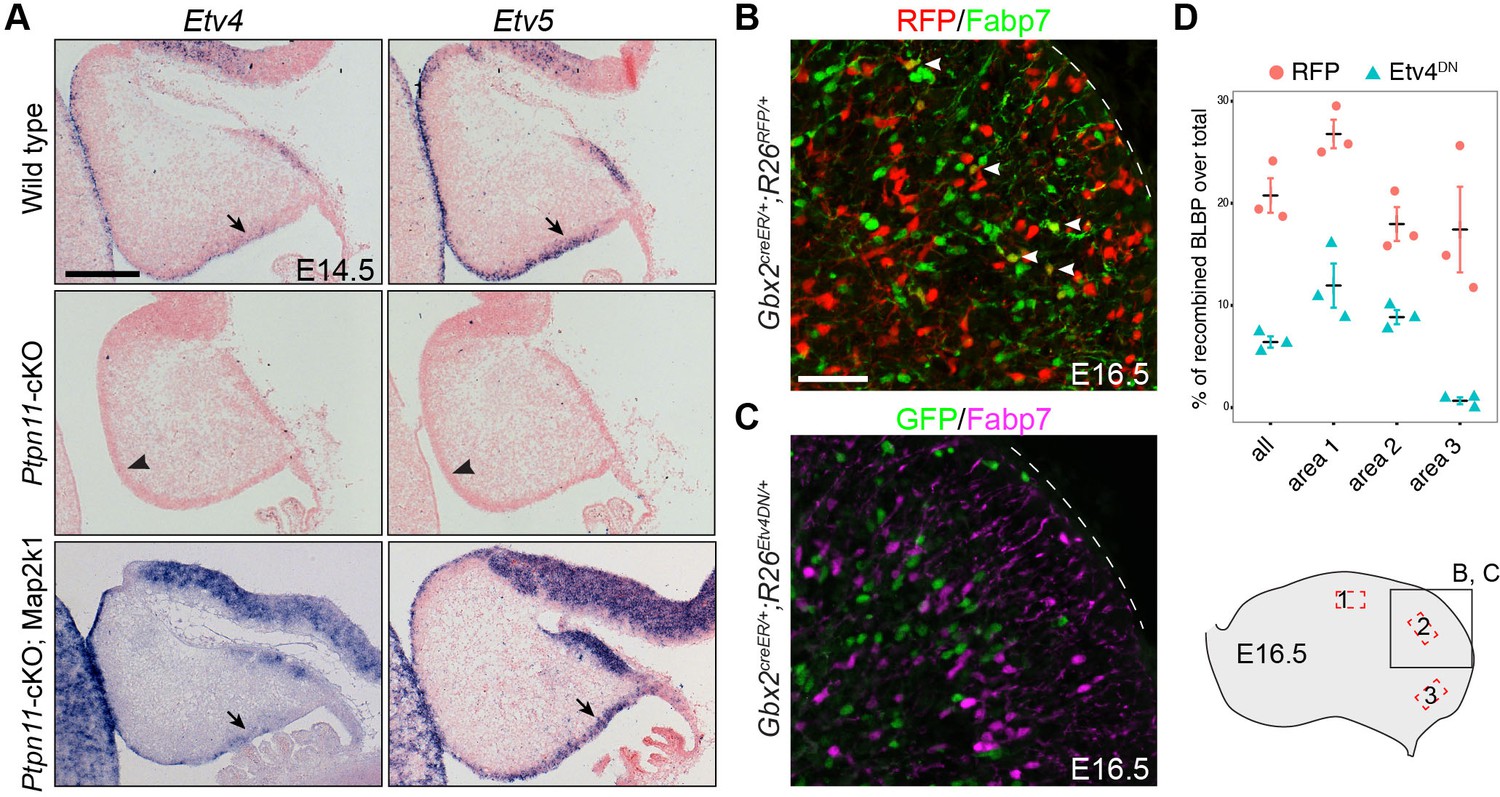
Etv4 and Etv5 are important for BG formation.
(A) In situ hybridization for Etv4 and Etv5 on sagittal sections of E14.5 cerebella. The presence and absence of Etv4 and Etv5 transcripts are indicated by arrows and arrowheads, respectively. (B and C) Immunofluorescence on sagittal sections of E16.5 Gbx2+/creER;R26RFP/+ (B) and Gbx2+/creER;R26Etv4DN/+ cerebella (C) treated with tamoxifen at E9.5. (D) Quantification of RFP and Etv4DN-expressing cells that display Fabp7 immunoreactivity in combined (all) or individual areas 1–3, as indicated in the illustration in the lower right corner. Unpaired Student’s t-test, p=0.008268, t(4) = 8.059 (all); p=0.004507, t(4) = 5.760 (area 1); p=0.006968, t(4) = 5.103 (area 2); p=0.01634, t(4) = 3.985 (area 3).
Figure 8—figure supplement 1
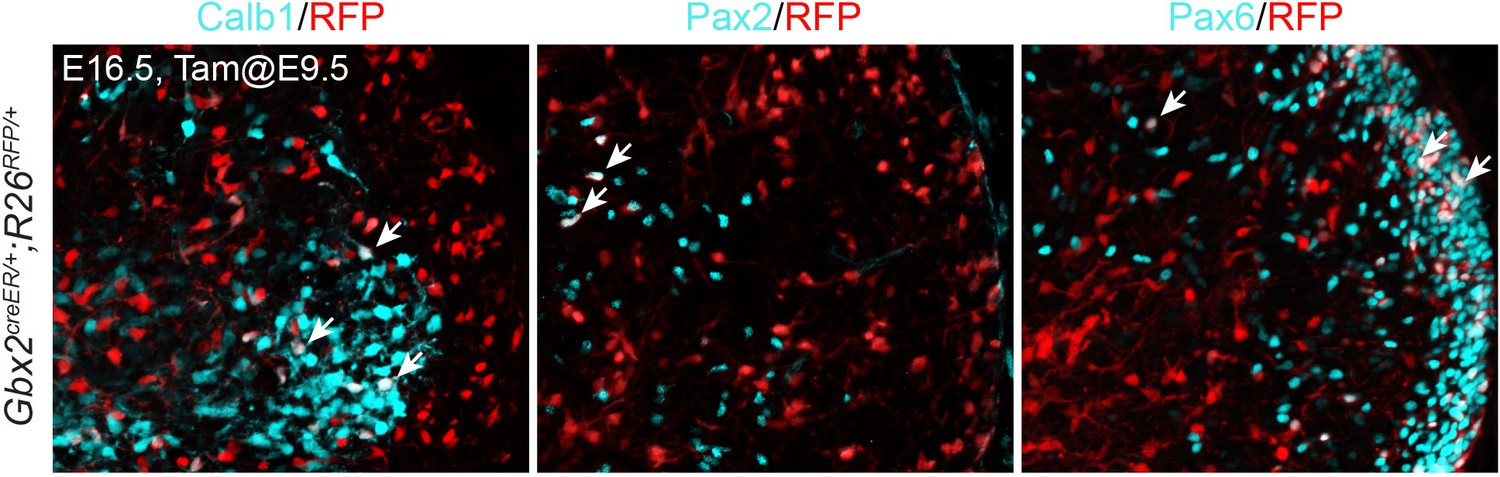
Contribution of Gbx2-expressing cells at E9.5 to different cerebellar cell types.
Immunofluorescence on sagittal sections of E16.5 Gbx2+/creER;R26RFP/+ cerebella treated with tamoxifen at E9.5. Arrows indicate that colocalization of RFP and different cerebellar markers, Calb1 (marking Purkinje cells), Pax2 (GABAergic interneurons), and Pax6 (granule cell precursors).
Figure 8—figure supplement 2
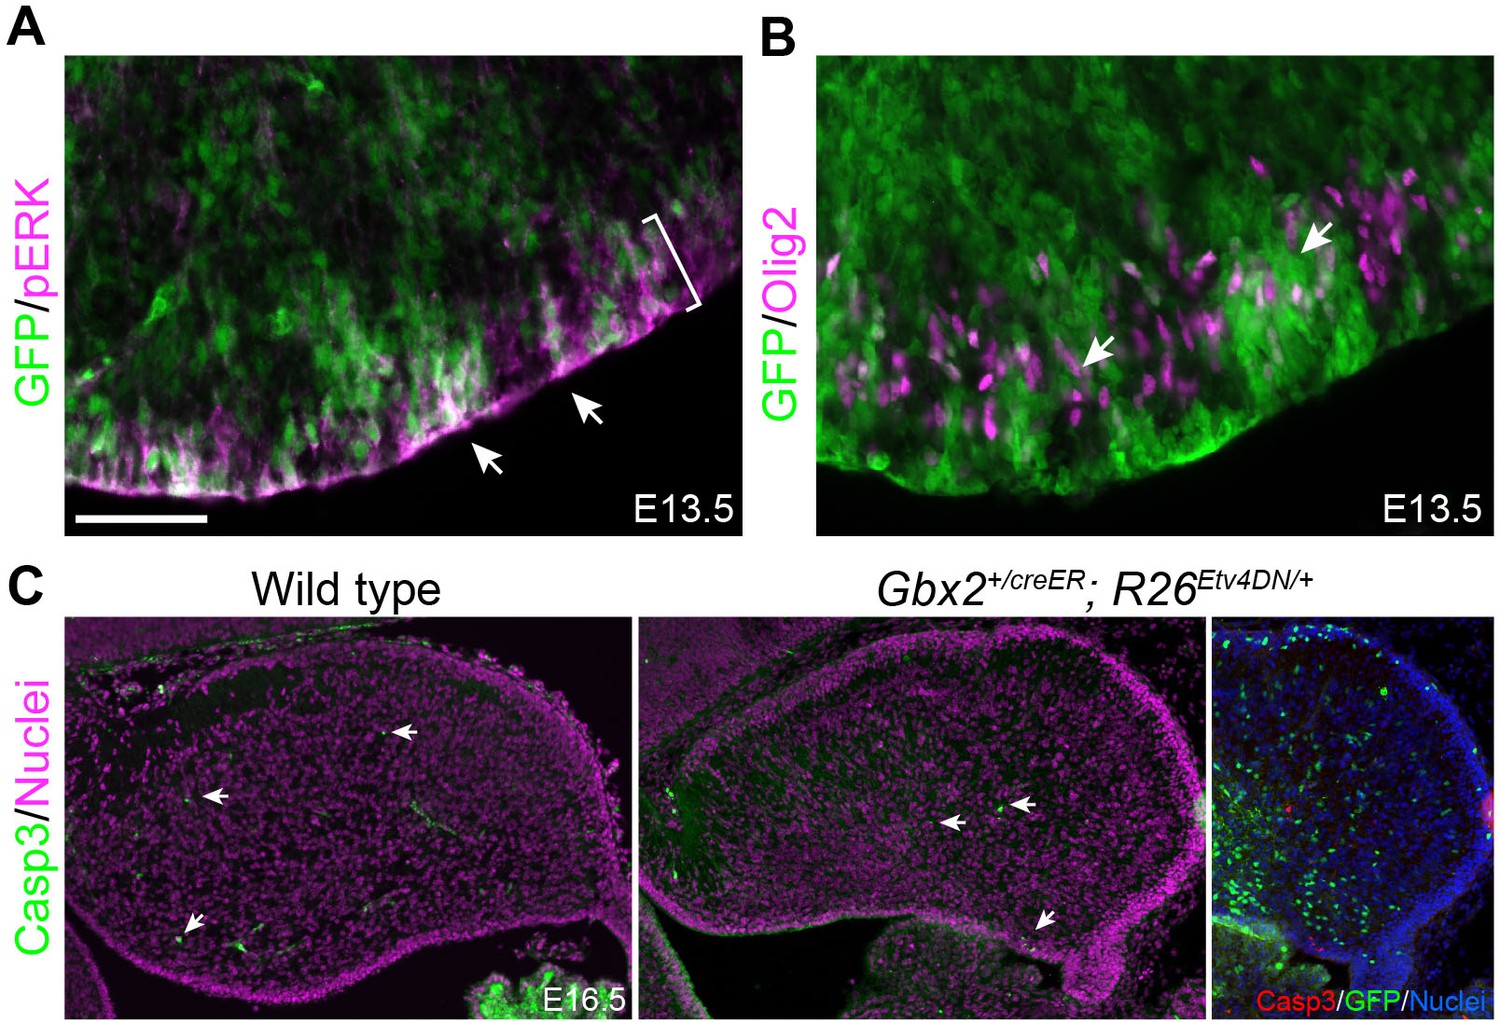
Inactivation of Etv4 and Etv5 does not affect the activation of ERK, neurogenesis, or cell survival.
(A and B) Immunofluorescence of GFP together with pERK (A) or Olig2 (B) on sagittal sections of E13.5 Gbx2+/creER;R26Etv4DN/+ embryos treated with tamoxifen at E9.5. Arrowheads point to pERK and Olig2 immunoreactivity in GFP+ Etv4DN-expressing cells; the bracket demarcates the VZ. (C) Immunofluorescence of activated caspase three on sagittal cerebellar sections of E16.5 wild-type and Gbx2+/creER;R26Etv4DN/+ embryos treated with tamoxifen at E9.5. The few Casp3+ cells are indicated by arrows. Note that the Casp3 is not colocalized with GFP, which marks Etv4DN-expressing cells.
Figure 8—figure supplement 3
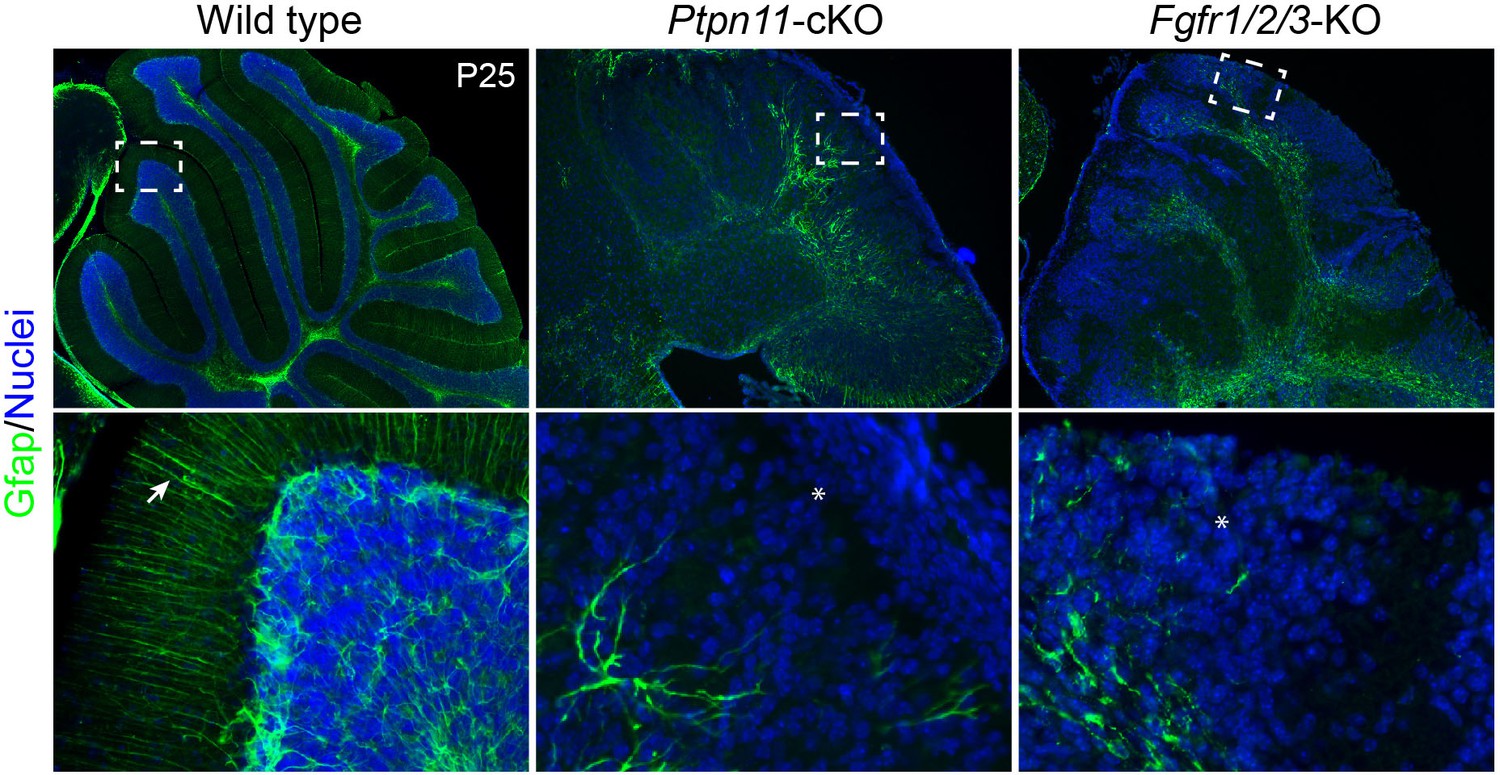
Simultaneous deletion of Fgfr1, Fgfr2, and Fgfr3 results in the similar phenotype as that found in Ptpn11-cKO mice.
Immunofluorescence for Gfap on sagittal sections P25 cerebellum of indicated genotypes. The boxes indicate the area that is enlarged in the lower panel; the arrow and asterisk show the presence and absence, respectively, of the parallel radial fibers of BG in the molecular layer. The nuclei were stained with Hoechst 33342.
Figure 9
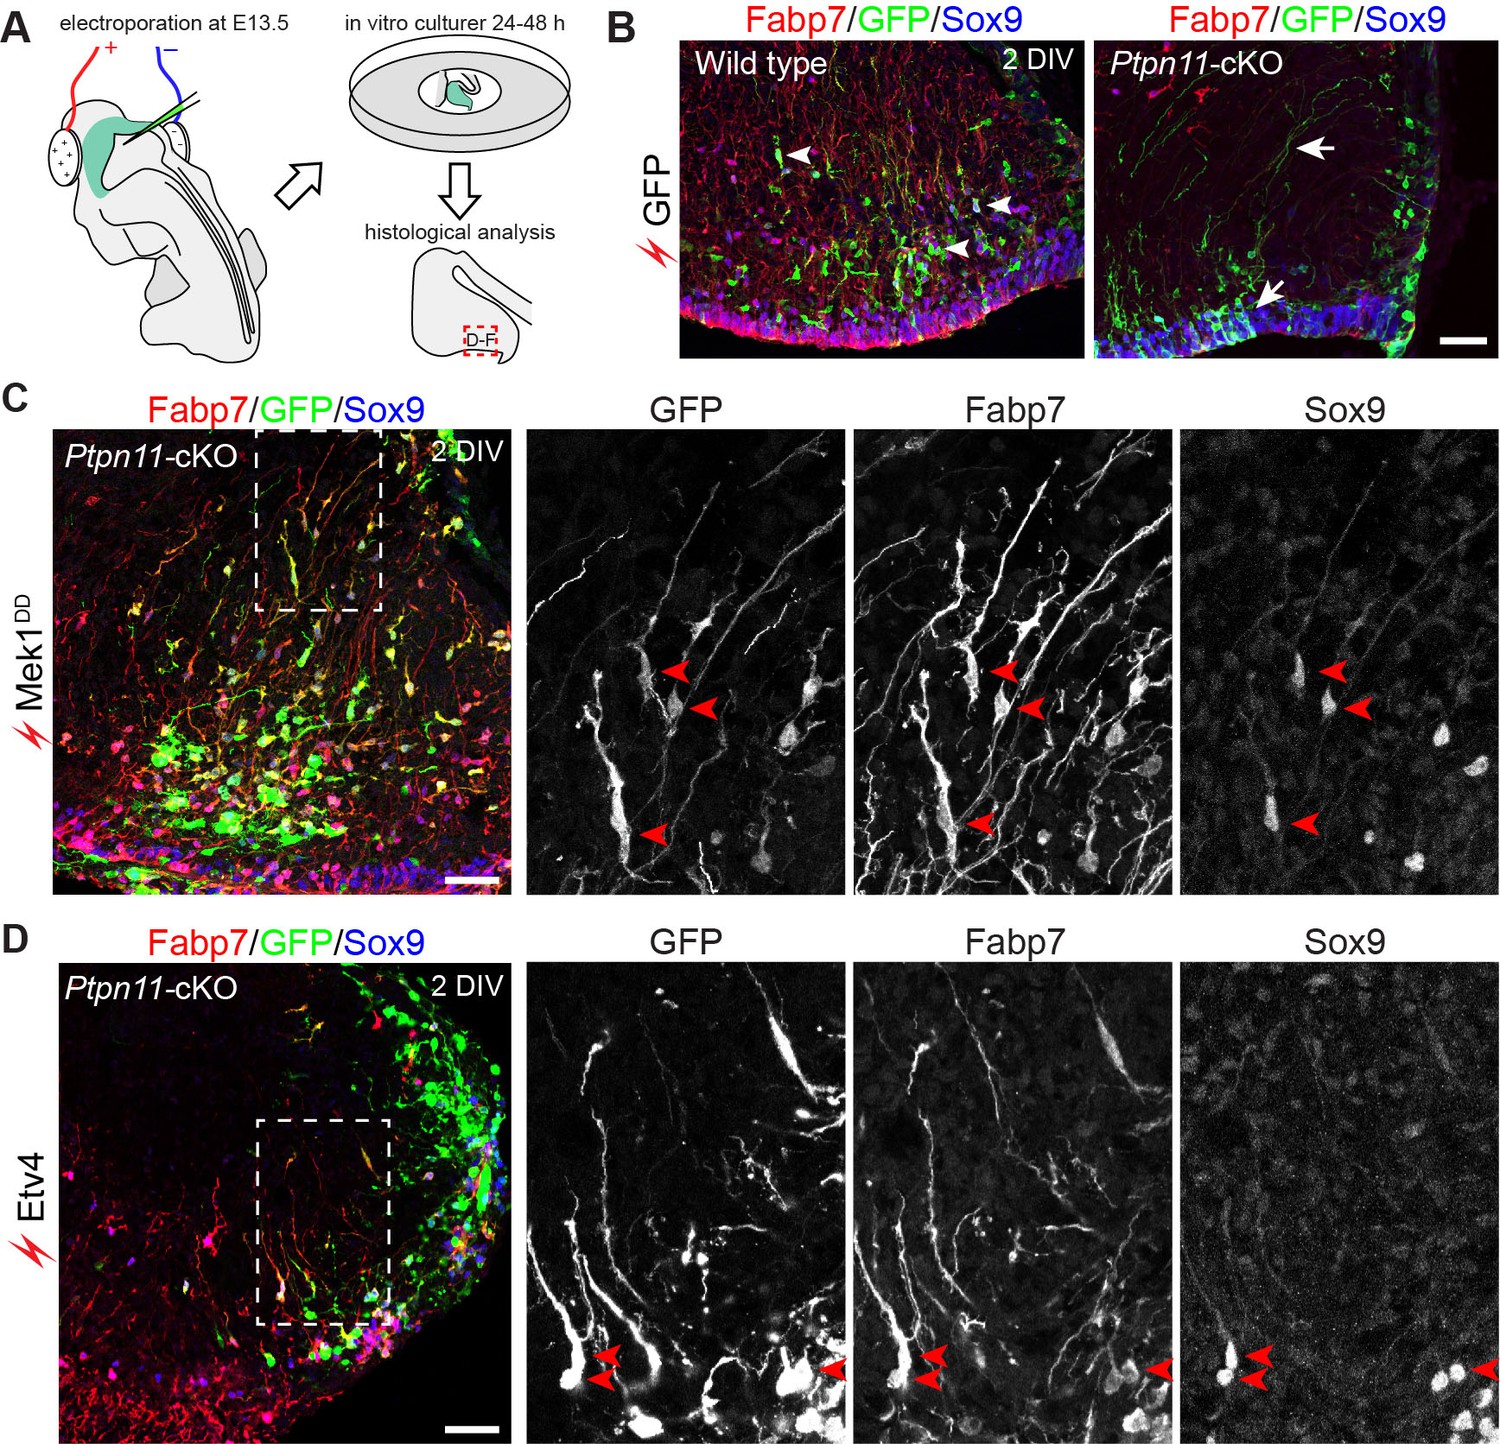
Activation of the ERK-ETV cascade in cerebellar aRG at E13.5 is critical to BG generation.
(A) The procedure for ex vivo electroporation. (B–D) Immunofluorescence of Fabp7, GFP, and Sox9 on sections of cerebellar slices 48 hr (2 day in vitro, 2 DIV) after the electroporation of EGFP (B), Mek1DD (C), or Etv4 (D). Arrows point to the rescued BG; boxed areas are enlarged and shown in individual channels. Scale bar: 50 µm.
Figure 10

Expression of activated FGFR or Etv4 induces bRG in the mouse neocortex.
(A) Immunofluorescence and in situ hybridization images of adjacent coronal sections of mouse cortices 48 hr after the in utero electroporation of the indicated transgene. (B) Quantification of Hopx/GFP double-labeled cells relative to the total number of transfected cells. Each data point represents one embryo in which three or more adjacent sections were examined. Data are presented as the mean ± SEM. P values were calculated using a one-way ANOVA followed by a post-hoc Turkey-Kramer multiple comparison test, F(9) =21.76. (C) Distribution of Hopx-positive cells induced by Mek1DD, FGFR1K656E, and Etv4 in the upper (U), middle (M), and lower (L) parts of the cortex. Scale bars: 200 µm.
Videos
Video 1
Movie of three-dimension rendering of Mek1DD-induced bRG in the mouse cortex.
The red, green and blue channels represent antibody-staining for Hopx, GFP, and Sox2, respectively.
Additional files
-
Supplementary file 1
Marker genes for human neocortical aRG and bRG.
(A) Summary of consensus markers (first spreadsheet) based on two single-cell RNA-seq datasets (Pollen et al., 2015; Thomsen et al., 2016). (B) Table listing putative BG-specific expression of the orthologs of human bRG markers (second spreadsheet). Column A and B: human and mouse gene symbol, respectively; column C: bRG markers identified by SINCERA and/or Pollen et al; column D: scores of BG specific expression; column E and F: BG-specific genes identified by differential expression analysis and WGCNA, respectively; column G: BG-specific genes identified by RNA-seq and inspection of Allen Brain Atlas. (C) BG-specific genes identified by intersecting of DE genes (third spreadsheet). Column A and B: gene symbol of mouse and human genes; column C: entrez gene ID; column D: ensembl gene ID; column D: description of gene name; column F-H: log2 fold changes. (D) BG-specific genes identified by WGCNA (fourth spreadsheet). Column A and B: gene symbol of mouse and human genes; column C: description of gene name; column D: initial assignment of co-expression module; column E: module membership value in the BG (red) module; column K and L: bRG-specific genes identified by Pollen et al and SINCERA (see Figure 1A); column M: BG-specific genes identified by differential gene expression analysis; column N: specific expression in BG of mouse cerebella at postnatal day 56 according Allen Brain Atlas. Scoring criteria: 0, no expression; 1, expressed in Purkinje cells; 2, expression in Purkinje cell layer but not sure in which cell type; 3, expressed in Bergmann glia.
- https://doi.org/10.7554/eLife.23253.024
-
Supplementary file 2
RNA-seq analysis of microdissected cerebellar tissues of wild-type and Ptpn11-cKO embryos with or without Mek1DD expression at E12.5, E13.5 and E14.5.
(A) Summary of RNA-seq (first spreadsheet). (B) Output of STAR mapping (second spreadsheet). (C) Raw gene counts (third spreadsheet). (D) Differentially expressed genes identified by DESeq2 (third spreadsheet). Column A: ensembl gene ID B: gene symbol; column C: entrez gene ID; column D: gene symbol of the human orthologs; column E: entrez ID of human orthologs; Column F: description of gene name; Column G: the mean of normalized counts of all samples; Column H: fold changes on a logarithmic scale to base 2; columns I: Wald statistic; column K: Wald test p-value; column L: Benjamini-Hochberg adjusted p-value; column M: key of pairwise comparison.
- https://doi.org/10.7554/eLife.23253.025
-
Supplementary file 3
Identification of early-response genes induced by ERK activation.
(A) List of differentially expressed genes. Column A: gene symbol; Column B: human gene symbol; column C: ensembl gene ID; column D: description of gene name; Column E: fold changes on a logarithmic scale to base 2; Column F: the mean of normalized expression of all samples; Column G: moderated t-statistic; Column H: raw p-value; Column I: adjusted p-value; column J: log odds that the gene is differentially expressed; column K: key of pairwise comparison.
- https://doi.org/10.7554/eLife.23253.026
-
Supplementary file 4
Output of gene set enrichment analysis of gene expression in neocortical aRG between humans and mice.
(A) Lists of gene sets that are significantly enriched in human aRG (first spreadsheet) or mouse aRG (second spreadsheet). (B) Output of pathway preservation in human and mouse cortical coexpression networks (third spreadsheet).
- https://doi.org/10.7554/eLife.23253.027
-
Supplementary file 5
List of antibodies, primers used in the current study.
(A) Lists of primary and secondary antibodies used in the current study (first spreadsheet). (B, C) Lists of primers used for RT-qPCR (second spreadsheet) and in situ hybridization (third spreadsheet). Gene name, primer names, primer sequence, and references to previously published work (if any) are listed in the first, second, third and fourth column, respectively.
- https://doi.org/10.7554/eLife.23253.028
Download links
A two-part list of links to download the article, or parts of the article, in various formats.
Downloads (link to download the article as PDF)
Open citations (links to open the citations from this article in various online reference manager services)
Cite this article (links to download the citations from this article in formats compatible with various reference manager tools)
Analogous mechanism regulating formation of neocortical basal radial glia and cerebellar Bergmann glia
eLife 6:e23253.
https://doi.org/10.7554/eLife.23253


