Co-expression of xenopsin and rhabdomeric opsin in photoreceptors bearing microvilli and cilia
- University of Bergen, Norway
- University of Pittsburgh, United States
Figures
Figure 1 with 1 supplement
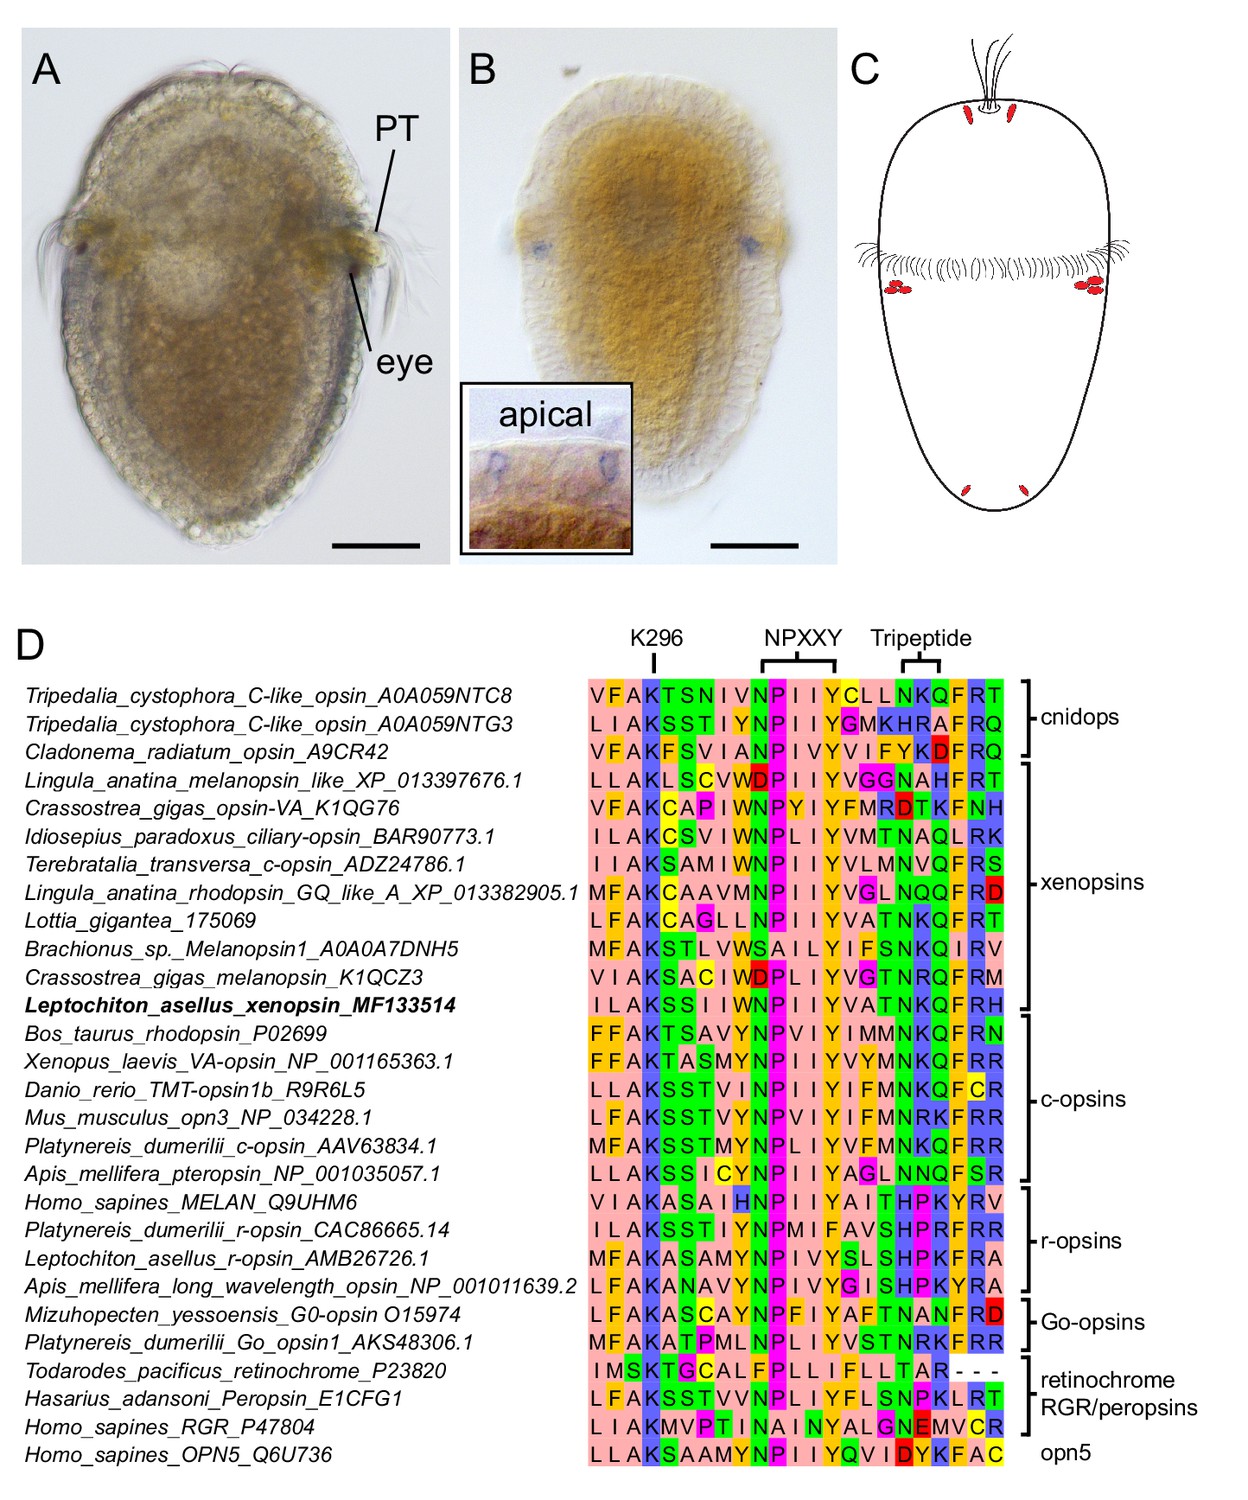
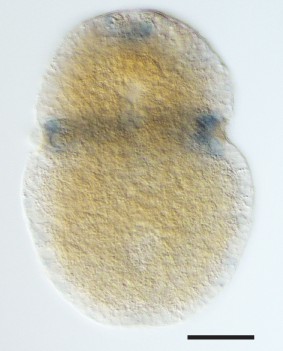
Expression of a new visual pigment (xenopsin) in the L. asellus larva.
(a) In 7 dpf larvae, the eyespot can clearly be seen in a position posterior to the prototroch (PT). (b) The new L. asellus opsin is expressed in the area of the larval eyes, as well as in cells in the apical area and at the very posterior end of the larva. The opsin+ cells at the posterior end can only be seen by confocal imaging because of the small cell size. (c) Schematic drawing of the distribution of the cells expressing the new L. asellus opsin in the larva. (d) The xenopsin found in L. asellus resembles the well-characterized group of c-opsins in containing the tripeptide NKQ, which is important for opsin and G-protein interaction. In contrast to this, the earlier described Las-r-opsin exhibits an HPK motif, which is specific for the r-opsin group. (Scalebars 100 µm in (a) and (b).)
Figure 1—figure supplement 1
Alignment region showing Lys 296, NPXXY and the tripeptide motif for all opsin sequences included in the study.
https://doi.org/10.7554/eLife.23435.004
Figure 2 with 3 supplements
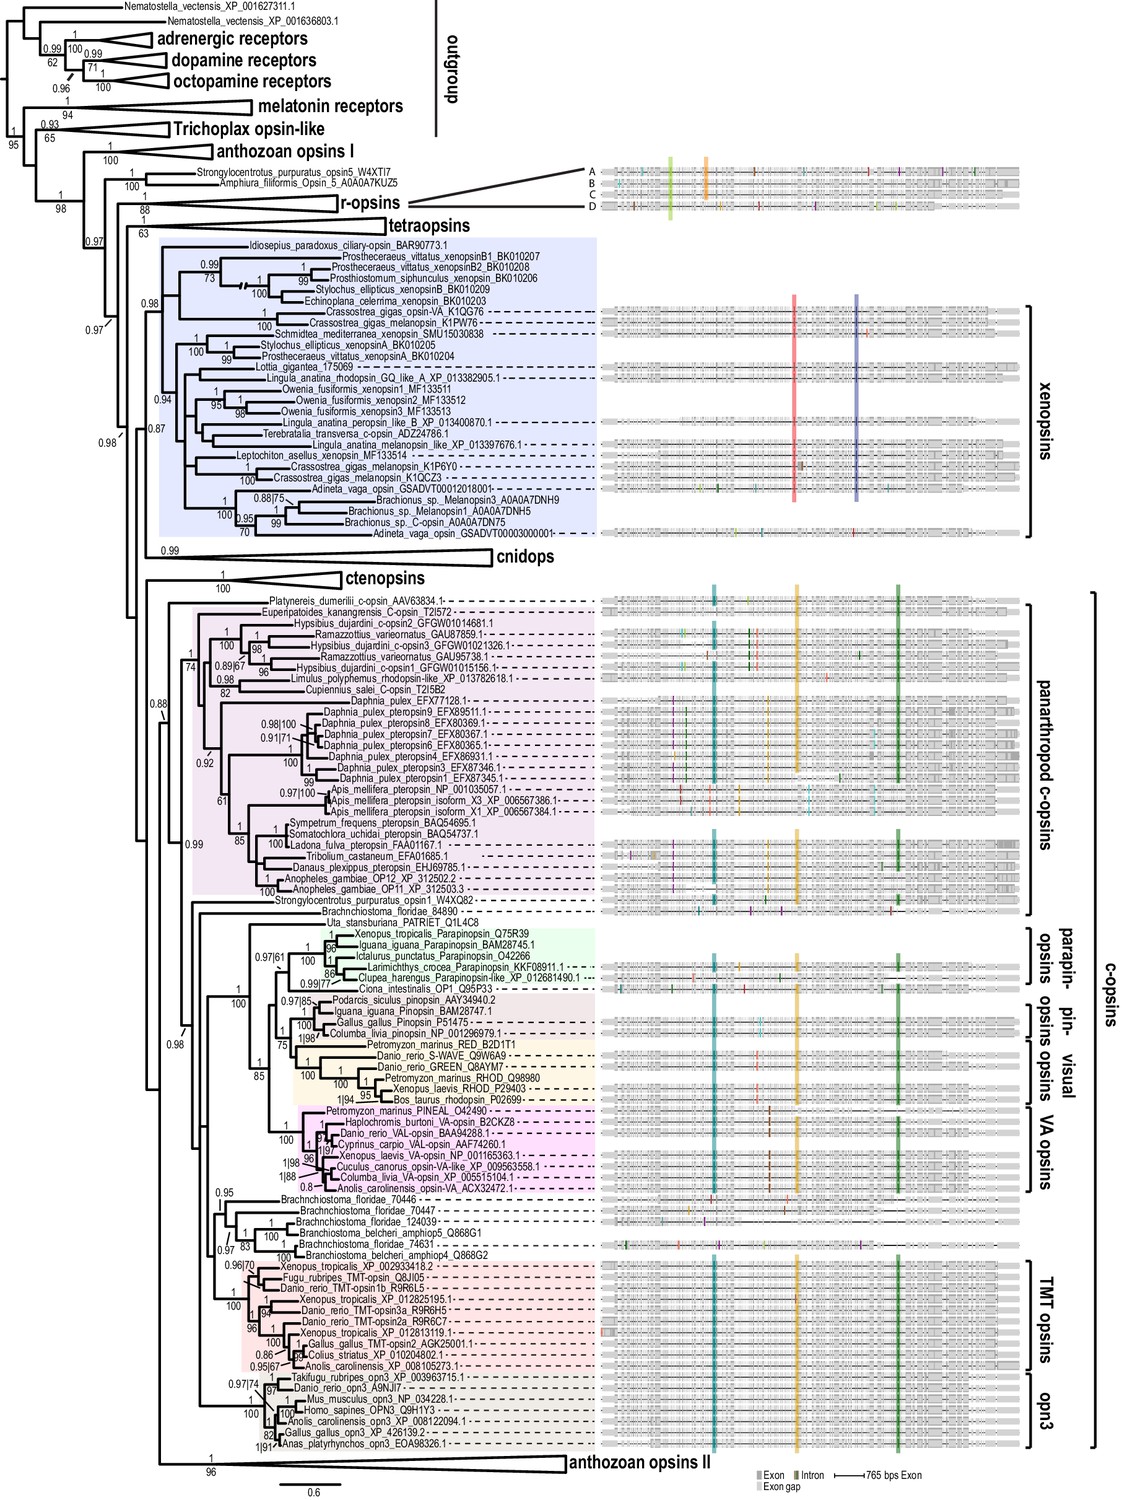
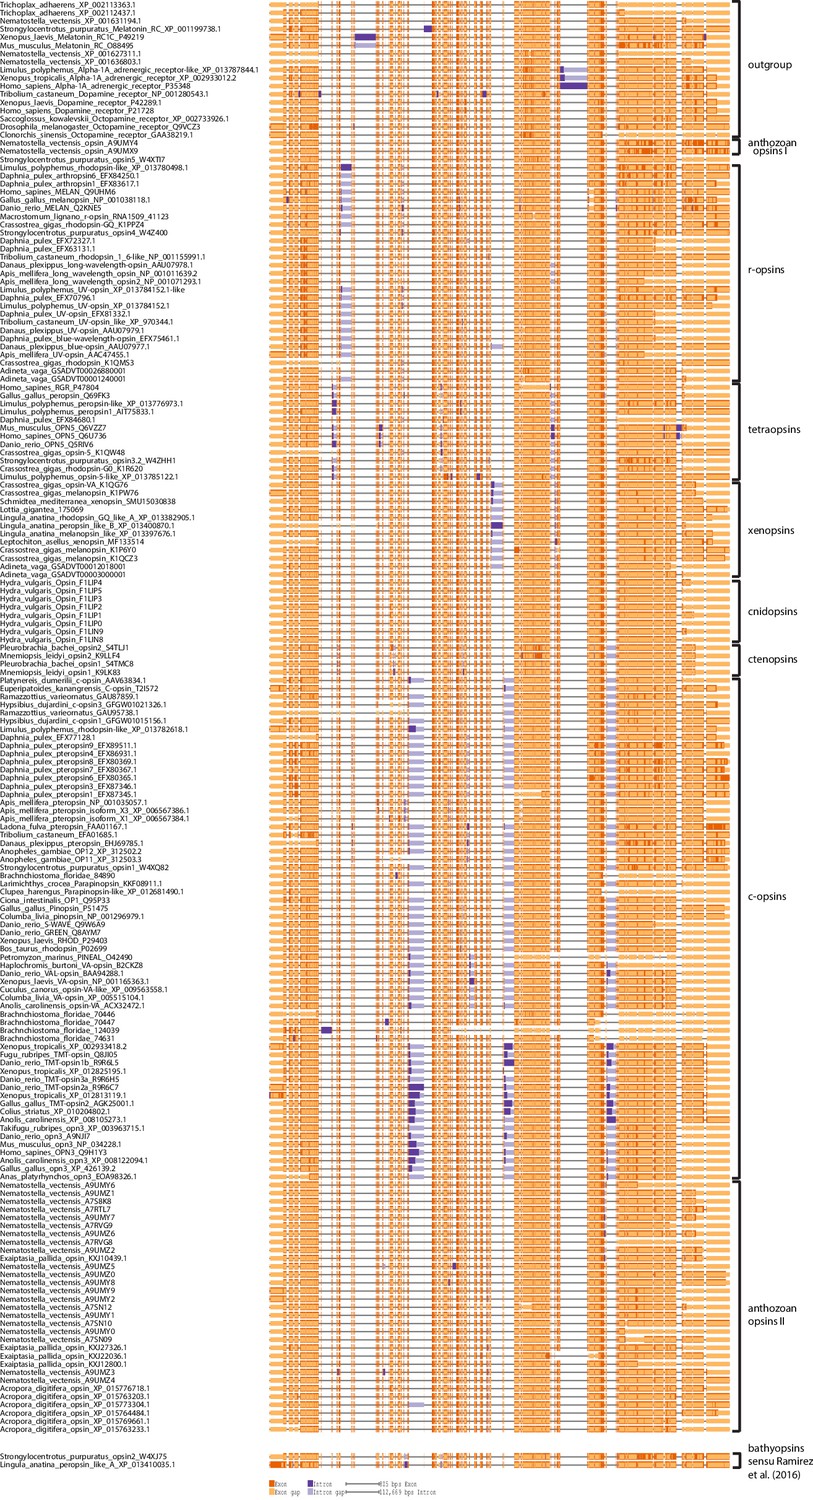
Opsin phylogeny and gene structure analysis.
Majority consensus tree of Bayesian analysis (Phylobayes, DS-GTR + Γ, 60,000 cycles). Bayesian posterior probabilities and bootstrap values from parallel RAxML analysis are shown. See Figure 2—figure supplement 1 for uncollapsed tree and Figure 2—source data 1 for gene accession numbers. Intron positions (colored bars) are mapped on the uncurated protein sequence alignment and conserved positions are highlighted by bars spanning several sequences. See Figure 2—figure supplement 2 for full opsin gene structures and Figure 2—figure supplement 3 for intron phases. The new L. asellus opsin falls with high support into the group of xenopsins, which is only distantly related to c-opsins. All major c-opsin subgroups share three conserved intron positions. While cnidops that form the sister group of xenopsins lack introns, the two intron positions that are conserved in xenopsins do not overlap with those of c-opsin introns, indicating independent evolutionary origins for xenopsins and c-opsins. The r-opsin sequences included in the gene structure representations are those of A: Apis mellifera UV opsin; B: Limulus polyphemus UV-like opsin; C: Crassostrea gigas r-opsin 10013541; and D: Homo sapiens melanopsin.
-
Figure 2—source data 1
Accession numbers of sequences used for opsin tree inference.
- https://doi.org/10.7554/eLife.23435.009
Figure 2—figure supplement 1
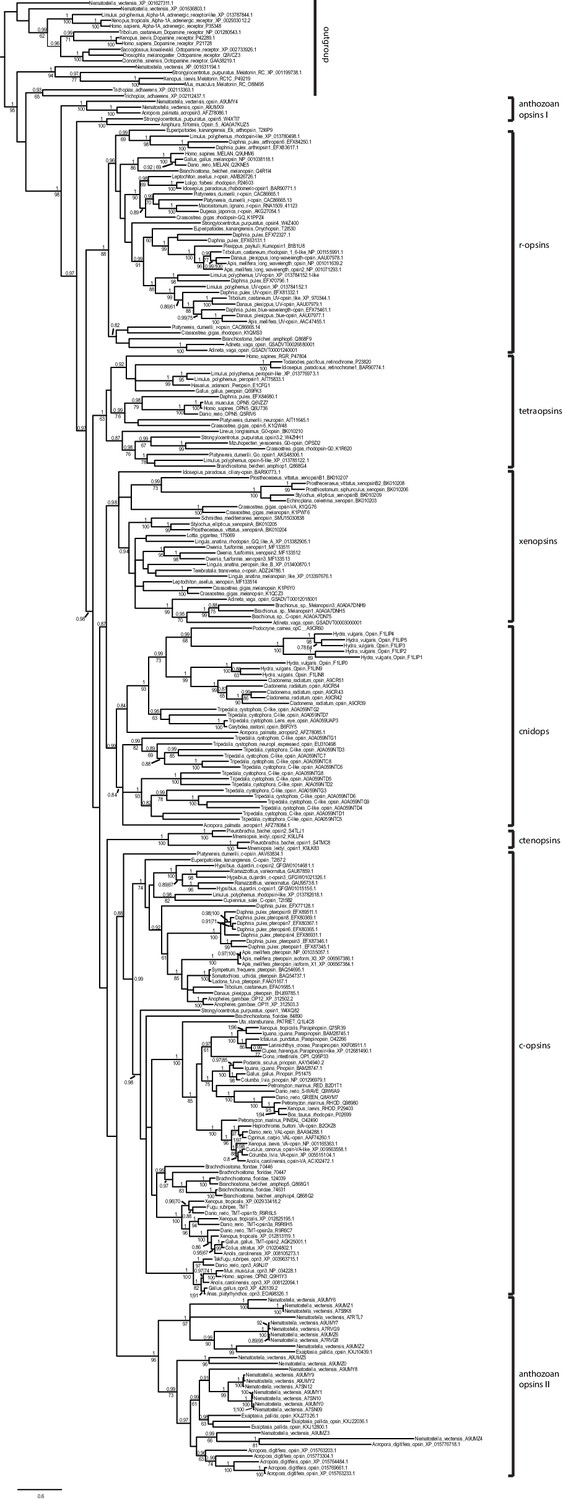
Uncollapsed tree of Bayesian phylogenetic opsin analysis (Phylobayes, dataset specific model DS-GTR + Γ, 60,000 cycles).
Majority consensus tree of Bayesian analysis, Bayesian posterior probabilities and bootstrap values from parallel RAxML analysis are shown. Tetraopsins and r-opsins were secondarily downsampled to reduce computation time, especially for the cross-validation analysis performed for model evaluation. All major opsin groups are well-supported. Xenopsins show no close relationship to c-opsins, but form the sister group to cnidops.
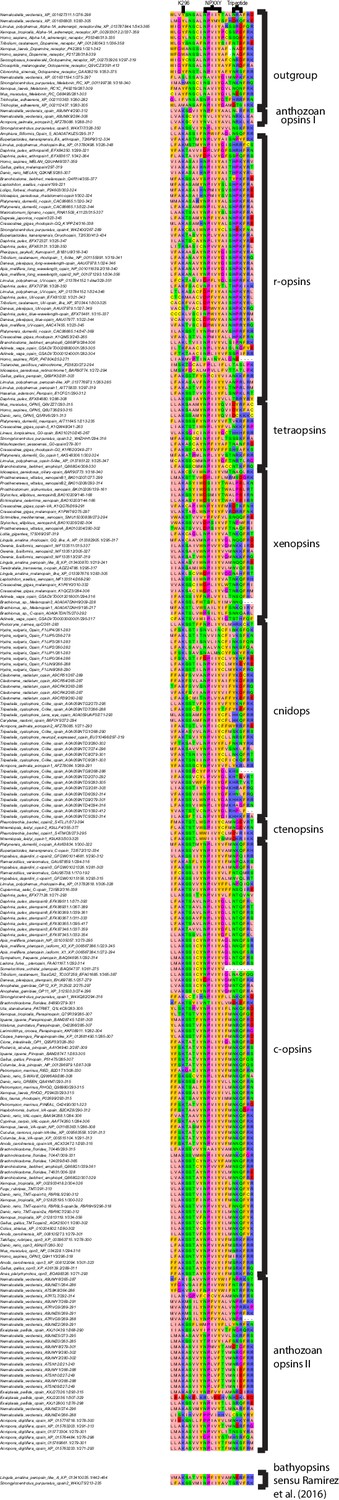
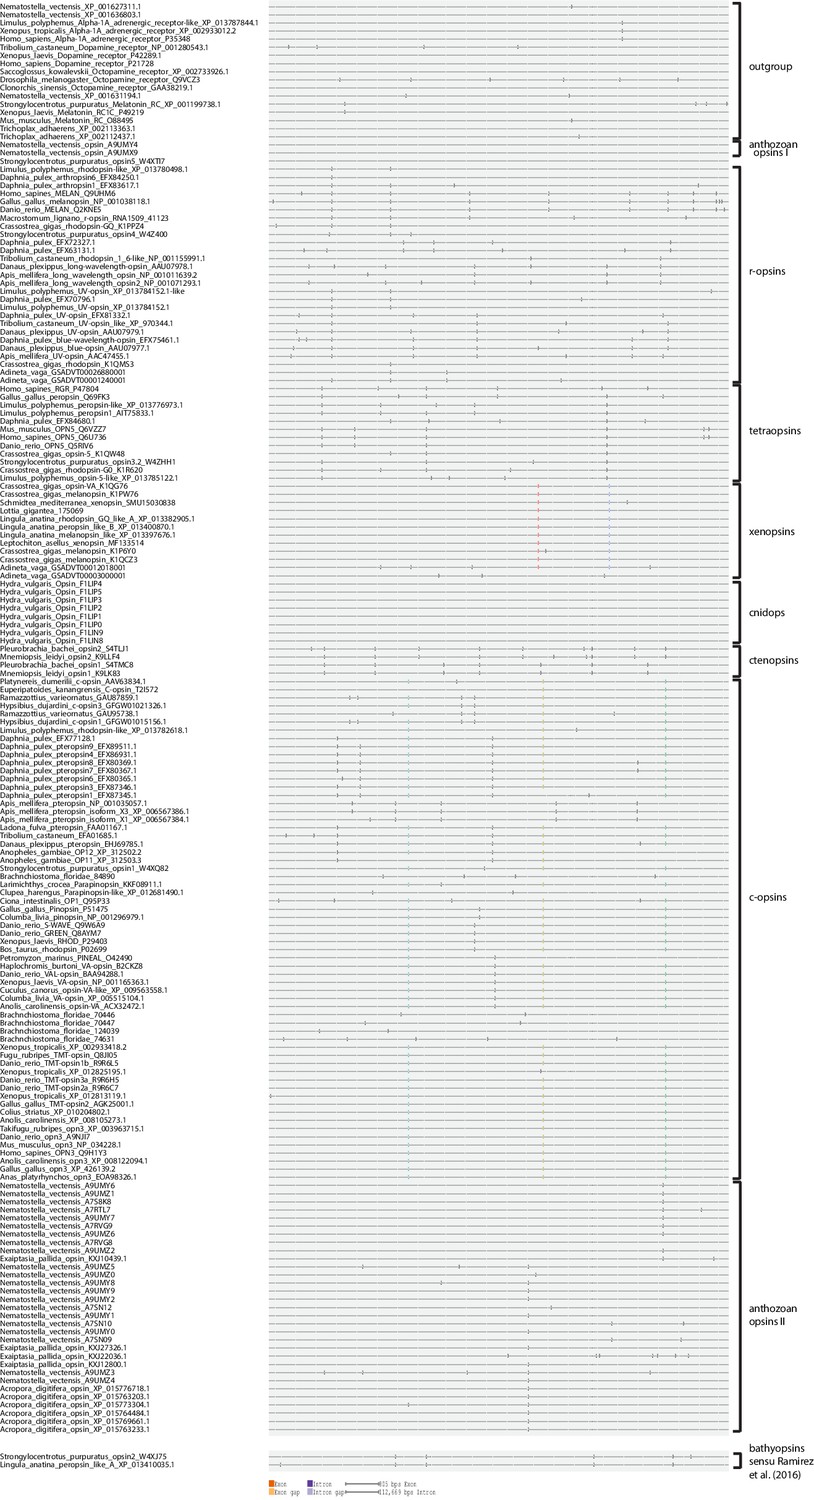
Figure 2—figure supplement 2
Opsin gene structures mapped onto a protein alignment of all opsins included in the phylogenetic analysis, where genomic information was publicly available or generated by this study as for P. dumerilii c-opsin and L. asellus xenopsin.
Introns are mapped onto the uncurated protein sequence alignment of the phylogenetic analysis. All major c-opsin subgroups share three conserved intron positions. While cnidops lack introns, the two intron positions conserved in xenopsins do not overlap with those of the c-opsin introns. This independent source of information corroborates an independent evolutionary origin of c-opsins and col-opsisn as inferred by the phylogenetic analysis.
Figure 2—figure supplement 3
Intron phase analysis of all opsins included into the phylogenetic analysis, where genomic information was publicly available or generated by this study, showing that the type-specific introns in c-opsins and xenopsins are conserved not only by position but also by intron phase.
https://doi.org/10.7554/eLife.23435.008
Figure 3
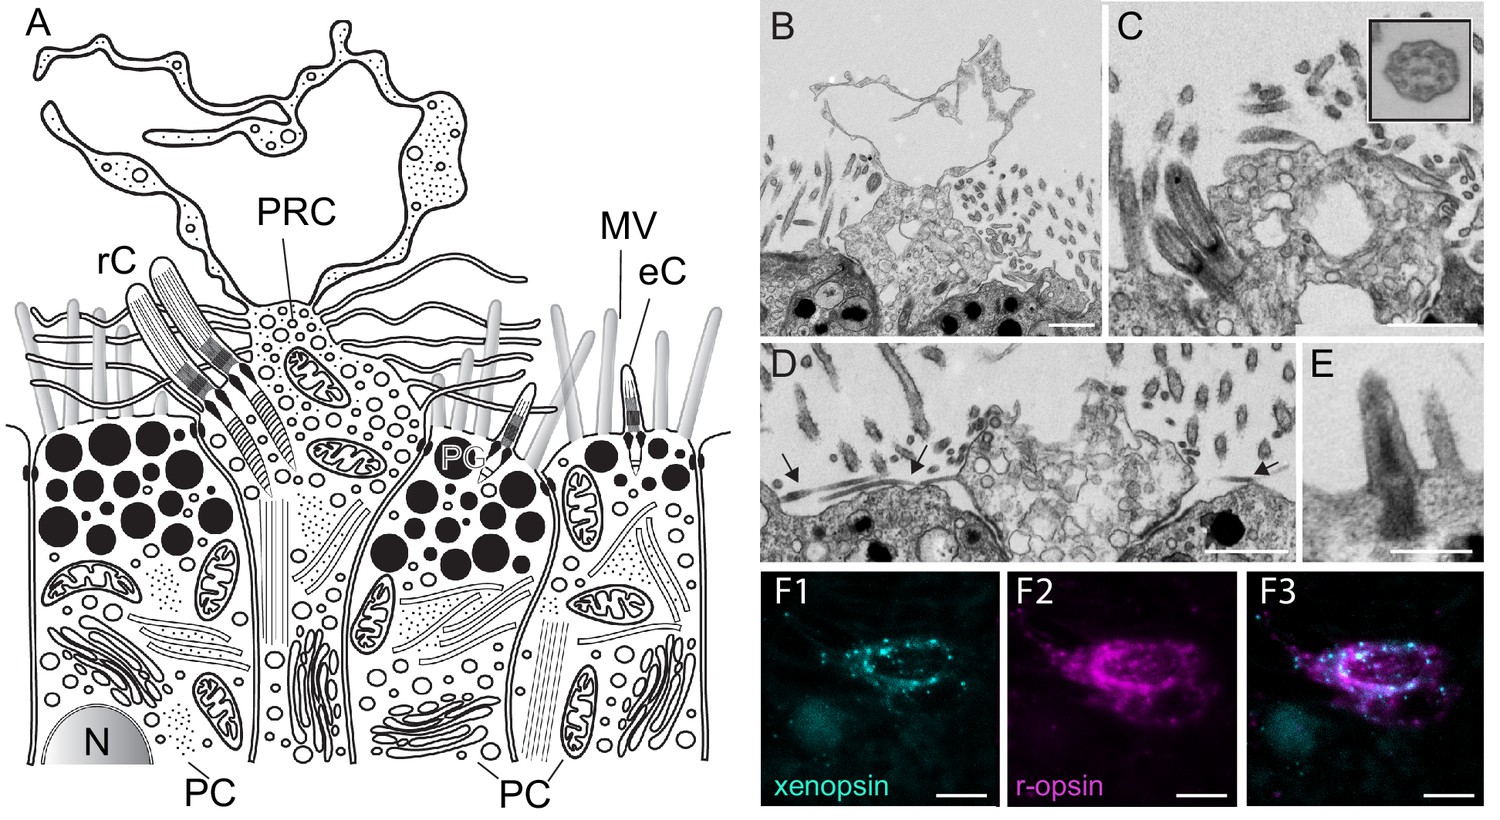
Fine structure of the eye photoreceptor cell surface and co-expression of Las-xenopsin and Las-ropsin in the eye.
(a) Schematic representation of eye structure based on serial section EM data. (b–d) EM micrographs of the apical surface of eye photoreceptor cells (PRCs). (b) Microvillar-like vertical extensions of the eye PRC. (c) Two cilia emerging from eye PRC (inset: cross section of eye PRC ciliary axonem showing 9 × 2 + 2 pattern). (d) Horizontal microvilli (arrows) emerging from eye PRC. (e) Rudimentary cilium of adjacent epidermal cell. (f1-3) Double in-situ hybridization shows that Las-xenopsin and Las-r-opsin are coexpressed in eye PRCs. (Scalebars: 2 µm in b–e, 5 µm in f). eC, epidermis cell cilium; MV, microvilli; N, Nucleus; PC, pigment cell; PG, pigment granules; rC, photoreceptor cell cilium.
Figure 4 with 5 supplements
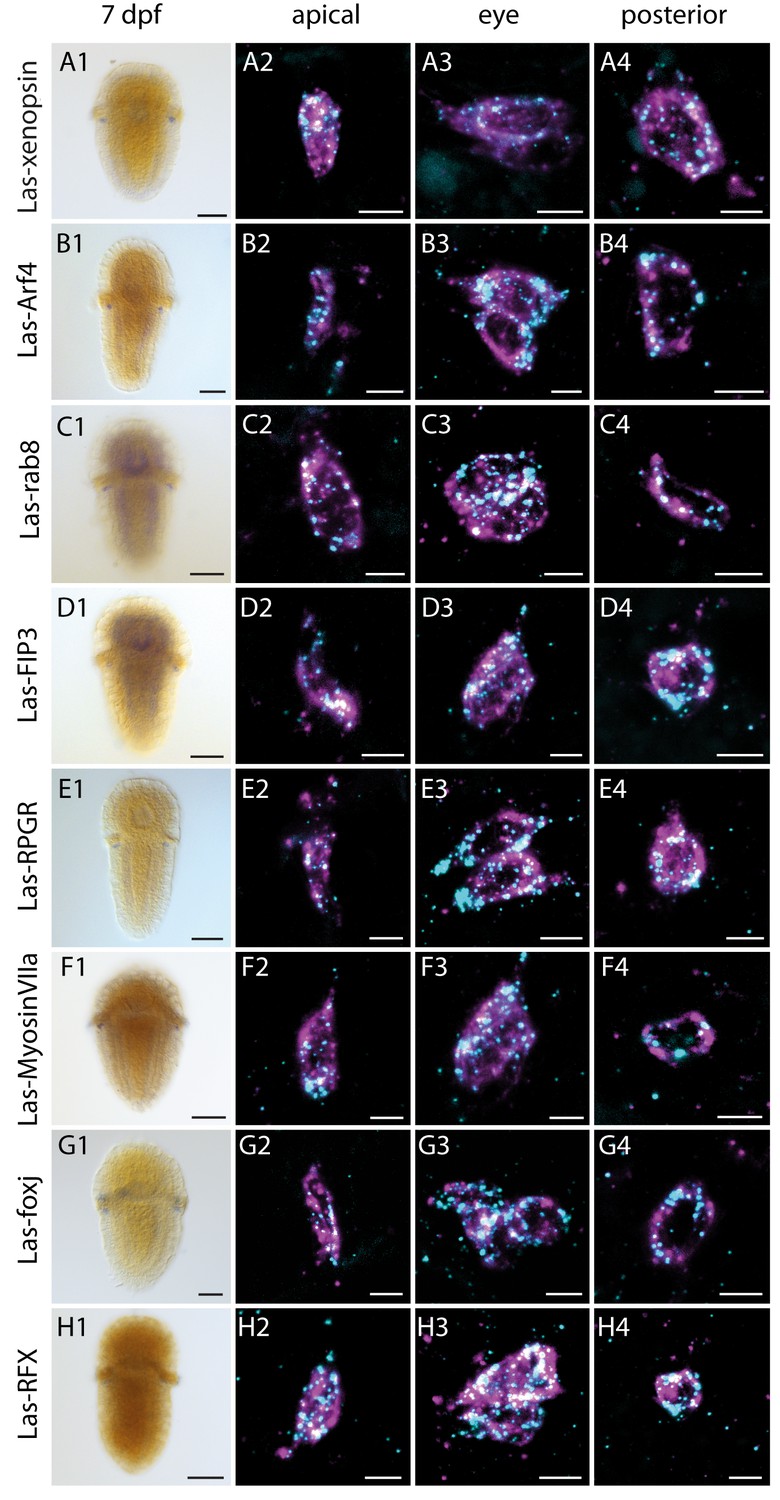
Expression of Las-xenopsin as well as genes involved in ciliary opsin transport and development of cilia.
Column 1: single labeling of gene X. Column 2–4: double labeling of gene X (cyan) and Las-r-opsin (magenta) in the anterior, posttrochal eye and posterior regions. Las-xenopsin (a1–a4), Las-Arf4 (b1–b4), Las-rab8 (c1–c4), Las-FIP3 (d1-4), Las-RPGR (e1-4), Las-Myosin VIIa (f1-4), Las-foxj1 (g1-4) and Las-RFX (h1-4) are coexpressed with Las-r-opsin in anterior, eye and posterior PRCs. Additionally, Las-rab8 (c1) and Las-FIP3 (d1) show a broader expression in the nervous system of 7 dpf larvae and Las-foxj1 shows expression also in the apical area and prototroch cells of young larvae (Figure 4—figure supplement 1). See Figure 4—figure supplements 1–3 for gene trees of Arf4, FIP and RFX. (Scalebars: 100 μm in column 1; 5 μm in columns 2–4).
Figure 4—figure supplement 1
Las-foxj1 expression in a young larva (48 hpf).
Las-foxj1 is expressed in the prototroch cells and the apical organ (Scalebar: 100 μm).
Figure 4—figure supplement 2
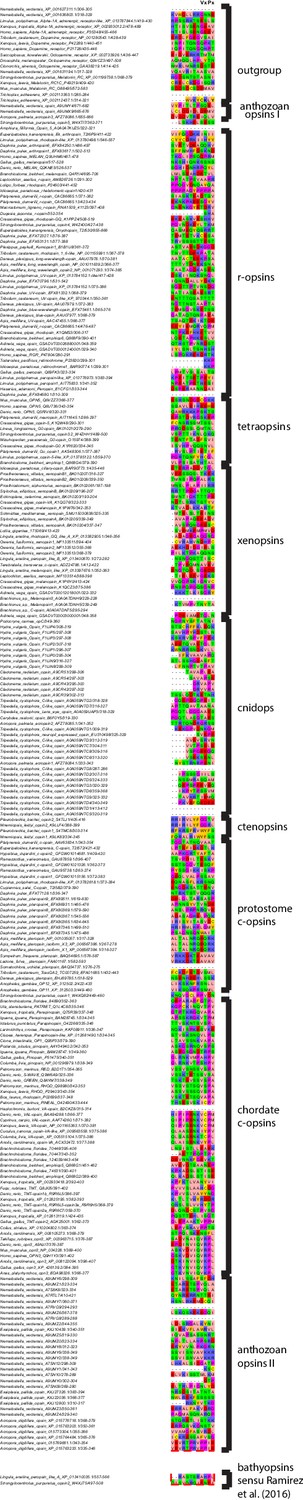
Alignment of C-termimal ends of the opsins involved in this study.
The VxPx motif known to be involved in cargo binding during ciliary opsin trafficking in vertebrate c-opsin is conserved only in tunicate and vertebrate c-opsins, but not in cephalochordate, echinoderm and prostostome c-opsins, xenopsins, cnidops or any other opsin-type.
Figure 4—figure supplement 3
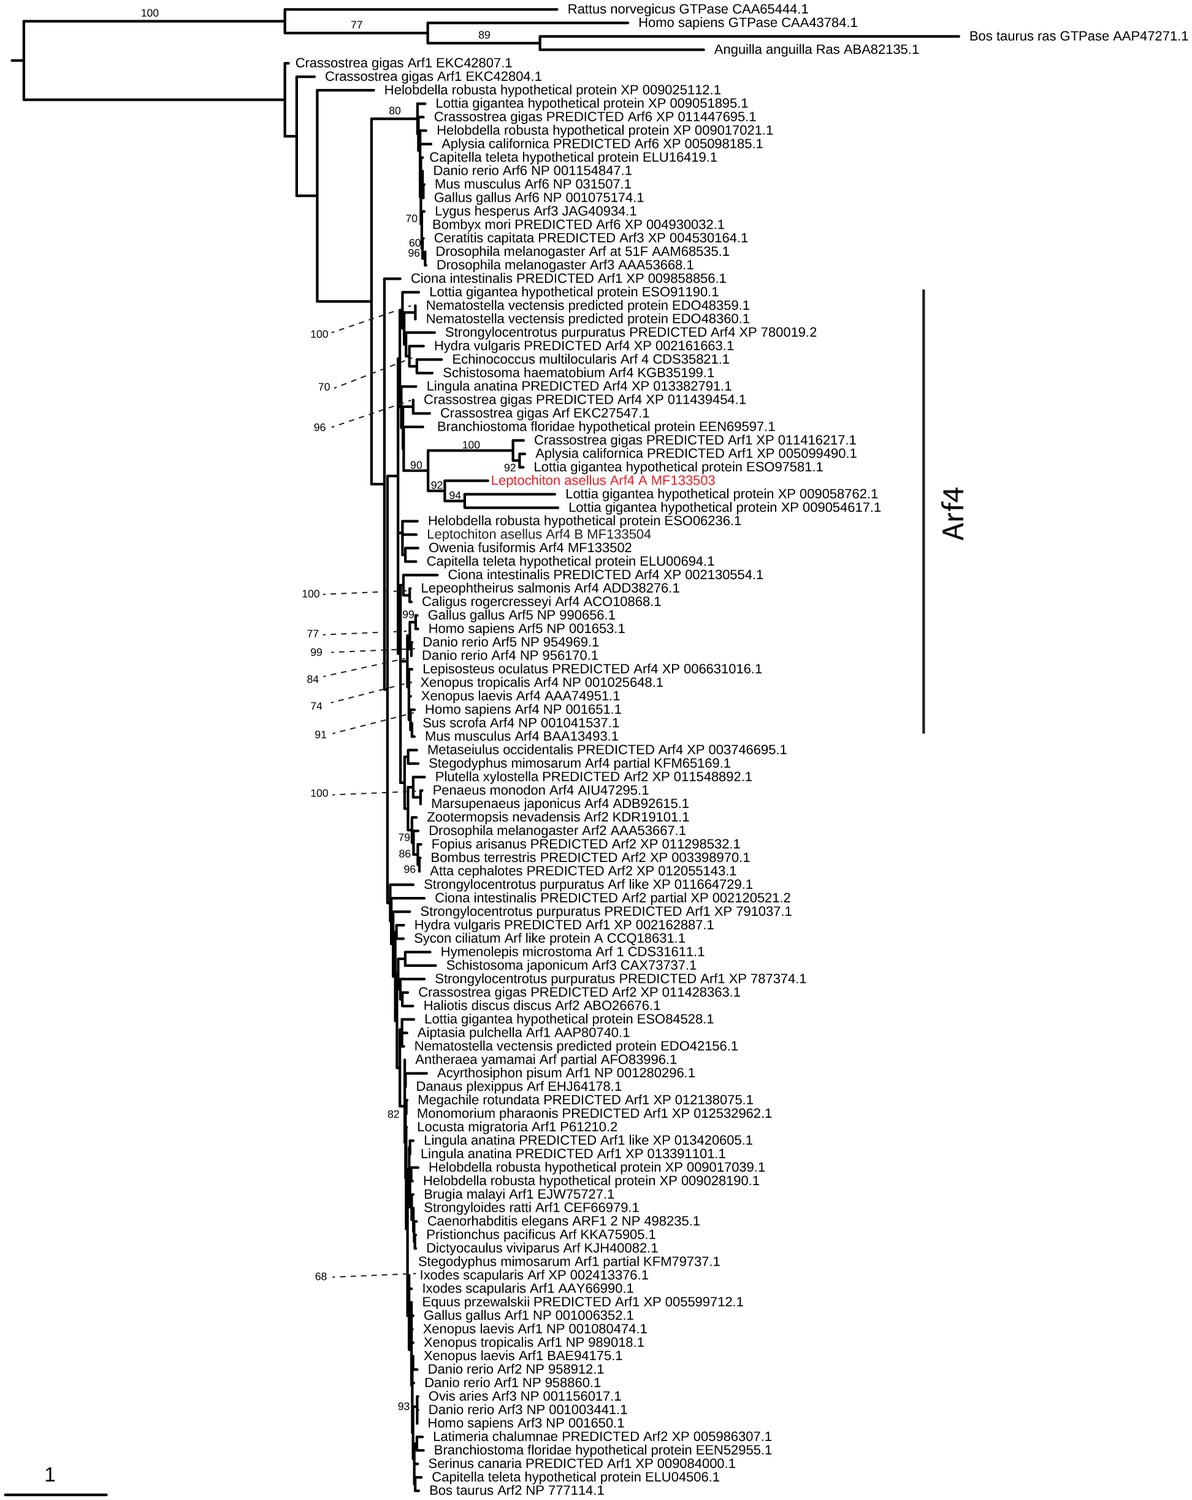
Arf4 evolution.
Maximum-likelihood (RAXML, LG + Γ model, rapid bootstrapping (250 replicates)). See Figure 4—figure supplement 3—source data 1 for gene accession numbers.
-
Figure 4—figure supplement 3—source data 1
Accession numbers of sequences used for Arf4 tree inference.
- https://doi.org/10.7554/eLife.23435.017
Figure 4—figure supplement 4

FIP evolution.
Maximum-likelihood (RAXML, LG + Γ model, rapid bootstrapping (250 replicates)). See Figure 4—figure supplement 4—source data 1 for gene accession numbers.
-
Figure 4—figure supplement 4—source data 1
Accession numbers of sequences used for FIP tree inference.
- https://doi.org/10.7554/eLife.23435.018
Figure 4—figure supplement 5
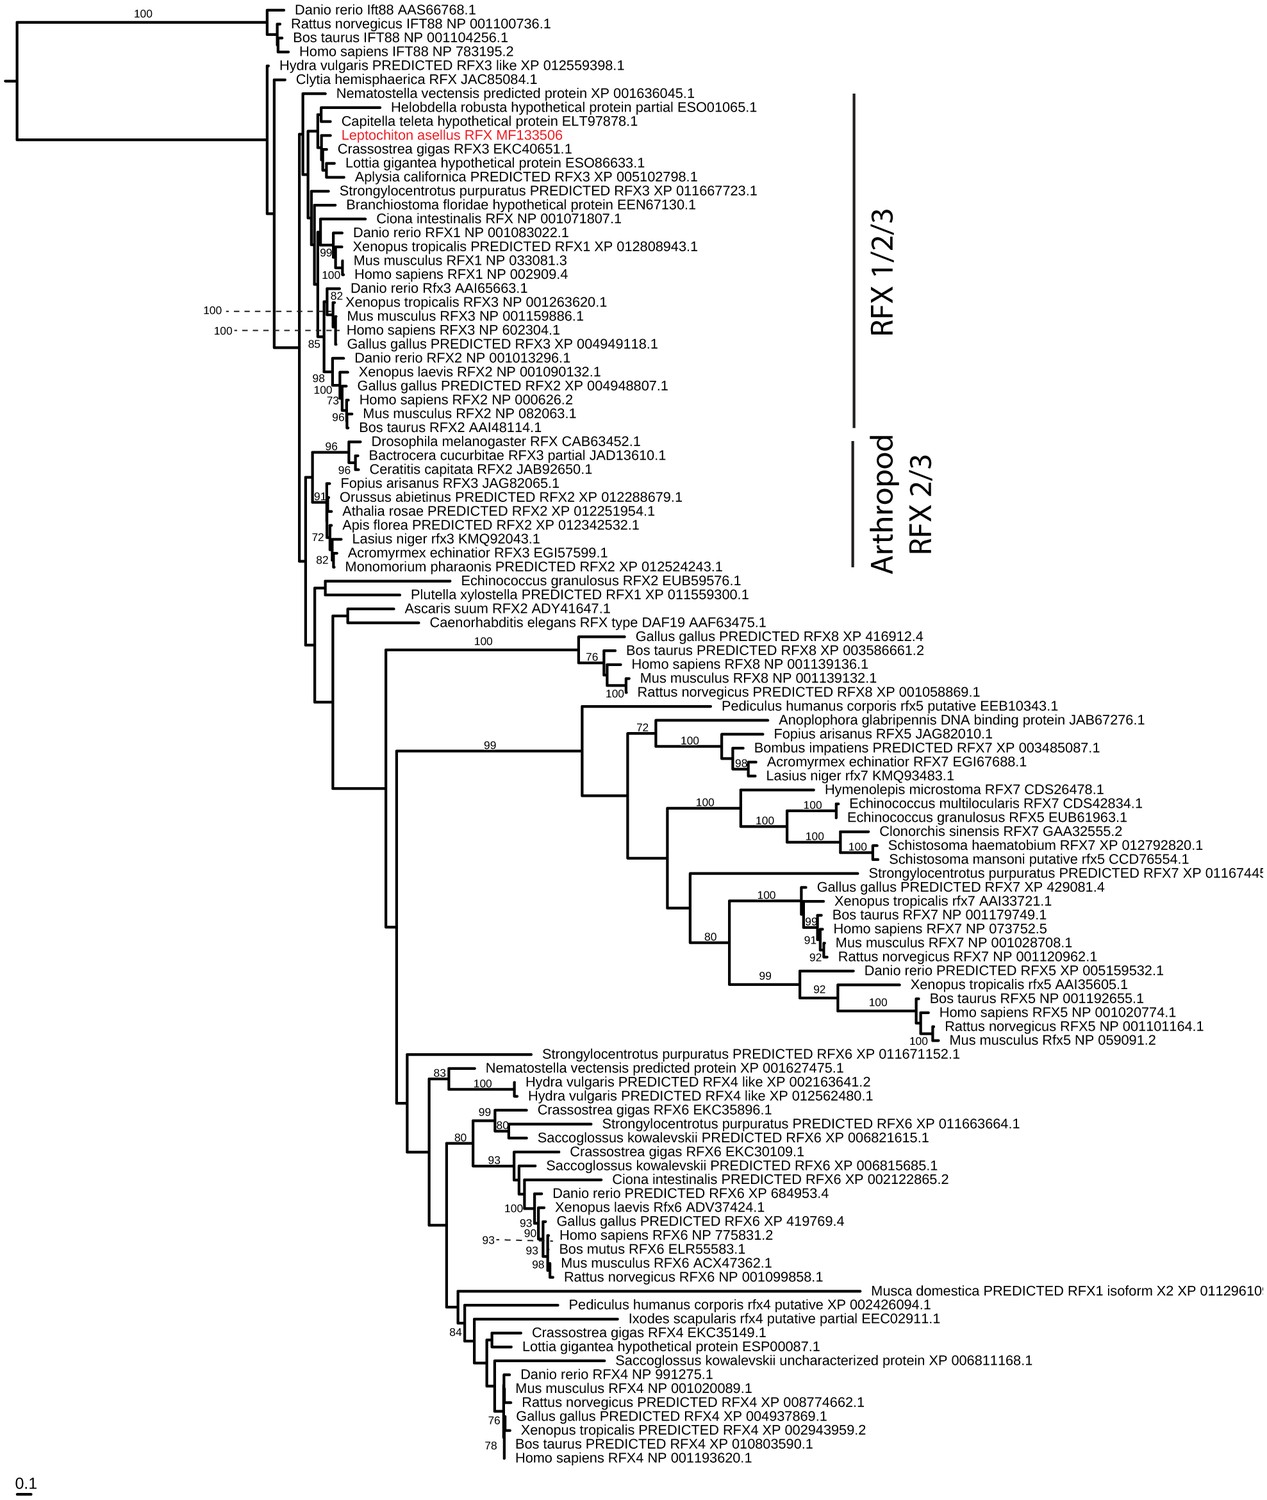
RFX evolution.
Maximum-likelihood (RAXML, JTT + Γ + F model, rapid bootstrapping (250 replicates)). See Figure 4—figure supplement 5—source data 1 for gene accession numbers.
-
Figure 4—figure supplement 5—source data 1
Accession numbers of sequences used for RFX tree inference.
- https://doi.org/10.7554/eLife.23435.019
Figure 5
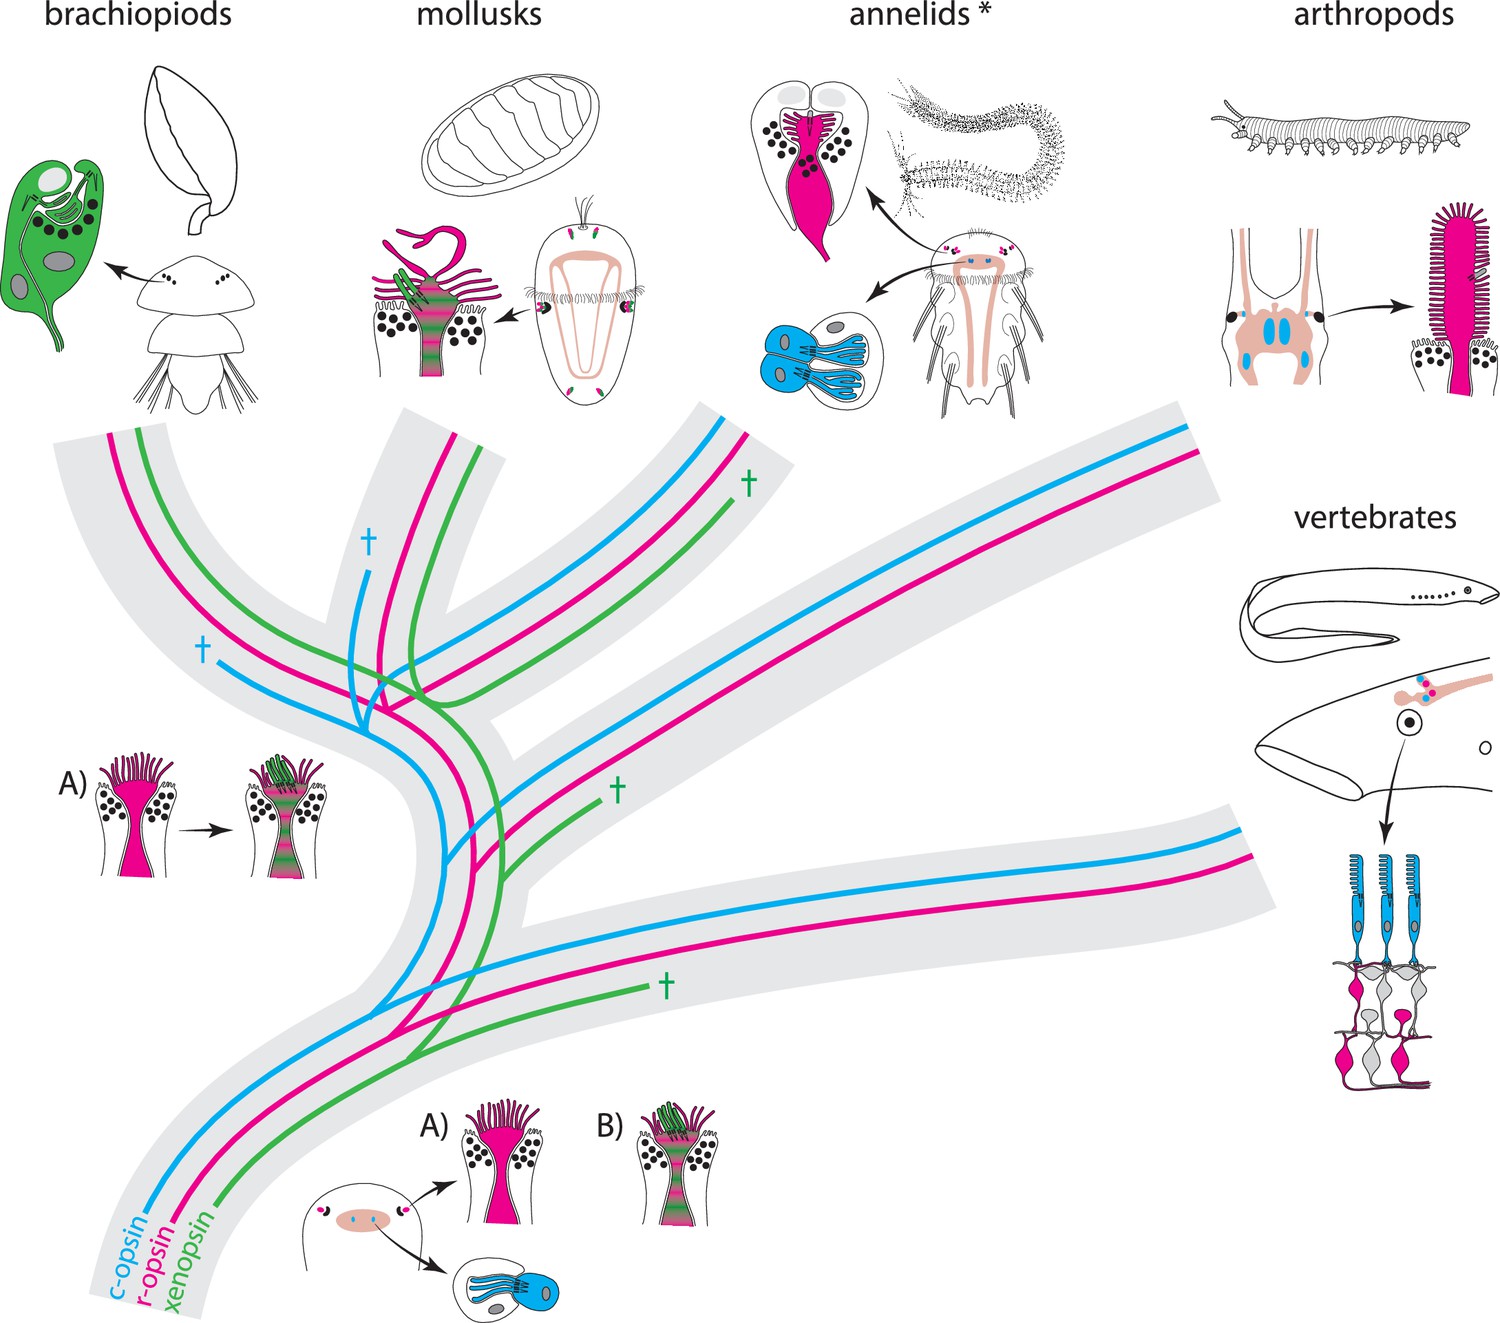
Scenarios for eye PRC evolution.
C-opsin, xenopsin and r-opsin are present in the bilaterian ancestor. Scenario A. In the bilaterian ancestor, c-opsin is employed by ciliary unpigmented brain PRCs not serving directional vision. Initially the only eye PRCs are of the r-opsin+ microvillar PRC type. In protostomes, c-opsin+ PRCs stayed in the brain and do not form part of the eye retina layer in recent arthropods and annelids, but became integrated into the eye retina of vertebrates. They were reduced in mollusks and brachiopods coincident with gene loss of c-opsin. One option preventing the assumption of multiple co-option of xenopsin by eye PRCs or emergence of completely new PRCs or eyes is that xenopsin was recruited once by r-opsin+ eye PRCs in the stem lineage of lophotrochozoans and entered sensory cilia. Such cells are still present in basal mollusks. In annelids except the basally branching Oweniidae (labelled with asterisk), xenopsin is lost and the eye PRCs are turned into purely microvillar cells. In brachiopod larvae, xenopsin is maintained and present in the purely ciliary eye PRCs. Scenario B. The evolution of ciliary c-opsin+PRCs is the same as in Scenario A.However, already the eyes of the bilaterian ancestor employed a very plastic mixed r-opsin+ and xenopsin+ rhabdomeric/ciliary PRC type. Distribution of PRC types and eye PRC organization in Bilateria is largely the result of lineage-specific loss of either xenopsin or c-opsin. Loss of xenopsin in vertebrates, arthropods and most annelids led to microvillar r-opsin+ PRCs. Though still present in the genome, r-opsin became downregulated in eye PRCs of brachiopods. Schemes are partly based on drawings and images from Rhode (1992) and Passamaneck et al. (2011).
Figure 6 with 1 supplement
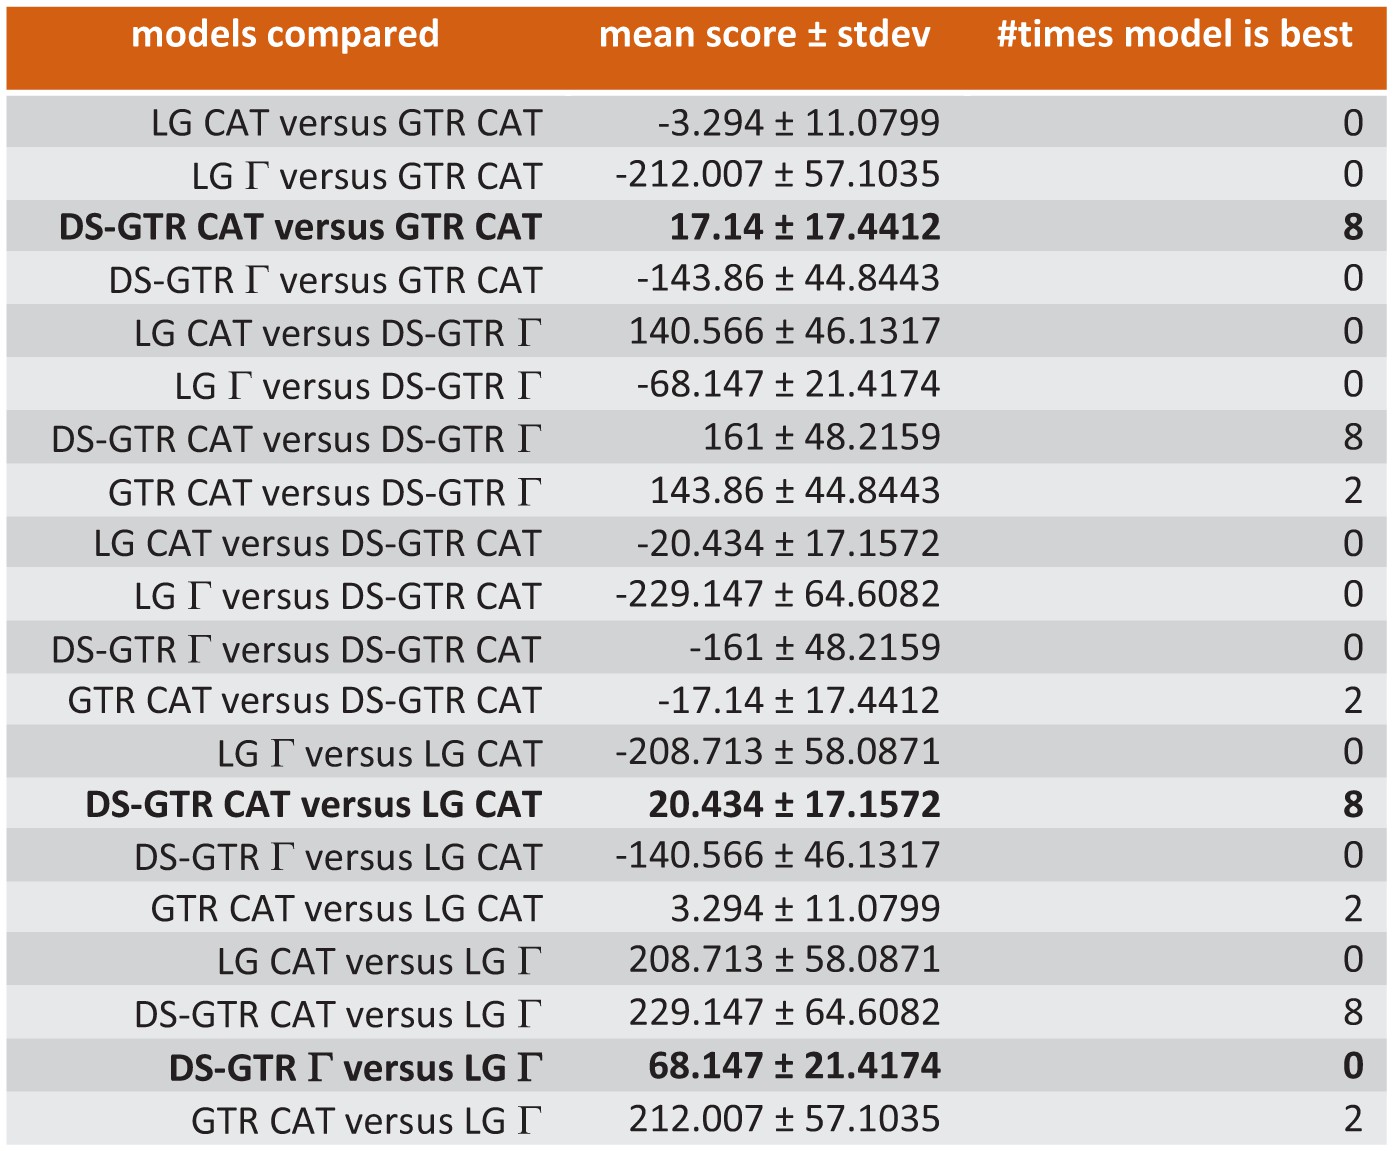
Ten-fold cross-validation (Phylobayes) to find best possible model for Bayesian opsin tree inference.
Only some of the data are shown. Combinations based on the data set specific substitution matrix (DS-GTR) are superior to all software implemented options. DS-GTR CAT and GTR CAT are the best non-parametric variants and DS-GTR Γ is the best parametric variant. See Figure 6—figure supplement 1 for model test for maximum-likelihood analysis and Figure 6—source data 1 for the whole data set.
-
Figure 6—source data 1
Full results of ten-fold cross-validation (Phylobayes) to find best possible model for Bayesian opsin tree inference.
- https://doi.org/10.7554/eLife.23435.023
Figure 6-figure supplement 1

Model test (Prottest) to find the best possible model for maximum-likelihood analysis.
Only psome of the data are shown. DS-GTR+Γ based on a data-set-specific substitution matrix is the best fitting model according to Akaike information, Bayesian information and Decision theory criteria. See Figure 6—figure supplement—source data 1 for the whole data set.
-
Figure 6—figure supplement—source data 1
Full results of Prottest analysis to find the best possible model for maximum-likelihood analysis.
- https://doi.org/10.7554/eLife.23435.024
Additional files
-
Transparent reporting form
- https://doi.org/10.7554/eLife.23435.025
Download links
A two-part list of links to download the article, or parts of the article, in various formats.
Downloads (link to download the article as PDF)
Open citations (links to open the citations from this article in various online reference manager services)
Cite this article (links to download the citations from this article in formats compatible with various reference manager tools)
Co-expression of xenopsin and rhabdomeric opsin in photoreceptors bearing microvilli and cilia
eLife 6:e23435.
https://doi.org/10.7554/eLife.23435


