Modeling Hsp70/Hsp40 interaction by multi-scale molecular simulations and coevolutionary sequence analysis
- Faculté de Sciences de Base, École Polytechnique Fédérale de Lausanne, Switzerland
- Max Planck Institute of Biophysics, Germany
- École Polytechnique Fédérale de Lausanne, Switzerland
- Institut für Biophysik, Johann Wolfgang Goethe Universität Frankfurt, Germany
- Inserm, U1054, France
- Université de Montpellier, CNRS, UMR 5048, Centre de Biochimie Structurale, France
Figures
Figure 1 with 4 supplements
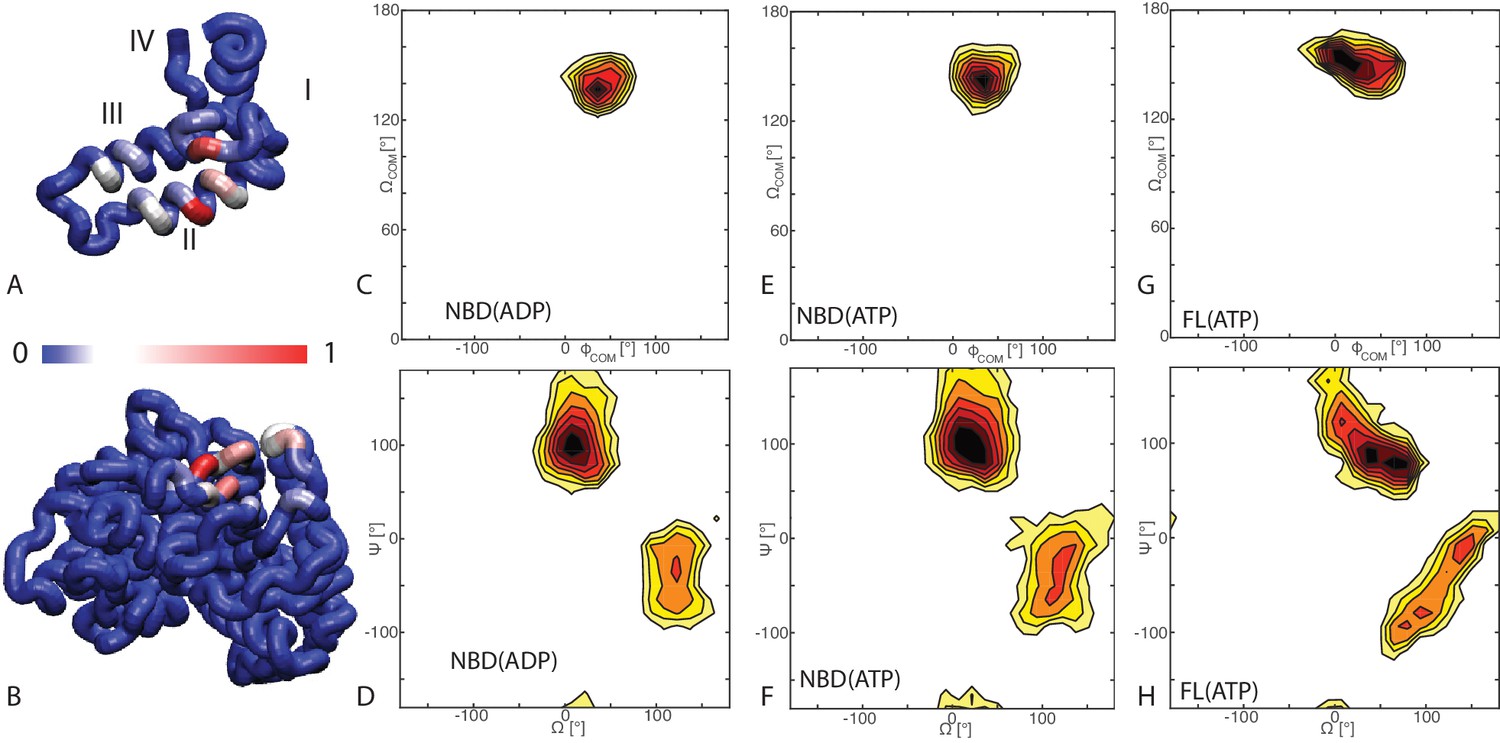
Binding modes of DnaK/DnaJ.
(A) Probabilities of JD residues to be in contact with the DnaK (NBD(ATP) case). Helices I-IV of the JD are highlighted. See (Figure 1—figure supplement 1) for the NBD(ADP) and FL(ATP) cases. (B) Probabilities of DnaK residues to be in contact with the JD (NBD(ATP) case). Blue: low, Red: high, see scalebar. (C,E,G) Orientational free energy as a function of the spherical polar angles () of the JD center of mass for (A) NBD(ADP), (C) NBD(ATP), (E) FL(ATP). The origin and the reference axes are defined by NBD center of mass and inertia axes, respectively. (D,F,H) The free energy surface as a function of Euler angles () defining the relative orientation of J-domain w.r.t. the NBD for (B) NBD(ADP), (D) NBD(ATP), (F) FL(ATP). See Materials and methods and Figure 1—figure supplement 4 for details on the angular definitions. Iso-lines are drawn at 1 free-energy intervals. See (Figure 1—figure supplement 2) for the third Euler angle.
Figure 1—figure supplement 1
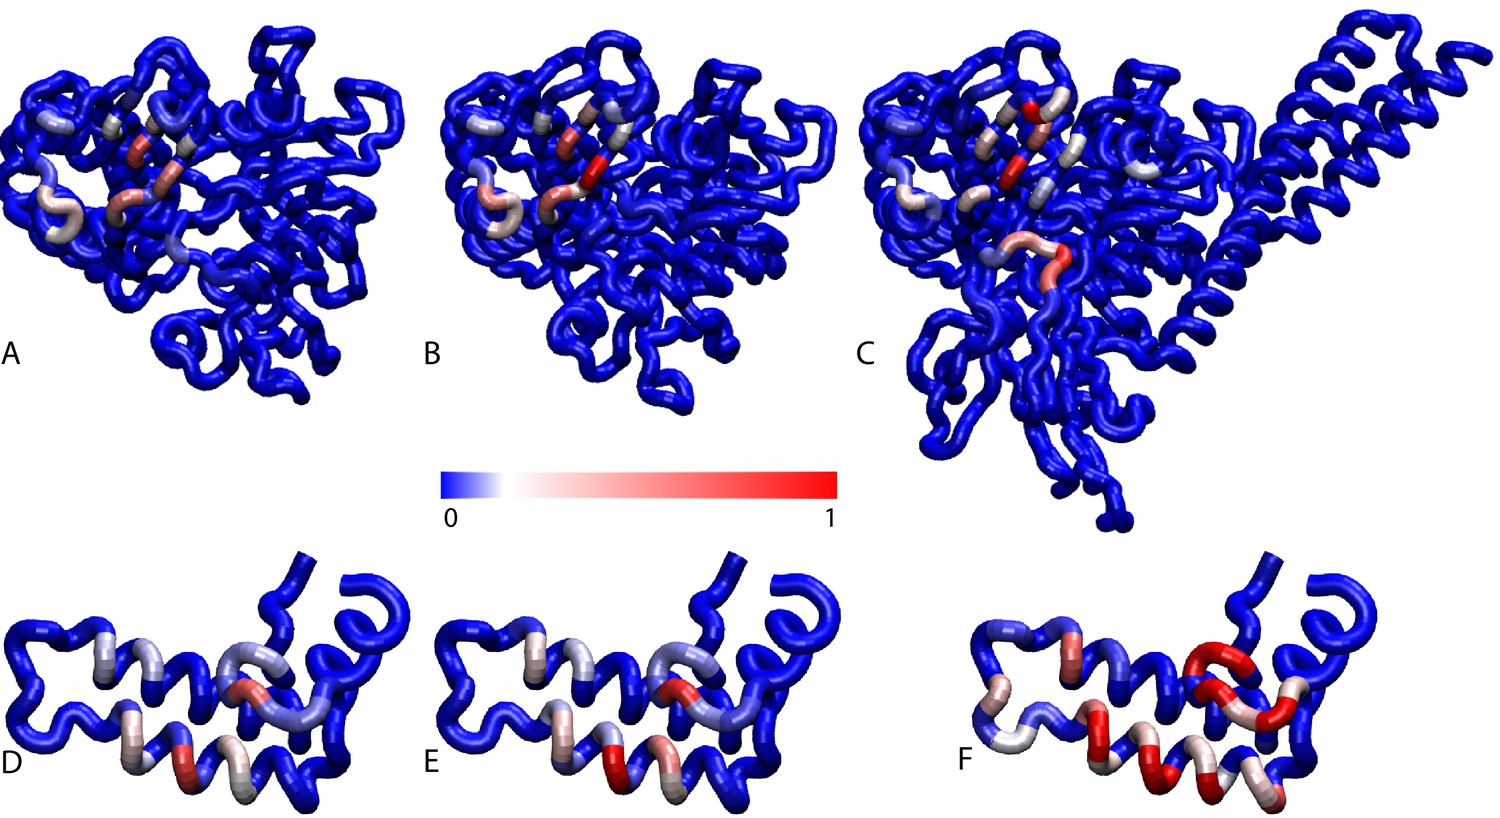
Contact frequencies predicted by coarse-grained simulations.
Probabilities of DnaK residues to be in contact with the JD for (A) NBD(ADP), (B) NBD(ATP), (C) FL(ATP). Probabilities of JD residues to be in contact with the DnaK for (D) NBD(ADP), (E) NBD(ATP), (F) FL(ATP).Blue: low probability, Red: high probability, see scale bar.
Figure 1—figure supplement 2
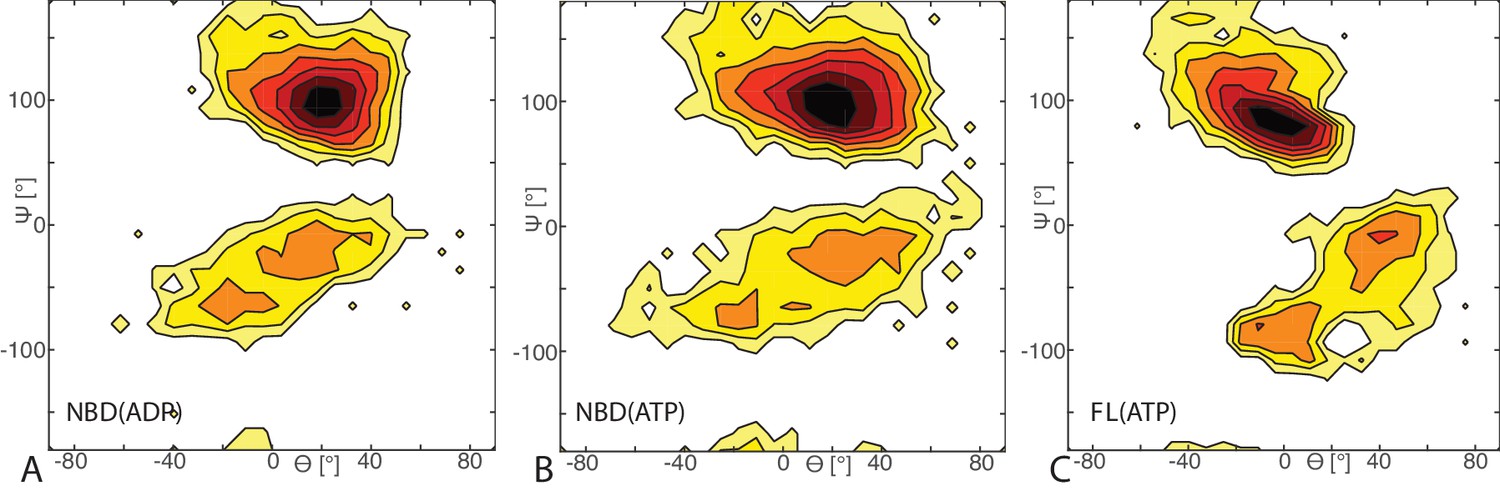
Free energy surface of bound CG conformations, using the third Euler angle.
Free energy surface as a function of Euler angles (,) defining the relative orientation of J-domain w.r.t. the DnaK NBD for (A) NBD(ADP), (B) NBD(ATP), (C) FL(ATP). The fixed and rotating coordinate systems are defined by the inertia axes of the NBD and JD, respectively. Iso-value lines are drawn at 1 free-energy intervals.
Figure 1—figure supplement 3
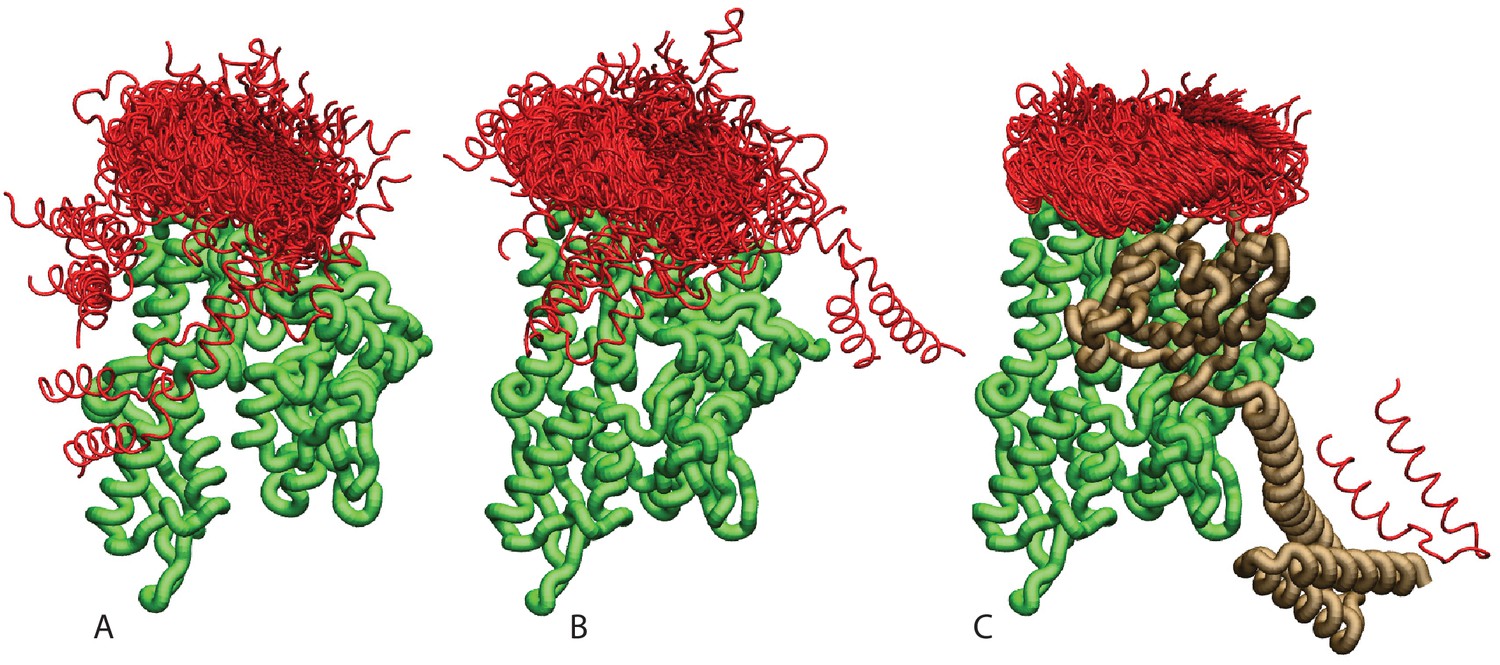
Ensemble of bound conformations predicted by coarse-grained simulations.
The ensembles of bound JDs are reported for (A) NBD(ADP), (B) NBD(ATP) and (C) FL(ATP). For ease of visualization, one out of five bound conformations is displayed. The JD is in red, the NBD in green, and the SBD and linker in brown. All bound conformations have inter-protein distances of 8 Å or less and total binding energies below −2.
Figure 1—figure supplement 4
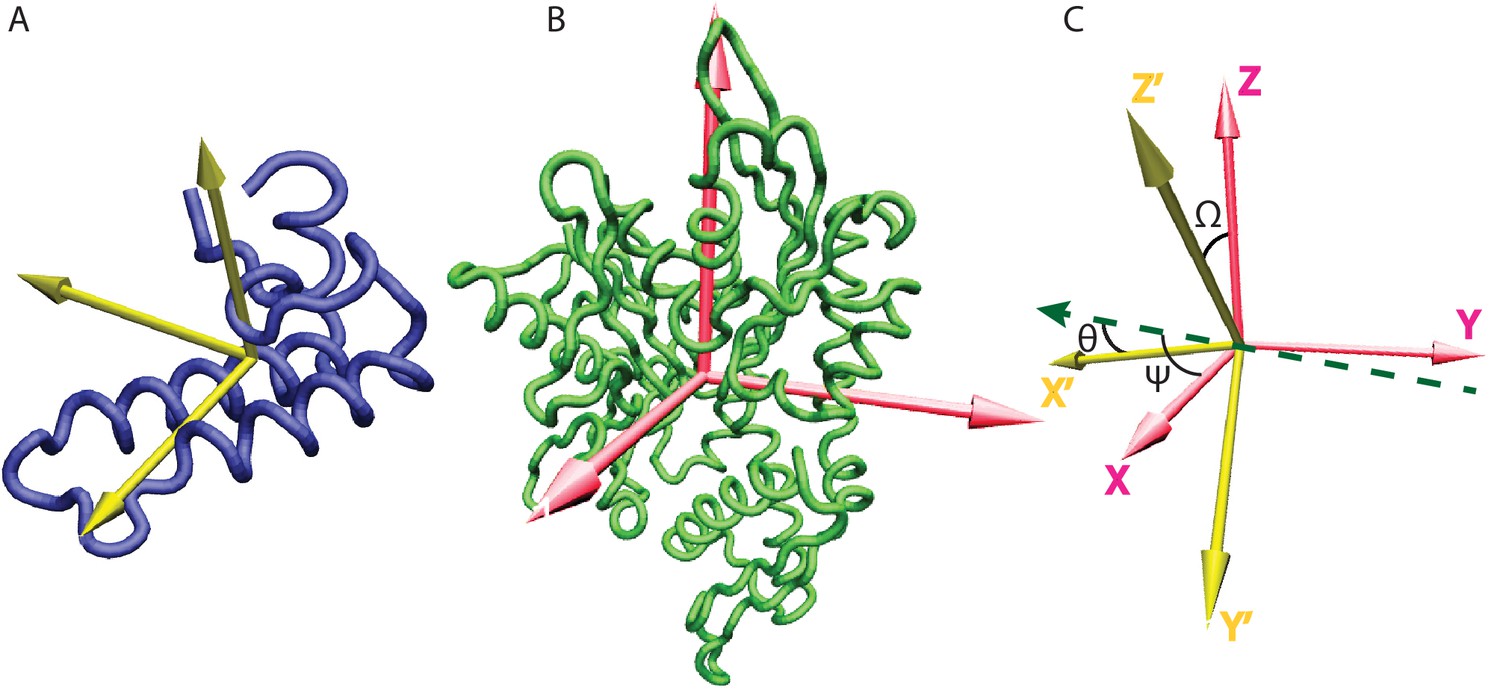
Inertia axes of the NBD and the JD and Euler angle definition.
(A) Inertia axes of the JD. (B) Inertia axes of the DnaK NBD. (C) Vectorial representation of the Euler angles used for defining the free energy surfaces.
Figure 2 with 1 supplement
Conformations of the DnaK:JD complex.
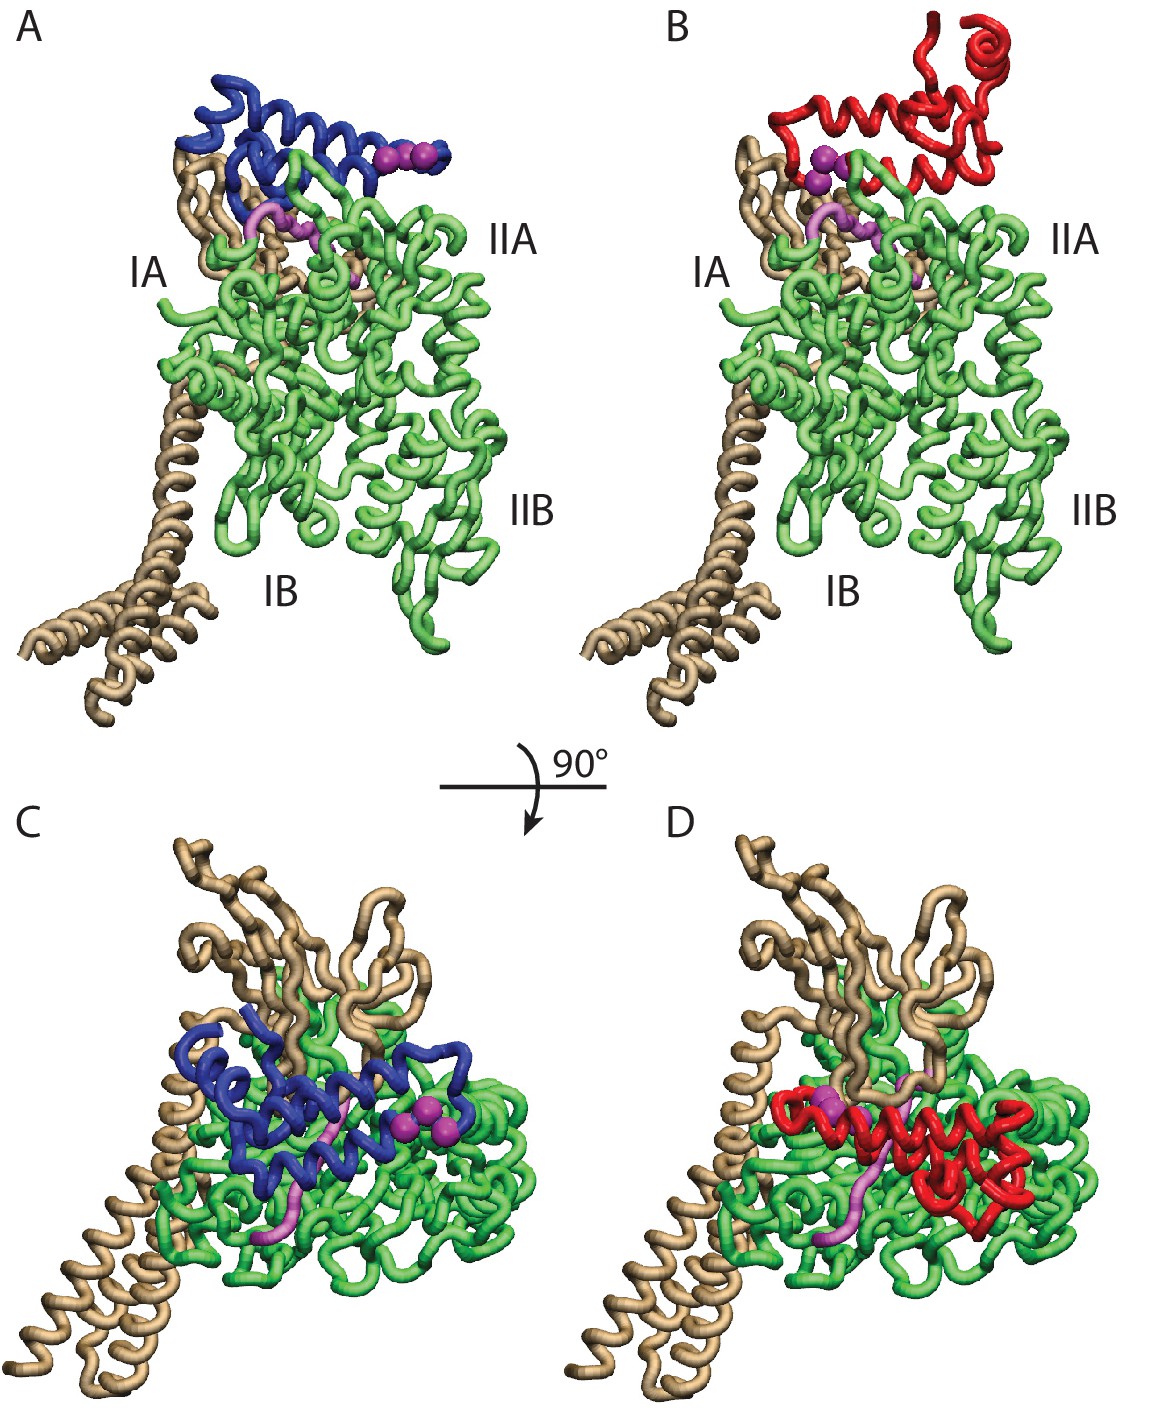
Most representative HPD-OUT/IN conformations for the FL(ATP):JD system (HPD-OUT: (A) and (C), HPD-IN: (B) and (D)). The four lobes forming the sub-structures of the NBD are highlighted. The SBD is in brown. The docked inter-domain linker is in purple. The HPD tripeptide of the J-domain is depicted as magenta spheres. The JD is depicted in blue (HPD-OUT) or red (HPD-IN). See (Figure 2—figure supplement 1) for the NBD(ADP) and NBD(ATP) systems. For readability, the NBD in the rotated panels C) and D) is uniformly colored in green.
Figure 2—figure supplement 1
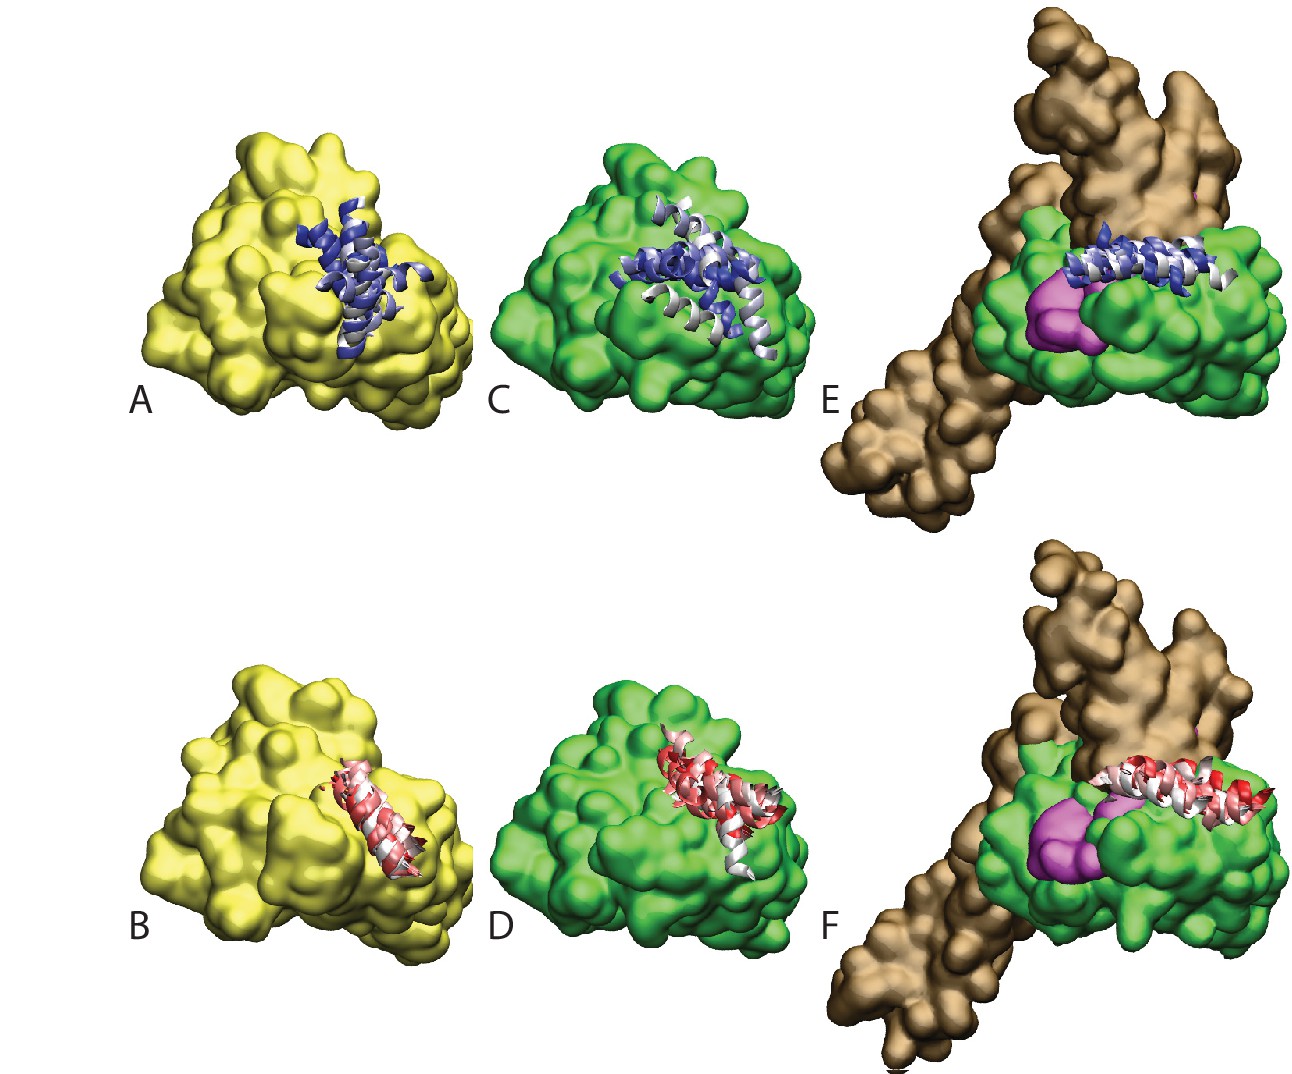
HPD-IN/OUT conformations for NBD(ADP) and NBD(ATP).
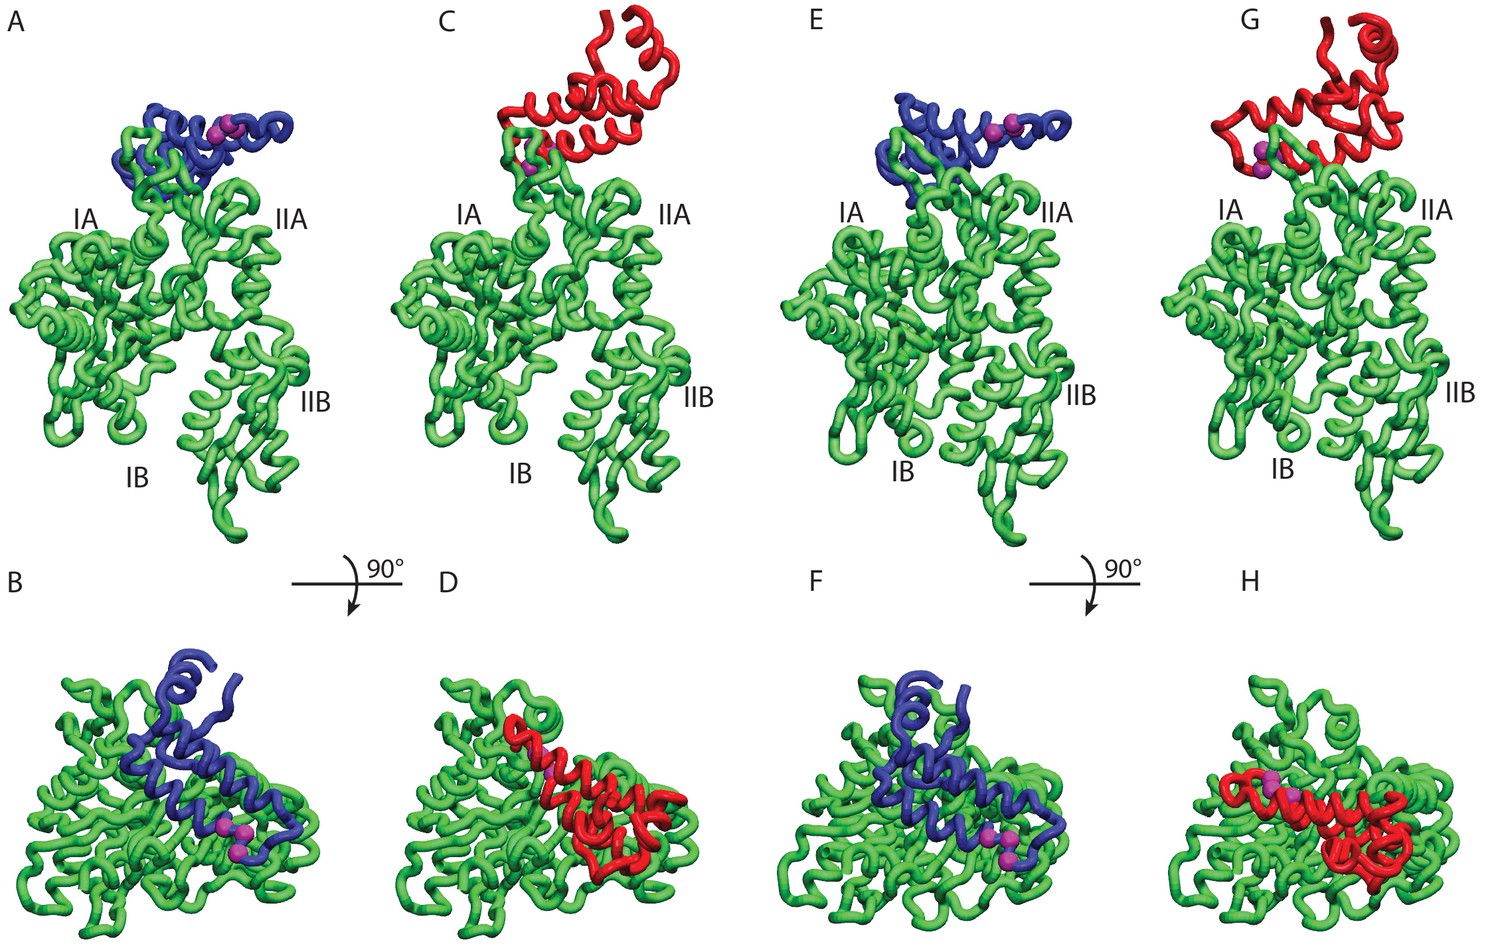
Most representative HPD-OUT/IN conformations. (A,B) HPD-OUT NBD(ADP), (C,D) HPD-IN NBD(ADP), (E,F) HPD-OUT NBD(ATP), (G,H) HPD-IN NBD(ATP). The four lobes forming the sub-structures of the NBD are highlighted. The HPD tripeptide of the J-domain is depicted as magenta spheres. The JD is depicted in blue (HPD-OUT) or red (HPD-IN).
Figure 3 with 1 supplement
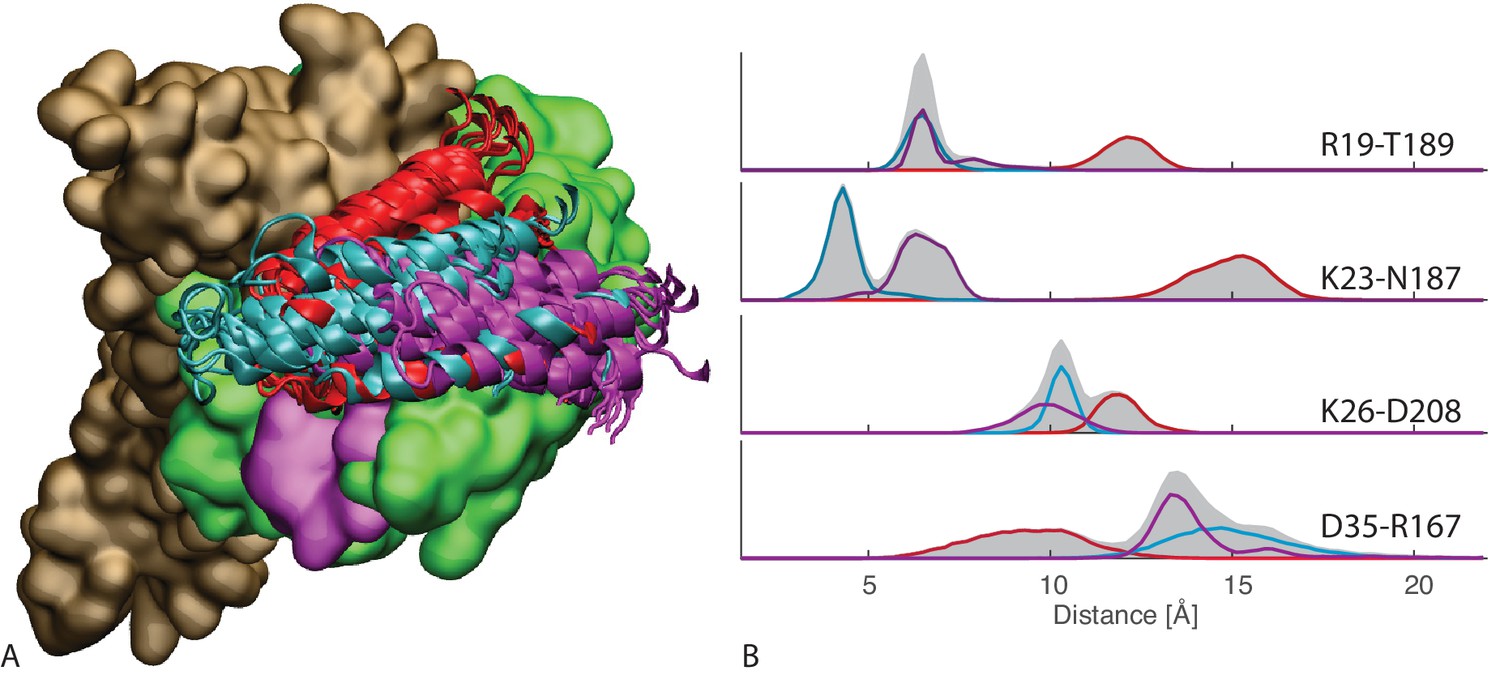
Contacts from coevolutionary analysis.
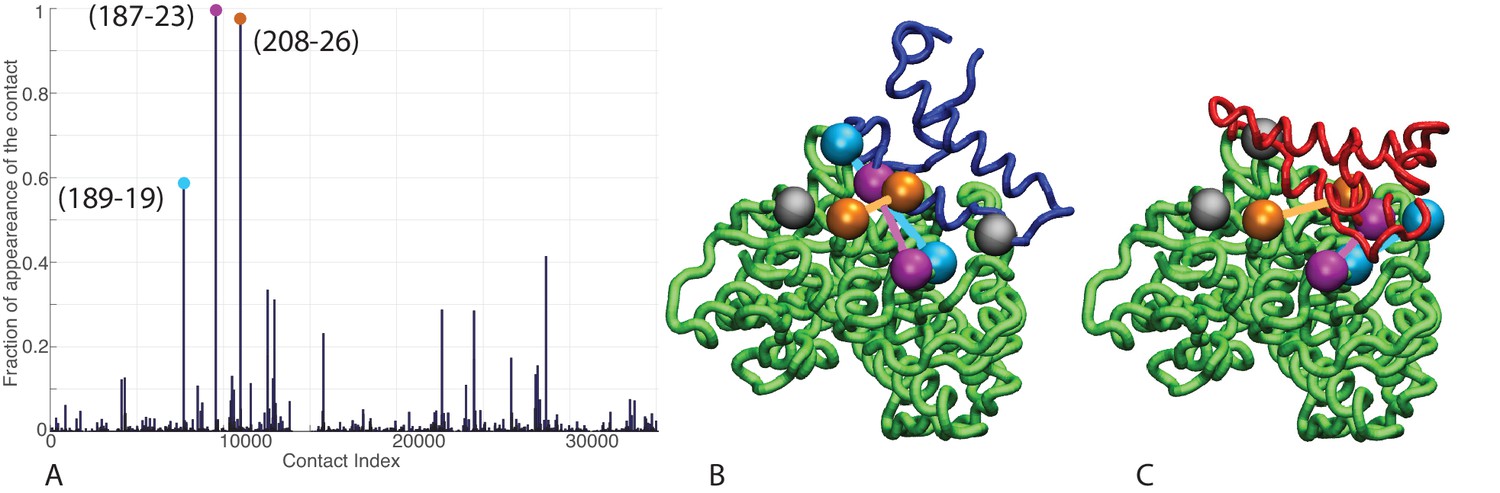
(A) Frequency of appearance of the coevolutionary inter-protein contacts (see Materials and methods). The three most frequent contacts are highlighted (N187-K23 magenta, D208-K26 orange and T189-R19 blue. Numbering refers to the E. coli DnaK-DnaJ (Uniprot IDs: DnaK P0A6Y8, DnaJ P08622)). (B–C) The same three contacts represented on the HPD-OUT (blue, panel B) and HPD-IN (red, panel C) conformations of the NBD(ATP):JD complex. Coevolving residues are depicted by spheres, following the color scheme of panel A. Gray spheres represent D35 of the 33HPD35 motif on JD and R167 of the NBD. (See Materials and methods and Figure 7 for an extended DCA analysis and validation.)
Figure 3—figure supplement 1
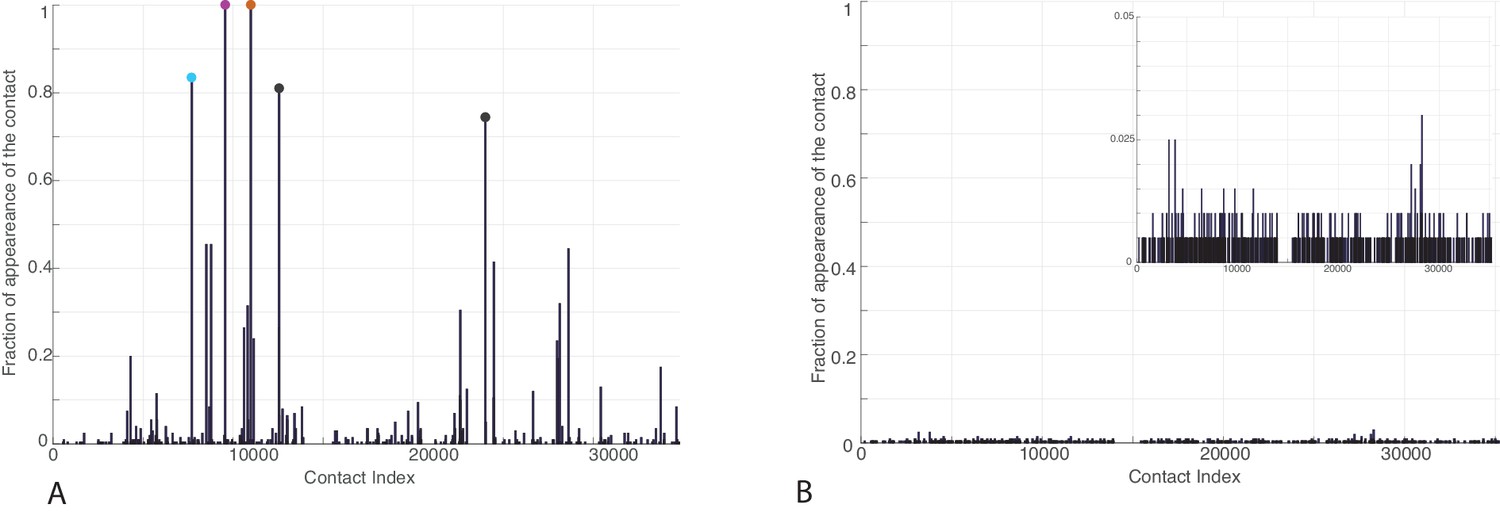
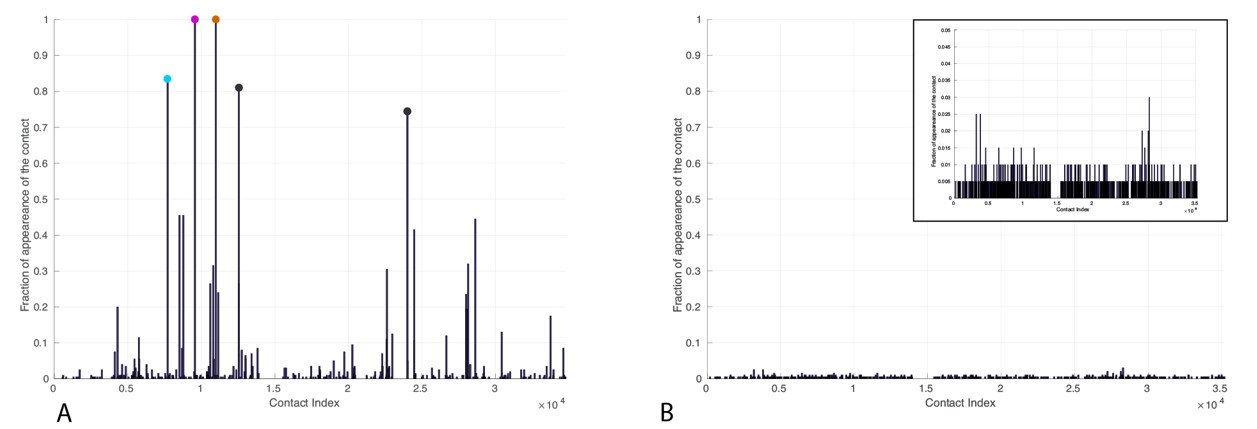
Frequency of appearance of the coevolutionary inter-protein contacts (see Materials and methods) on separated bacterial and eukaryotic datasets.
(A) Predictions on the bacterial dataset. The three most frequent contacts are the same as the three reported in the complete dataset and follow the same colorscheme (Figure 3.) (B) Predictions on the eukaryotic dataset. Inset: Zoom on the vertical axis between 0% and 5%.
Figure 4 with 4 supplements
All-atom simulations of FL-ATP.
(A) 10 snapshots of the three long atomistic MD simulations of FL-ATP DnaK bound to the DnaJ JD. Green: NBD, magenta: linker, brown SBD, red/cyan/purple: JD for the three trajectories. For ease of visualization, only helices II and III of the JD are depicted. (B) Distributions of the distances of the three coevolving contacts and the D35-R167 contact. The distance distributions for the three cases follow the color scheme of panel A (red/cyan/purple). Shaded areas are the sum of the distributions for each case. See (Figure 4—figure supplement 4) for traces of the trajectories.
Figure 4—figure supplement 1
Atomistic stability analysis.
Final frames of the 10 all-atom MD trajectories. (A) HPD-OUT/NBD(ADP), (B) HPD-IN/NBD(ADP), (C) HPD-OUT/NBD(ATP), (D) HPD-IN/NBD(ATP), (E) HPD-OUT/FL(ATP), (F) HPD-IN/FL(ATP). For ease of readability, only helices II and III of the JD are depicted. Rainbow coloring (white to blue for HPD-OUT, white to red for HPD-IN) is used to better differentiate the 10 frames. The DnaK NBD is colored in yellow for NBD(ADP) and in green for NBD(ATP) and FL(ATP). The docked inter-domain linker is colored in magenta in FL(ATP). The SBD is colored brown in FL(ATP).
Figure 4—figure supplement 2
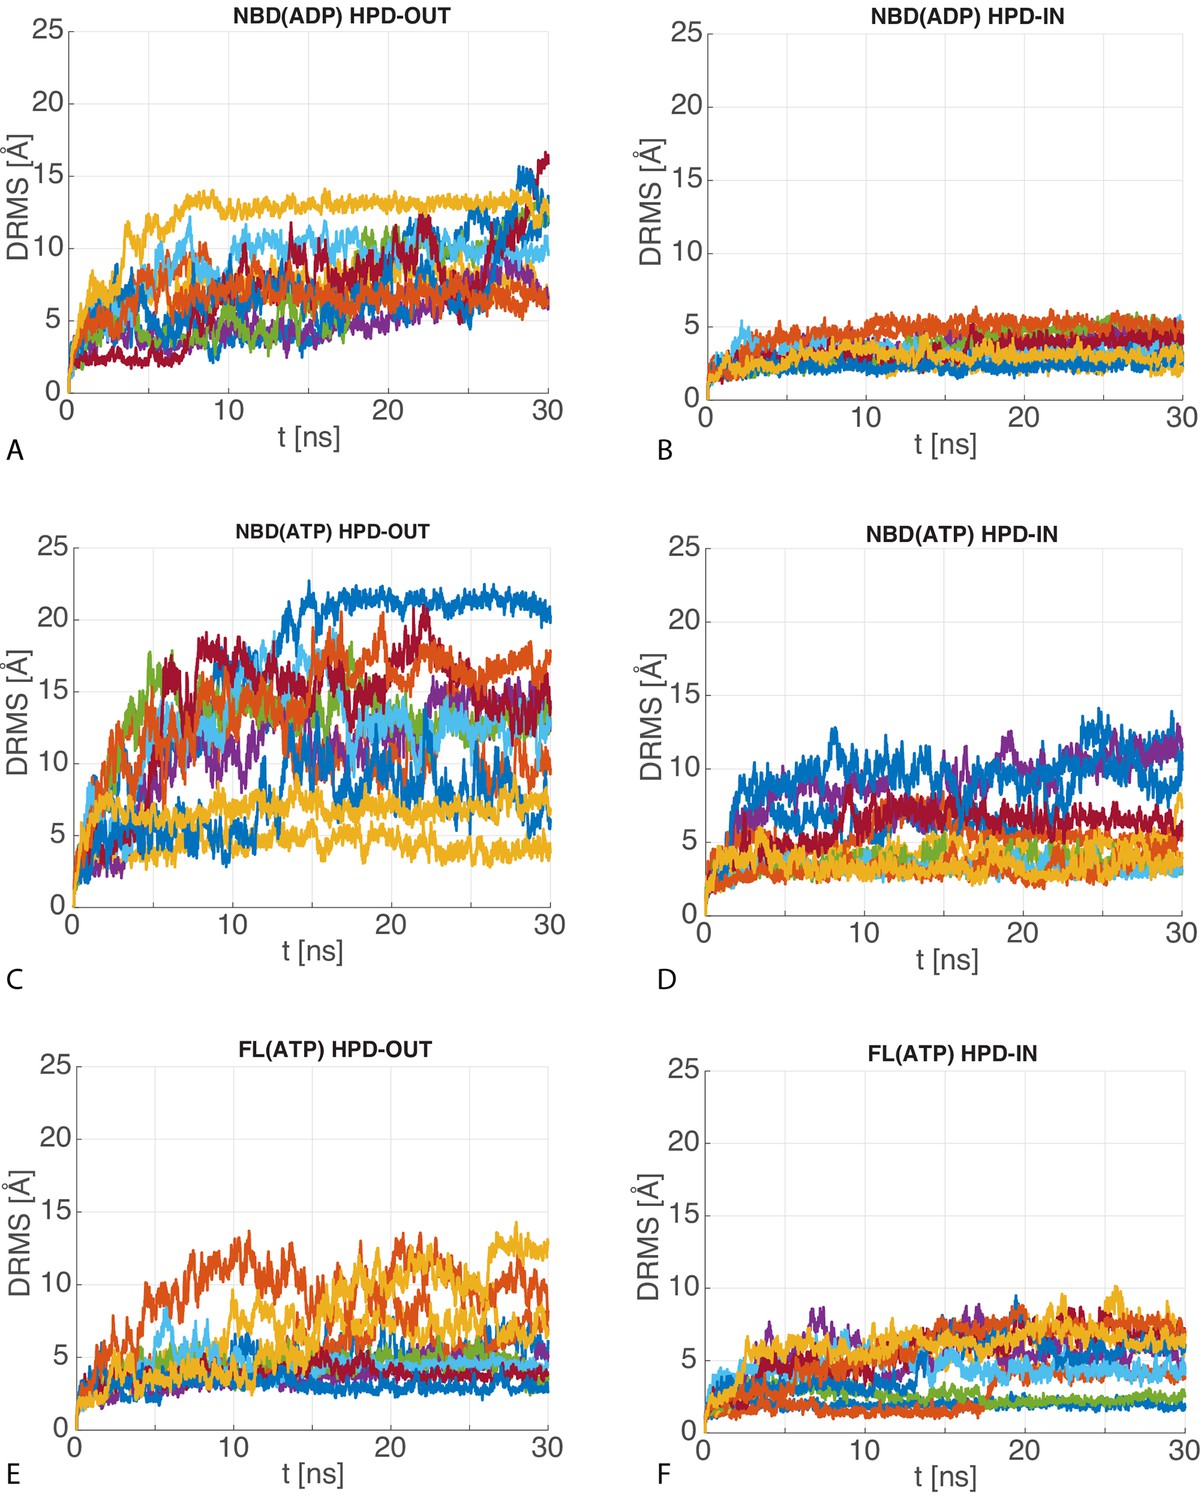
dRMS of atomistic MD trajectories.
The 10 time series of the dRMS of the JD with respect to the initial JD configuration of each MD trajectory for (A) HPD-OUT NBD(ADP), (B) HPD-IN NBD(ADP), (C) HPD-OUT NBD(ATP), (D) HPD-IN NBD(ATP), (E) HPD-OUT FL(ATP), (F) HPD-IN FL(ATP).
Figure 4—figure supplement 3
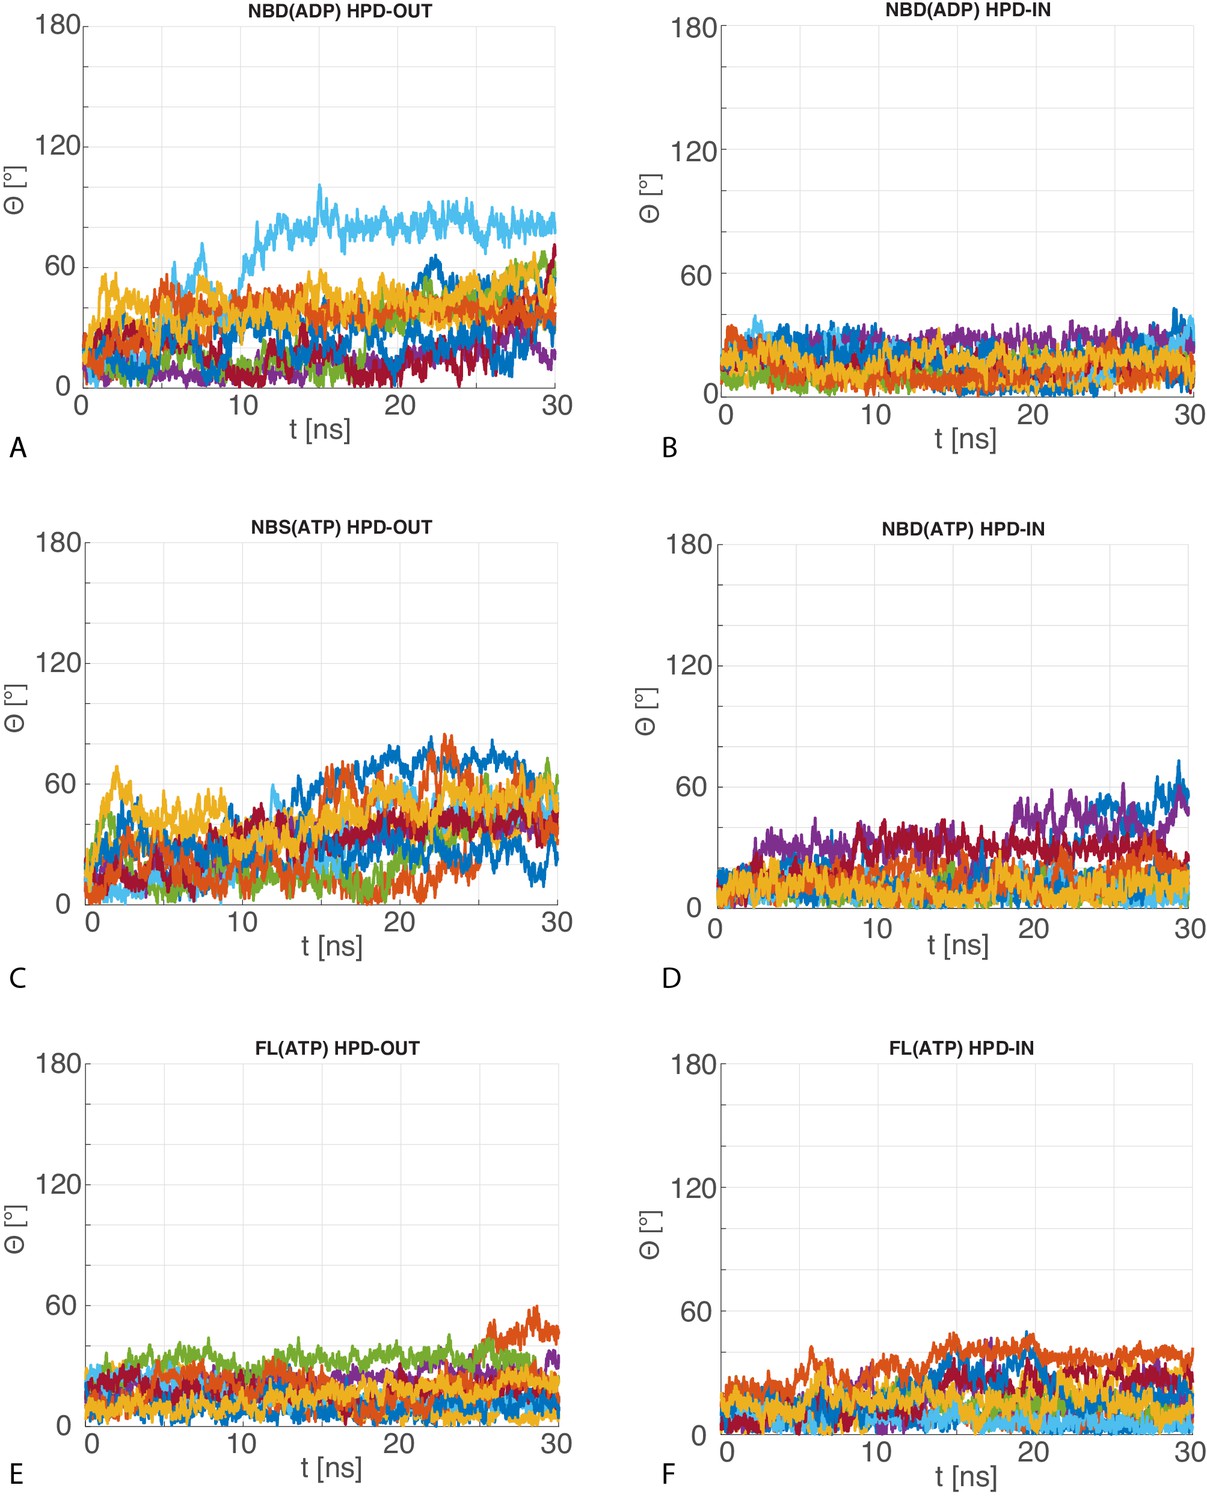
Angular deviation of atomistic MD trajectories w.r.t. the central HPD-IN/OUT CG conformations.
The 10 time series of the angle between the principal axis of the JD in the MD trajectories with respect to the principal axis of the most representative JD configuration in the CG ensemble for (A) HPD-OUT NBD(ADP), (B) HPD-IN NBD(ADP), (C) HPD-OUT NBD(ATP), (D) HPD-IN NBD(ATP), (E) HPD-OUT FL(ATP), (F) HPD-IN FL(ATP).
Figure 4—figure supplement 4
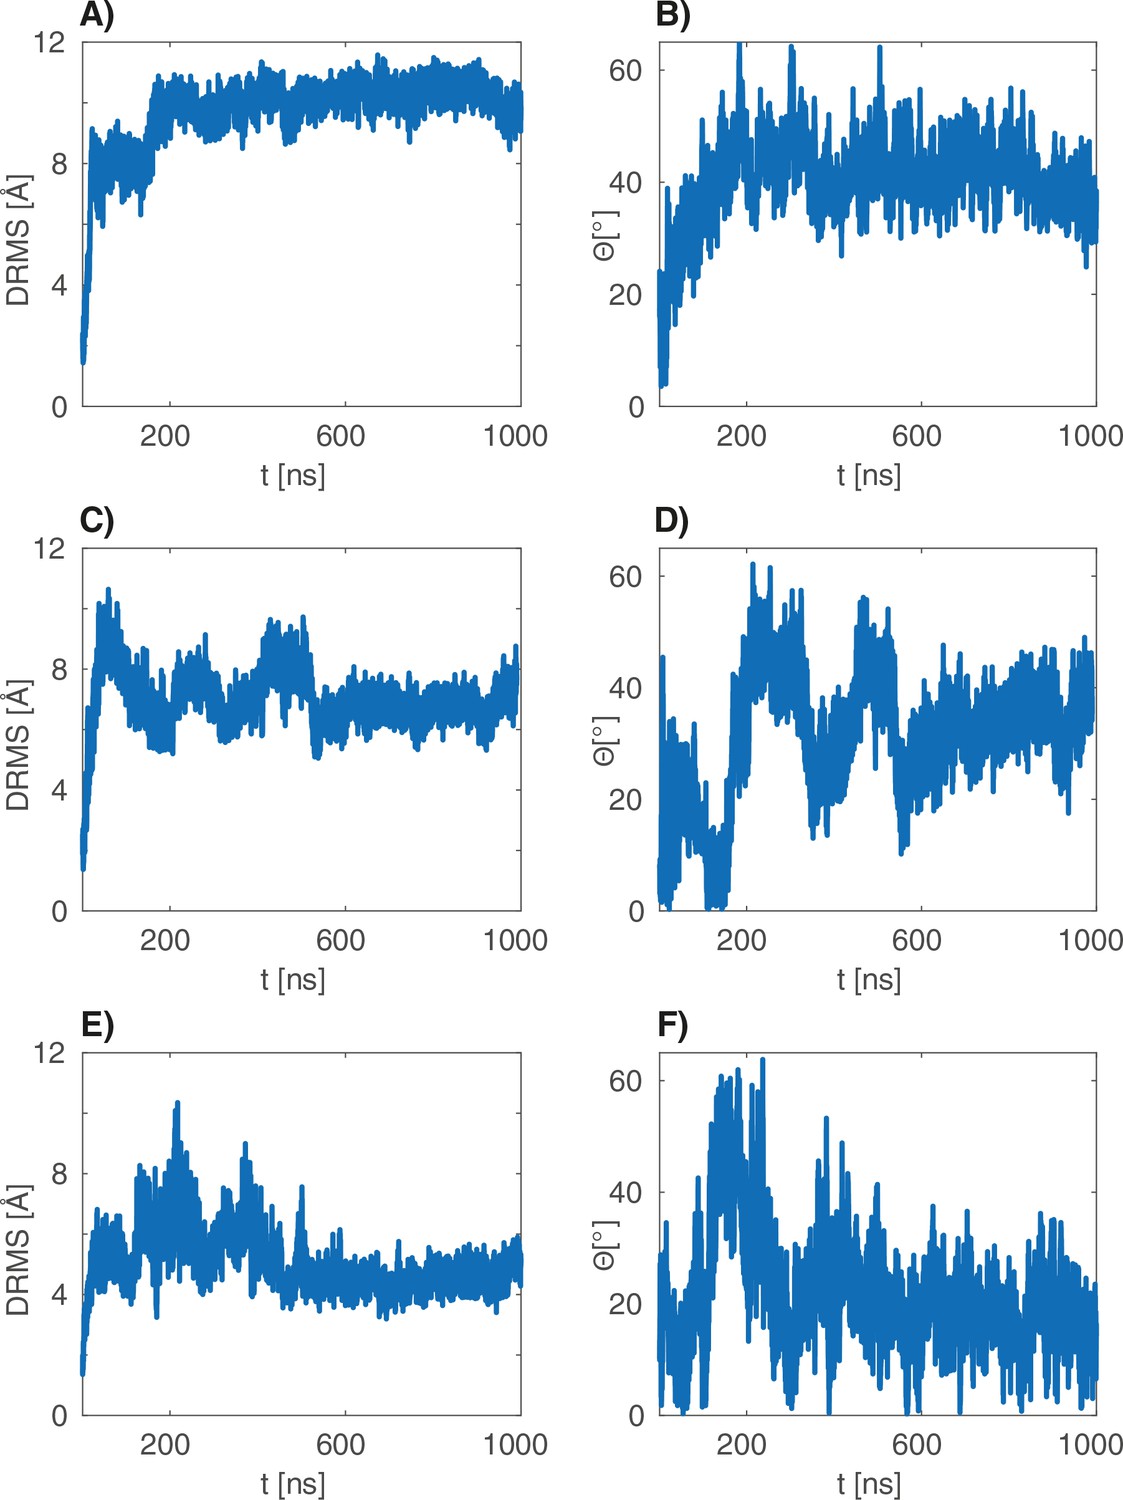
dRMS and angular deviations of the s atomistic simulations.
(A–B), (C–D) and (E–F) are the dRMS (resp. ) traces of the three 1 s atomistic simulations.
Figure 5 with 2 supplements
J-domain - SBD interactions.
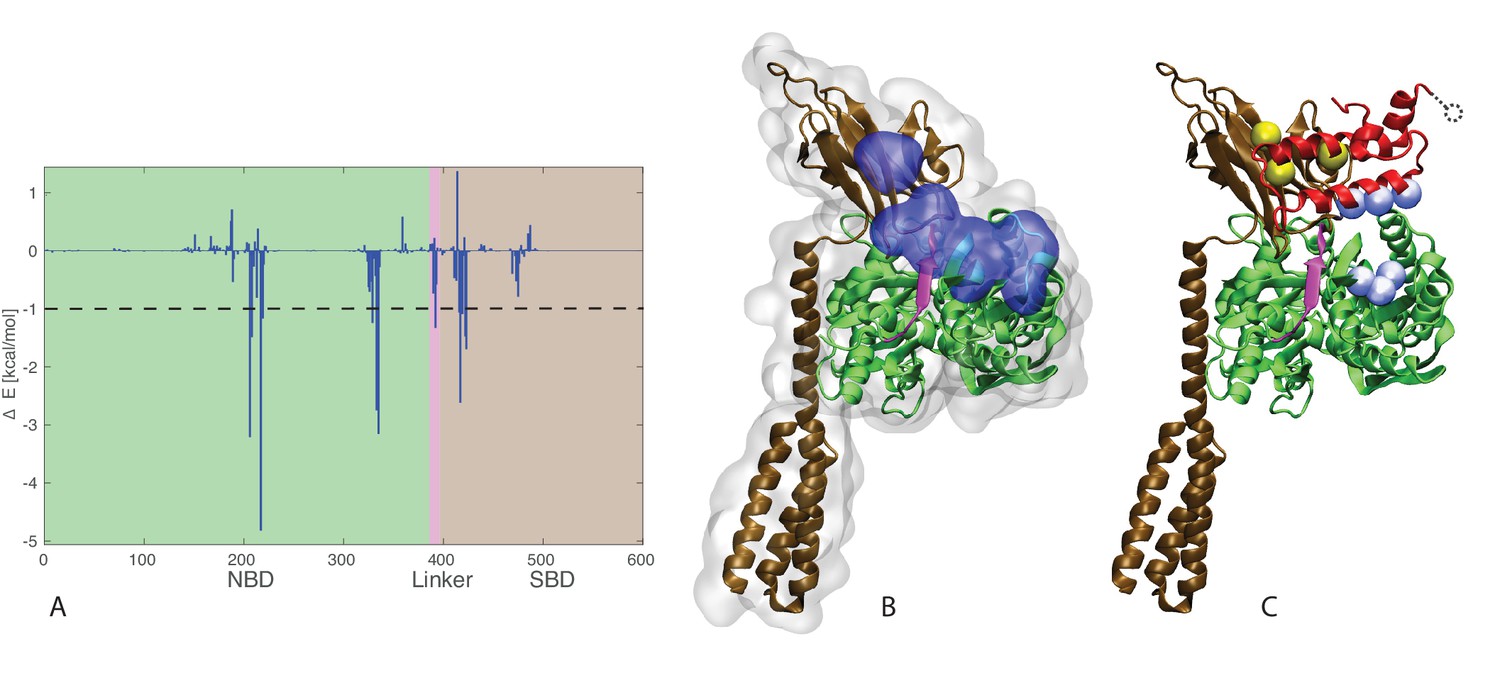
(A) DnaK per-residue contribution to the binding energy with the J-domain. The NBD, linker, and SBD regions are highlighted in green, pink, and ochre, respectively. The dashed line denotes the threshold for which residues are depicted in panel B (−1kcal/mol). (B) Structural view of the residues most contributing to the binding energy with the J-domain. The subdomains of DnaK (NBD, linker, and SBD) follow the same color scheme as in panel A. Residues significantly contributing to the binding energy (ΔE < −1 kcal/mol) are depicted in blue surface representation. (C) Coevolutionary contacts predicted on the full-length Hsp70 sequences. The three blue contacts are the same as those reported in Figure 3. The two contacts involving the SBD of Hsp70 are shown in yellow. The dotted circle represents residue E75 of the J-domain, absent from the structures used in the simulations (see Materials and methods). The depicted conformation is the final frame of one of the three HPD-IN FL-ATP simulations.
Figure 5—figure supplement 1
J-domain per-residue contribution to the binding energy with DnaK.
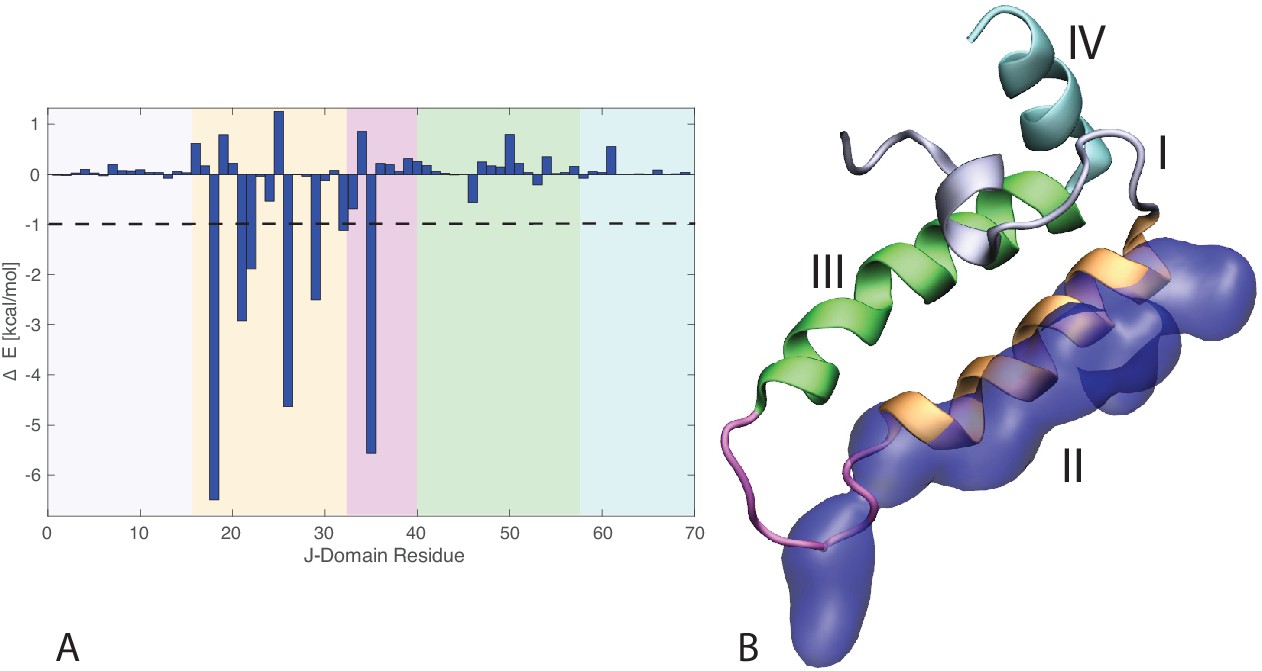
(A) Helices I to IV are highlighted in gray, orange, green, and cyan, respectively. The loop connecting helices II and III is depicted in magenta . The dashed line denotes the threshold for which residues are depicted in panel B (−1kcal/mol). (B) Structural view of the residues most contributing to the binding energy with DnaK. The subdomains of the J-domain (helices I to IV and loop) follow the same color scheme as in panel A. Residues significantly contributing to the binding energy ( kcal/mol) are depicted in blue surface representation.
Figure 5—figure supplement 2
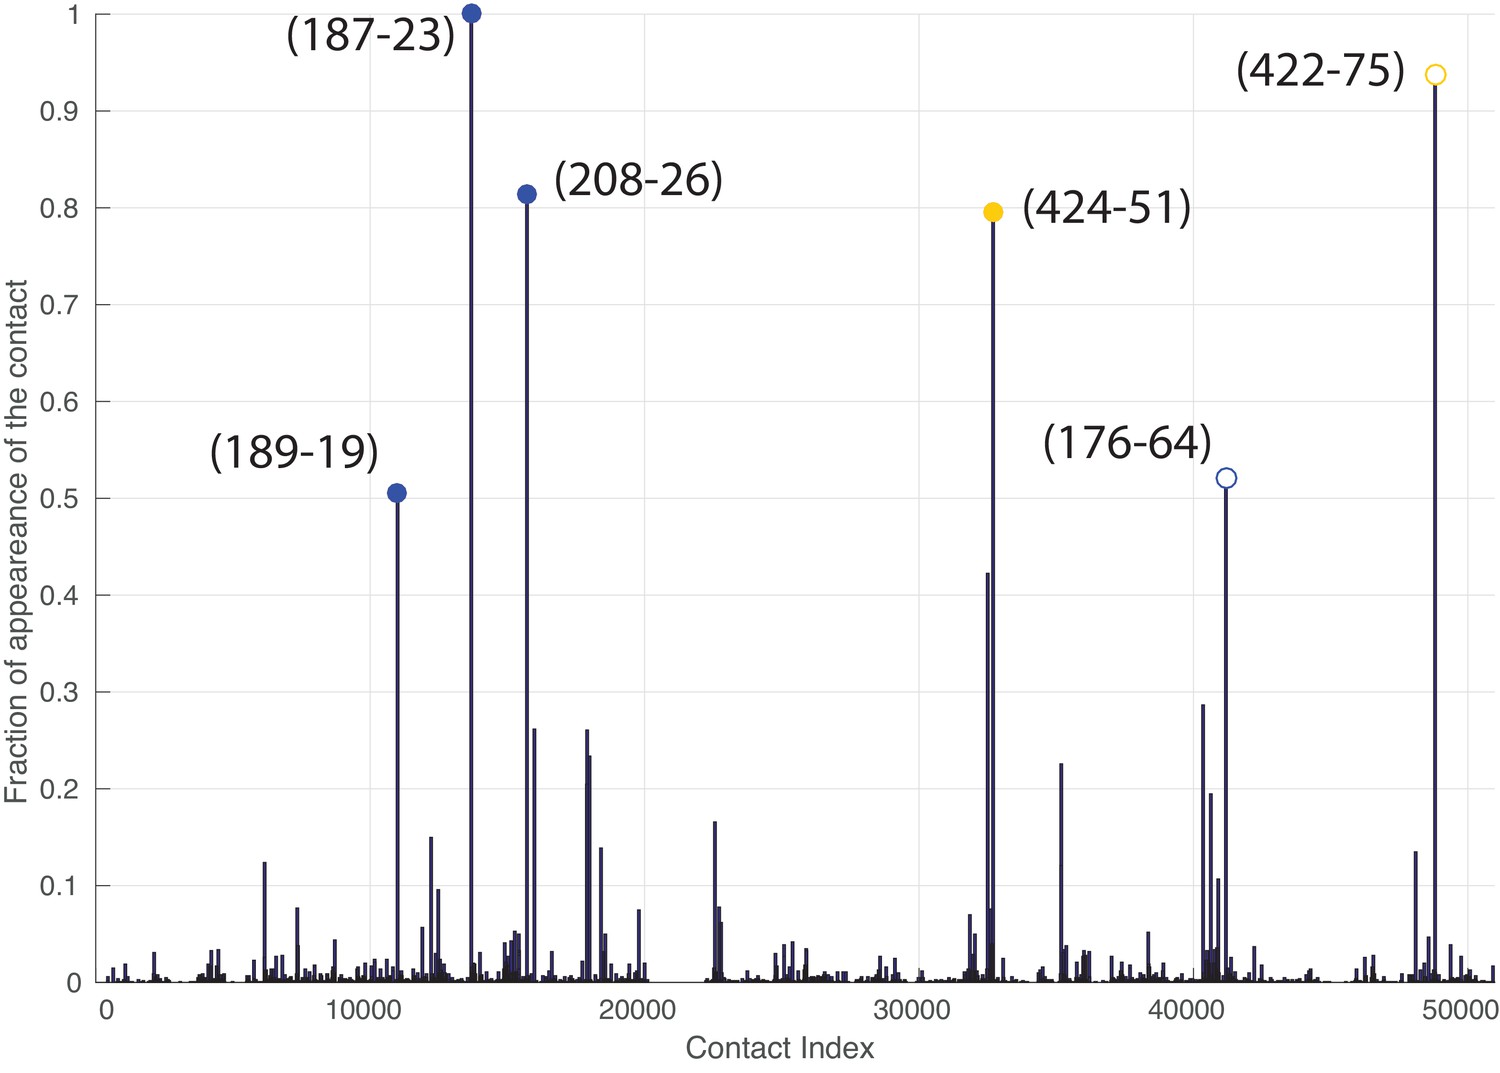
Frequency of appearance of the coevolutionary inter-protein contacts (see Materials and methods), for the dataset containing full-length Hsp70s.
The six most frequent contacts are highlighted (blue: contacts with NBD, yellow: contacts with SBD). The buried predicted contact with the NBD and the contact not present in the J-domain structure are represented by hollow circles.
Figure 6
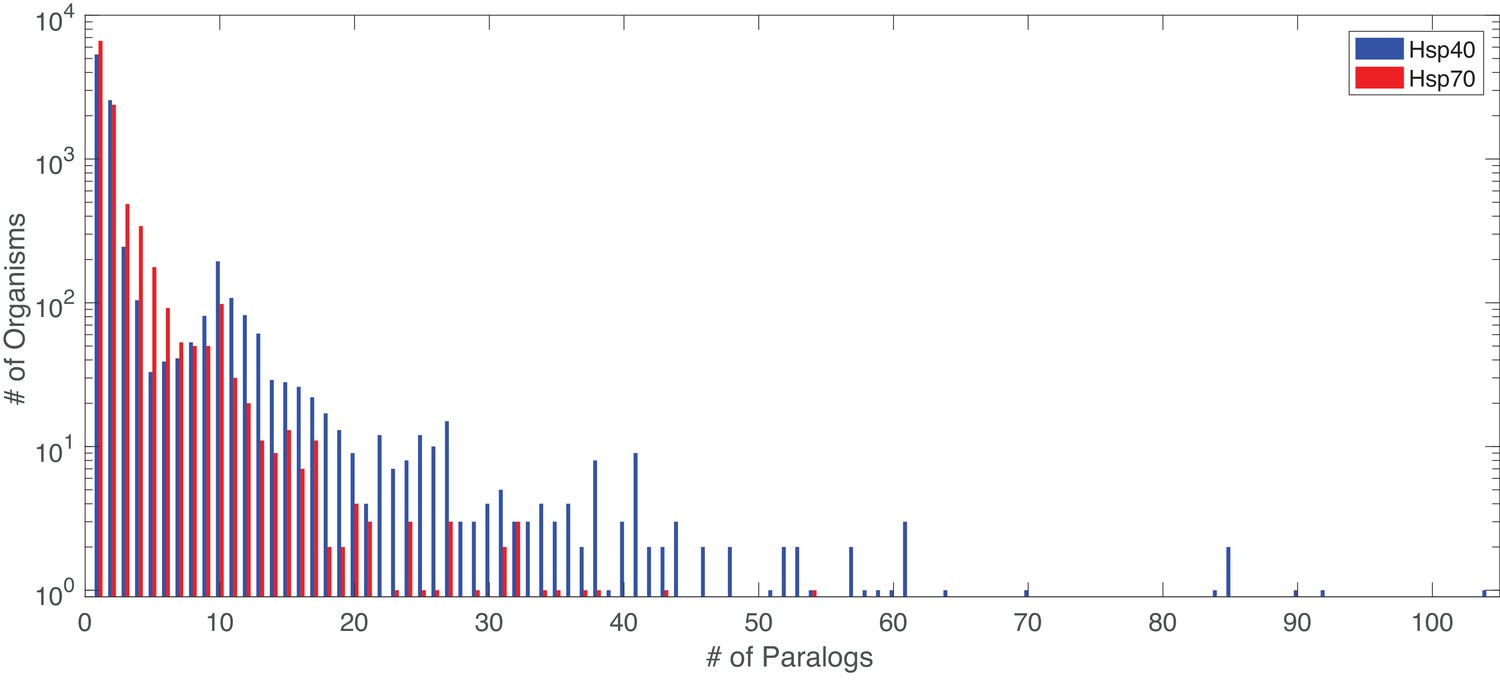
Distribution of number of paralogs per organism, for Hsp40 and Hsp70.
https://doi.org/10.7554/eLife.23471.021
Figure 7 with 1 supplement
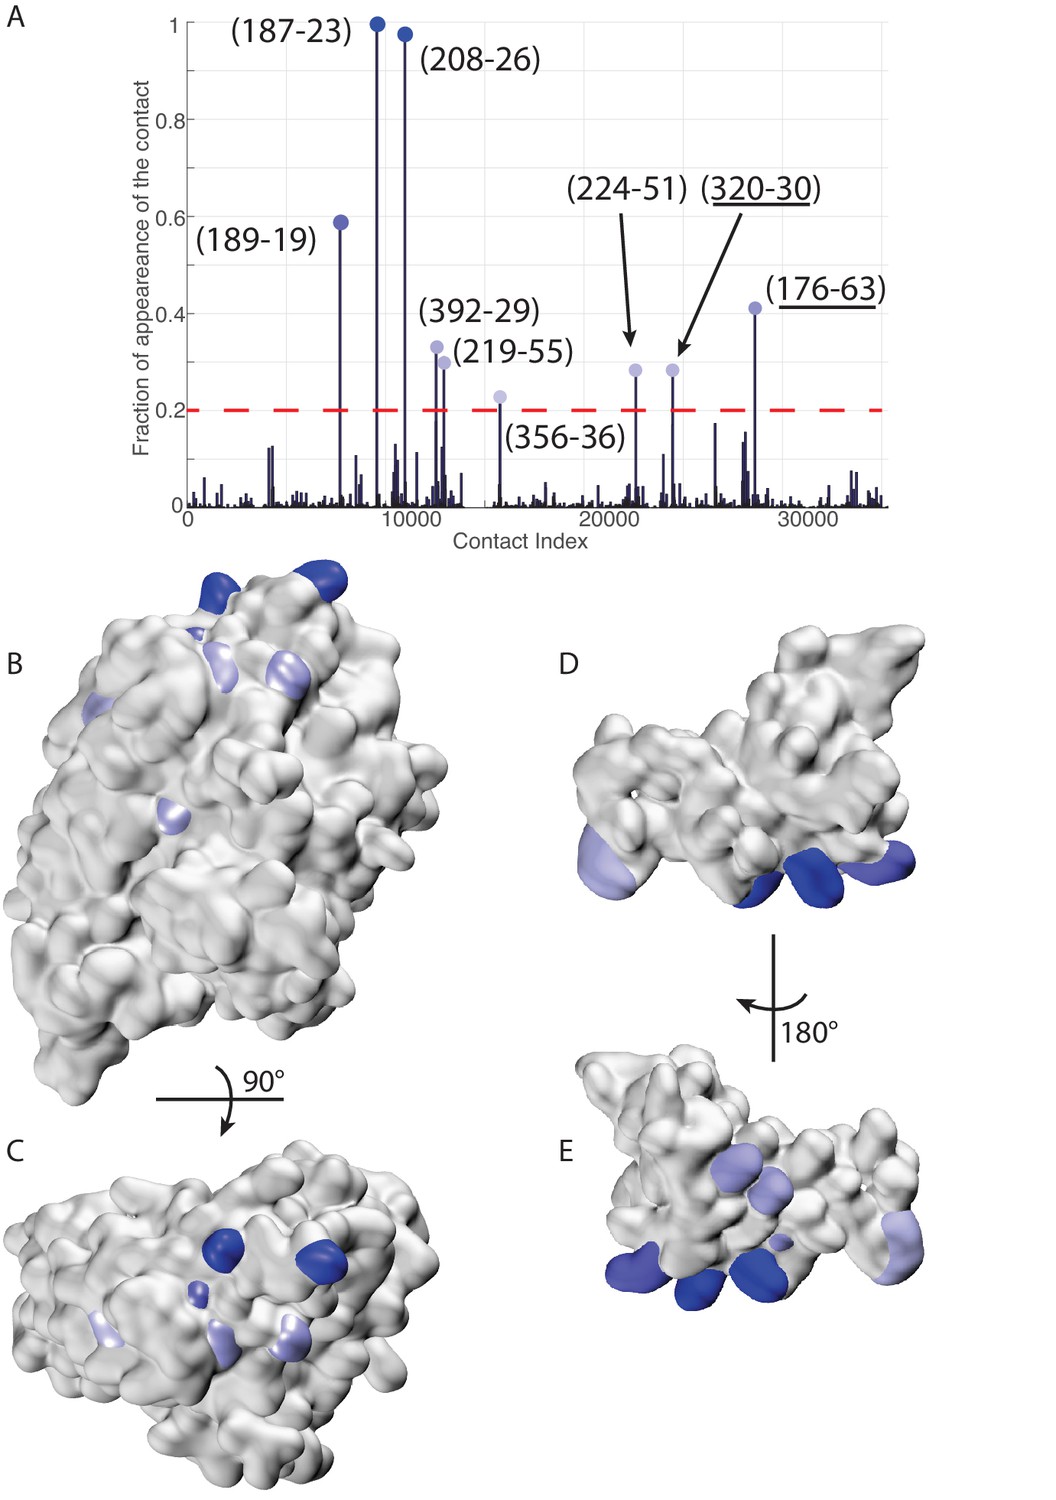
Extended analysis of coevolutionary predictions and threshold validation.
DCA predicted contacts with threshold selection threshold above 0.2. (A) Frequency of appearance of the coevolutionary inter-protein contacts (see Materials and methods). All nine predicted contacts which appear in more than 20% (dashed red line) of the random matchings are reported. Contacts are colored by their selection frequency (blue: most frequent, white: less frequent). The two contacts containing a buried residue are underlined. (B–C) The seven surface exposed residues among the nine selected, reported on the DnaK NBD. (D–E) The seven surface exposed residues among the nine selected, reported on the JD. Panels B-E follow the same color scheme as panel (A).
Figure 7—figure supplement 1

Comparison of the five strongest DCA predictions between different methods.
For IPA and PPM, the cases marked Bacteria and Eukaryota denote results obtained on the two restricted subsets. The cases denoted Full were obtained using the complete dataset. Random Matching: Five most frequently selected inter-protein contacts. IPA and PPM: Top five ranked inter-protein. In all cases, the scale goes from blue to red (blue: strongest/most frequent contact, red: weaker/less frequent contact).
Author response image 1
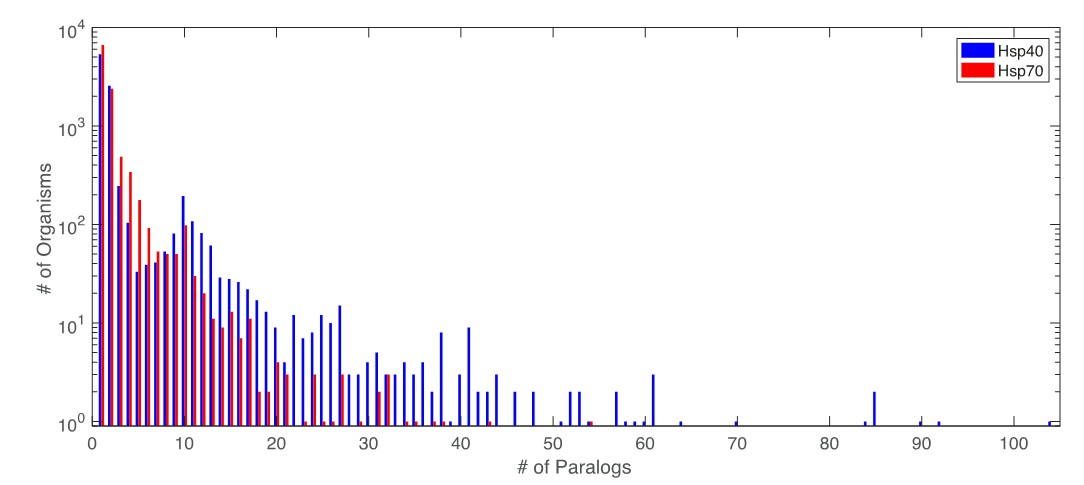
Distribution of number of paralogs per organism for Hsp40 and Hsp70.
https://doi.org/10.7554/eLife.23471.031
Author response image 2
Frequency of appearance of coevolutionary inter-protein contacts.
Left: Only bacterial sequences. Right: Only eukaryotic sequences. Inset: Zoom on the vertical axis between 0 and 5%. The five most frequent contacts in the bacterial analysis reported in Tab.R3 are highlighted. The colored circles coincide with the three most frequently selected contacts in the full dataset, reported in the main text.
Author response image 3
Random matching results obtained on the HK/RR dataset.
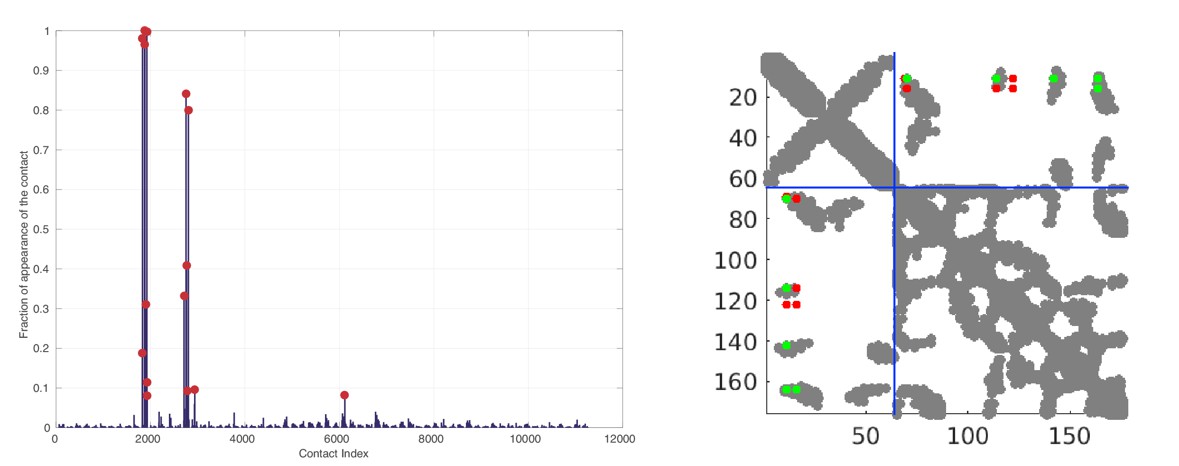
Left: Frequence of appearances of the contacts. The 15 most frequent contacts are highlighted by red circles for visualization. Right: The 10 most frequent contacts plotted onto the contact map of the HK/RR hetero-dimer (PDB:3DGE). Structural contacts from the PDB are defined using a threshold of 8.5Å between heavy atoms of two residues. Green (resp. red) DCA predicted contacts correspond to true (resp. false) predictions with respect the crystal structure. The blue dotted line represents the limit between HK and RR.
Author response image 4

Comparison of inter-protein predictions between the three methods, on the full dataset (left column), bacterial dataset (central column) and eukaryotic dataset (right column).
The residues on the NBD involved in the absolute top five contacts predicted by all methods are reported, without any filtering. The color-code denotes the rank of the predictions, from dark blue (rank=1) to dark red (rank=5).
Author response image 5
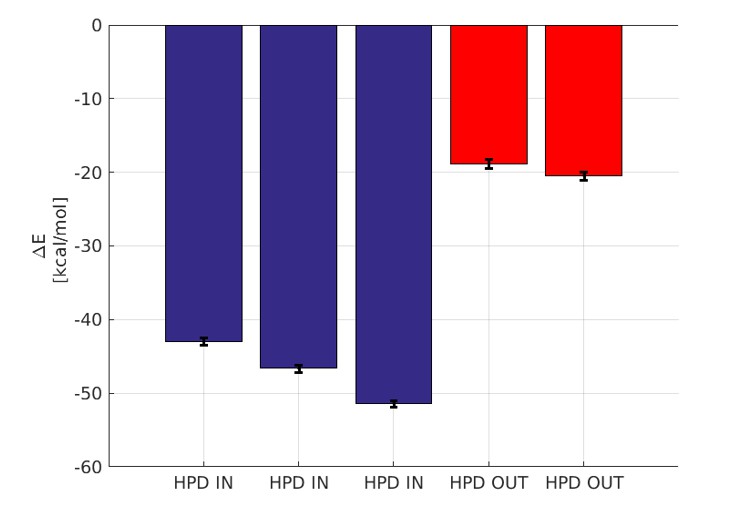
Binding energy computed by GBSA.
The blue bars denote the three micro-second runs of the HPD-IN conformations. The red bars denote the two 750 ns runs of the HPD-OUT conformations.
Tables
Table 1
Stability analysis of atomistic MD. dRMS is the distance root mean square deviation between atoms of the JD and DnaK . is the angle formed by the principal axis of the JD with respect to the principal axis of the JD in the starting frame. Standard deviations over the 10 MD trajectories are reported in parentheses. See Materials and methods for details.
| dRMS [Å] | [°] | ||
|---|---|---|---|
| NBD(ADP) | HPD-OUT | ||
| HPD-IN | |||
| NBD(ATP) | HPD-OUT | ||
| HPD-IN | |||
| FL(ATP) | HPD-OUT | ||
| HPD-IN |
Table 2
Summary of the taxonomic composition of the Hsp40 and Hsp70 alignments. Entries of the table represent the number of sequences found in each taxonomic group. The number of organisms in each taxonomic group is indicated in parenthesis.
| Eukaryotes | Bacteria | Archaea | Viruses | Other | Total | |
|---|---|---|---|---|---|---|
| Hsp40 | 14369 (1093) | 11379 (7837) | 311 (273) | 36 (22) | 159 (13) | 26254 (9238) |
| Hsp70 | 7881 (1933) | 11819 (8272) | 273 (258) | 25 (17) | 63 (13) | 20061 (10493) |
Table 3
Solvent accessible surface area (SASA) of the residue involved in the nine predicted DCA contacts with selection frequency higher than 20%. The residue numbering refers to the E. coli numbering of DnaK resp. DnaJ. Numbers in parentheses denote the SASA of the amino-acids involved in the contacts normalized to the average amino-acid SASA (data from [Chothia, 1976]). Residue pairs involving a buried amino-acid are colored in gray. denotes the average distances of the corresponding residue pairs in FL(ATP) conformations from the CG simulations in the HPD-IN/OUT orientations.
| Contact | Sasa 1 [] | Sasa 1 [] | [Å] | [Å] | Selection frequency |
|---|---|---|---|---|---|
| N187 - K23 | 102.7 (0.64) | 119.8 (0.60) | 13.7 | 11.4 | 0.996 |
| D208 - K26 | 41.6 (0.27) | 144.9 (0.72 ) | 8.5 | 10.0 | 0.976 |
| T189 - R19 | 17.3 (0.12) | 177.9 (0.79) | 23.0 | 13.7 | 0.587 |
| A176 - A64 | 0.6 (0.005) | 34.6 (0.30) | - | - | 0.414 |
| L392 - A29 | 89.5 (0.52) | 11.1 (0.10) | 11.7 | 9.7 | 0.334 |
| L219 - E55 | 44.7 (0.26) | 69.8 (0.37) | 22.6 | 17.7 | 0.311 |
| D224 - K51 | 40.7 (0.27) | 95.2 (0.48) | 33.7 | 31.6 | 0.287 |
| L320 - M30 | 0.7 (0.004) | 129.2 (0.70) | - | - | 0.285 |
| F356 - R36 | 48.5 (0.23) | 214.6 (0.95) | 23.3 | 39.9 | 0.232 |
Author response table 1
Summary of the taxonomic composition of the two alignments used in the work. Entries of the table represent the number of sequences found in each taxonomic group. The number of organisms in each taxonomic group is indicated in parenthesis.
| Eukaryotes | Bacteria | Archaea | Viruses | Other | Total | |
| Hsp40 | 14369 (1093) | 11379 (7837) | 311 (273) | 36 (22) | 159 (13) | 26254 (9238) |
| Hsp70 | 7881 (1933) | 11819 (8272) | 273 (258) | 25 (17) | 63 (13) | 20061 (10493) |
Author response table 2
10 first DCA predicted contacts using the reduced set consisting of the 3701 single copy pairs organisms. The second column denotes the DCA score of the predicted contact. The rank is computed over all contacts, including the intra-chain predictions.
| Contact | Score | Rank | SASA [Å2] |
| N187-K23 | 0.31 | 324 | 102.7 – 119.8 |
| D208-K26 | 0.25 | 385 | 42.0 – 145.0 |
| A17-R63 | 0.25 | 392 | 0 – 84.0 |
| E306-R63 | 0.24 | 406 | 41.1 – 84.0 |
| I338-I21 | 0.23 | 448 | 0.8 – 1.0 |
| N222-K31 | 0.22 | 463 | 14.8 – 145.0 |
| L219-E55 | 0.22 | 478 | 44.7 – 69.8 |
| L390-A29 | 0.20 | 578 | 89.5 – 11.1 |
| T215-E55 | 0.19 | 597 | 26.6 – 69.8 |
| L131-A64 | 0.19 | 617 | 47.2 – 34.6 |
Author response table 3
Five most frequent contacts in the coevolutionary analysis restricted to bacterial sequences. Contacts denoted by (*) are among the five first predicted contacts in the full dataset.
| Contact | Frequency |
| D208 – K26 (*) | 1 |
| N187 – K23 (*) | 1 |
| T189 – R19 (*) | 0.83 |
| L392 – A29 (*) | 0.81 |
| V215 – Y54 | 0.75 |
Author response table 4
Comparison of top inter-protein contact predictions between Random Matching, PPM and IPA. In green are highlighted the overlapping predictions between Random matching and PPM/IPA. Contacts highlighted in yellow denote similar contacts, defined as having one identical residue, and the second one in proximity.
| Random Matching | PPM | IPA |
| K23 – N187 | K23 – N187 | K23 – N187 |
| K26 – D208 | E55 – T215 | R19 – T189 |
| R19 – T189 | K26 – D208 | K26 – D208 |
| A64 – A176 | R63 – A17 | D59 – I39 |
| A29 – L392 | R19 – T189 | A64 – A176 |
| E55 – L219 | Y25 – A191 | A29 – L382 |
| K51 – D224 | A29 – L382 | K50 – Y193 |
| M30 – L320 | Y25 – I338 | A24 – G358 |
| R36 – F356 | Y54 – A376 | I21 – I338 |
Additional files
-
Supplementary file 1
Multiple sequence alignment of the Hsp40 family, in canonical fasta format.
- https://doi.org/10.7554/eLife.23471.025
-
Supplementary file 2
Organism list of the Hsp40 sequences in Supplementary file 1.
Each line contains the organism name of the corresponding sequence in the fasta file.
- https://doi.org/10.7554/eLife.23471.026
-
Supplementary file 3
Multiple sequence alignment of the Hsp70 family, limited to the NBD and inter-domain linker, in canonical fasta format.
- https://doi.org/10.7554/eLife.23471.027
-
Supplementary file 4
Organism list of the Hsp70 sequences in Supplementary file 3.
Each line contains the organism name of the corresponding sequence in the fasta file.
- https://doi.org/10.7554/eLife.23471.028
-
Supplementary file 5
Multiple sequence alignment of the Hsp70 family, full sequences, in canonical fasta format.
- https://doi.org/10.7554/eLife.23471.029
Download links
A two-part list of links to download the article, or parts of the article, in various formats.
Downloads (link to download the article as PDF)
Open citations (links to open the citations from this article in various online reference manager services)
Cite this article (links to download the citations from this article in formats compatible with various reference manager tools)
Modeling Hsp70/Hsp40 interaction by multi-scale molecular simulations and coevolutionary sequence analysis
eLife 6:e23471.
https://doi.org/10.7554/eLife.23471


