Regulation of plant immune receptor accumulation through translational repression by a glycine-tyrosine-phenylalanine (GYF) domain protein
- University of British Columbia, Canada
- Hunan Agricultural University, China
Figures
Figure 1
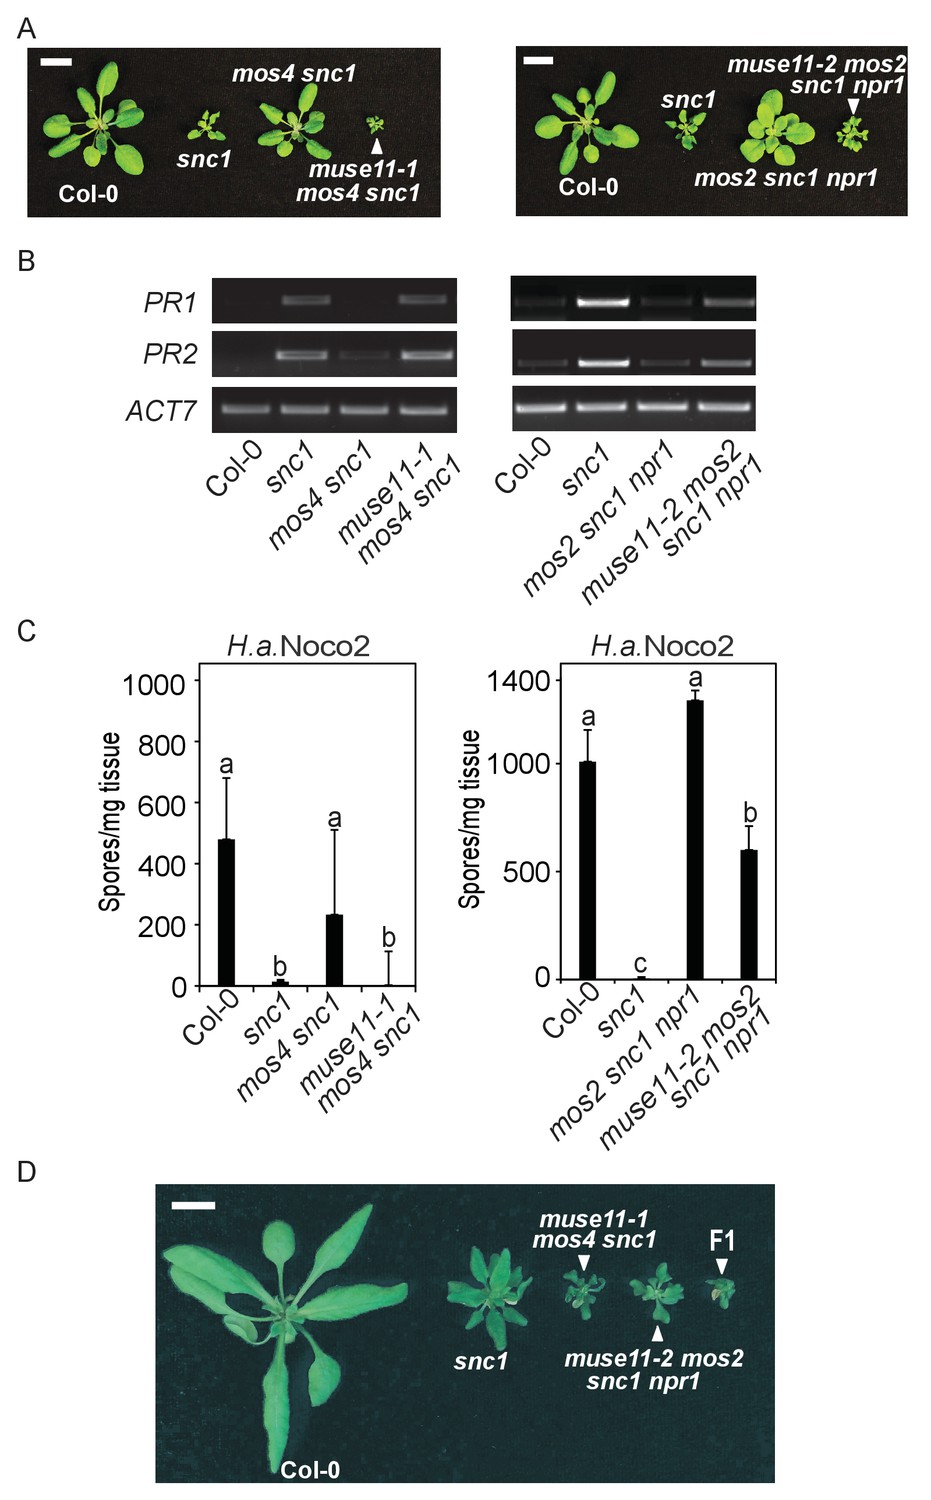
Characterization of muse11-1 mos4 snc1 and muse11-2 mos2 snc1 npr1 mutants.
(A) Morphology of four-week-old plants of the indicated genotypes. Plants were grown at 22˚C under long day conditions. Bar = 1 cm. (B) PR1 and PR2 gene expression in the indicated plants as determined by RT-PCR. (C) Quantification of H.a. Noco2 sporulation on the indicated plants seven days post inoculation (dpi) with 105 spores per ml water. One-way ANOVA was used to calculate the statistical significance among genotypes. Different letters indicate statistical differences (p<0.05). Three independent experiments were carried out with similar results. Bars represent means ± SD (n = 4). (D) Morphology of four-week-old Col-0, snc1, muse11-1 mos4 snc1 and muse11-2 mos2 snc1 npr1 plants with an F1 progeny from the cross between muse11-1 mos4 snc1 and muse11-2 mos2 snc1 npr1. Bar = 1 cm.
Figure 2
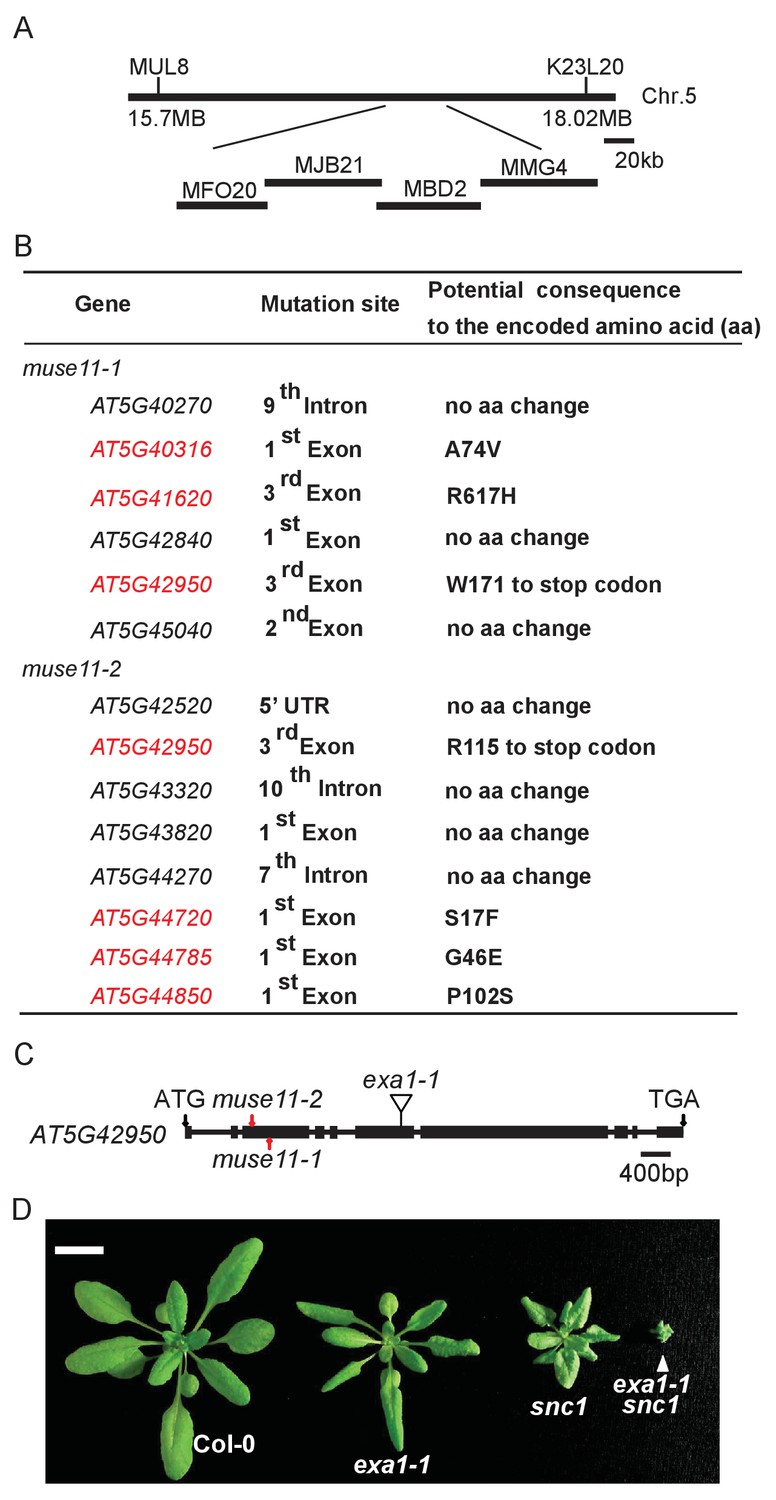
Map-based cloning of muse11.
(A) Map position of muse11-1 and muse11-2 on chromosome 5. BAC clones are indicated. (B) Mutations identified in the mapped muse11-1 and muse11-2 region through next-generation resequencing. Genes carrying non-synonymous mutations are indicated in red fonts. (C) Gene structure of MUSE11 (AT5G42950). Boxes indicate exons and lines represent introns. The two black arrows indicate the start and stop codons, respectively. The two mutations found in muse11-1 and muse11-2 are labeled with red arrows. The insertion site in exa1-1 (SALK_005994) is illustrated in exon 6. (D) Morphology of four-week-old Col-0, exa1-1, snc1 and exa1-1 snc1 plants. Bar = 1 cm.
Figure 3
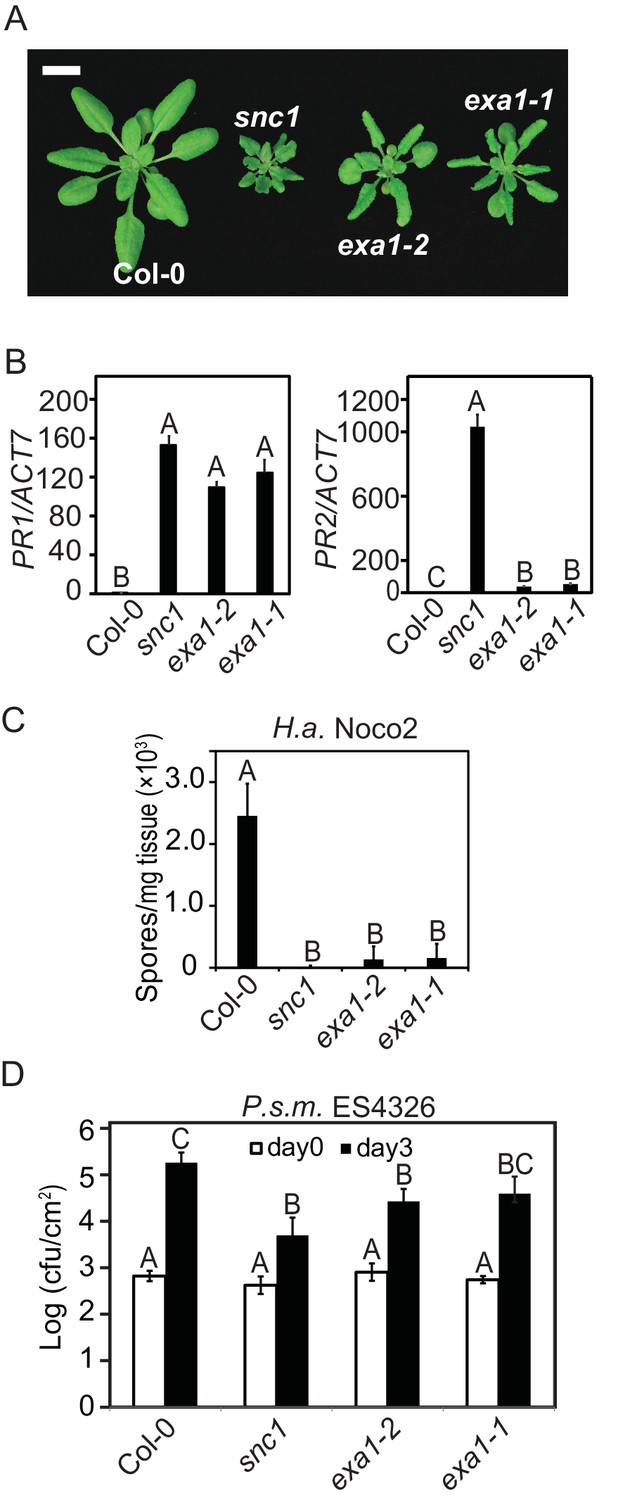
Characterization of the exa1 single mutants.
(A) Morphology of four-week-old Col-0, snc1, exa1-2 and exa1-1 plants. Bar = 1 cm. (B) Relative expression of PR-1 and PR-2 in four-week-old soil-grown Col-0, exa1-2 and exa1-1 plants as determined by RT-PCR. Actin7 was used to normalize the transcript levels. One-way ANOVA was used to calculate the statistical significance among genotypes, which is indicated by different letters (p<0.01). Two independent experiments were carried out with similar results. Bars represent means ± SD (n = 3). (C) Quantification of H.a. Noco2 sporulation on the indicated genotypes. One-way ANOVA was used to calculate the statistical significance among genotypes, which is indicated by different letters (p<0.01). Three independent experiments were carried out with similar results. Bars represent means ± SD (n = 4). (D) Growth of P.s.m. ES4326 on four-week-old leaves of the indicated genotypes at 0 and 3 dpi with bacterial inoculum of OD600 = 0.001. One-way ANOVA was used to calculate the statistical significance among genotypes, which is indicated by different letters (p<0.01). Three independent experiments were carried out with similar results. Bars represent means ± SD (n = 4).
Figure 4
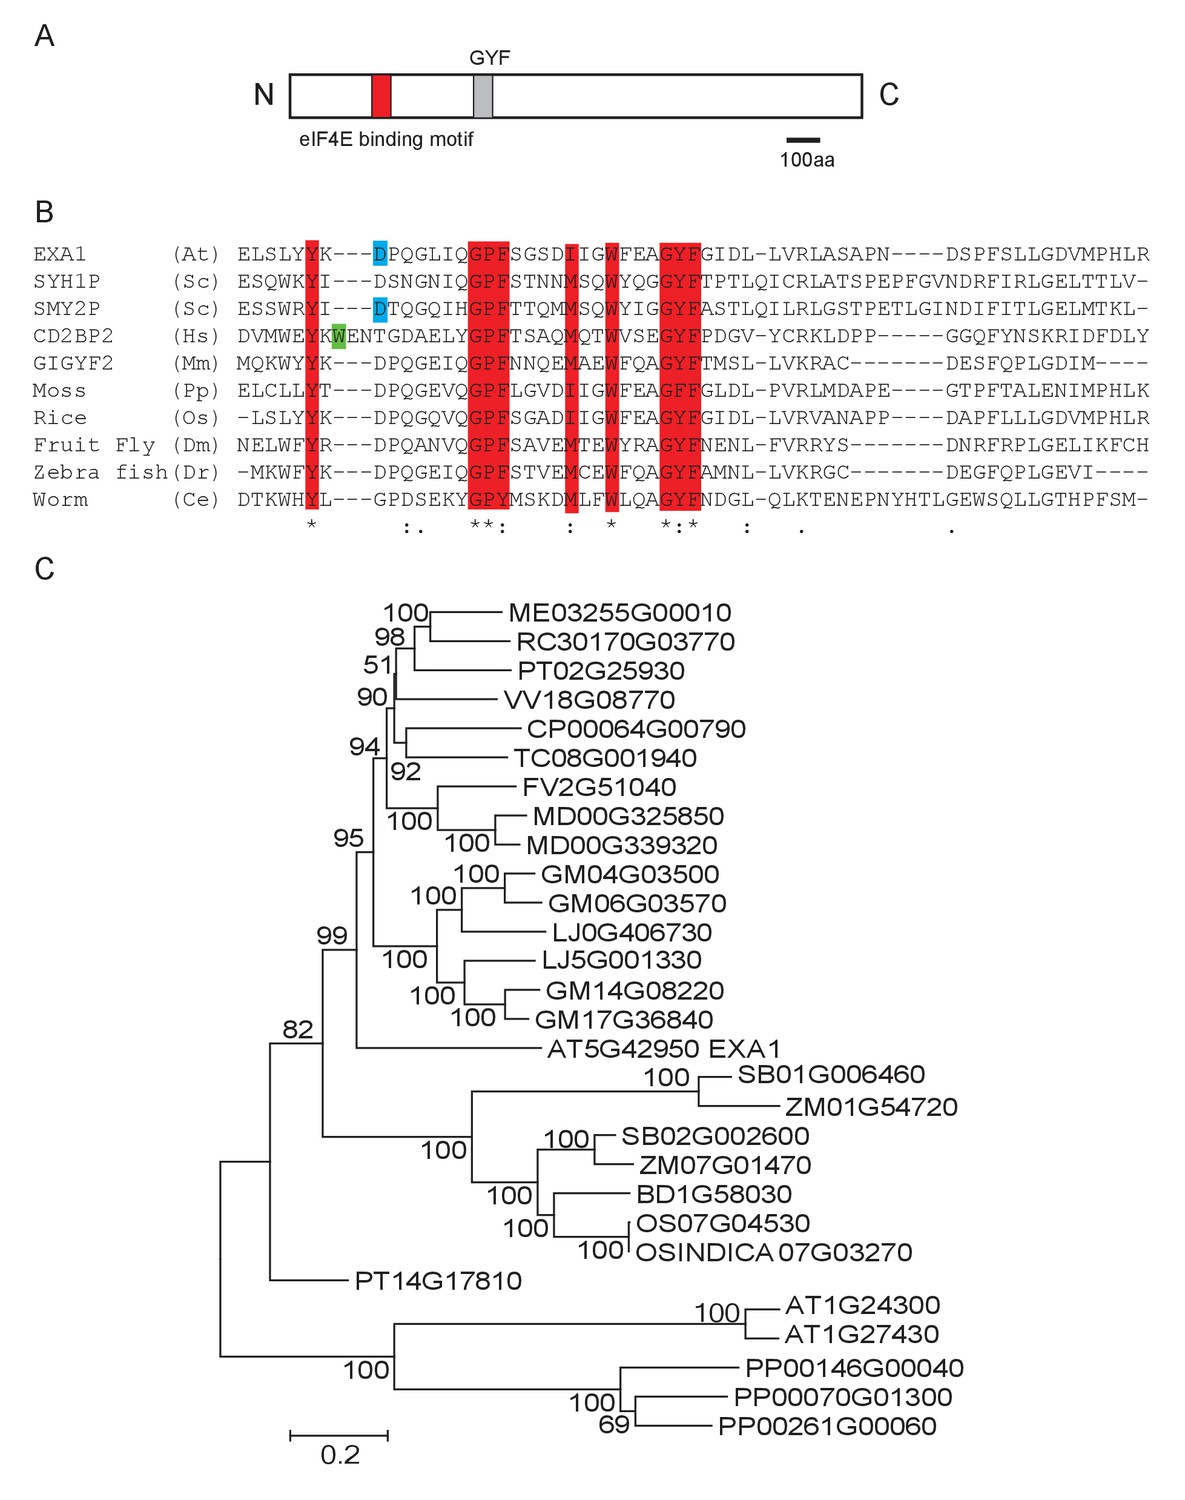
Phylogenetic analysis of EXA1 and its potential orthologs.
(A) The predicted protein structure of EXA1. The GYF domain is indicated by a gray box. (B) Amino acid alignments of GYF domains from eukaryotes. At, Sc, Hs, Mm, Pp, Os, Dm, Dr and Ce stand for the following species: A. thaliana, Saccharomyces cerevisiae (SYH1P: AJW09613.1; SMY2P: AJQ12401.1), Homo sapiens (CD2BP2: ALQ33977.1), Mus musculus (GIGYF2: EDL40166.1), Physcomitrella patens (XP_001772117.1), Oryza sativa (XP_015646509.1), Drosophila melanogaster (NP_651950.3), Danio rerio (XP_009301398.1) and Caenorhabditis elegans (NP_001041150.1), respectively. Protein sequences were aligned using CLUSTAL. Residues that are characteristic of GYF domains are depicted as red letters. The green or blue letters represent residues conserved in either the CD2BP2 or SMY2 subfamily, respectively. (C) EXA1 and its potential orthologs in plant species were used to generate the phylogenetic tree. Putative EXA1 orthologs were obtained from Plaza using full-length protein sequences as input. Sequences were aligned using Muscle and a Neighbor Joining tree was constructed using MEGA 5.0 with the JTT model and 5000 bootstrap value.
Figure 5
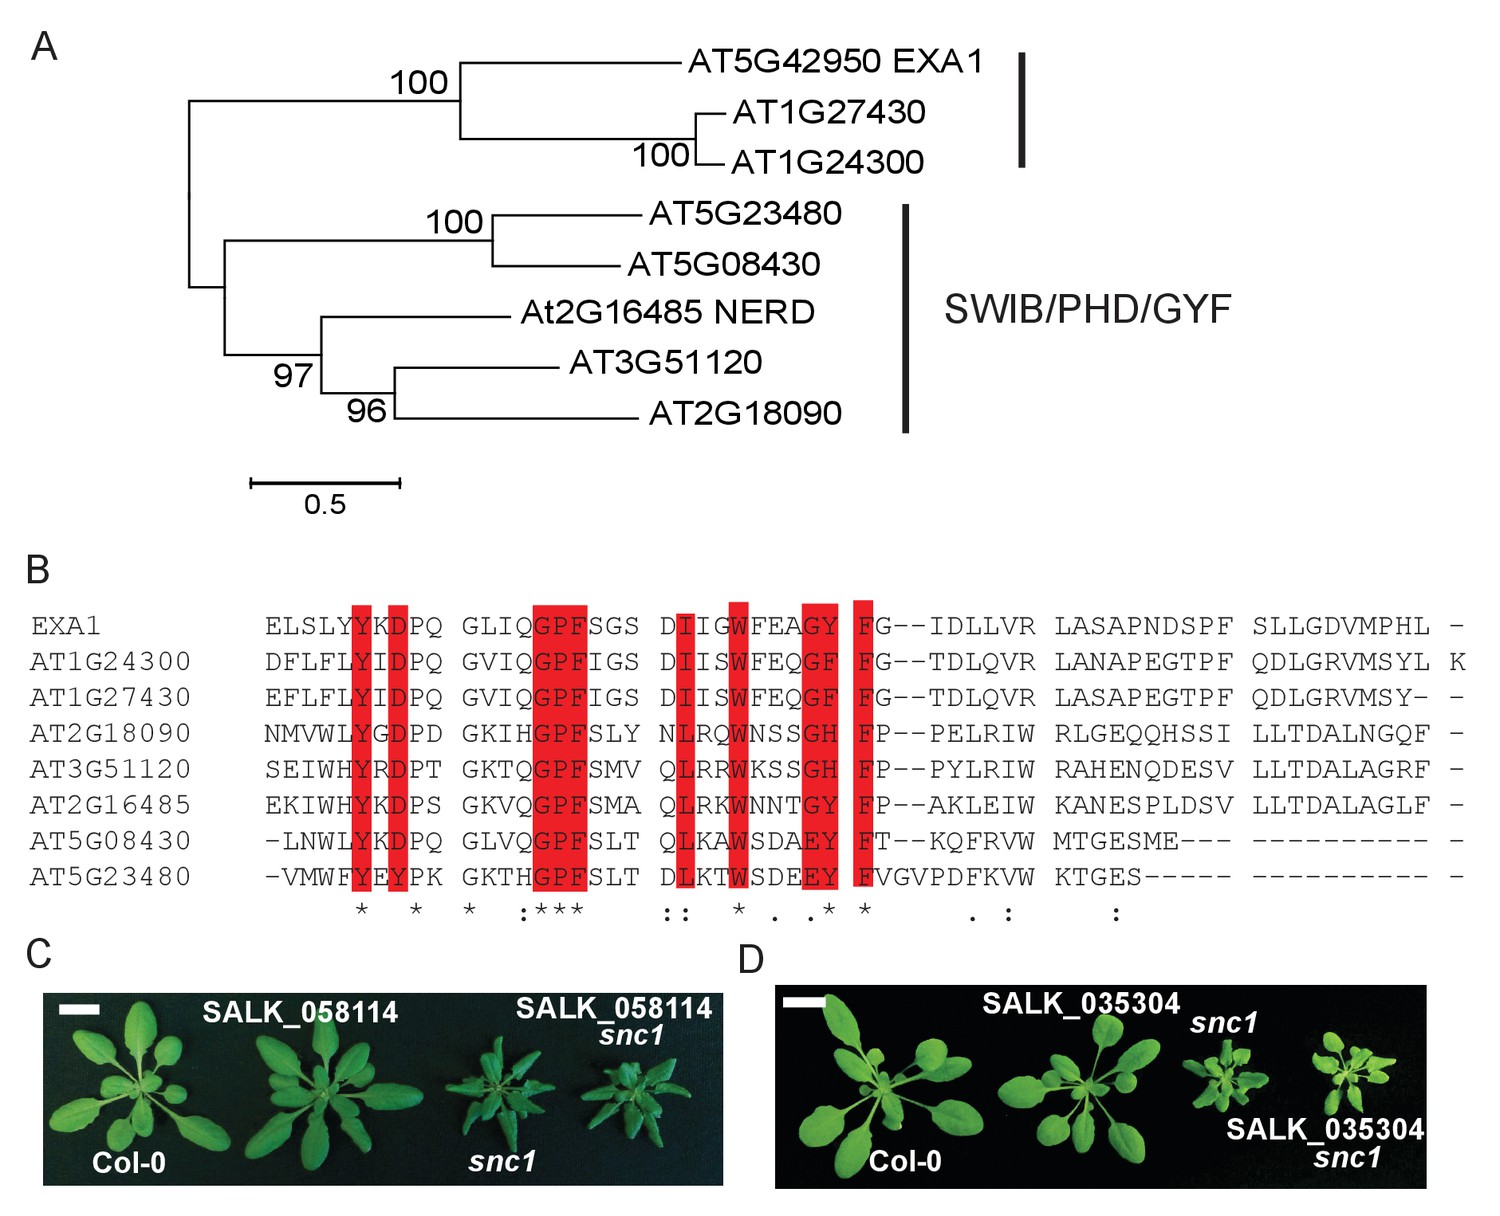
Sequence analysis of EXA1 and other GYF domain proteins in Arabidopsis.
(A) A phylogenetic tree of all eight GYF-containing proteins in Arabidopsis. (B) Protein alignment of all GYF domains of Arabidopsis GYF proteins. Residues that are characteristic of GYF domains are indicated in red. (C) Morphology of four-week-old plants of Col-0, SALK_058114, snc1 and SALK_058114 snc1 double mutant. Bar = 1 cm. (D) Morphology of four-week-old plants of Col-0, SALK_035304, snc1 and SALK_0353045 snc1 double mutant. Bar = 1 cm.
Figure 6
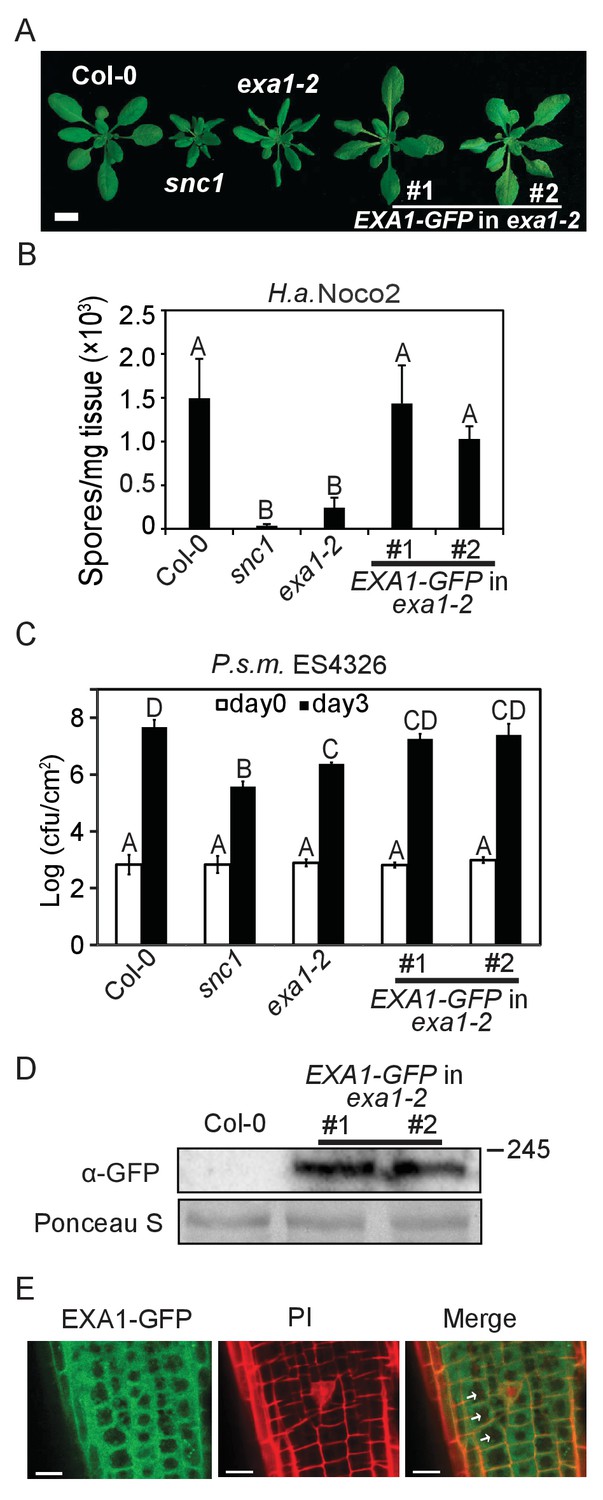
Subcellular localization of EXA1-GFP.
(A) Morphology of four-week-old plants of Col-0, snc1, exa1-2 and two independent lines of EXA1-GFP transformed into exa1-2. Bar = 1 cm. (B) Quantification of H.a. Noco2 sporulation on the indicated genotypes. One-way ANOVA was used to calculate the statistical significance among genotypes, which is indicated by different letters (p<0.01). Three independent experiments were carried out with similar results. Bars represent means ± SD (n = 4). (C) Growth of P.s.m. ES4326 on four-week-old leaves of the indicated genotypes at 0 and 3 dpi, with bacterial inoculum of OD600 = 0.001. One-way ANOVA was used to calculate the statistical significance among genotypes, which is indicated by different letters (p<0.01). Three independent experiments were carried out with similar results. Bars represent means ± SD (n = 4). (D) Immunoblot analysis of EXA1-GFP expression in two independent transgenic lines. Equal loading is shown by Ponceau S staining of a non-specific band. Molecular mass markers in kilodaltons are indicated on the right. (E) Confocal images of EXA1-GFP fluorescence in root cells of an exa1-2 transgenic line expressing EXA1-GFP under the control of its native promoter. Cell walls were stained using propidium iodide (PI). Arrows indicate cell nucleus. Merge means merged image between GFP and PI. Bar = 0.1 μm.
Figure 7

EXA1 negatively regulates SNC1 protein accumulation.
(A) SNC1 protein levels in four-week-old soil-grown Col-0, snc1, exa1-1, exa1-2 and exa1-1 snc1 plants. Equal loading is shown by Ponceau S staining of a non-specific band. The relative SNC1 band intensity is shown below (normalized to loading control, relative to Col-0). Molecular mass markers in kilodaltons are indicated on the right. (B) Quantification of the relative abundance of SNC1 in A. Three independent experiments were carried out with similar results. Bars represent means ± SD (n = 3). Multiple pairwise t-test was used to calculate the statistical significance among genotypes, which is indicated by different letters (p<0.01). (C) SNC1 transcript levels in four-week-old soil-grown plants of the indicated genotypes. Actin7 was used to normalize the transcript levels. Three independent experiments were carried out with similar results. Bars represent means ± SD (n = 3). One-way ANOVA was used to calculate the statistical significance among genotypes, which is indicated by different letters (p<0.01). (D) SNC1-HA and EXA1-FLAG levels in N. benthamiana leaves expressing the indicated proteins. Equal loading is shown by Ponceau S staining of a non-specific protein band. The relative SNC1-HA band intensity is shown below (normalized to loading control, relative to control infiltration). Three biological repeats were carried out with similar results. Molecular mass markers in kilodaltons are indicated on the right. The quantification of all repeats is shown on the right as a bar graph. Bars represent means ± SD (n = 3). Multiple pairwise t-test was used to calculate the statistical significance among genotypes, which is indicated by different letters (p<0.05). (E) Transcript levels of SNC1 in N. benthamiana leaves expressing the indicated proteins. Hygromycin resistance gene was used to normalize the transcript levels. Three biological repeats were carried out with similar results. Bars represent means ± SD (n = 3). One-way ANOVA was used to calculate the statistical significance among genotypes, which is indicated by different letters (p<0.01). (F) Morphology of four-week-old plants of Col-0, snc1, and two independent 35S::EXA1-FLAG transgenic lines in snc1 background (T1-4 and T1-2). Bar = 1 cm. (G) SNC1 transcript levels in four-week-old soil-grown plants of the indicated genotypes. Actin7 was used to normalize the transcript levels. Two independent experiments were carried out with similar results. Bars represent means ± SD (n = 3). One-way ANOVA was used to calculate the statistical significance among genotypes, which is indicated by different letters (p<0.01). (H) SNC1 protein levels in four-week-old plants of the indicated genotypes. Equal loading is shown by Ponceau S staining of a non-specific band. The relative SNC1 band intensity is shown below (normalized to loading control, relative to Col-0). Molecular mass markers in kilodaltons are indicated on the left. (I) Quantification of the relative abundance of the SNC1 in H. Two independent experiments were carried out with similar results. Bars represent means ± SD (n = 2). Multiple pairwise t-test was used to calculate the statistical significance among genotypes, which is indicated by different letters (p<0.05).
Figure 8

The autoimmunity of exa1-1 partially depends on SNC1 and EDS1.
(A) Morphology of four-week-old plants of the indicated genotypes. Bar = 1 cm. (B) Fresh weights of plants of A. One-way ANOVA was used to calculate the statistical significance, which is indicated by different letters (p<0.01). Bars represent means ± SD (n = 8). (C) Quantification of H.a. Noco2 sporulation on the indicated genotypes. One-way ANOVA was used to calculate the statistical significance, which is indicated by different letters (p<0.05). Two independent experiments were carried out with similar results. Bars represent means ± SD (n = 3).
Figure 9 with 2 supplements

EXA1 affects the accumulation of NLR proteins RPS4, RPM1 and RPS2.
(A–C) Immunoblot analysis of protein levels of RPS4-HA (A), RPM1-myc (B), RPS2-HA (C) in exa1-1. Equal loading is shown by Ponceau S staining of a non-specific band. Numbers underneath indicate the relative intensity of bands of RPS4-HA (A), RPM1-myc (B), and RPS2-HA(C) to a nonspecific band in Ponceau S staining. Molecular mass markers in kilodaltons are indicated on the right. The quantification of the bands is shown blow as a bar graph. Bars represent means ± SD (n = 3). One-way ANOVA was used to calculate the statistical significance among genotypes, which is indicated by different letters (p<0.01). (D–F) Transcript levels of NLR genes in four-week-old soil-grown plants of the indicated genotypes. Actin7 was used to normalize the transcript levels. Two independent experiments were carried out with similar results. Bars represent means ± SD (n = 2). One-way ANOVA was used to calculate the statistical significance among genotypes, which is indicated by different letters (p<0.01). (G–I) Bacterial growth of avirulent pathogens Pst DC3000 AvrRps4 (G), Pst DC3000 AvrRpm1 (H) and Pst DC3000 AvrRpt2 (I) in Col-0 and two exa1 alleles at 0 and 3 dpi with bacterial inoculum of OD600 = 0.001. One-way ANOVA was used to calculate the statistical significance among genotypes, which is indicated by different letters (p<0.05). Three independent experiments were carried out with similar results. Bars represent means ± SD (n = 4).
Figure 9—figure supplement 1
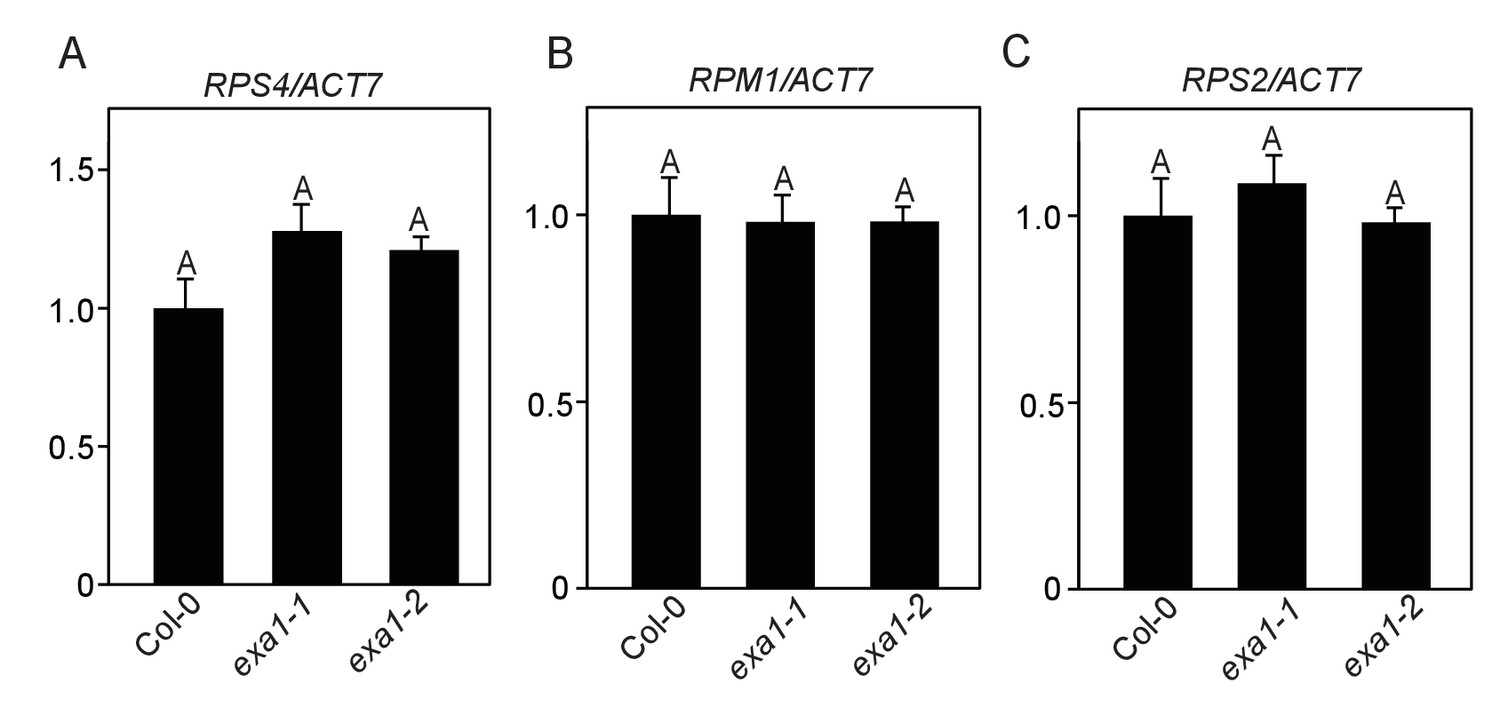
EXA1 does not affect the transcript levels of NLR genes RPS4, RPM1 and RPS2.
(A–C) Transcript levels of RPS4 (A), RPM1 (B) and RPS2 (C) in four-week-old soil-grown Col-0, exa1-1 and exa1-2 plants. Actin7 was used to normalize the transcript levels. Two independent experiments were carried out with similar results. Bars represent means ± SD (n = 2).One-way ANOVA was used to calculate the statistical significance among genotypes, which is indicated by different letters (p<0.01).
Figure 9—figure supplement 2
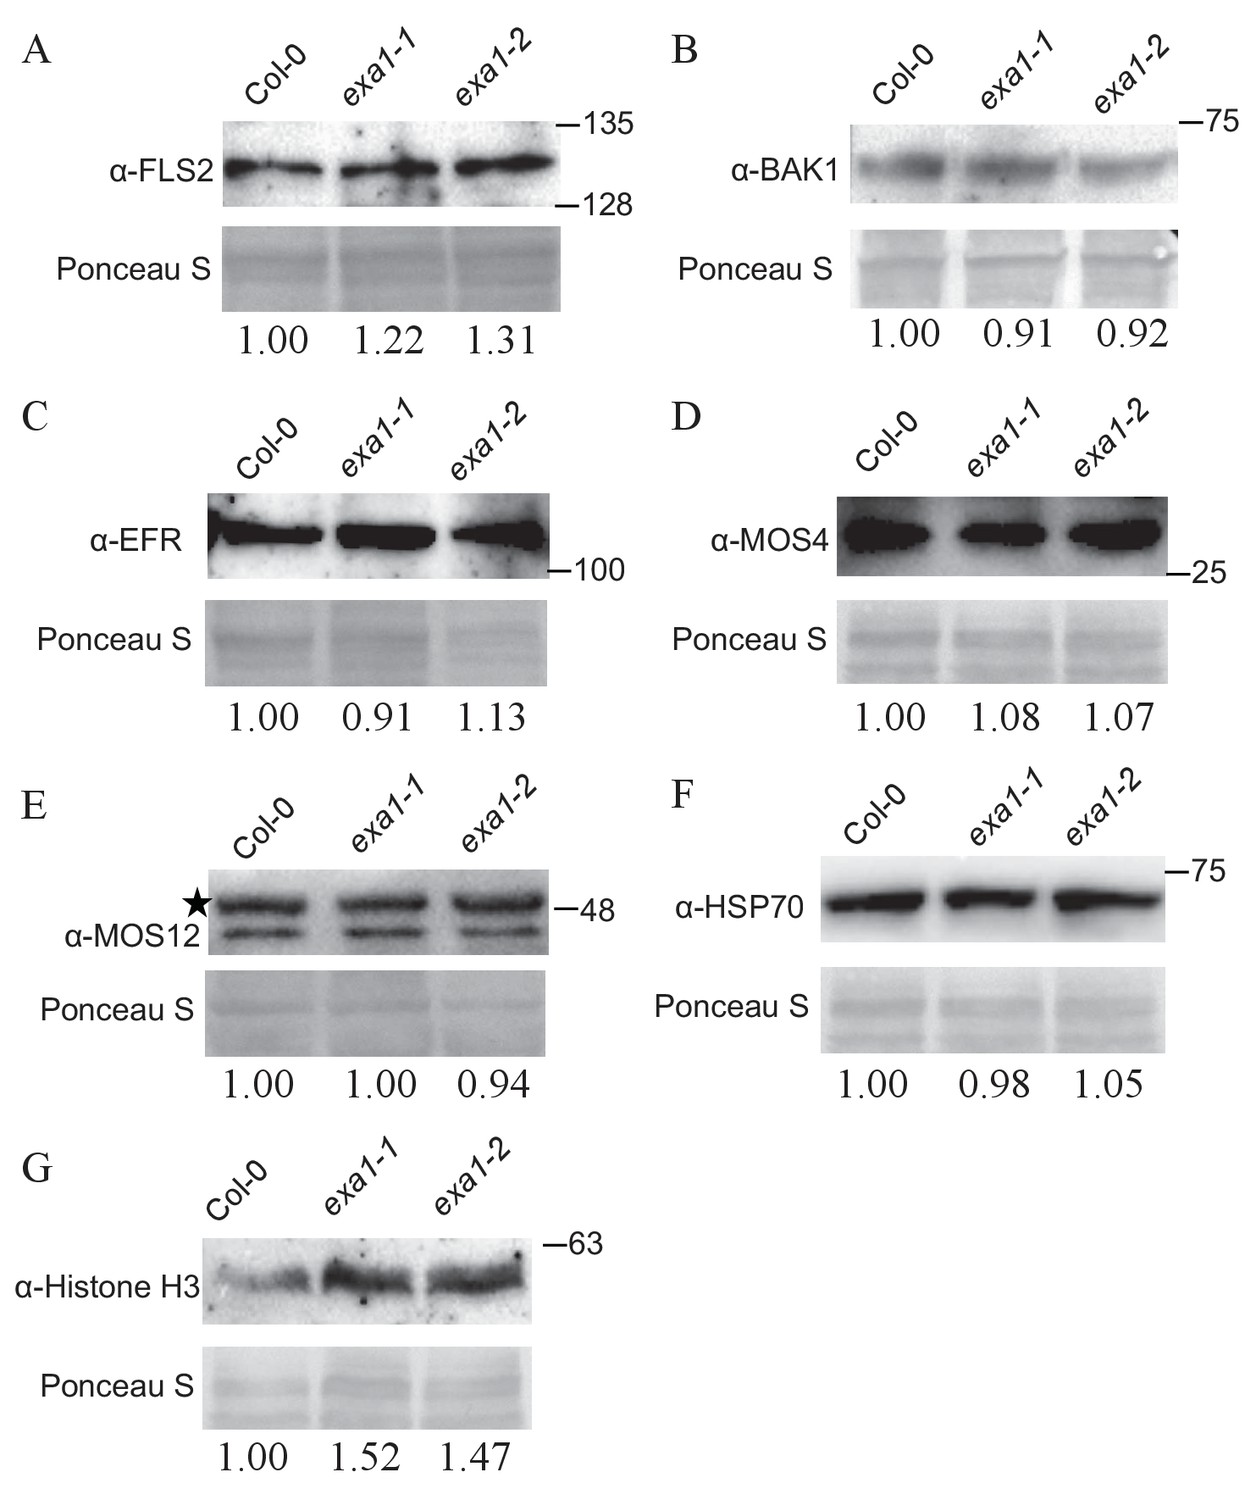
Protein accumulation of non-NLR proteins in exa1 mutants.
Immunoblot analysis of protein levels of FLS2 (A), BAK1 (B), EFR (C), MOS4 (D), MOS12 (E), HSP70 (F) and Histone H3 (G) in four-week-old soil-grown Col-0, exa1-1 and exa1-2 plants. Equal loading is shown by Ponceau S staining of a non-specific band. At least two independent experiments were carried out with similar results. Star indicates non-specific band. The relative band intensity is shown below (normalized to loading control, relative to Col-0). Molecular mass markers in kilodaltons are indicated on the right.
Figure 10
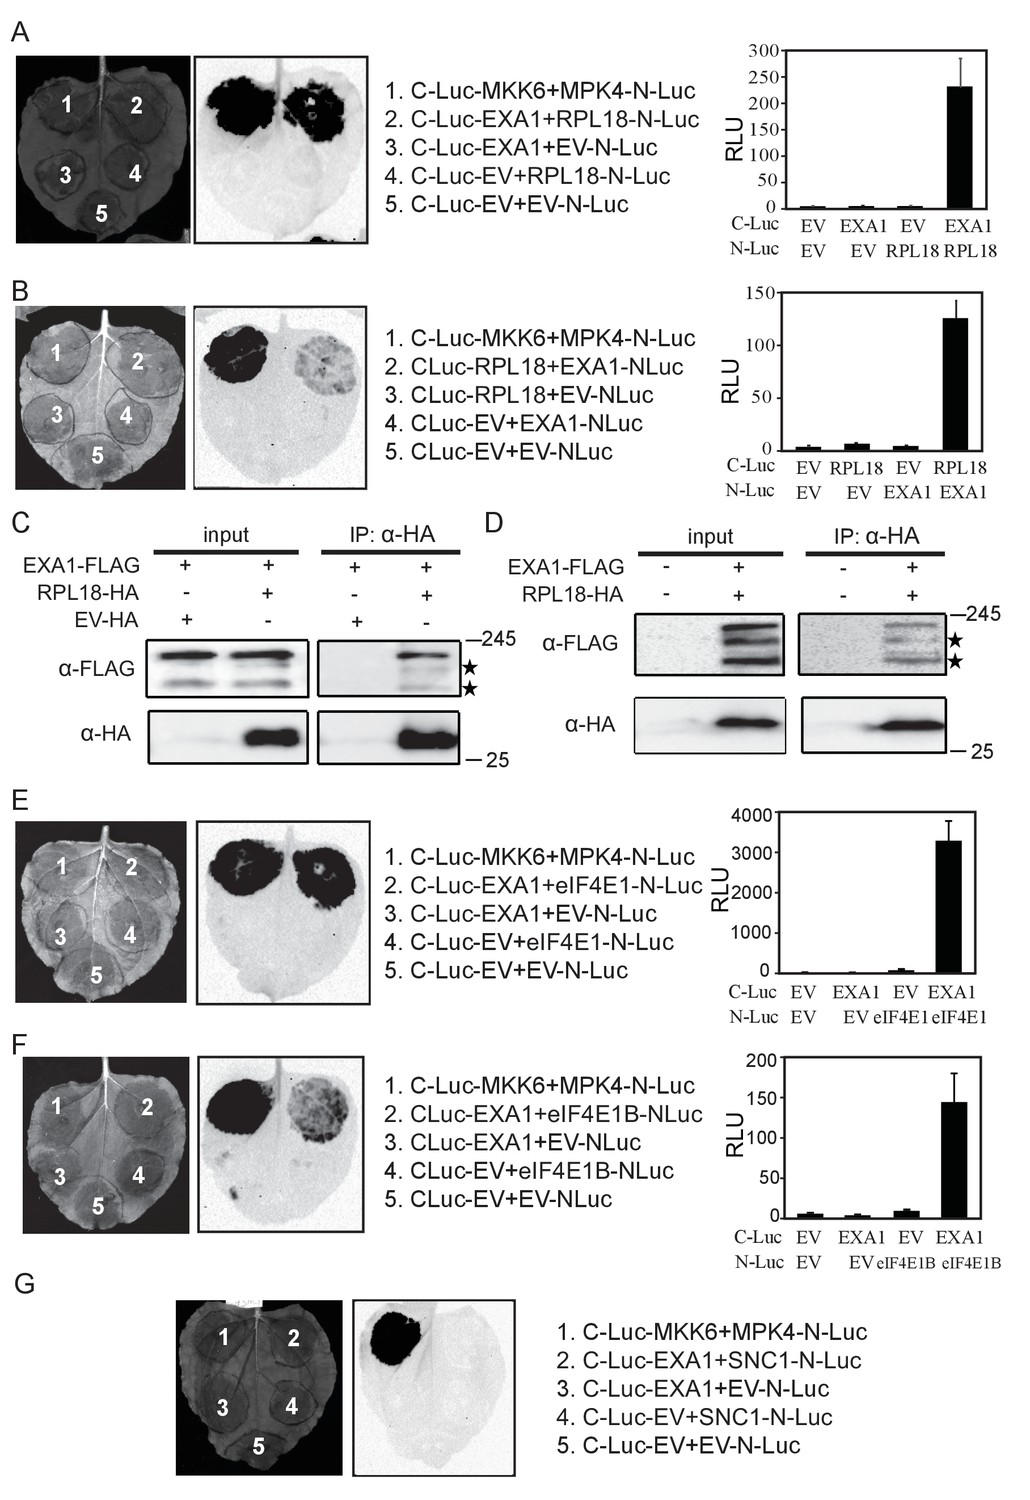
EXA1 interacts with ribosomal protein RPL18 and two eIF4E initiation factors eIF4E1 and eIF4E1B.
(A) Interaction of EXA1 and RPL18 as tested by split-luciferase complementation assay in N. benthamiana. EXA1 was fused with C-Luc. RPL18 was fused with N-Luc. The empty N-Luc and C-Luc constructs were used as negative controls. The C-Luc-MKK6 and MPK4-N-Luc constructs were used as positive control. Three biological repeats were carried out with similar results. The relative luminescence units of all repeats are shown on the right as a bar graph. Bars represent means ± SD (n = 12). (B) Reciprocal split-luciferase complementation assay between EXA1 and RPL18. (C) Immunoprecipitation of EXA1-FLAG by RPL18-HA in N. benthamiana. Stars indicate EXA1-FLAG degration products. (D) Immunoprecipitation of EXA1-FLAG by RPL18-HA in Arabidopsis. Stars indicate EXA1-FLAG degration products. (E) Interaction of EXA1 and eIF4E as tested by split-luciferase complementation assay in N. benthamiana. Three biological repeats were carried out with similar results. The relative luminescence units of all repeats are shown on the right as a bar graph. Bars represent means ± SD (n = 12). (F) Interaction of EXA1 and eIF4E1B as tested by split-luciferase complementation assay in N. benthamiana. Three biological repeats were carried out with similar results. The relative luminescence units of all repeats are shown on the right as a bar graph. Bars represent means ± SD (n = 12). (G) Interaction of EXA1 and SNC1 as tested by split-luciferase complementation assay in N. benthamiana.
Additional files
-
Supplementary file 1
Summary of primers used in this study
- https://doi.org/10.7554/eLife.23684.014
Download links
A two-part list of links to download the article, or parts of the article, in various formats.
Downloads (link to download the article as PDF)
Open citations (links to open the citations from this article in various online reference manager services)
Cite this article (links to download the citations from this article in formats compatible with various reference manager tools)
Regulation of plant immune receptor accumulation through translational repression by a glycine-tyrosine-phenylalanine (GYF) domain protein
eLife 6:e23684.
https://doi.org/10.7554/eLife.23684


