Mechanism of ribosome rescue by ArfA and RF2
- University of Massachusetts Medical School, United States
- Howard Hughes Medical Institute, United States
- Florida State University, United States
Figures
Figure 1 with 5 supplements
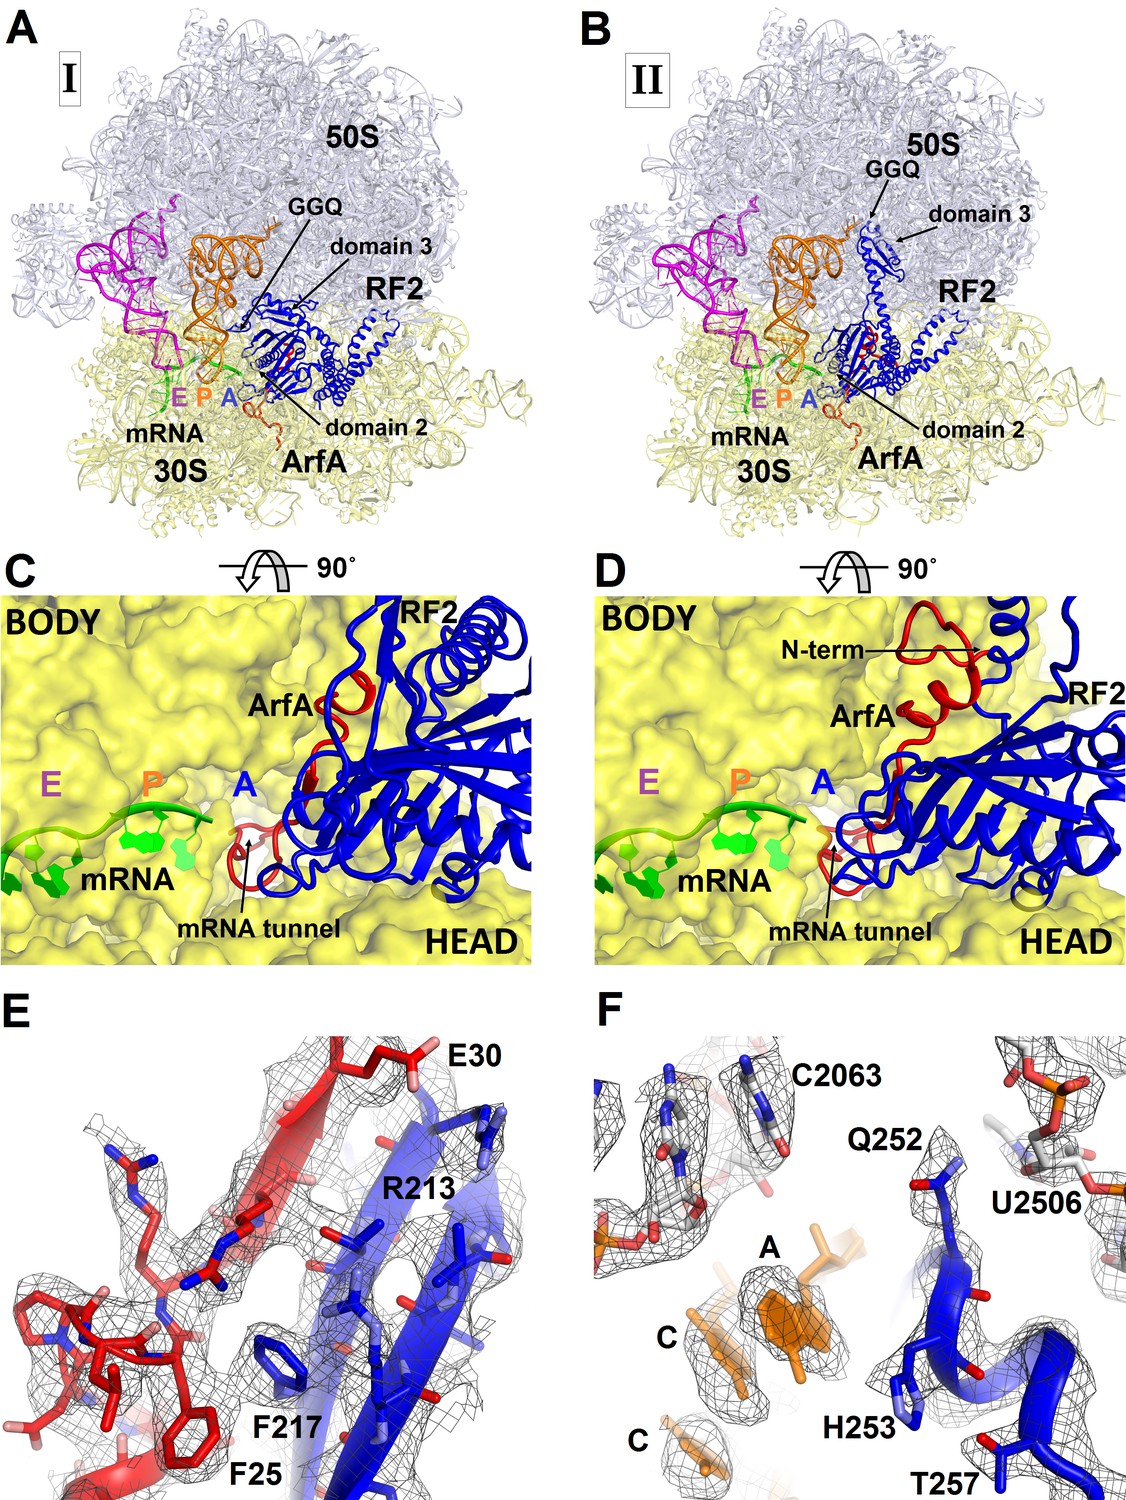
3.2 Å resolution cryo-EM structures of E. coli 70S ribosome bound with ArfA and release factor RF2.
(A) Structure I with RF2 in a compact conformation; (B) Structure II with RF2 in an extended conformation. Domains 2 and 3 and the GGQ motif of RF2 are labeled. (C) and (D) A close-up view down the mRNA tunnel, showing RF2 and ArfA in the A site of Structure I (C) and Structure II (D). The body and head domains of the 30S subunit are labeled. (E) Extended β-sheet formed by ArfA (red model) and RF2 (blue model). Cryo-EM map (gray mesh) is shown for Structure II at σ = 2.5. (F) Peptidyl-transferase center bound with the 250GGQ252 motif of RF2 in Structure II. Cryo-EM map (gray mesh) is shown at σ = 2.5 for RF2 and at σ = 4.5 for 23S ribosomal RNA and the 74CCA76 end of the P-site tRNA. The maps were sharpened by applying the B-factor of −120 Å2. Additional views of cryo-EM density are available in Figure 1—figure supplements 1–5. In all panels, the large 50S ribosomal subunit is shown in gray/light-blue; the small 30S subunit in yellow; mRNA in green; E-site tRNA in magenta; P-site tRNA in orange; ArfA in red and RF2 in blue.
Figure 1—figure supplement 1
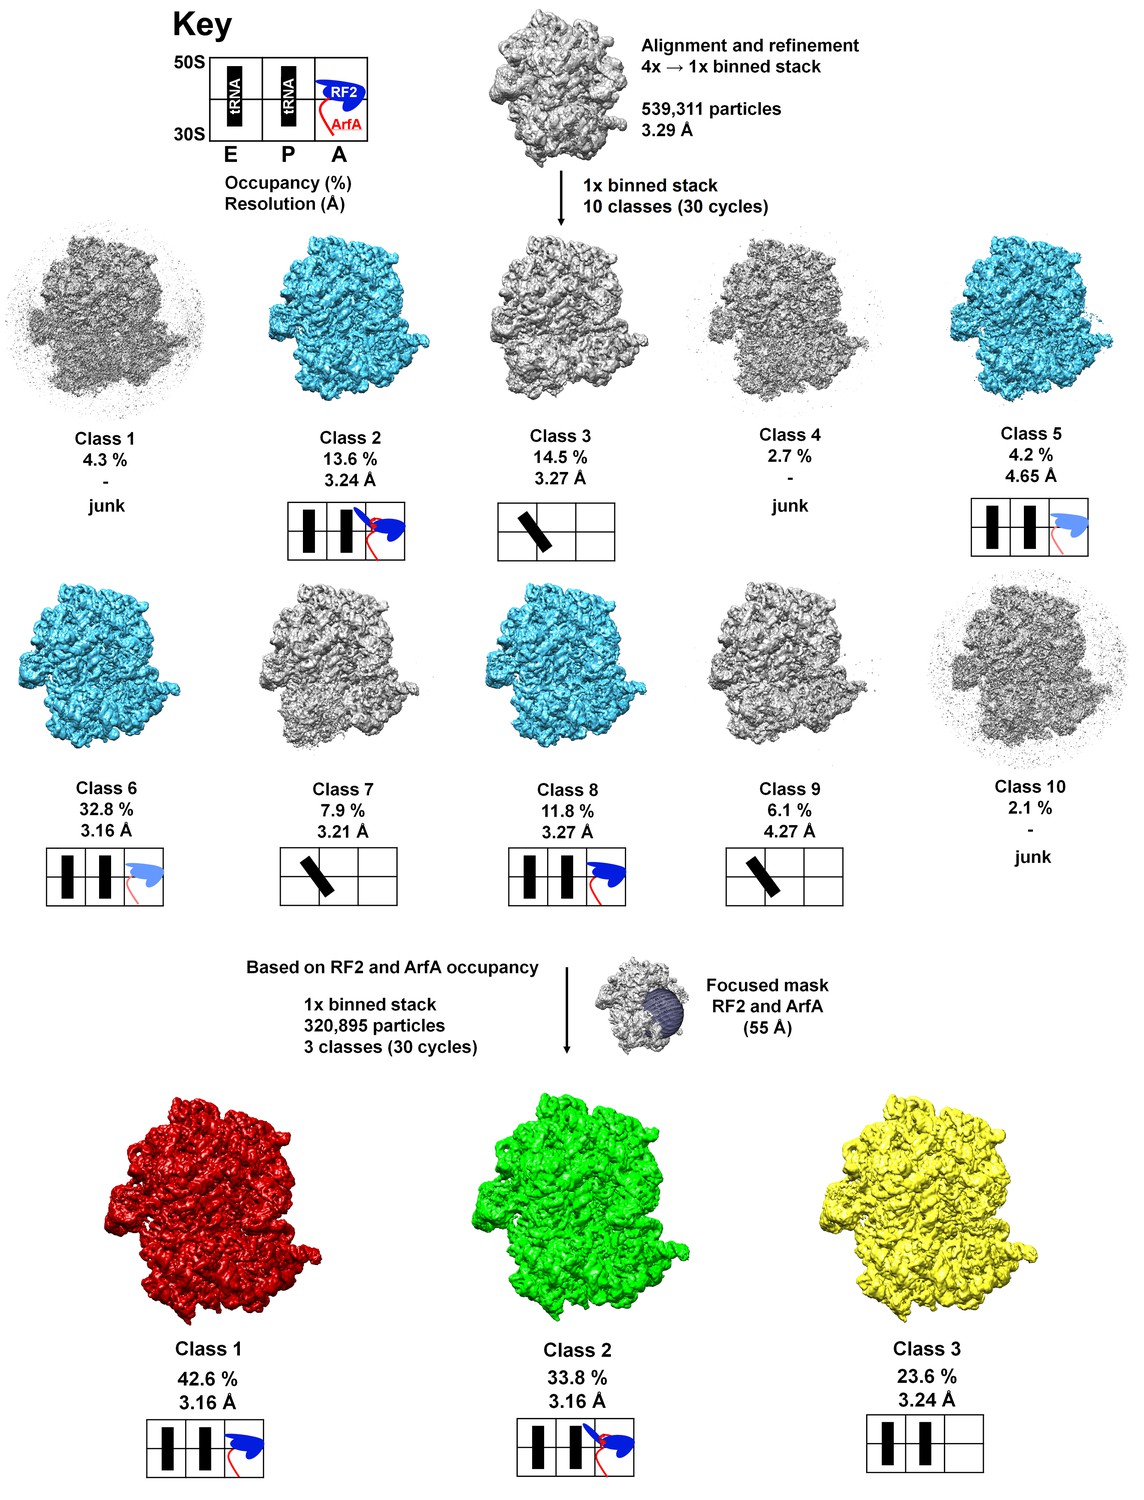
Schematic of cryo-EM refinement and classification.
All particles (4x stack) were initially aligned to a single model. 3D classification (10 classes) using the unbinned (1x binned) stack was used to identify the particles containing ArfA and RF2. Subsequent 3D classification using a spherical mask around the A site yielded three ‘purified’ classes representing Structure I, Structure II and the ribosome with a vacant A site. Additional sub-classifications (including up to eight classes) did not yield additional structures (e.g. ArfA-, RF2- or ArfA•RF2-containing classes). Light blue color for RF2 means partial occupancy of RF2. Junk classes are low-resolution classes with poorly resolved structural features that likely originate from misaligned, incomplete or damaged ribosomes.
Figure 1—figure supplement 2
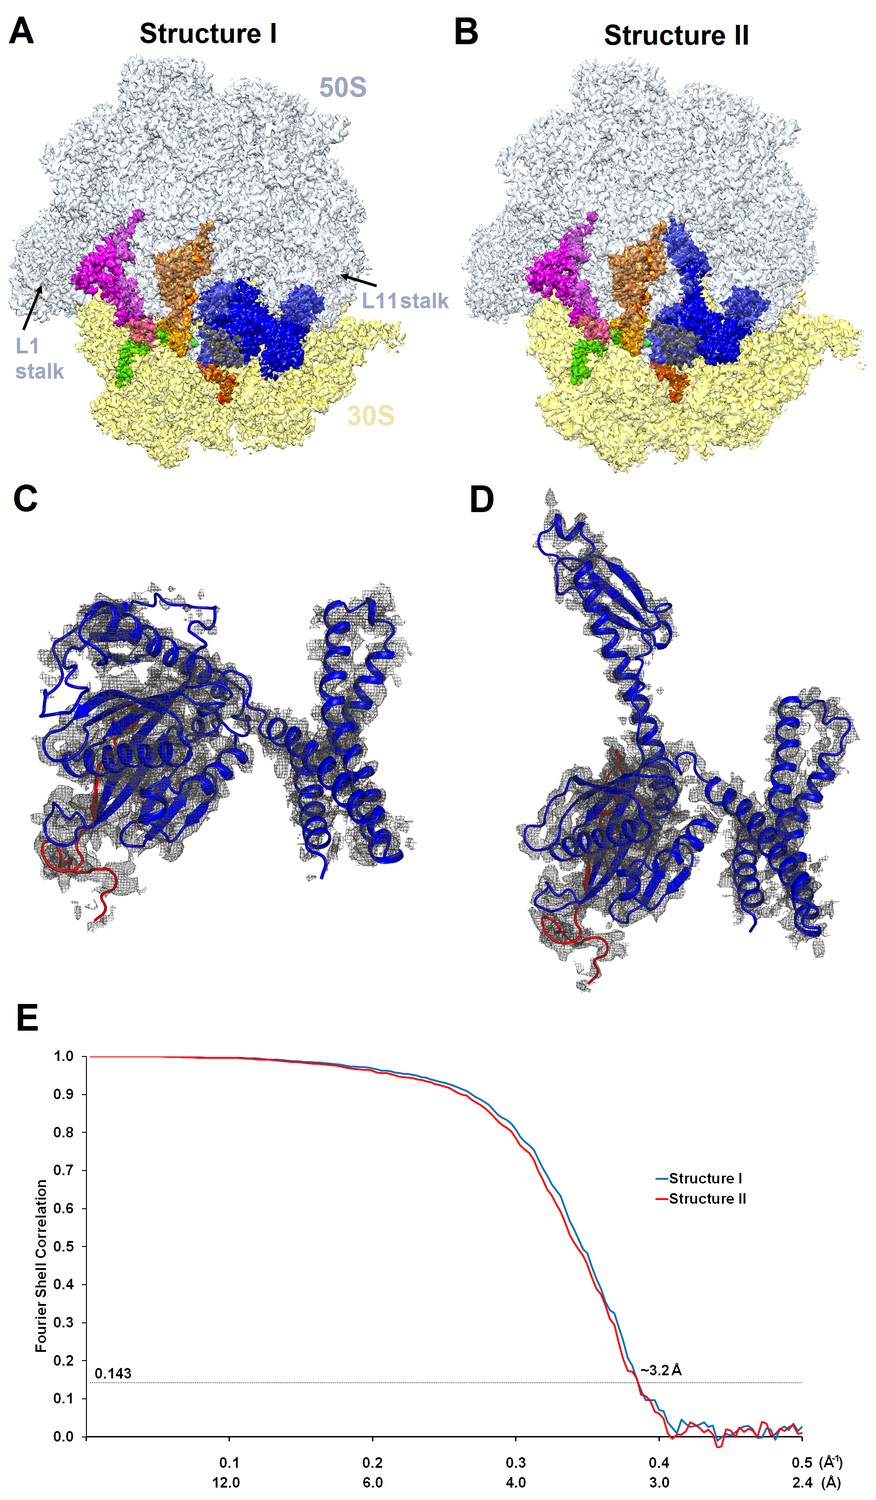
Cryo-EM densities of Structures I and II.
(A) and (B) Cryo-EM maps of 70S•ArfA•RF2 complexes were segmented and colored as in Figure 1. (C) and (D) Cryo-EM density (gray) for ArfA (red model) and RF2 (blue model) in Structures I and II. The maps were sharpened by applying the B-factor of −120 Å2. (E) Fourier shell correlation as a function of resolution for Structures I and II.
Figure 1—figure supplement 3
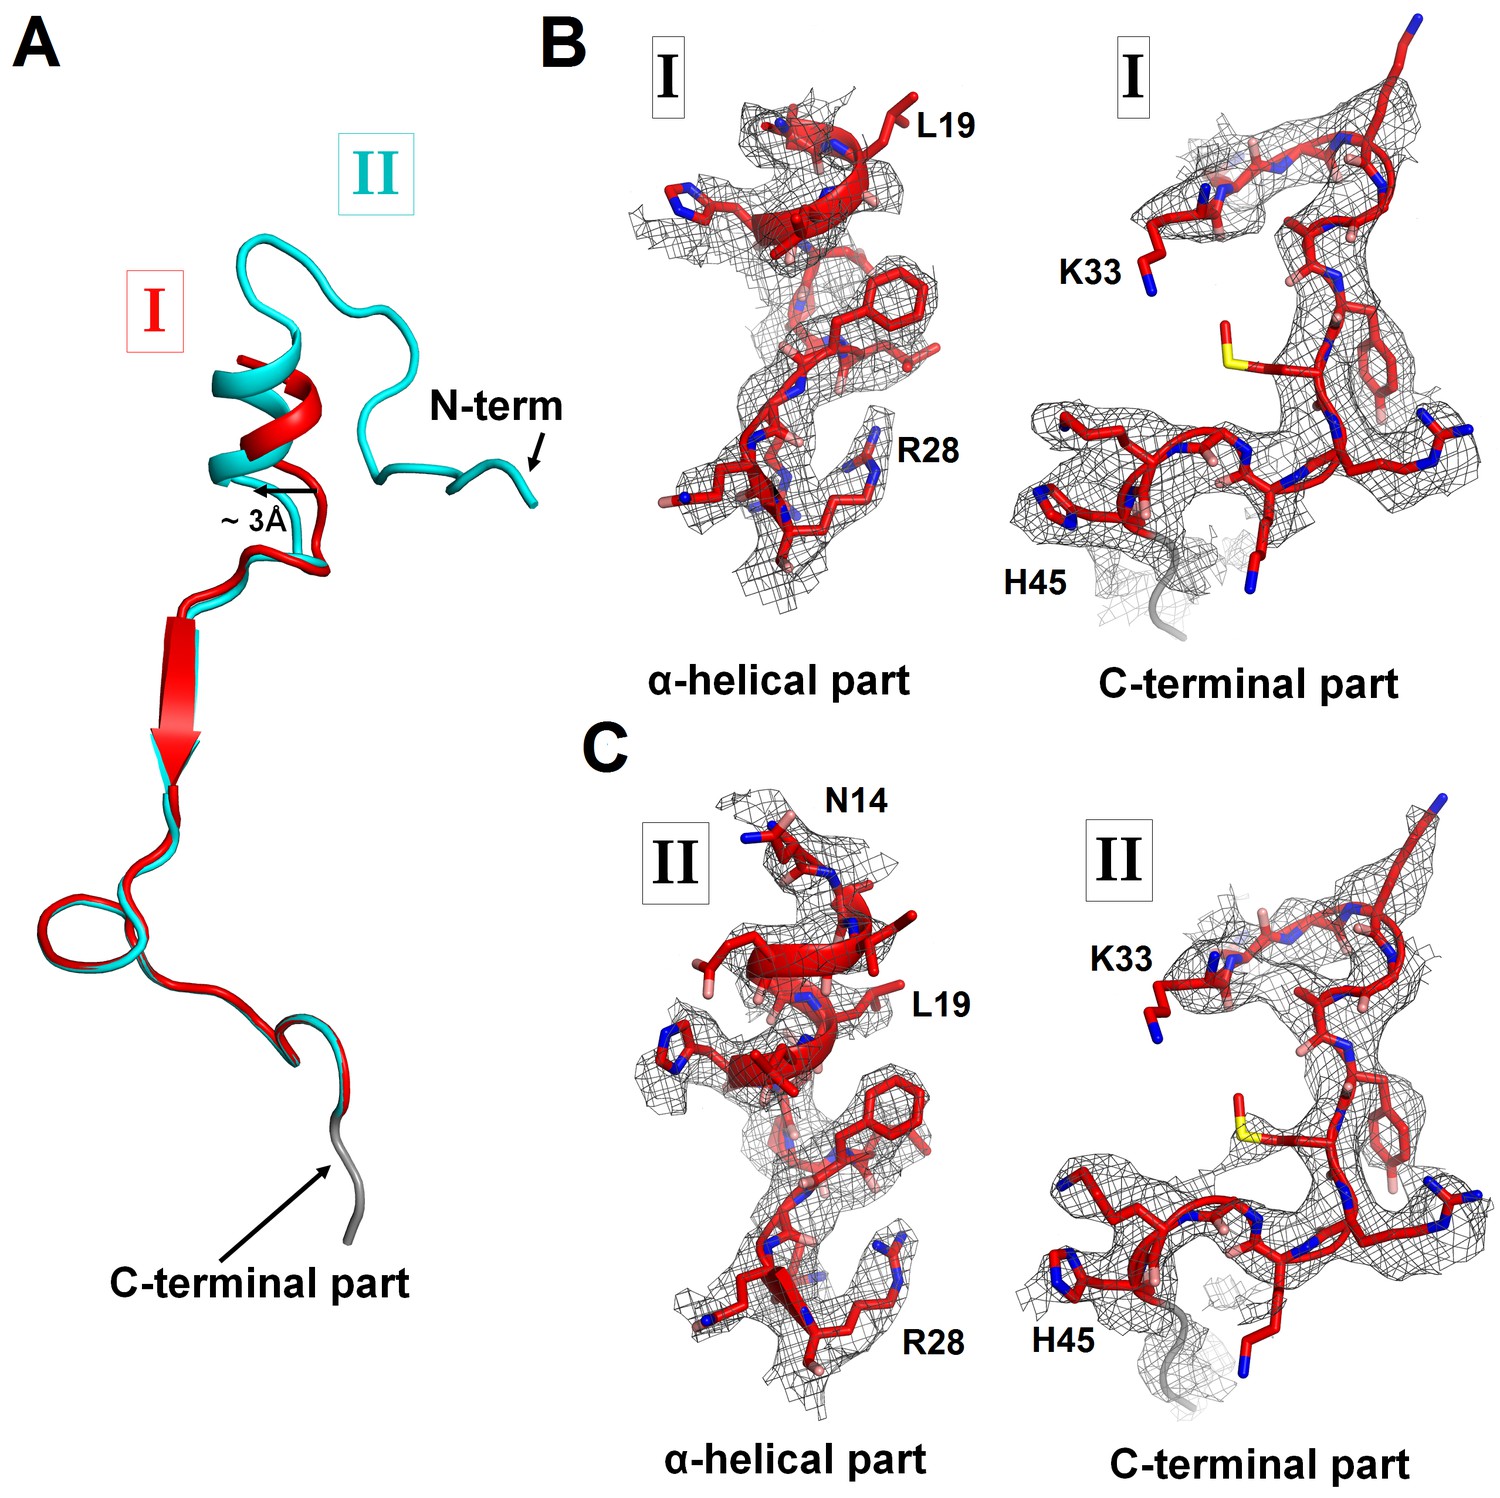
Cryo-EM densities corresponding to N- and C-terminal regions of ArfA in Structures I and II.
(A) Superposition of ArfA in Structures I (red) and Structure II (cyan), achieved by structural alignment of the 16S ribosomal RNA. Conformations of the N-terminal region of ArfA relative to the 30S subunit differ between Structures I and II; the difference in the position of the α-helical part is shown with an arrow. (B) Partially resolved α-helical part at the N-terminus and the C-terminal part of ArfA in Structure I (red model) defined by density (gray mesh) at σ = 2.5. (C) Well-resolved α-helical part at the N-terminus and the C-terminal part of ArfA in Structure II (red model) defined by density (gray mesh) at σ = 2.5. The maps were sharpened by applying the B-factor of −120 Å2. A poorly defined region (with the backbone traceable at low σ = 1.0) of the C-terminal structure is colored in gray.
Figure 1—figure supplement 4

Cryo-EM densities corresponding to functional regions of RF2 in Structures I and II.
(A) Compact conformation of RF2 (blue model) defined by density (gray mesh) at σ = 2.5 (except for the map around the switch loop shown at σ = 1.5). Close-up views are shown in boxes for the SPF and GGQ motifs and the switch loop (the orientations differ from that in the main panel). Gray regions are poorly defined in the map, in that the backbone is only traceable at low σ of 1.0 or lower. (B) Extended conformation of RF2 defined by density at σ = 2.5. Close-up views are shown in boxes for the SPF and GGQ motifs and the switch loop. The maps were sharpened by applying the B-factor of −120 Å2. Side chains of most residues are omitted for clarity.
Figure 1—figure supplement 5
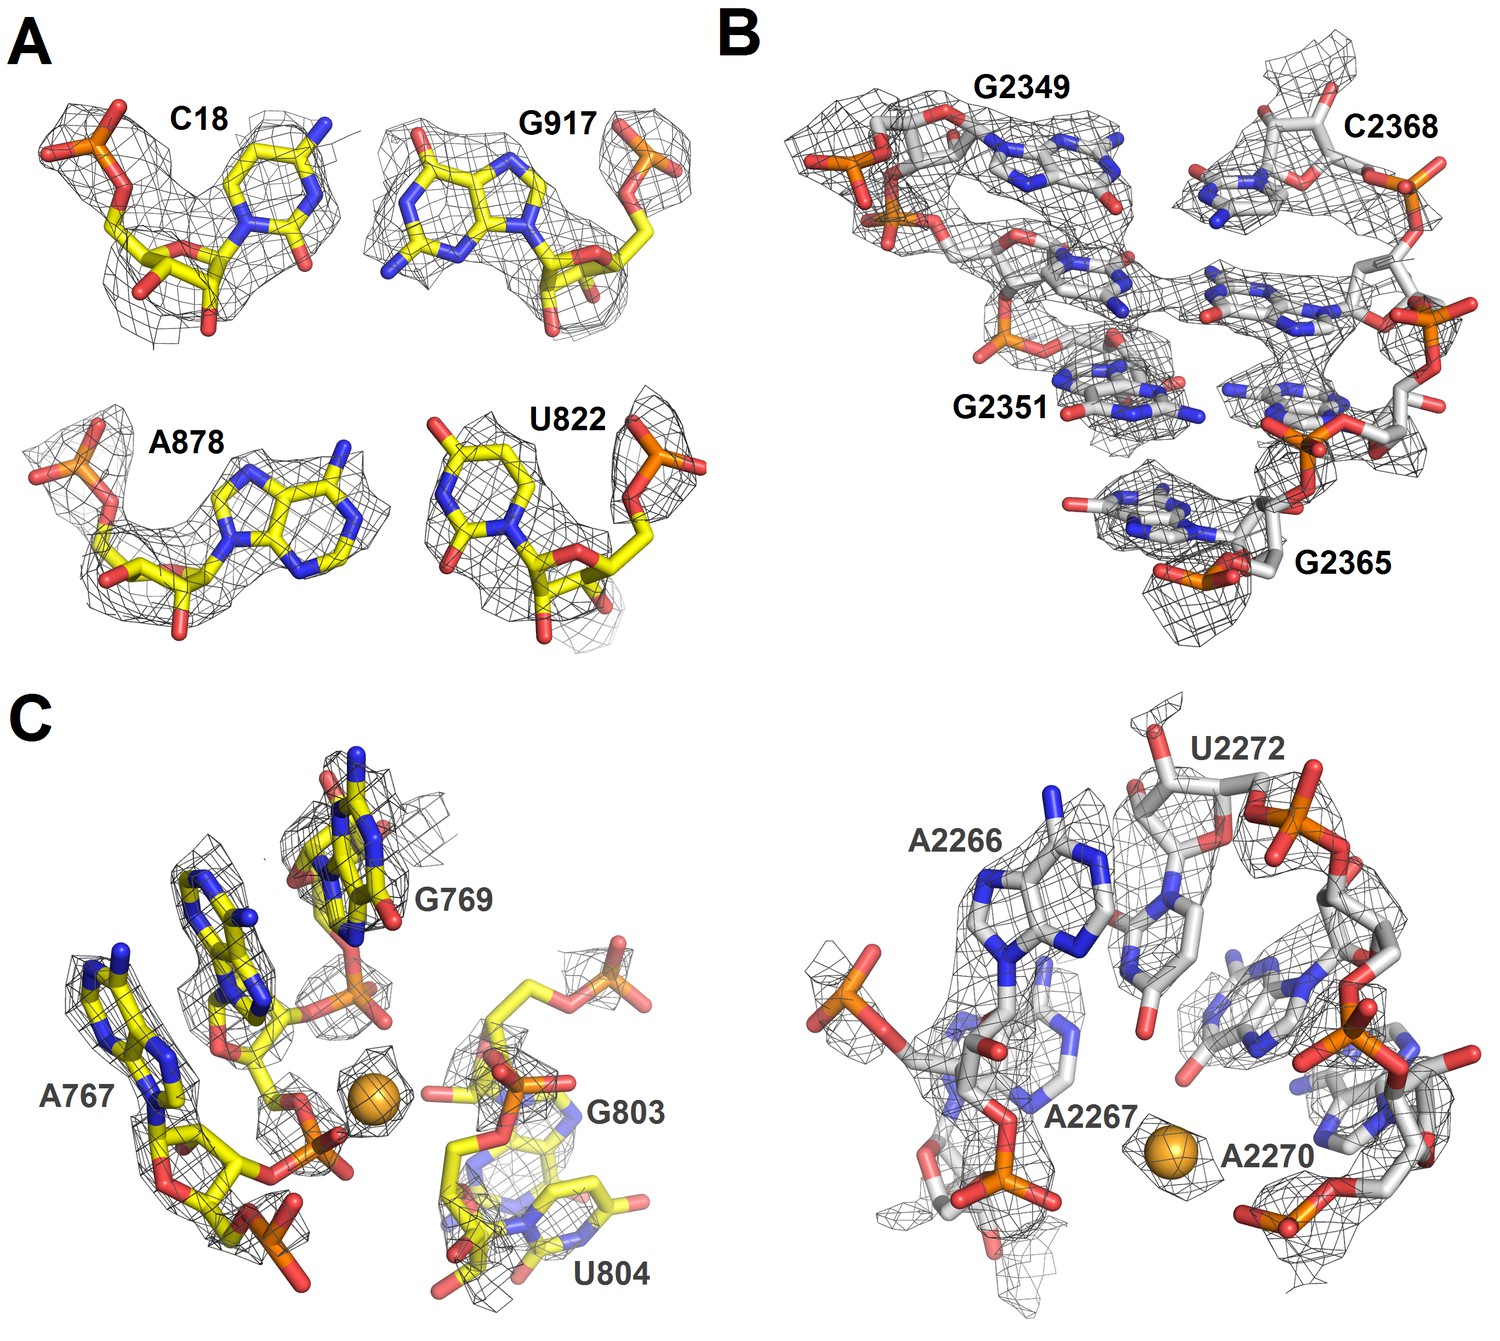
Cryo-EM densities of ribosomal RNA in Structure II.
(A) Density (gray mesh) at σ = 4.5 for 16S rRNA nucleotides forming base pairs. (B) Density (gray mesh) at σ = 4.5 for 23S rRNA (part of helix 86) (C) Densities (gray mesh) for a magnesium ion at σ = 4.5 (gold sphere) coordinated by 16S rRNA (yellow) at σ = 6.0 or 23S rRNA (gray) at σ = 6.0. The maps were sharpened by applying the B-factor of −150 Å2.
Figure 2 with 3 supplements
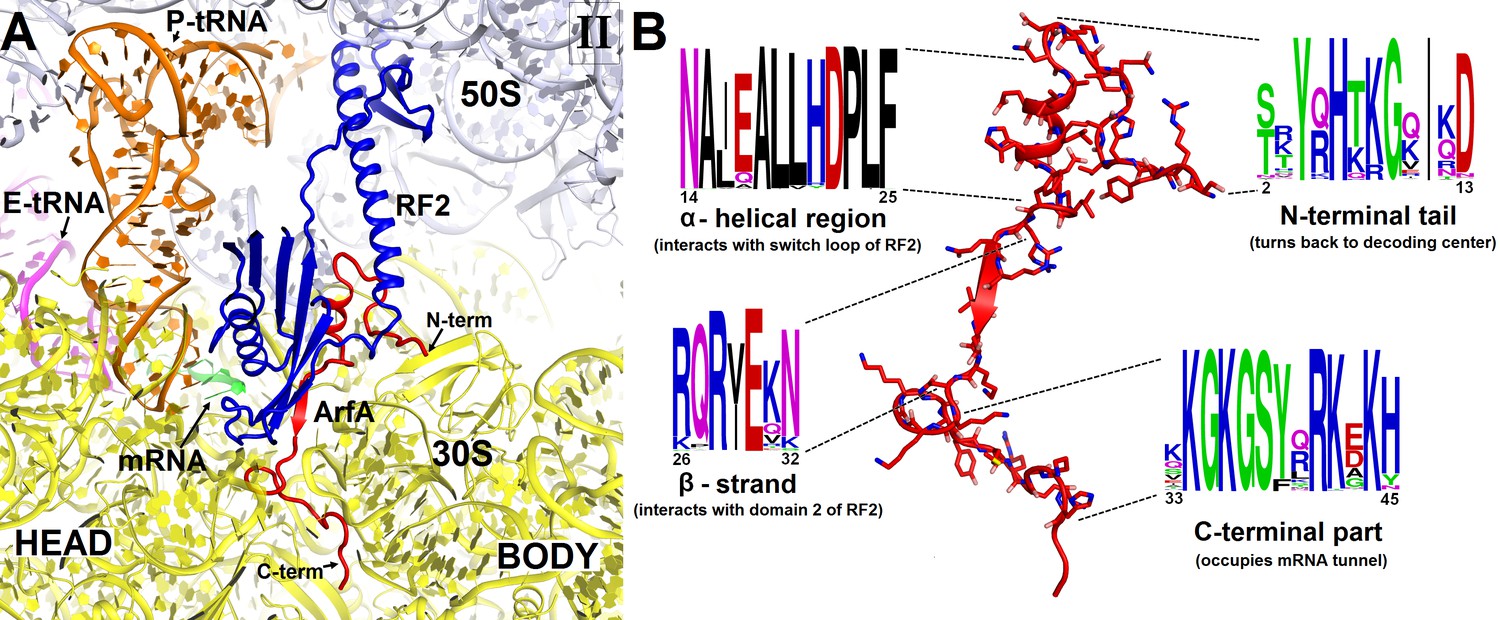
Structure and sequence of ArfA.
(A) Close-up view of the intersubunit space and mRNA tunnel occupied by ArfA in Structure II. The color-coding is the same as in Figure 1. The head and body domains of the 30S subunit are labeled. (B) Sequence and structure of ArfA, shown in the same orientation as in (A). Sequence conservation among ~400 non-redundant bacterial ArfA homologs is shown for four ArfA regions (see Materials and methods). The color code for amino acid type in the sequence logo is the following: green – polar, purple – neutral, blue – basic, red – acidic and black – hydrophobic residues.
Figure 2—figure supplement 1
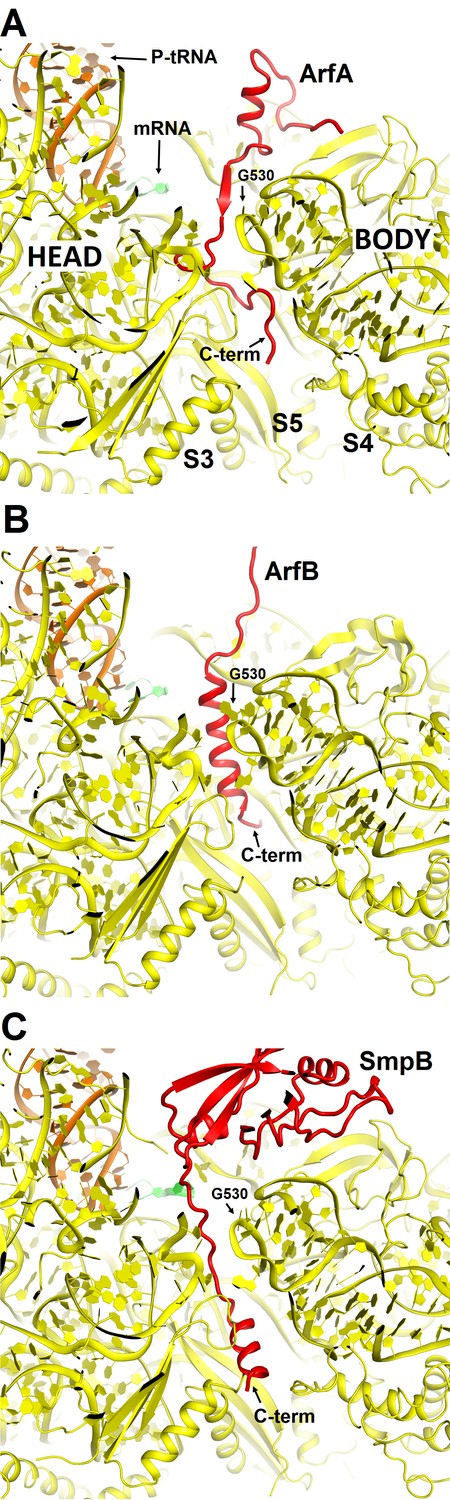
Comparison of mRNA tunnel occupancies by ribosome rescue proteins ArfA, ArfB and SmpB (shown in red).
(A) Structure of ArfA and interactions with the 30S subunit in Structure II (this work), (B) Structure of ArfB and interactions with the 30S subunit in the crystal structure of the 70S-bound ArfB (PDB 4V95) (C) Structure of SmpB and interactions with the 30S subunit in the crystal structure of the 70S-bound SmpB and tmRNA mimic (PDB 4V8Q). In all panels, the 30S subunit is shown in yellow, P-site tRNA in orange and mRNA in green. The entrance to the mRNA tunnel (at the solvent interface of the 30S subunit) is formed by proteins S3, S4 and S5, which are labeled in panel A. G530 is labeled in each panel to show the location of the decoding center.
Figure 2—figure supplement 2
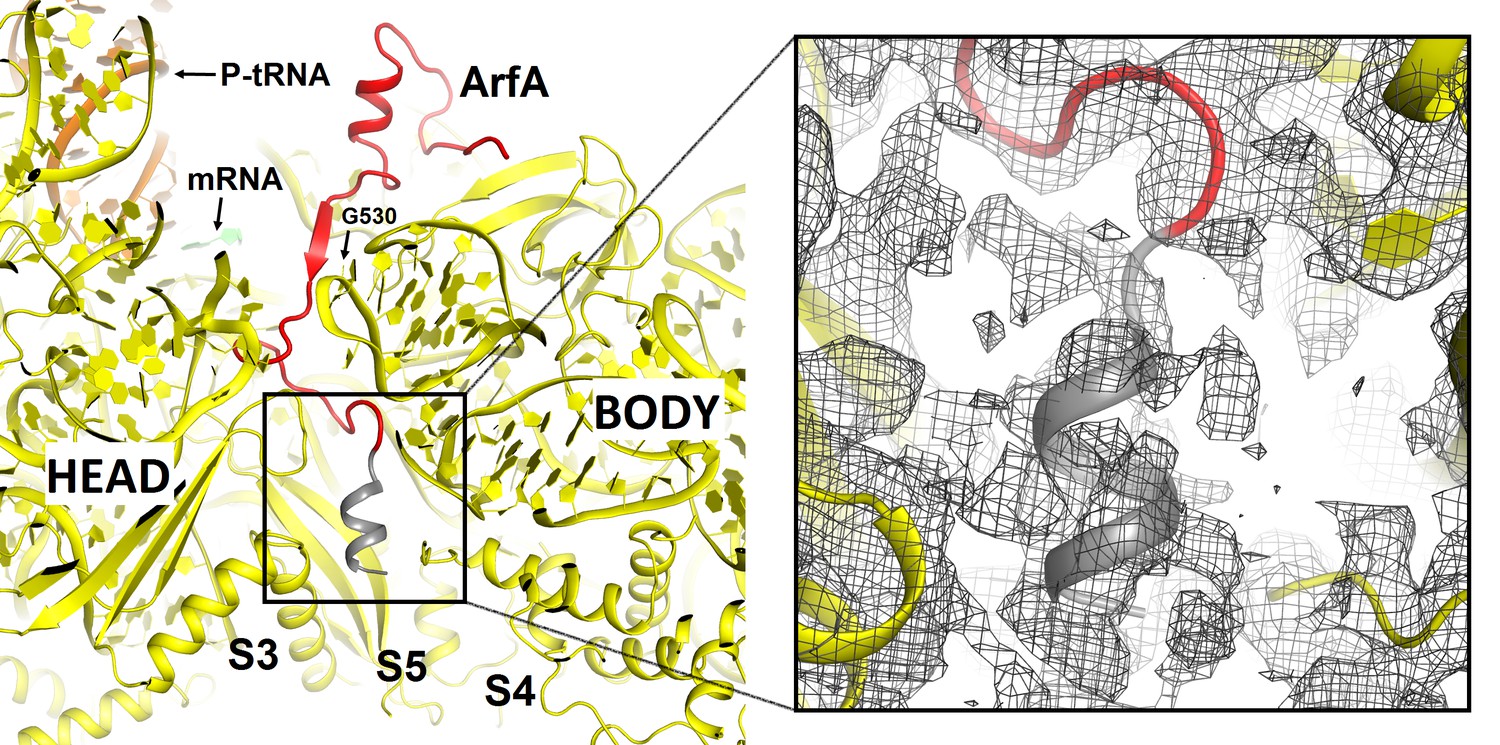
Putative α-helical structure of the C-terminal region of ArfA at the entry of the mRNA tunnel (near protein S5) in Structures I and II (Structure II is shown).
The view is similar to that shown in Figure 2—figure supplement 1A. The α-helix at the C-terminal tail of ArfA is predicted by ROBETTA and I-TASSER. The putative structural model (aa ~47–55) is colored in gray and defined by density (gray mesh) at σ = 2.0. The map was sharpened by applying the B-factor of −120 Å2. The 30S subunit is shown in yellow; the well-ordered part of ArfA (up to aa 46) is shown in red.
Figure 2—figure supplement 3
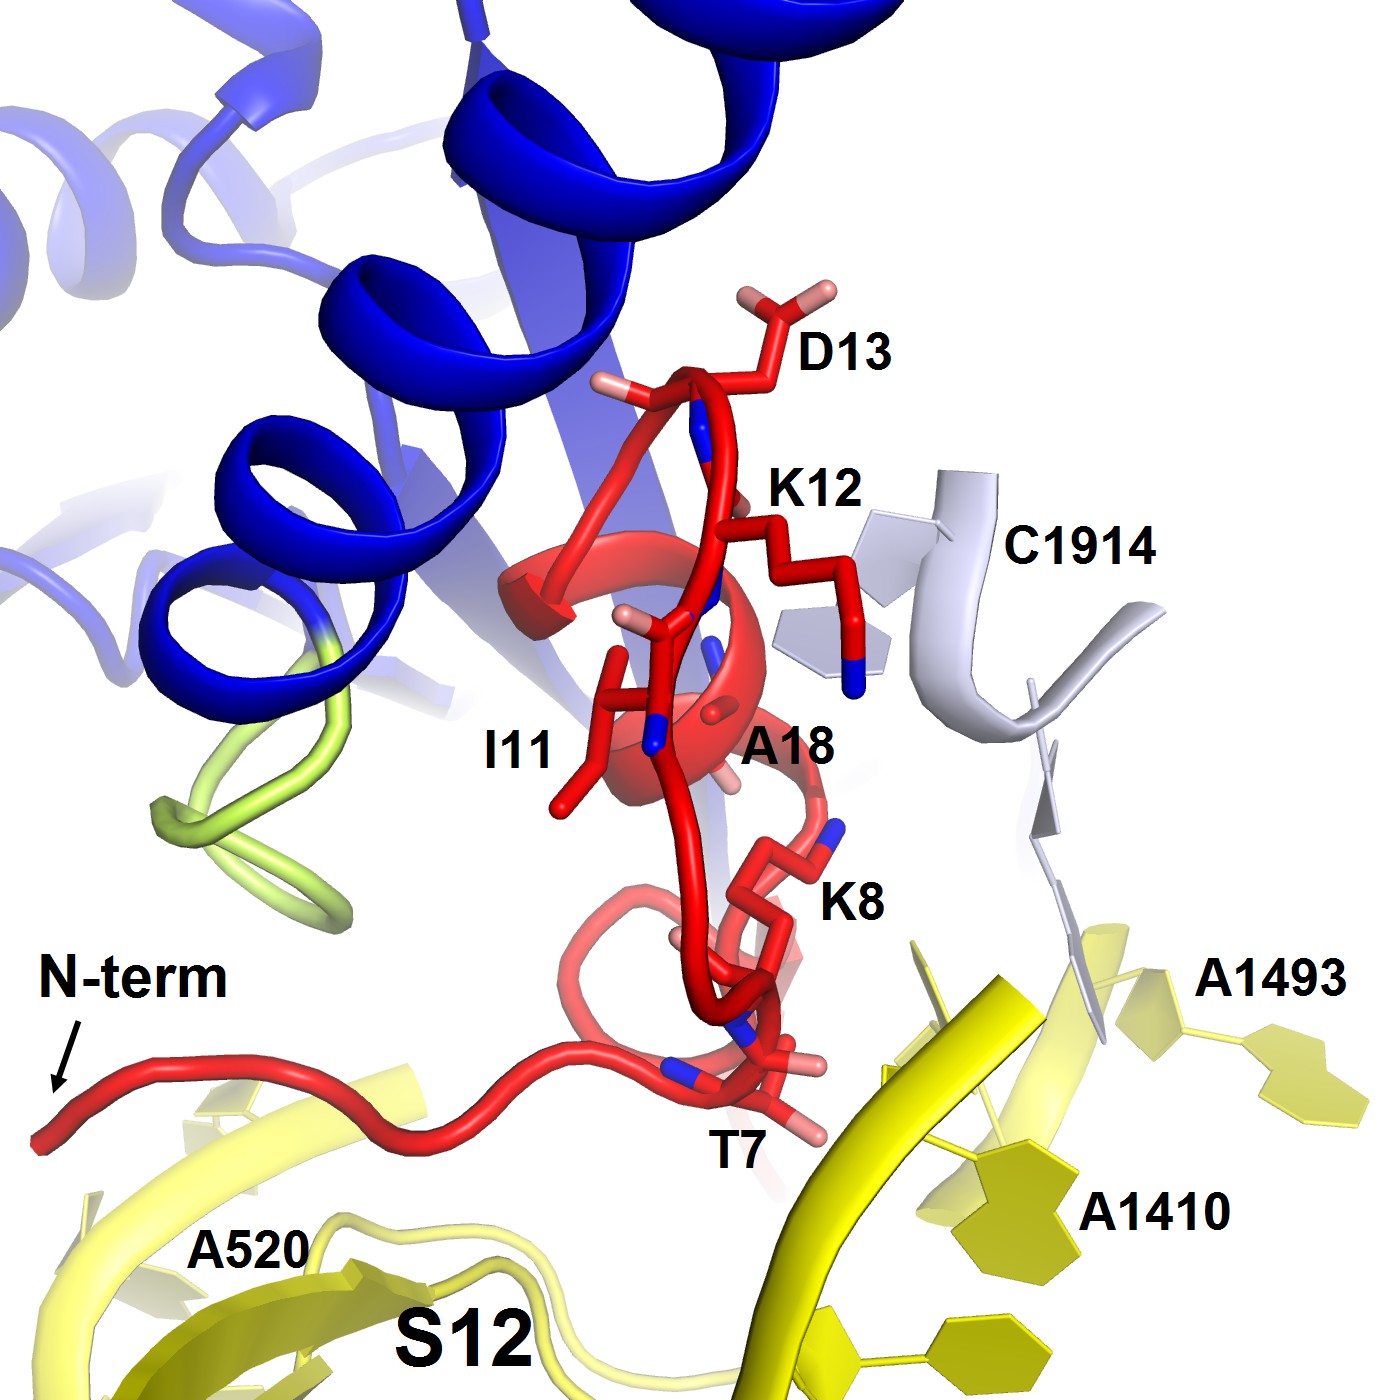
Structure of the N-terminal tail of ArfA near the decoding center in Structure II.
The N-terminus of ArfA (red) is positioned next to A520 of helix 18 of 16S rRNA (within ~10 Å) and contacts S12. Polar residues Thr7 and Lys8 interact with h44 of 16S rRNA (at A1410) and h69 of 23S RNA (at C1914), respectively. The 30S subunit is shown in yellow, 50S in light blue, RF2 in blue. The switch loop of RF2 is highlighted in yellow-green.
Figure 3

RF2 adopts two distinct conformations in Structures I and II.
(A) The P and A sites of Structure I. ArfA is shown in red; RF2 in blue; mRNA in green; P-tRNA in orange; 30S subunit in yellow; and 50S subunit in light blue. (B) Superposition of RF2 from Structure I (blue) with the crystal structure of free (ribosome-unbound) E. coli RF2 (PDB 1GQE) (pink). Relative positions of the codon-recognition superdomain (domains 2 and 4) and catalytic domain 3 are nearly identical. The positions of domain 1 differ; this domain in both Structures I and II interacts with the L11 stalk at the 50S subunit shown in panels (A), (C) and (F). (C) The P and A sites of Structure II. The color coding is as in panel (A). (D) Superposition of extended RF2 in Structure II (blue) with Thermus thermophilus RF2 in the canonical termination complex formed on the UAA stop codon (PDB 4V67) (pink). The superposition was performed by structural alignment of 16S ribosomal RNAs. RF2 adopts similar conformations but domains 2 and 3 are positioned slightly differently with respect to the 30S subunit in the rescue complex II and in the termination complex (see also Figure 4). (E) Superposition of RF2 in Structures I (blue) and II (cyan), achieved by structural alignment of the 16S ribosomal RNAs. Conformations of RF2 and positions relative to the 30S subunit differ between Structures I and II, as RF2 in Structure II binds deeper in the A site; differences in positions of RF2 regions are labeled with arrows. (F) Different positions of the L11 stalk, which interacts with domain 1 of RF2, in Structures I (light blue) and II (cyan), suggesting movement of the stalk together with domain 1 (E) upon RF2 activation. The view is similar to that shown in panels A, C and E. In panels (B), (D) and (E), the Arabic numerals label the domains of RF2.
Figure 4
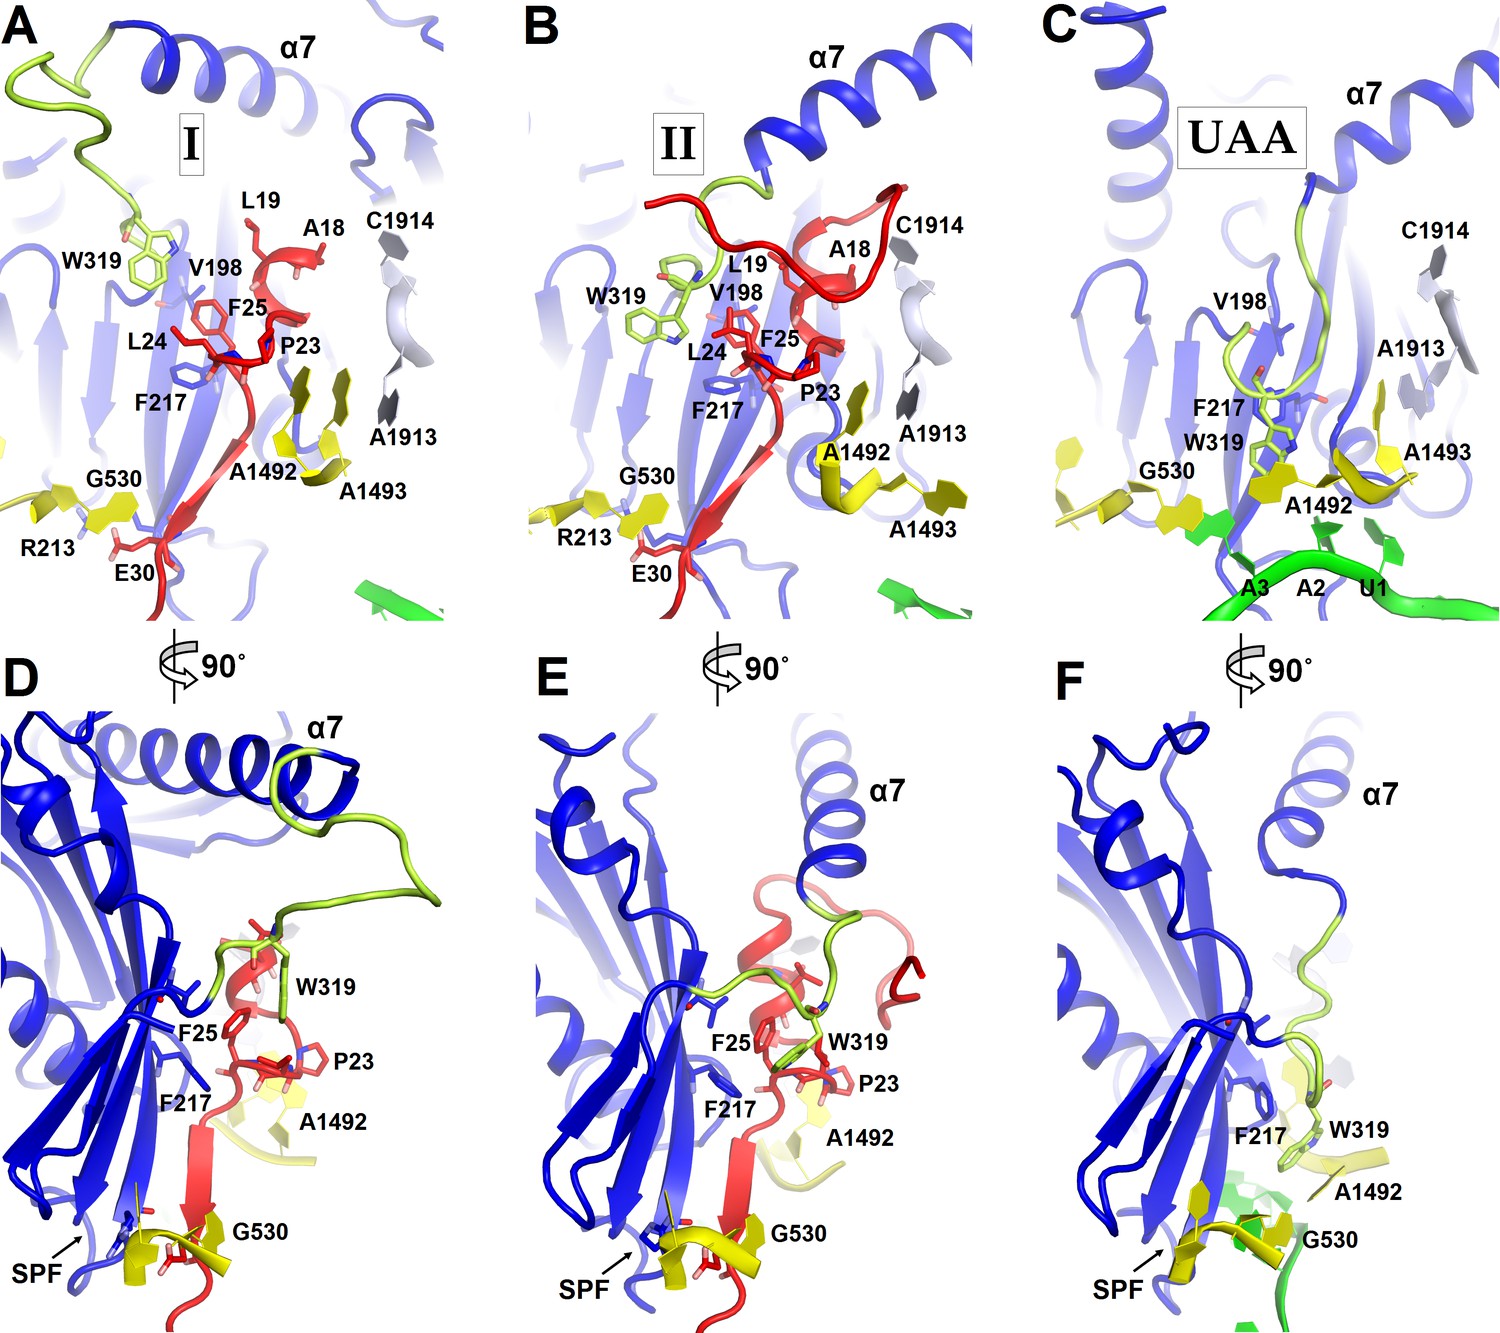
Positions of the codon-recognition domain (blue) and switch loop (yellow-green) of RF2 in Structures I and II (this work) and in the translation termination complex formed on the UAA stop codon (Korostelev et al., 2008).
(A–C) Detailed view of the decoding center of Structure I (A), Structure II (B), and canonical termination complex formed on the UAA stop codon (C). (D–F) 90-degree rotated views (relative to those shown in panels A–C) of the decoding center in Structure I (D), Structure II (E) and the UAA-containing termination complex (F). The switch loop of RF2, which carries the conserved Trp319, adopts different positions in these three structures. Key structural features and residues of ArfA, RF2, mRNA stop codon and the ribosomal decoding center are labeled. ArfA is shown in red; RF2 in blue (RF2 switch loop in yellow-green); mRNA in green; 30S nucleotides in yellow; and 50S nucleotides in light blue.
Figure 5

Mechanism of ArfA-mediated rescue of ribosomes stalled on truncated mRNA.
(A–B). ArfA senses the stalled ribosome by binding its C-terminal portion in the vacant mRNA tunnel, recruiting RF2 in an inactive conformation (as in Structure I). (C) Folding of the N-terminal minidomain of ArfA is coupled with the opening of RF2, placing the GGQ motif into the peptidyl-transferase center (as in Structure II) and catalyzing peptidyl-tRNA hydrolysis. (D) Following peptide release, ArfA and RF2 (likely in a compact conformation) depart, preparing the ribosome for recycling.
Videos
Video 1
An animation showing structural transitions during ArfA-mediated ribosome rescue.
Four scenes are shown: (1) A view of the complete 70S complex, as in Figure 1A and B. The stalled ribosome with a truncated mRNA and a vacant A site, identified in our cryo-EM sample (Figure 1—figure supplement 1) is followed by Structure I and Structure II. (2) The opening of RF2, from Structure I to II, coupled with the movement of the L11 stalk. The transition between Structure I and Structure II was generated using the UCSF Chimera ‘Morph Conformations’ tool. (3) A close-up view of the decoding center, showing the rearrangements of ribosomal nucleotides, ArfA and RF2, coupled with the opening of domain 3 of RF2. (4) A proposed mechanism of ribosome rescue by ArfA and RF2, schematically shown in Figure 5. The animation is also available at http://labs.umassmed.edu/korostelevlab/movarfa.gif
Tables
Table 1
Cryo-EM data collection and refinement statistics.
| Structure I | Structure II | |
|---|---|---|
| PDB code | 5U9G | 5U9F |
| EMDB code | EMD-8522 | EMD-8521 |
| Data collection | ||
| EM equipment | FEI Titan Krios | FEI Titan Krios |
| Voltage (kV) | 300 | 300 |
| Detector | DE-20 | DE-20 |
| Pixel size (Å) | 1.215 | 1.215 |
| Electron dose (e-/Å2) | 61 (used 30) | 61 (used 30) |
| Defocus range (μm) | −0.5 to −3.0 | −0.5 to −3.0 |
| Reconstruction | ||
| Software | Frealign v9.10–9.11 | Frealign v9.10–9.11 |
| Number of particles used | 139,861 | 96,070 |
| Final resolution (Å) | 3.15 | 3.15 |
| Map-sharpening B factor (Å2) | −92.1 | −89.9 |
| Model building | ||
| Software | Coot | Coot |
| Model composition | ||
| Non-hydrogen atoms | 152671 | 152841 |
| Protein residues | 6561 | 6576 |
| RNA bases | 4729 | 4729 |
| Ligands (Zn2+/Mg2+) | 1/348 | 1/360 |
| Refinement | ||
| Software | RSRef and Phenix | RSRef and Phenix |
| Correlation Coeff (%; Phenix) | 82.90 | 80.40 |
| R-factor (RSRef) | 0.187 | 0.194 |
| Validation (proteins) | ||
| MolProbity score | 2.3 | 2.2 |
| Clash score, all atoms | 12.6 | 13.0 |
| Good rotamers (%) | 93.7 | 94.4 |
| Ramachandran-plot statistics (%) | ||
| Favored (overall) | 88.4 | 88.2 |
| Allowed (overall) | 10.6 | 10.8 |
| Outlier (overall) | 1.0 | 1.0 |
| Favored (ArfA) | 86.7 | 88.9 |
| Allowed (ArfA) | 13.3 | 11.1 |
| Outlier (ArfA) | - | - |
| Favored (RF2) | 86.4 | 92.5 |
| Allowed (RF2) | 13.6 | 7.2 |
| Outlier (RF2) | - | 0.3 |
| R.m.s. deviations | ||
| Bond length (Å) | 0.006 | 0.005 |
| Bond angle (˚) | 0.852 | 0.864 |
| Validation (RNA) | ||
| Correct sugar puckers (%) | 99.9 | 99.9 |
| Good backbone conformation (%) | 85.2 | 85.3 |
Download links
A two-part list of links to download the article, or parts of the article, in various formats.
Downloads (link to download the article as PDF)
Open citations (links to open the citations from this article in various online reference manager services)
Cite this article (links to download the citations from this article in formats compatible with various reference manager tools)
Mechanism of ribosome rescue by ArfA and RF2
eLife 6:e23687.
https://doi.org/10.7554/eLife.23687


