The complex relationship of exposure to new Plasmodium infections and incidence of clinical malaria in Papua New Guinea
- Swiss Tropical and Public Health Institute, Switzerland
- University of Basel, Switzerland
- Walter and Eliza Hall Institute of Medical Research, Australia
- Papua New Guinea Institute of Medical Research, Papua New Guinea
- University of Melbourne, Australia
- Burnet Institute, Australia
- ISGlobal, Barcelona Centre for International Health Research, Hospital Clínic-University of Barcelona, Spain
- Institut Pasteur, France
Figures
Figure 1 with 2 supplements
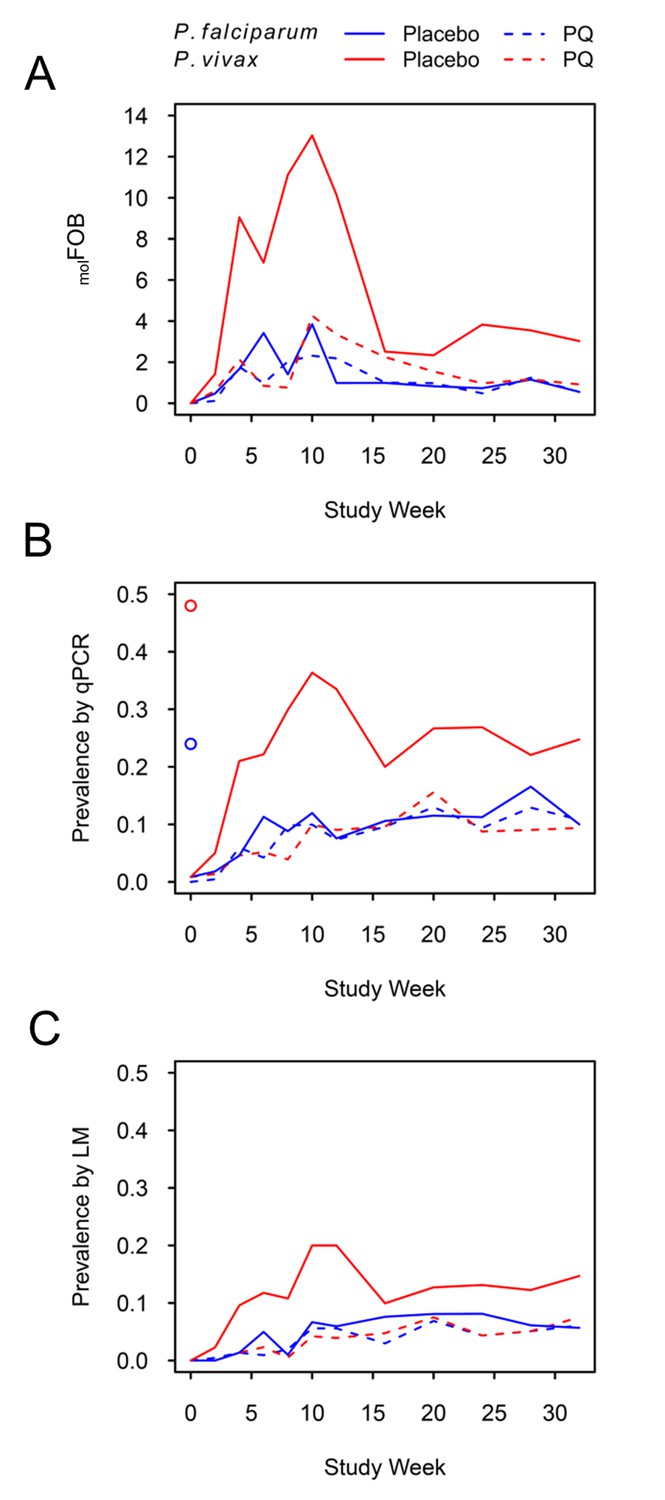
P. falciparum and P. vivax molFOB (A), prevalence by qPCR (B) and LM (C) by week of follow-up.
Blue lines, P. falciparum; red lines, P. vivax; solid lines, placebo arm; dashed lines, PQ arm. Open circles in (B) mark enrolment qPCR prevalence for each species.
Figure 1—figure supplement 1
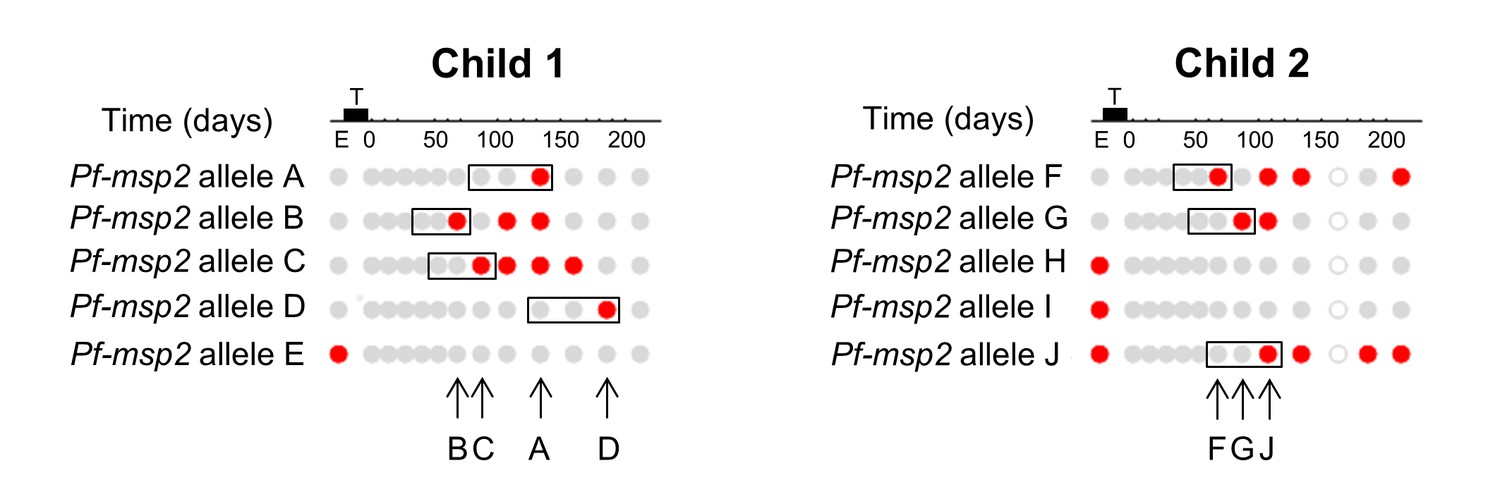
Definition of new infections for calculating molFOB.
Definition of P. falciparum new infections in two exemplary children is shown. The study design and timelines of follow-up are shown in upper panel: enrolment visit (‘E’), followed by radical treatment (black bar ‘T’) and 235 days of follow-up. The presence of P. falciparum clones by sampling visit is visualized below. Columns represent sampling visits, rows represent P. falciparum msp2 alleles, that is distinct P. falciparum clones. Grey solid circles, P. falciparum negative sample, grey open circle, missing sample due to missed follow-up visit; red circle: sample positive for respective Pf-msp2 allele. New infections were defined as a positive sample preceded by two samples negative for this allele (black rectangles), excluding missed samples (see Child 2, allele F, days 120–200). The time point of new infections is marked by arrows for the two children.
Figure 1—figure supplement 2

P. ovale and P. malariae prevalence by qPCR during follow-up.
Purple lines, P. ovale; green lines, P. malariae; solid lines, Placebo arm; dashed lines, PQ arm. Open circles mark enrolment qPCR prevalence for each species.
Figure 2
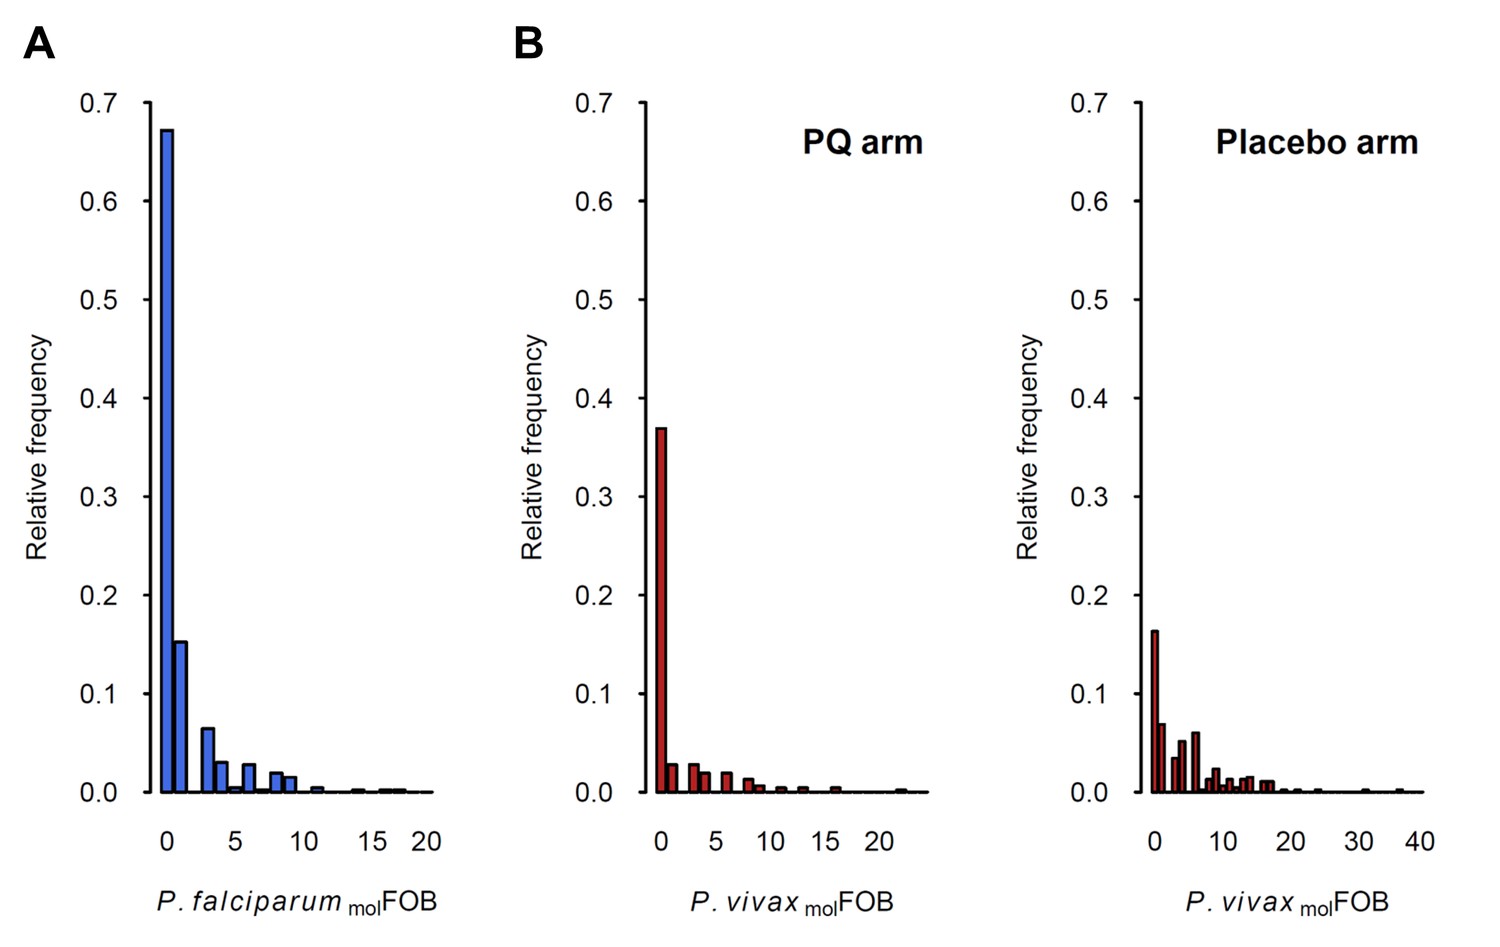
Distribution of P.falciparum molFOB (A) and P. vivax molFOB by treatment arm (B).
Relative frequencies among the 466 children are shown.
Figure 3
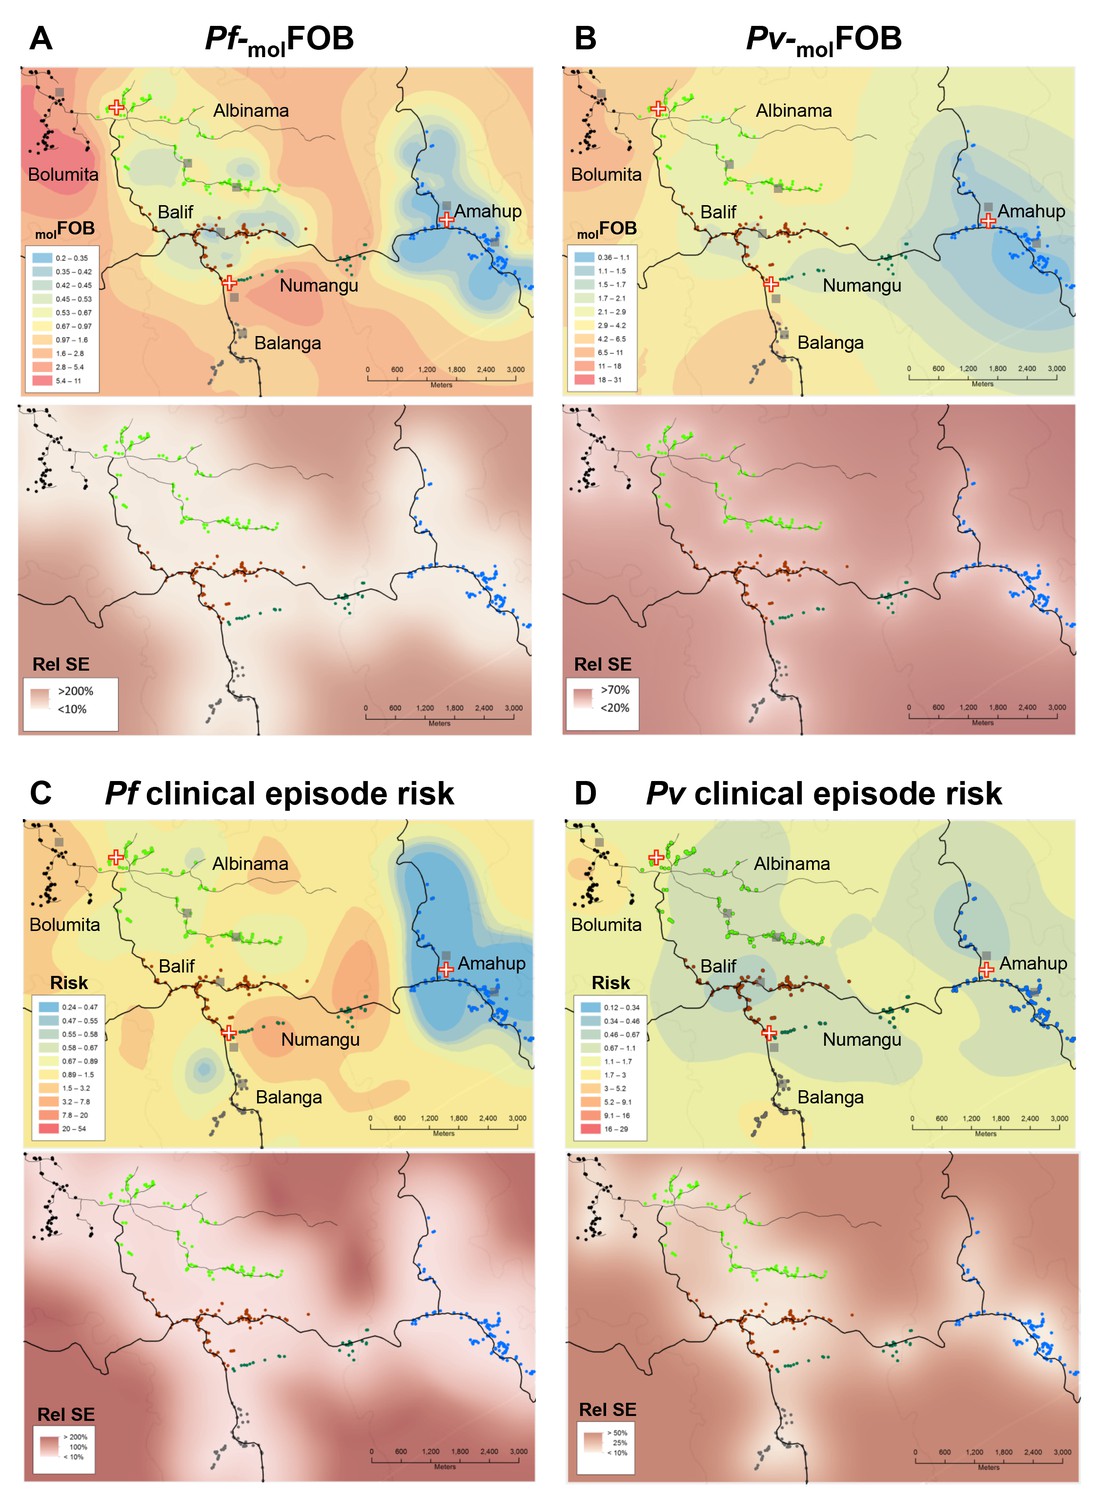
Heterogeneity in molFOB (A, B) and clinical episode risk (C, D) of P.falciparum (A, C) and P. vivax (B, D).
Upper panels show the kriging fit of model predictions of molFOB and clinical episode risk of children in both treatment arms. Lower panels show the standard error relative to the kriging estimate. Dots represent study participants’ houses and are color-coded according to village. Black lines: vehicle-accessible road; dark grey lines: vehicle-inaccessible road; light grey lines: river; red/white cross: health center or aid post; grey square: school or enrolment location. Maps were prepared using ArcGIS 10.2 (Esri, USA).
Figure 4
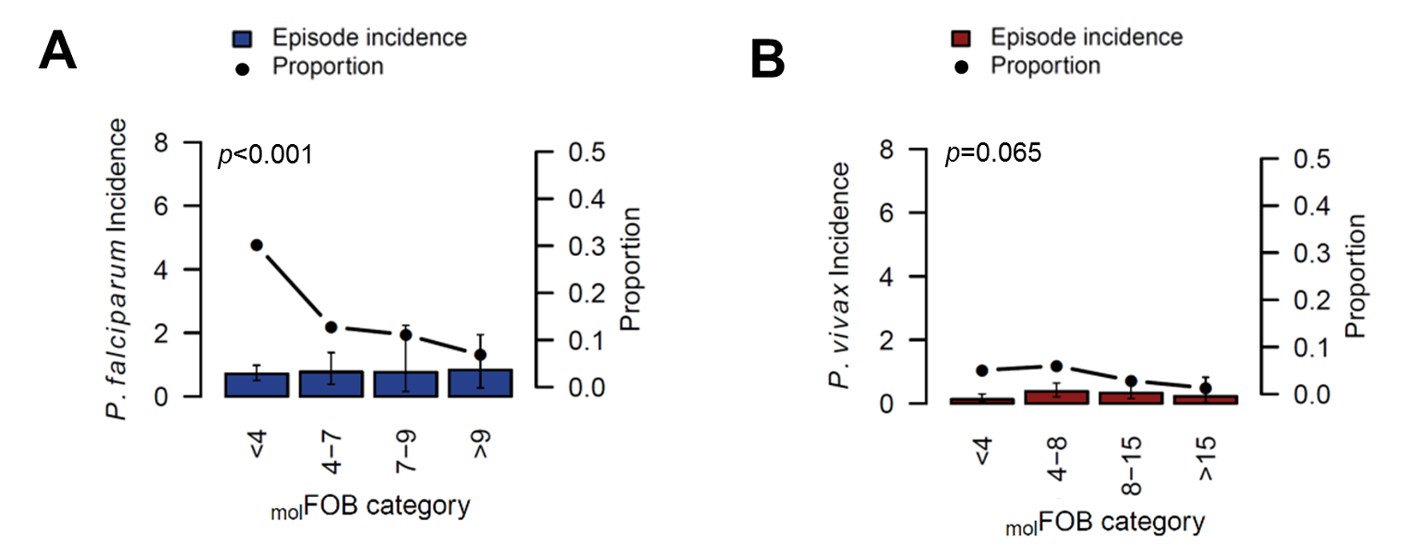
The incidence of P.falciparum (A) and P. vivax (B) clinical episodes relative to molFOB.
Mean clinical episode incidence is shown as bars (left axis) and proportion of clinical episode incidence divided by molFOB as connected dots (right axis). Error bars represent 95% CIs. p-values refer to the differences between groups in the proportion of clinical episodes and new infections, assessed by Chi2 or Fisher’s exact test.
Tables
Table 1
Characteristics of study participants by village.
https://doi.org/10.7554/eLife.23708.003| Village | N | % female | Mean age (±SD) | Mean weight (±SD) | % LLIN use at enrolment* | Mean LLIN use during follow-up† (%, range) | Mean Hb (±SD) |
|---|---|---|---|---|---|---|---|
| Amahup | 119 | 53 | 7.6 (±1.5) | 19.8 (±3.3) | 99 | 99 (50–100) | 11.1 (±1.0) |
| Albinama | 99 | 43 | 7.7 (±1.5) | 20.0 (±3.3) | 95 | 97 (78–100) | 11.7 (±1.8) |
| Balanga | 54 | 59 | 7.8 (±1.6) | 19.8 (±4.3) | 96 | 99 (83–100) | 11.3 (±1.1) |
| Balif | 93 | 51 | 7.8 (±1.5) | 20.3 (±3.3) | 91 | 99 (69–100) | 11.7 (±1.2) |
| Bolumita | 70 | 50 | 7.4 (±1.7) | 19.3 (±2.9) | 77 | 92 (56–100) | 10.7 (±1.0) |
| Numangu | 31 | 55 | 7.4 (±1.6) | 19.2 (±4.6) | 100 | 100 (92–100) | 12.1 (±1.4) |
| Total | 466 | 51 | 7.6 (±1.5) | 19.8 (±3.5) | 93 | 100 (50–100) | 11.4 (±1.4) |
-
* LLIN use in the night preceding enrolment.
† Information on LLIN use in the previous night was collected at each follow-up visit and averaged across follow-up per participant. Mean LLIN use by village was calculated from the averaged individual LLIN use.
-
Hb: Haemoglobin.
Table 2
Plasmodium infection status at enrolment by village.
https://doi.org/10.7554/eLife.23708.004| Village | P. falciparum | P. vivax | P. malariae | P. ovale | ||||||||||||
|---|---|---|---|---|---|---|---|---|---|---|---|---|---|---|---|---|
| N pos. | Prevalence by qPCR (CI95) | % mixed* | Mean† density (IQR) | Mean MOI‡ (range) | N pos. | Prevalence by qPCR (CI95) | % mixed* | Mean† density (IQR) | Mean MOI‡ (range) | N pos. | Prevalence by qPCR (CI95) | % mixed* | N pos. | Prevalence by qPCR (CI95) | % mixed* | |
| Albinama | 18 | 18 (11–27) | 72 | 131 (38–189) | 1.4 (1–4) | 54 | 55 (44–65) | 24 | 3 (1–17) | 1.8 (1–7) | 9 | 9 (5–17) | 67 | 5 | 5 (2–12) | 100 |
| Amahup | 14 | 12 (7–19) | 57 | 56 (14–105) | 1.6 (1–5) | 46 | 39 (30–48) | 24 | 3 (1–29) | 2.2 (1–7) | 12 | 10 (6–17) | 83 | 0 | 0 | |
| Balanga | 15 | 28 (17–42) | 67 | 79 (30–848) | 1.7 (1–5) | 23 | 43 (30–57) | 43 | 2 (1–28) | 2.0 (1–7) | 9 | 17 (8–30) | 56 | 2 | 3 (0–14) | 50 |
| Balif | 8 | 9 (4–17) | 63 | 64 (10–325) | 2.0 (1–4) | 35 | 38 (30–48) | 14 | 2 (1–14) | 1.9 (1–6) | 7 | 8 (3–15) | 57 | 0 | 0 | |
| Bolumita | 50 | 71 (59–81) | 80 | 331 (62–1988) | 2.2 (1–8) | 47 | 67 (55–78) | 81 | 3 (2–27) | 2.9 (1–10) | 28 | 40 (29–52) | 89 | 8 | 11 (5–22) | 100 |
| Numangu | 8 | 26 (13–45) | 75 | 192 (30–848) | 1.1 (1–2) | 18 | 58 (39–75) | 28 | 3 (1–25) | 1.6 (1–5) | 4 | 13 (4–31) | 50 | 0 | 0 | |
| Overall | 113 | 24 (20–28) | 73 | 163 (20–1103) | 1.9 (1–8) | 223 | 48 (43–52) | 37 | 3 (1–23) | 2.2 (1–10) | 69 | 15 (12–18) | 75 | 15 | 3 (2–5) | 93 |
| p-value§ | <0.001 | 0.034 | 0.086 | 0.047 | <0.001 | <0.001 | 0.947 | 0.020 | <0.001 | 0.086 | <0.001 | 0.133 | ||||
-
* % of infections by qPCR that are mixed-species infections.
† Geometric mean of species-specific 18S rRNA copy numbers per µl blood.
-
‡ MOI, multiplicity of infection: number of Pf-msp2 and Pv-msp1F3 alleles per infection.
§ Differences between villages were tested for using Chi2 and Fisher’s exact test (prevalence, proportion mixed) or Kruskal-Wallis test (MOI, log10-transformed parasite density).
Table 3
Multivariable predictors for time to recurrent blood-stage infection with Plasmodium species by qPCR
https://doi.org/10.7554/eLife.23708.008| Variable | P. vivax | P. falciparum | P. malariae | P. ovale | ||||||||
|---|---|---|---|---|---|---|---|---|---|---|---|---|
| AHR* | CI95 | p-value | AHR* | CI95 | p-value | AHR* | CI95 | p-value | AHR* | CI95 | p-value | |
| PQ treatment | 0.18 | 0.13–0.25 | <0.001 | 0.73 | 0.52–1.02 | 0.064 | 0.51 | 0.22–1.19 | 0.121 | 0.31 | 0.12–0.75 | 0.010 |
| Age | 0.95 | 0.87–1.04 | 0.247 | 1.05 | 0.94–1.17 | 0.361 | 0.98 | 0.75–1.29 | 0.905 | 0.96 | 0.74–1.26 | 0.793 |
| LLIN use at enrolment | 0.62 | 0.39–0.98 | 0.043 | 0.84 | 0.49–1.44 | 0.531 | 1.33 | 0.33–6.09 | 0.715 | 0.95 | 0.26–3.43 | 0.936 |
| Hb at enrolment (g/dl) | 0.88 | 0.80–0.98 | 0.019 | 0.90 | 0.80–1.02 | 0.099 | 0.83 | 0.61–1.12 | 0.224 | 0.92 | 0.66–1.28 | 0.634 |
| Village | ||||||||||||
| Albinama (ref) | 1 | 1 | 1 | 1 | ||||||||
| Amahup | 0.45 | 0.29–0.71 | 0.001 | 0.58 | 0.31–1.11 | 0.101 | 0.34 | 0.07–1.79 | 0.205 | 2.83 | 0.29–27.48 | 0.370 |
| Balanga | 2.15 | 1.40–3.31 | <0.001 | 1.81 | 0.99–3.30 | 0.054 | 0.92 | 0.24–3.60 | 0.910 | 7.74 | 0.85–70.45 | 0.070 |
| Balif | 1.00 | 0.66–1.54 | 0.983 | 0.60 | 0.30–1.19 | 0.145 | 0.24 | 0.03–2.07 | 0.193 | 4.60 | 0.51–41.41 | 0.173 |
| Bolumita | 3.34 | 2.09–5.33 | <0.001 | 4.73 | 2.69–8.30 | <0.001 | 1.21 | 0.34–4.31 | 0.770 | 19.43 | 2.19–172.37 | 0.008 |
| Numangu | 0.83 | 0.44–1.59 | 0.583 | 2.29 | 1.17–4.50 | 0.015 | 0.82 | 0.15–4.53 | 0.823 | 3.17 | 0.19–52.41 | 0.420 |
| Infection status at enrolment (by qPCR) | ||||||||||||
| Uninfected (ref) | 1 | 1 | 1 | 1 | ||||||||
| P. vivax | 1.27 | 0.91–1.78 | 0.165 | 1.37 | 0.86–2.20 | 0.186 | 0.92 | 0.20–4.18 | 0.913 | 2.17 | 0.68–6.97 | 0.192 |
| P. falciparum | 1.36 | 0.84–2.19 | 0.205 | 1.56 | 0.86–2.82 | 0.145 | 3.54 | 0.85–14.72 | 0.083 | 1.25 | 0.26–5.90 | 0.779 |
| P. malariae | 0.83 | 0.38–1.85 | 0.655 | 0.99 | 0.38–2.56 | 0.977 | 6.35 | 1.31–30.81 | 0.022 | 1.58 | 0.17–14.30 | 0.676 |
| Mixed P.f. or P.v.† | 1.74 | 1.14–2.65 | 0.010 | 2.08 | 1.25–3.48 | 0.005 | 3.37 | 0.88–12.90 | 0.076 | 2.03 | 0.55–7.53 | 0.287 |
-
* AHRs were modeled using Cox proportional hazard regression.
† Mixed infection including P. falciparum or P. vivax infection in conjunction with one or more other Plasmodium spp.
-
PQ: Primaquine; LLIN: long-lasting insecticide-treated net; Hb: haemoglobin.
Table 4
Multivariable predictors of Pv- and Pf-molFOB per follow-up interval.
Model predictions from this model were used for mapping molFOB in Figure 3A.
| Variable | P. vivax | P. falciparum | |||||||
|---|---|---|---|---|---|---|---|---|---|
| PQ arm | Placebo arm | Combined arms | |||||||
| IRR* | CI95 | p-value | IRR* | CI95 | p-value | IRR* | CI95 | p-value | |
| PQ treatment | n.a.† | n.a. | n.a. | n.a. | n.a. | n.a. | 0.89 | 0.65–1.22 | 0.474 |
| New P. falc. infections in interval‡ | 1.32 | 0.92–1.89 | 0.134 | 1.10 | 0.85–1.42 | 0.466 | n.a. | n.a. | n.a. |
| New P. vivax infections in interval‡ | n.a. | n.a. | n.a. | n.a. | n.a. | n.a. | 1.15 | 0.97–1.36 | 0.100 |
| Age | 0.86 | 0.74–1.01 | 0.059 | 0.95 | 0.87–1.04 | 0.305 | 1.03 | 0.92–1.14 | 0.640 |
| LLIN use at enrolment | 0.96 | 0.51–1.79 | 0.897 | 0.62 | 0.43–0.91 | 0.013 | 1.07 | 0.7–1.62 | 0.755 |
| Hb at enrolment (g/dl) | 0.85 | 0.72–1.01 | 0.063 | 0.91 | 0.85–0.99 | 0.025 | 0.85 | 0.75–0.97 | 0.013 |
| Village | |||||||||
| Albinama (ref) | 1 | 1 | 1 | ||||||
| Amahup | 0.02 | 0–0.11 | <0.001 | 0.56 | 0.34–0.91 | 0.020 | 0.52 | 0.25–1.07 | 0.074 |
| Balif | 0.85 | 0.4–1.8 | 0.664 | 1.74 | 1.16–2.61 | 0.007 | 1.81 | 0.98–3.35 | 0.059 |
| Balanga | 0.28 | 0.1–0.82 | 0.020 | 1.13 | 0.73–1.73 | 0.590 | 0.75 | 0.37–1.52 | 0.423 |
| Bolumita | 1.52 | 0.73–3.17 | 0.268 | 2.67 | 1.83–3.9 | <0.001 | 6.05 | 3.32–11.05 | <0.001 |
| Numangu | 0.5 | 0.15–1.68 | 0.264 | 0.76 | 0.4–1.43 | 0.394 | 2.8 | 1.39–5.64 | 0.004 |
| Study Day | |||||||||
| Day 0–35 (ref) | 1 | 1 | 1 | ||||||
| Day 36–80 | 1.37 | 0.54–3.48 | 0.509 | 1.99 | 1.39–2.84 | <0.001 | 2.42 | 1.44–4.07 | 0.001 |
| Day 81–175 | 1.34 | 0.57–3.12 | 0.503 | 0.89 | 0.61–1.3 | 0.538 | 1.13 | 0.7–1.84 | 0.616 |
| Day > 175 | 0.65 | 0.25–1.69 | 0.374 | 0.56 | 0.38–0.83 | 0.004 | 0.87 | 0.48–1.56 | 0.643 |
-
*IRRs were modeled per sampling interval using negative binomial generalized estimating equations allowing for repeated visits with log-link and an exchangeable correlation structure.
† n.a., not applicable.
-
‡molFOB in the follow-up interval (time-varying covariate).
PQ: Primaquine; LLIN: long-lasting insecticide-treated net; Hb: haemoglobin.
Table 5
Multivariable predictors for time to P. vivax and P. falciparum clinical episodes.
Model predictions from this model were used for mapping the relative risk of clinical malaria episodes in Figure 3C and D.
| Variable | P. vivax | P. falciparum | ||||
|---|---|---|---|---|---|---|
| AHR* | CI95 | p-value | AHR* | CI95 | p-value | |
| PQ treatment | 0.76 | 0.34–1.68 | 0.497 | 1.79 | 1.05–3.03 | 0.031 |
| P. vivax molFOB‡ | 1.07 | 1.04–1.09 | <0.001 | n.a. | n.a. | n.a. |
| P. falciparum molFOB‡ | n.a. | n.a. | n.a. | 1.15 | 1.11–1.21 | <0.001 |
| Age | 0.62 | 0.46–0.84 | 0.002 | 0.98 | 0.85–1.13 | 0. 799 |
| LLIN use at enrolment | 0.84 | 0.24–2.88 | 0.778 | 0.44 | 0.22–0.87 | 0.018 |
| Hb at enrolment (g/dl) | 0.95 | 0.74–0.67 | 0.668 | 0.85 | 0.71–1.01 | 0.070 |
| Village | ||||||
| Albinama (ref) | 1 | 1 | ||||
| Amahup | 0.89 | 0.23–3.46 | 0.871 | 0.65 | 0.20–2.08 | 0.465 |
| Balif | 1.48 | 0.45–4.86 | 0.518 | 1.26 | 0.50–3.14 | 0.626 |
| Balanga | 0.85 | 0.21–3.53 | 0.827 | 1.39 | 0.59–3.30 | 0.455 |
| Bolumita | 0.99 | 0.24–4.03 | 0.987 | 1.32 | 0.58–3.03 | 0.508 |
| Numangu | 1.00 | 0.23–4.31 | 0.997 | 4.29 | 2.06–8.97 | <0.001 |
| Infection status at enrolment (by qPCR) | ||||||
| Uninfected (ref) | 1 | 1 | ||||
| P. vivax | 0.77 | 0.29–2.07 | 0.608 | 1.64 | 0.91–2.95 | 0.101 |
| P. falciparum | 1.74 | 0.59–5.11 | 0.316 | 0.97 | 0.34–2.77 | 0.954 |
| Mixed P.f. or P.v. | 1.59 | 0.56–4.50 | 0.381 | 1.24 | 0.57–2.68 | 0.582 |
-
* AHRs were modeled using multiple failure Cox proportional hazard regression.
† n.a., not applicable
-
‡ Average molFOB until the time of failure (time-varying covariate).
PQ: Primaquine; LLIN: long-lasting insecticide-treated net; Hb: haemoglobin.
Table 6
Multivariable predictors for odds of P. falciparum clinical episodes
https://doi.org/10.7554/eLife.23708.015| P. falciparum episode | |||
|---|---|---|---|
| Variable | OR* | CI95 | p-value |
| PQ treatment | 1.42 | 0.80–2.52 | 0.226 |
| P. vivax qPCR positive† | 0.35 | 0.15–0.78 | 0.011 |
| P. falciparum molFOB‡ | 1.21 | 1.10–1.34 | <0.001 |
| Age | 0.93 | 0.80–1.09 | 0.370 |
| LLIN at enrolment | 0.37 | 0.16–0.83 | 0.016 |
| Hb (g/dl) at enrolment | 0.88 | 0.70–1.11 | 0.292 |
| Village | |||
| Albinama (ref) | 1 | ||
| Amahup | 0.41 | 0.12–1.39 | 0.154 |
| Balif | 0.9 | 0.26–3.08 | 0.870 |
| Balanga | 1.19 | 0.42–3.39 | 0.747 |
| Bolumita | 1.48 | 0.42–5.17 | 0.540 |
| Numangu | 4.17 | 1.64–10.58 | 0.003 |
| Study Day | |||
| Day 0–80 | 1 | ||
| Day 81–175 | 0.99 | 0.51–1.91 | 0.972 |
| Day > 175 | 0.83 | 0.39–1.75 | 0.629 |
-
* ORs were modeled using a binomial generalized estimating equation with logit link function using an exchangeable correlation structure.
† Determined as P. vivax positive at the same or previous sampling visit.
-
‡molFOB in the follow-up interval (time-varying covariate).
PQ: Primaquine; LLIN: long-lasting insecticide-treated net; Hb: haemoglobin.
Additional files
-
Supplementary file 1
Univariate factors.
Table 1. Univariate/PQ-adjusted predictors for time to recurrent blood-stage infection with Plasmodium species by qPCR. Table 2. Univariate (P. vivax) and univariate/PQ-treatment-adjusted (P. falciparum) predictors for Pv- and Pf-molFOB by follow-up interval. Table 3. Univariate/PQ-treatment-adjusted predictors for time to P. vivax and P. falciparum episodes. Table 4. Univariate/PQ-treatment-adjusted predictors for odds of P. falciparum clinical episodes.
- https://doi.org/10.7554/eLife.23708.012
-
Supplementary file 2
Multivariable predictors for time to recurrent blood-stage infection with Plasmodium species by LM.
- https://doi.org/10.7554/eLife.23708.016
-
Supplementary file 3
Multivariable predictors for P. falciparum and P. vivax density by qPCR during follow-up.
- https://doi.org/10.7554/eLife.23708.017
-
Supplementary file 4
Multivariable predictors of Pv-molFOB (combining primaquine and placebo arms) per follow-up interval.
- https://doi.org/10.7554/eLife.23708.018
-
Transparent reporting form
- https://doi.org/10.7554/eLife.23708.019
Download links
A two-part list of links to download the article, or parts of the article, in various formats.
Downloads (link to download the article as PDF)
Open citations (links to open the citations from this article in various online reference manager services)
Cite this article (links to download the citations from this article in formats compatible with various reference manager tools)
The complex relationship of exposure to new Plasmodium infections and incidence of clinical malaria in Papua New Guinea
eLife 6:e23708.
https://doi.org/10.7554/eLife.23708


