Regulation of localization and function of the transcriptional co-activator YAP by angiomotin
- The Scripps Research Institute, United States
- Klinikum rechts der Isar, Technische Universität München, Germany
Figures
Figure 1

YAP associates with Merlin in the nucleus and cytoplasm.
Co-immunoprecipitation of YAP and Merlin. (A) HEK293 or (B) hSC2λ cells were co-transfected with expression plasmids for HA-Merlin or Flag-Merlin and V5-YAP. Total cell lysates (Input) and HA, Flag, YAP or V5 immunoprecipitates (IP) were subjected to immunoblotting analysis with anti-V5, anti-HA, anti-Flag, Merlin or YAP antibodies as indicated. (C) Association of endogenous YAP and Merlin. Total lysates from HEK293 cells (input) or IPs with anti-Merlin or anti-YAP antibodies were subjected to immunoblotting analysis with indicated antibodies. (D–F) YAP associates with Merlin in the nucleus and in the cytoplasm. (D) HEK293 or (E) hSC2λ cells expressing Flag-Merlin and V5-YAP were fractionated into cytoplasmic, nuclear, and plasma membrane fractions. Cell lysates (input) and V5-IP or Flag-IP of each subcellular fraction were subjected to immunoblot analysis with indicated antibodies. GAPDH, Lamin A/C, and EGFR/ Na+/K+ATPase were used as fractionation controls for the cytoplasmic, nuclear, and plasma membrane fractions, respectively. IgG was used as a non-specific antibody control for IPs throughout. The blots shown are representative of three independent biological replicates (n = 3). (F) HEK293 (left) or hSC2λ (right) cells were co-transfected with YAP and Merlin expression plasmids and subjected to immunofluorescence staining with anti-YAP and anti-Merlin antibodies. Hoechst was used for nuclei fluorescence staining. Pictures show fields at 63x magnification and representative of three independent biological replicates, in each of which 20 independent fields were examined. Scale bar = 10 μm.
Figure 2 with 2 supplements
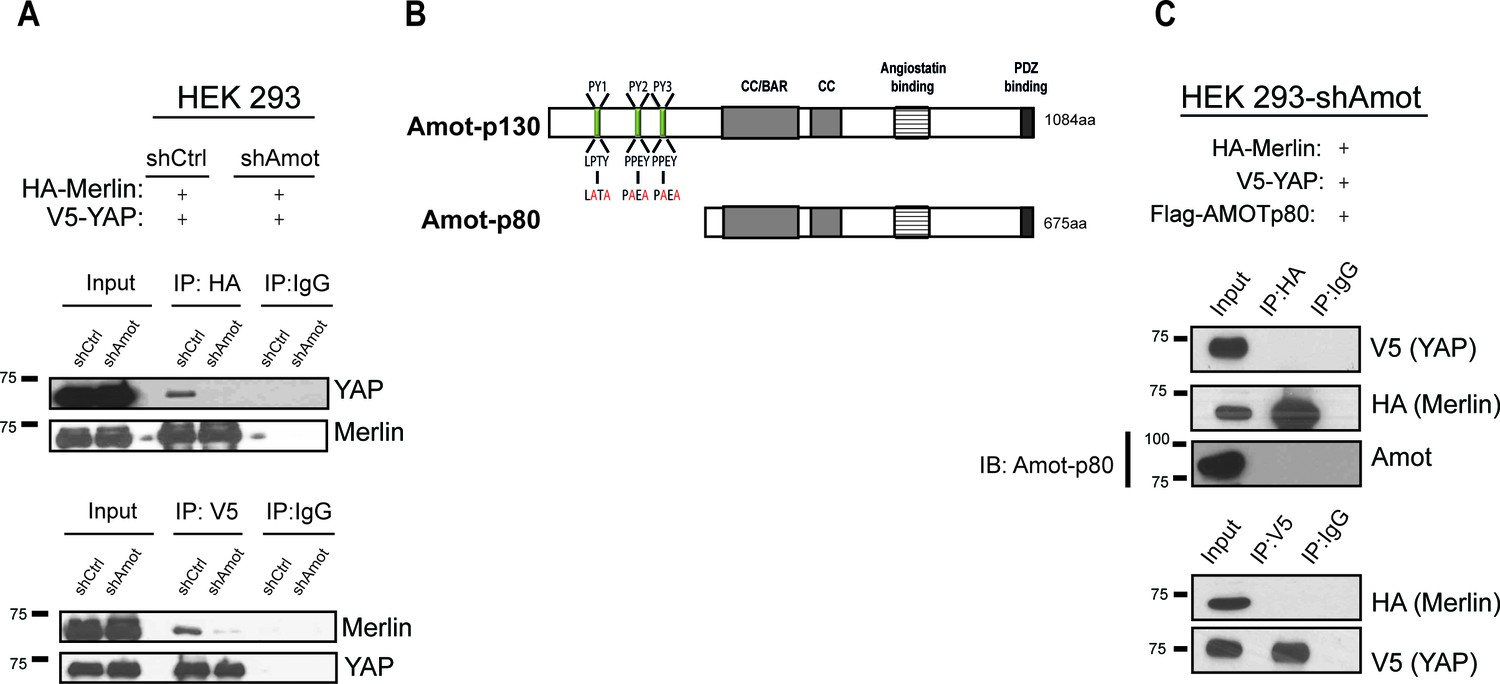
YAP and Merlin association is dependent on Amot-p130.
(A) HEK293 cells stably infected with lentiviral vectors encoding a control shRNA (shCtr) or shRNA targeting Amot (shAmot) were co-transfected with expression plasmids for HA-Merlin and V5-YAP. Total lysates (input) and HA or V5 IPs were subjected to immunoblot analysis with anti-YAP and anti-Merlin antibodies as indicated. (B) Graphical representation of Amot p130 and p80 isoforms. Amot-p130 N-terminus PPxY and LPxY motifs are shown, and the generated PY motif mutants are highlighted in red. See Figure 2—figure supplement 1. CC/BAR – Coiled-Coil/(Bin/Amphiphysin/Rvs) domain. PDZ – Post synaptic density protein (PSD95, Drosophila disc large (Dlg1) and Zonula occludens-1 (ZO-1) domain. (C) HEK293-shAmot cells were co-transfected with HA-Merlin, V5-YAP, and Flag-Amot-p80. Total lysates (Input) and HA or V5 IPs were subjected to immunoblot analysis with anti-V5 and anti-HA antibodies as indicated. The blots shown are representative of three independent biological replicates (n = 3).
Figure 2—figure supplement 1
YAP and Merlin association is dependent on Amot-p130.
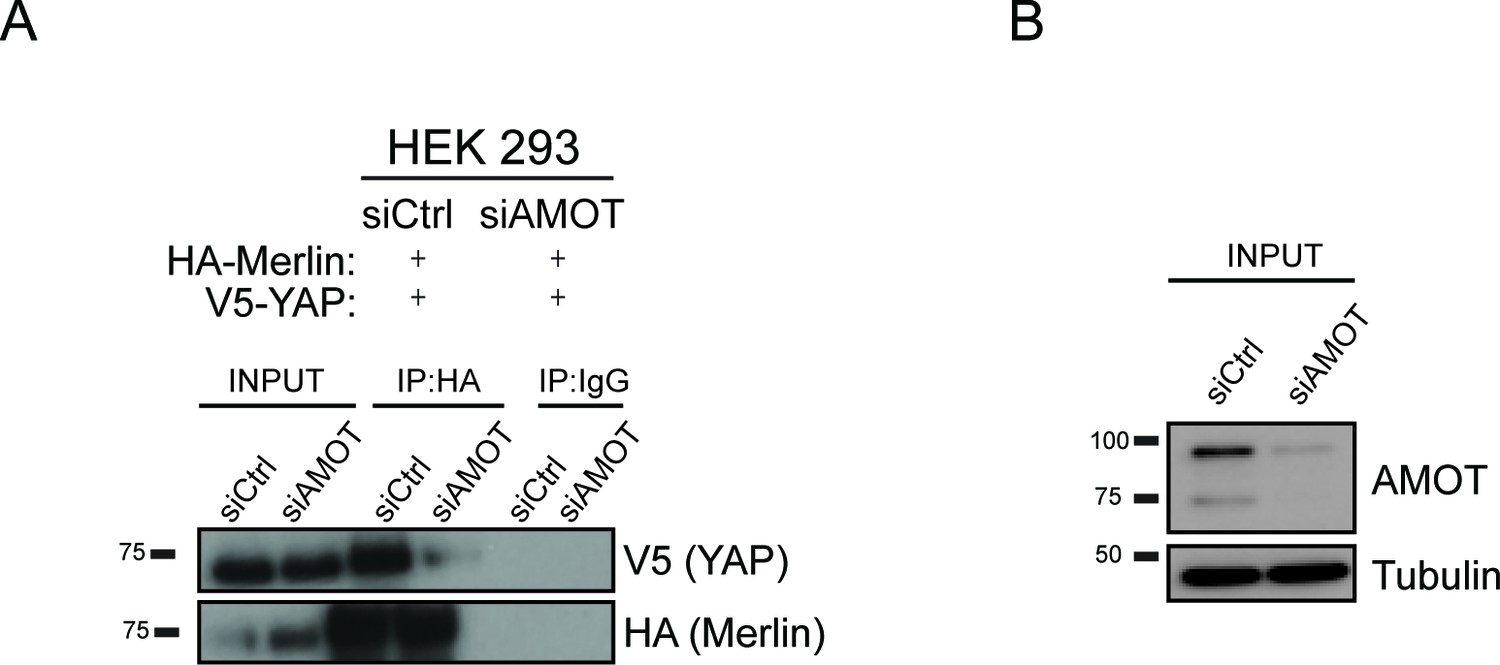
HEK293 cells were co-transfected with siRNA targeting Amot (siAMOT) or non-targeting control (siCtrl) and expression plasmids for HA-Merlin and V5-YAP. (A) Merlin was IP’ed with anti-HA antibody and subjected to immunoblot analysis with anti-V5 antibodies. Total levels of Merlin or YAP (A–input) and Amot (B) were assessed using the indicated antibodies. Tubulin was used as a loading control. The blots shown are representative of three independent biological replicates (n = 3).
Figure 2—figure supplement 2
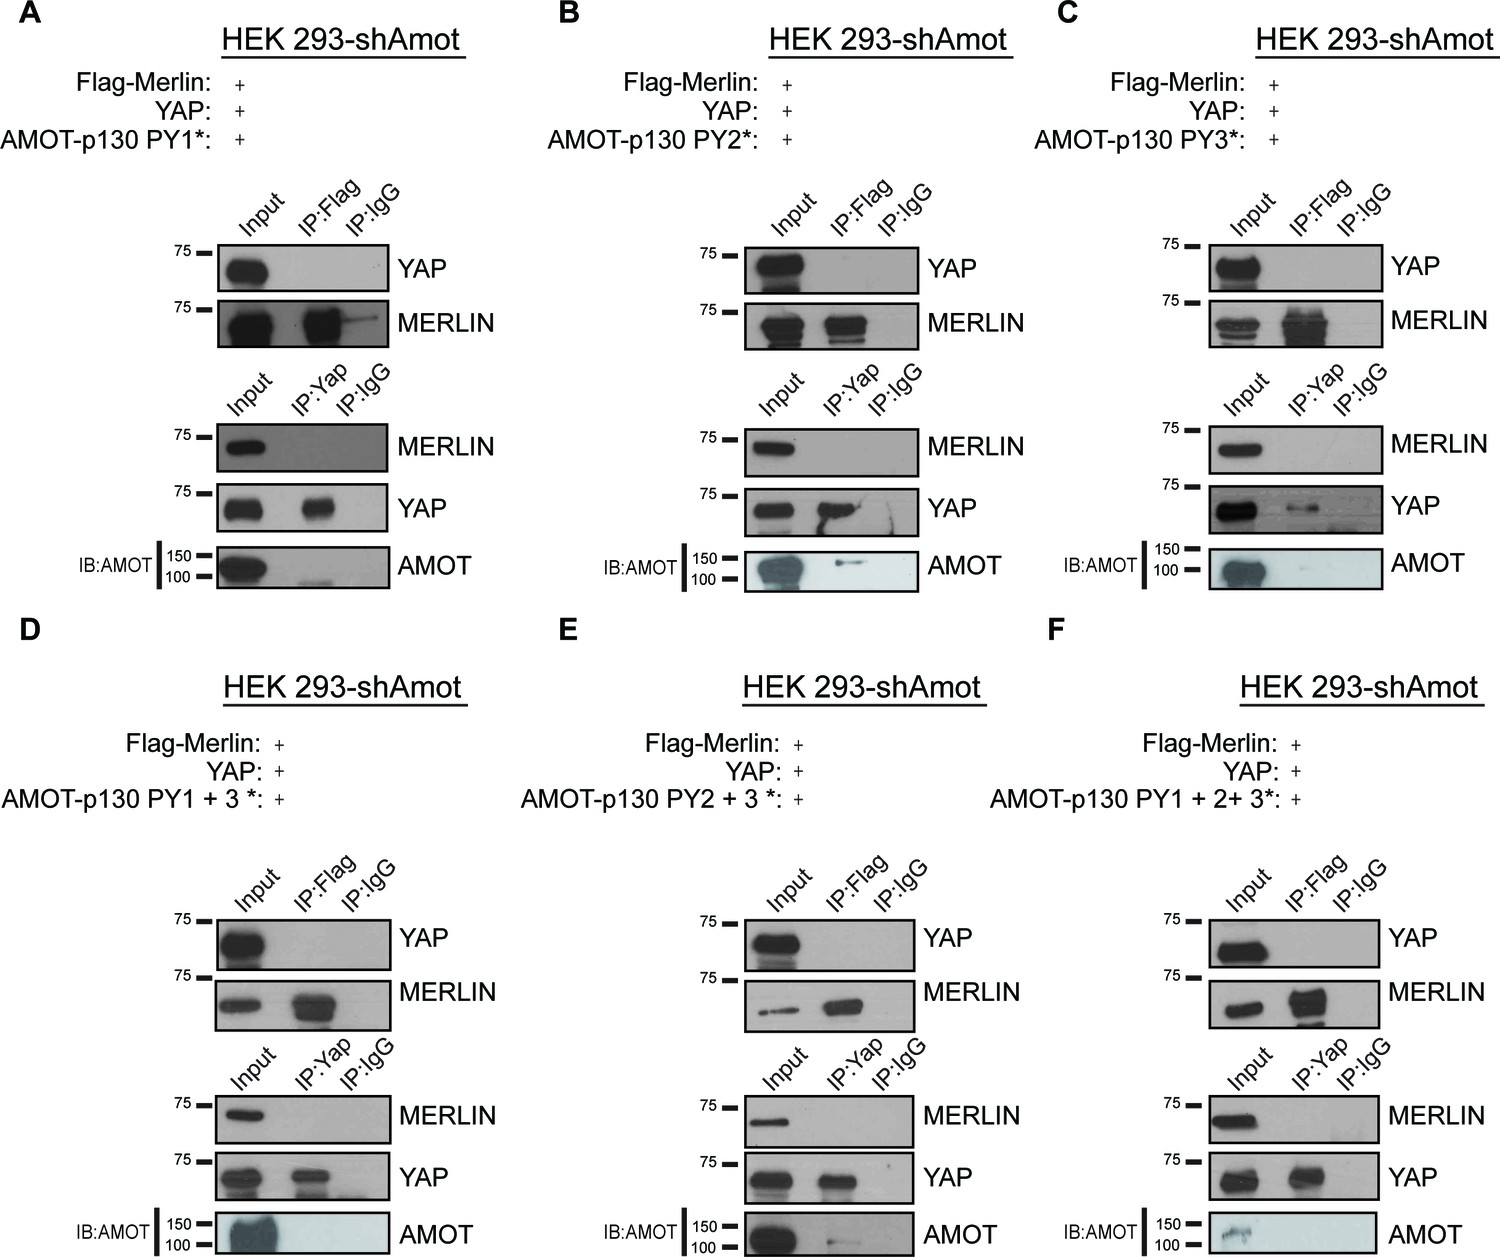
YAP/Merlin complex require Amot-p130 PPxY and LPxY motifs.
HEK293-shAmot cells were co-transfected with YAP, Flag-Merlin and (A–C) single PY motif mutant Amot-p130 (PY1*, PY2*, or PY3*), (D–E) double PY motif mutant Amot-p130 (PY1 +3* or PY2 +3*), or (F) triple PY motif mutant Amot-p130 (PY1 +2 + 3*). Total lysates (input) and YAP or Flag IPs were subjected to immunoblot analysis with anti-YAP and anti-Merlin antibodies as indicated. Immunoblot analysis was used to verify the transfection efficiency of the indicated Amot-p130 constructs in total lysates of HEK293-shAmot cells. The blots shown are representative of three independent experiments (n = 3). * indicates the number of PY mutations.
Figure 3 with 3 supplements
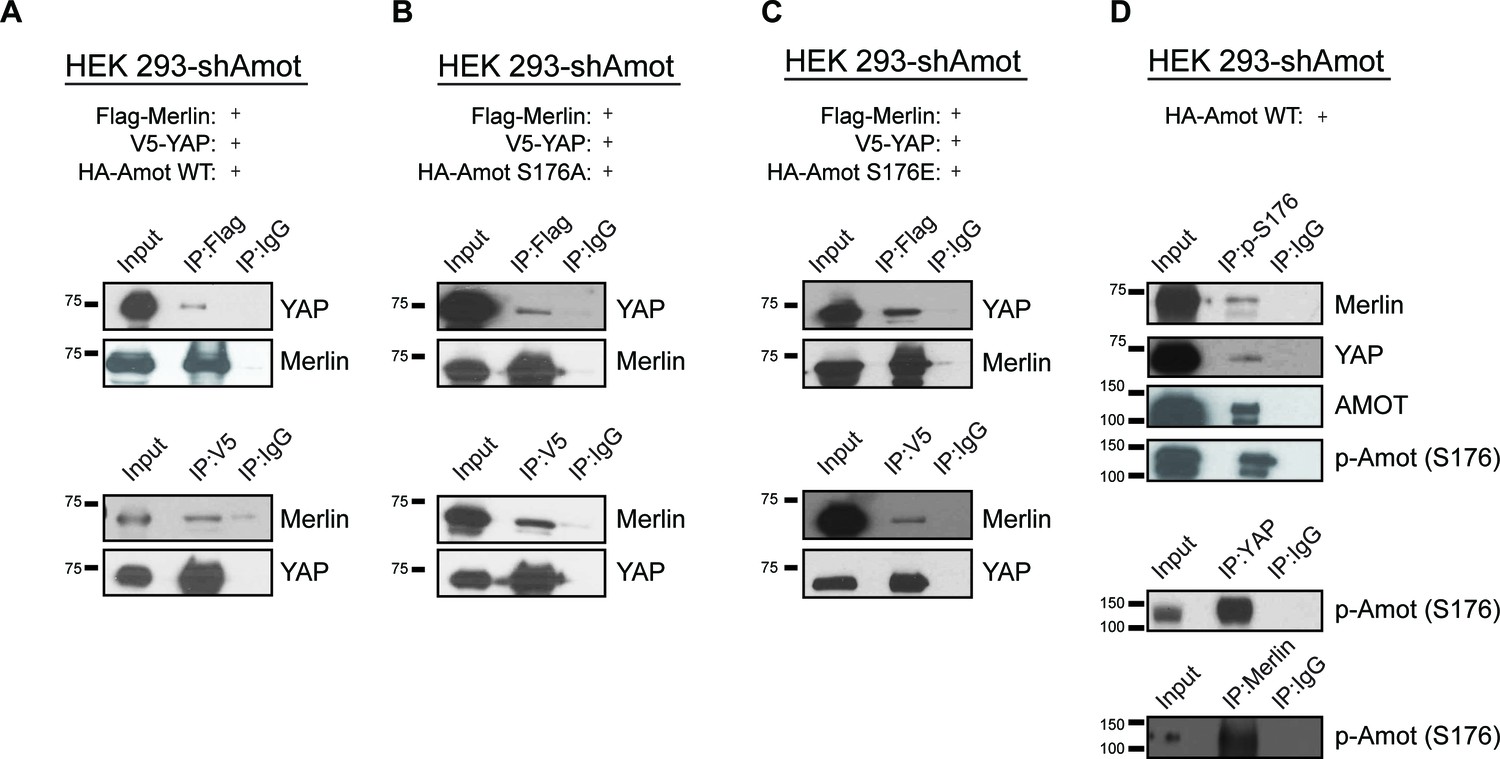
Phosphorylation status of Amot-p130S176 does not impact formation of the Amot/YAP/Merlin complex.
HEK293-shAmot cells were co-transfected with expression plasmids for Flag-Merlin, V5-YAP, and (A) HA-Amot-WT (B) HA-Amot-p130S176A or (C) HA-Amot-p130S176E. Total lysates (input) and Flag or V5 IPs were subjected to immunoblot analysis with anti-YAP and anti-Merlin antibodies as indicated. (D) HEK293-shAmot cells were co-transfected with an expression plasmid for Amot-p130. Total lysates (input) and IPs for phospho-Amot (Ser176), YAP, and Merlin were subjected to immunoblot analysis with indicated antibodies. The blots shown are representative of three independent biological replicates (n = 3).
Figure 3—figure supplement 1
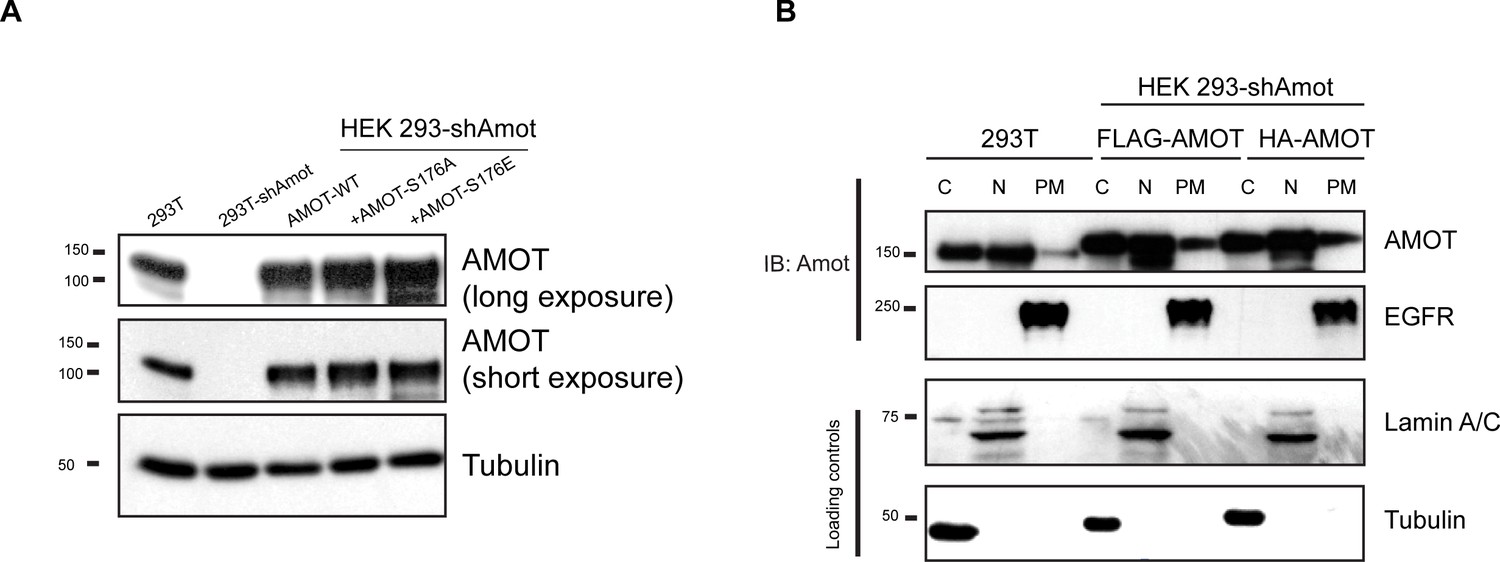
Analysis of exogenous Amot expression levels and distribution.
(A) HEK293-shAmot cells were transfected with expression plasmids for Amot-WT, Amot-p130S176A or Amot-p130S176E. Relative levels of Amot expression were assessed by western blotting with anti-Amot antibody and compared to expression of the endogenous protein (293T). Tubulin was used as a loading control. (B) HEK293T or HEK293-shAmot cells that were transfected with expression plasmids for FLAG-Amot-WT or HA-Amot-WT were fractionated in cytoplasmic (C), nuclear (N) or plasma membrane (PM) fractions. Amot was detected by anti-Amot antibody and fractionation was validated by antibodies against EGFR, Lamin A/C and tubulin. The blots shown are representative of three independent experiments (n = 3).
Figure 3—figure supplement 2
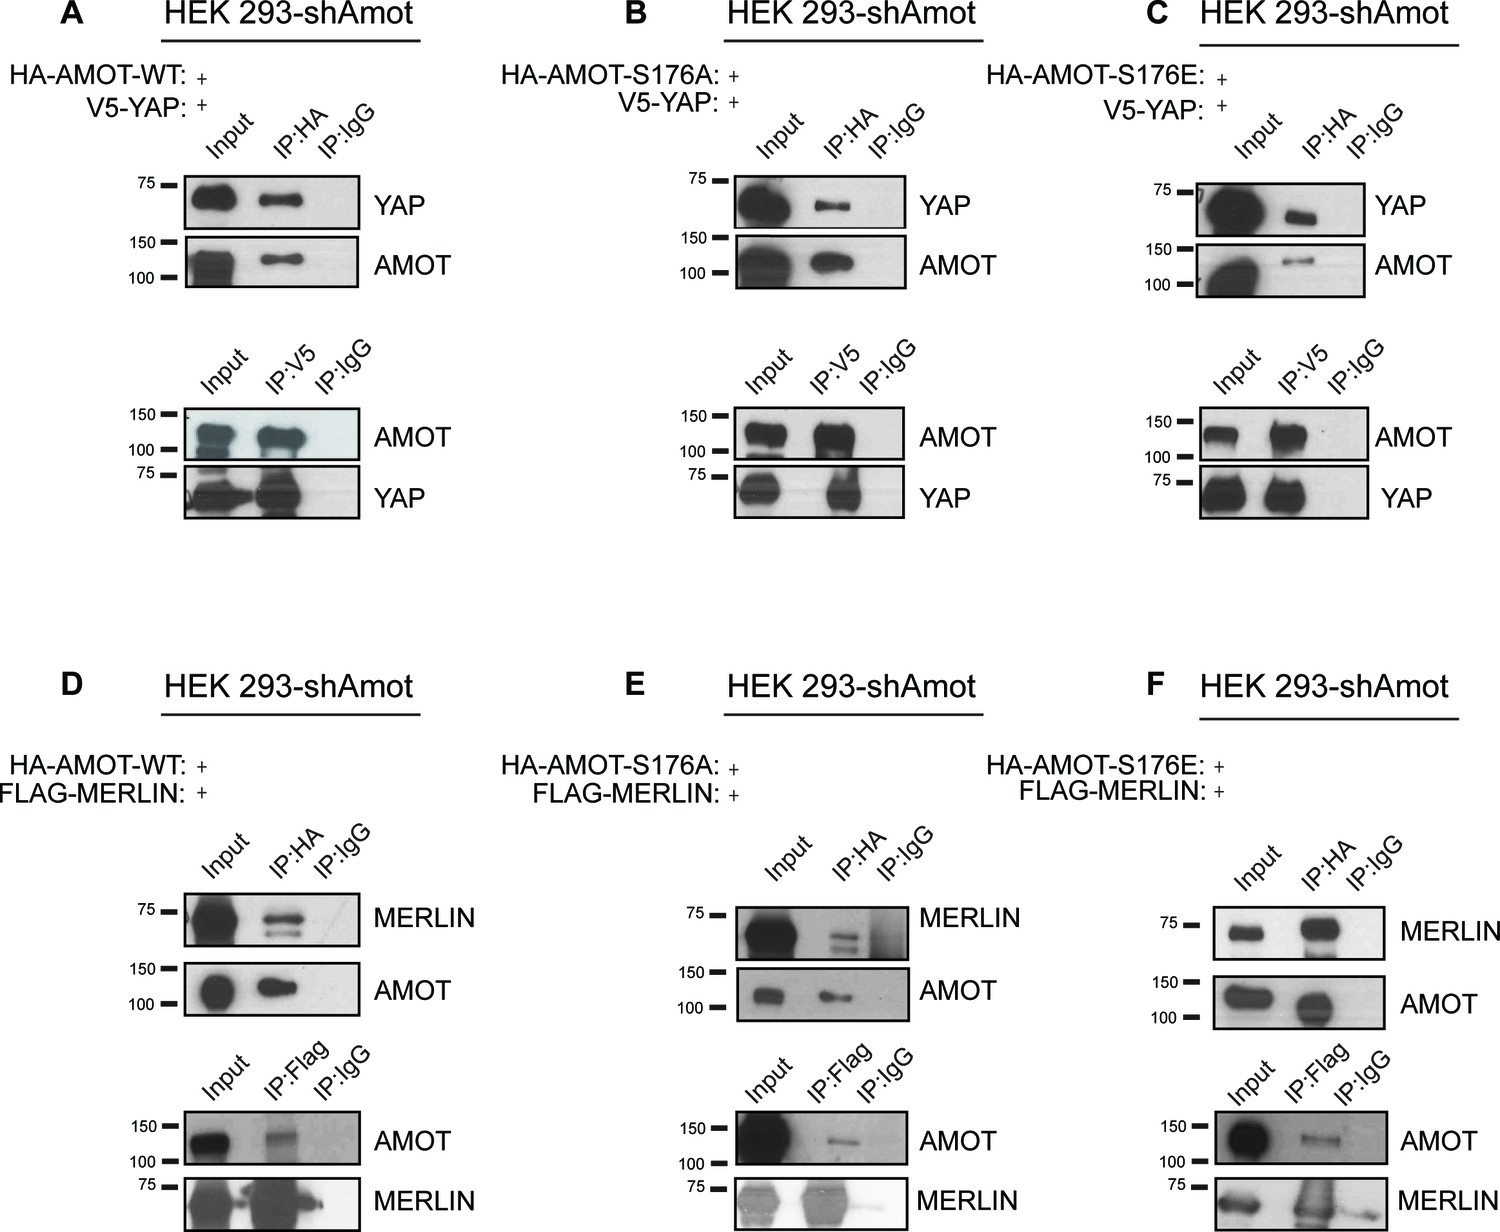
Phosphorylation of Amot does not impact formation of YAP/Amot-p130 or Merlin/Amot-p130 complexes.
(A–C) HEK293-shAmot cells were co-transfected with V5-YAP and (A) HA-Amot-WT or (B) HA-Amot-p130S176A or (C) HA-Amot-p130S176E. Total lysates (input) and V5 or HA IPs were subjected to immunoblot analysis with anti-YAP and anti-Amot antibodies as indicated. (D–F) HEK293-shAmot cells were co-transfected with Flag-Merlin and (D) HA-Amot-WT or (E) HA-Amot-p130S176A or (F) HA-Amot-p130S176E. Total lysates (input) and Flag or HA IPs were subjected to immunoblot analysis with anti-Merlin and anti-Amot antibodies as indicated. The blots shown are representative of three independent experiments (n = 3).
Figure 3—figure supplement 3
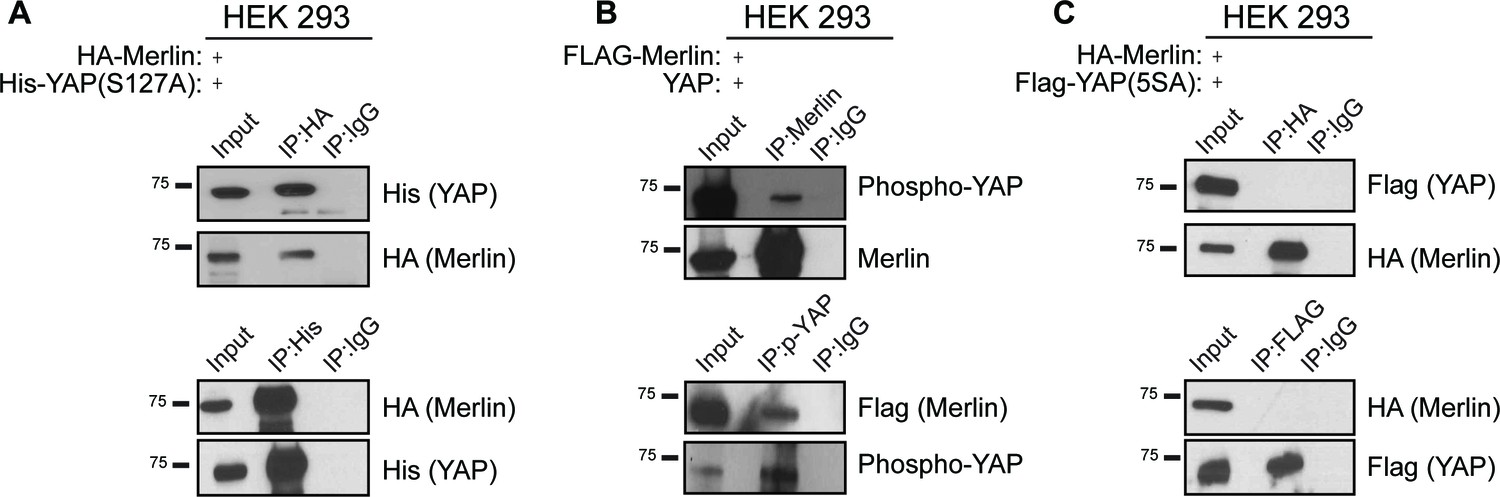
Phosphorylation of YapS127 does not impact the formation of the Amot/YAP/Merlin complex.
(A) HEK293 cells were co-transfected with expression plasmids for HA-Merlin and His-tagged constitutively active mutant of YAP (His-YapS127A). Total lysates (input) and His or HA IPs were subjected to immunoblot analysis with anti-His and anti-HA antibodies as indicated. (B) HEK293 cells were co-transfected with expression plasmids for Flag-Merlin and YAP. Total lysates (input) and Merlin or phospho-YAP IPs were subjected to immunoblot analysis with anti-phospho-YAP, Merlin and Flag antibodies as indicated. (C) HEK293 cells were co-transfected with expression plasmids for HA-Merlin and Flag-tagged constitutively active mutant of YAP (His-Yap5SA). Total lysates (input) and HA or Flag IPs were subjected to immunoblot analysis with anti-Flag and anti-HA antibodies as indicated. The blots shown are representative of three independent experiments (n = 3).
Figure 4 with 2 supplements
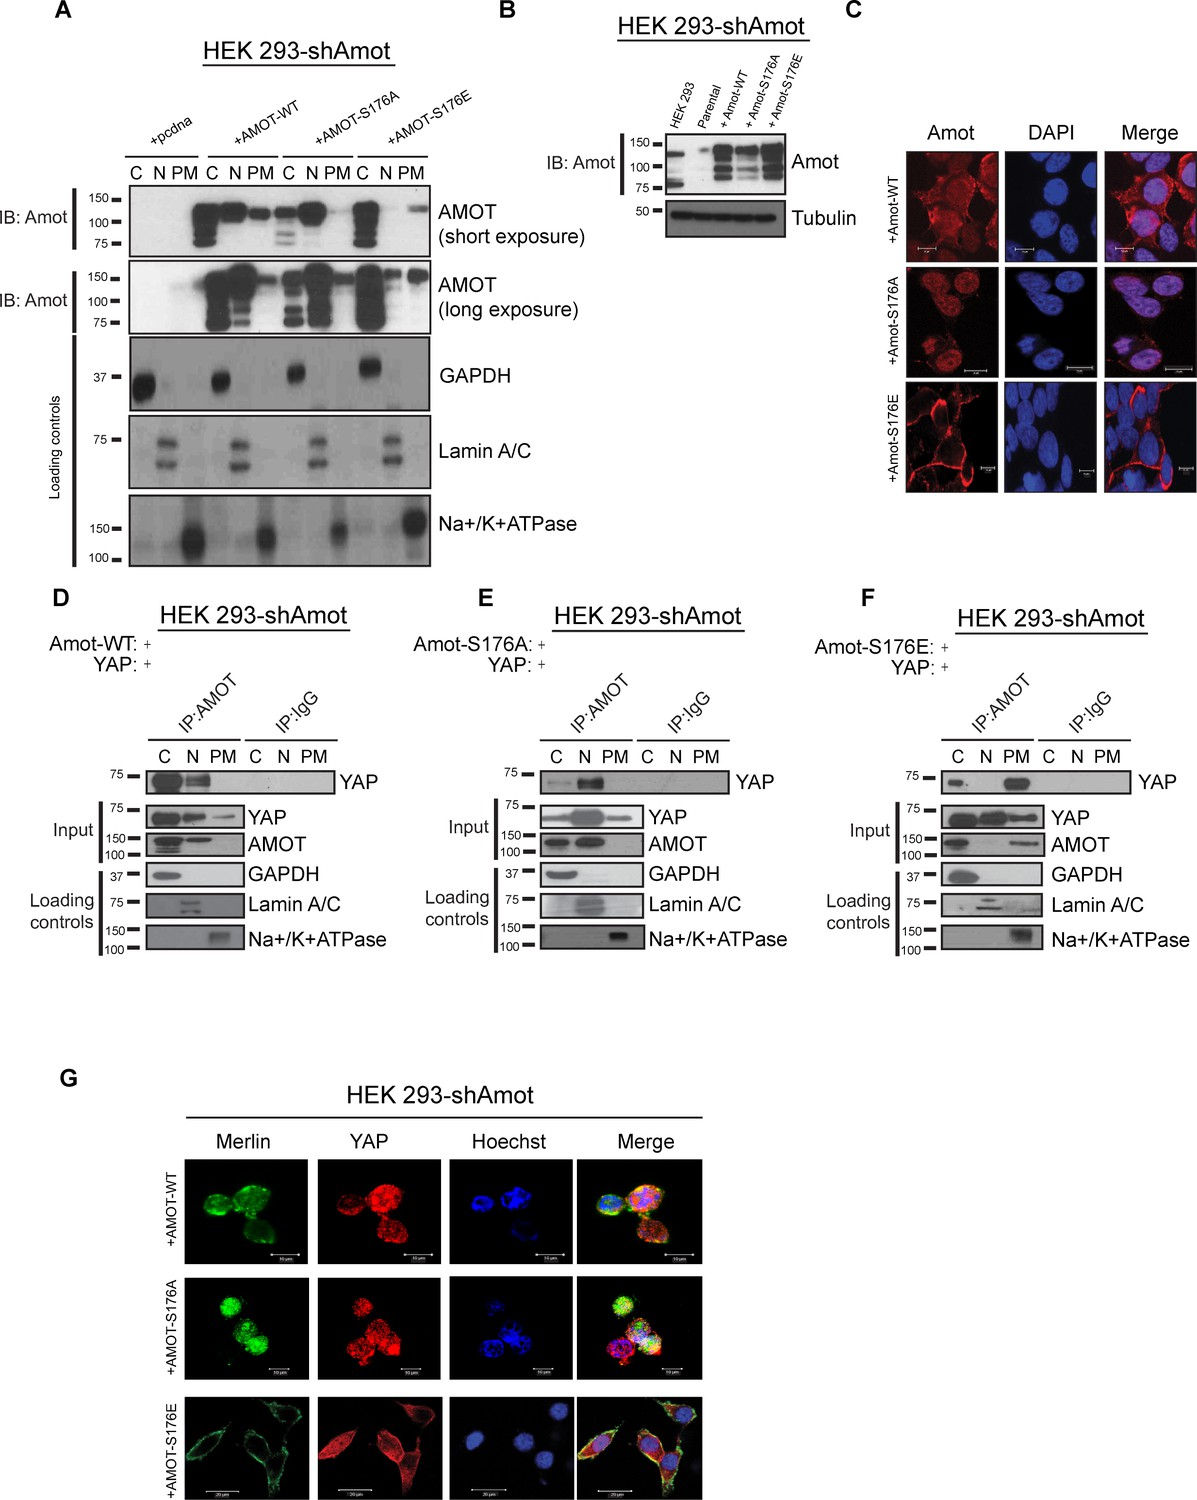
Amot-p130S176 shifts localization of the YAP/Merlin complex.
(A) Phosphorylation of Amot-p130 shifts its localization at the plasma membrane. HEK293-shAmot cells were transfected with Amot-WT, Amot-p130S176A or Amot-p130S176E expression plasmids and fractionated into cytoplasm (C), nuclear (N) and plasma membrane (PM) fractions. Immunoblot analysis was conducted using an anti-Amot antibody. GAPDH, Lamin A/C, and Na+/K+ATPase were using as controls for the cytoplasmic, nuclear, and plasma membrane fractions, respectively. (B) IB analysis was used to verify the transfection efficiency of the indicated constructs in total lysates of HEK293-shAmot cells. Tubulin was used as loading control. Blots shown are representative of three independent biological experiments (n = 3). (C) HEK293-shAmot cells were transfected with Amot-WT, Amot-p130S176A or Amot-p130S176E and subjected to immunofluorescence staining using an antibody against Amot. DAPI was used for nuclei fluorescence staining. Pictures show fields at 63x magnification and are representative of three independent biological replicates, in each of which 20 independent fields were examined. Scale bar = 10 μm. (D–F) Phosphorylation state of Amot-p130 mediates YAP localization. HEK293-shAmot cells were co-transfected with YAP and (D) Amot-WT, (E) Amot-p130S176A or (F) Amot-p130S176E and subjected to subcellular fractionation as in (A). Cell lysates (input) and Amot IPs of each one of the subcellular fractions were subjected to immunoblot analysis with anti-YAP antibodies as indicated. Loading controls were as in (A). All western blots shown are representative of three independent biological replicates (n = 3). (G) Double-immunofluorescence staining with anti-YAP and anti-Merlin antibodies on HEK293-shAmot cells transfected with expression vectors for Amot-WT, Amot-p130S176A or Amot-p130S176E. Hoechst was used for staining of nuclei. Pictures show fields at 63x magnification and are representative of three independent biological replicates, in each of which 20 independent fields were examined. Scale bar = 10 μm.
Figure 4—figure supplement 1
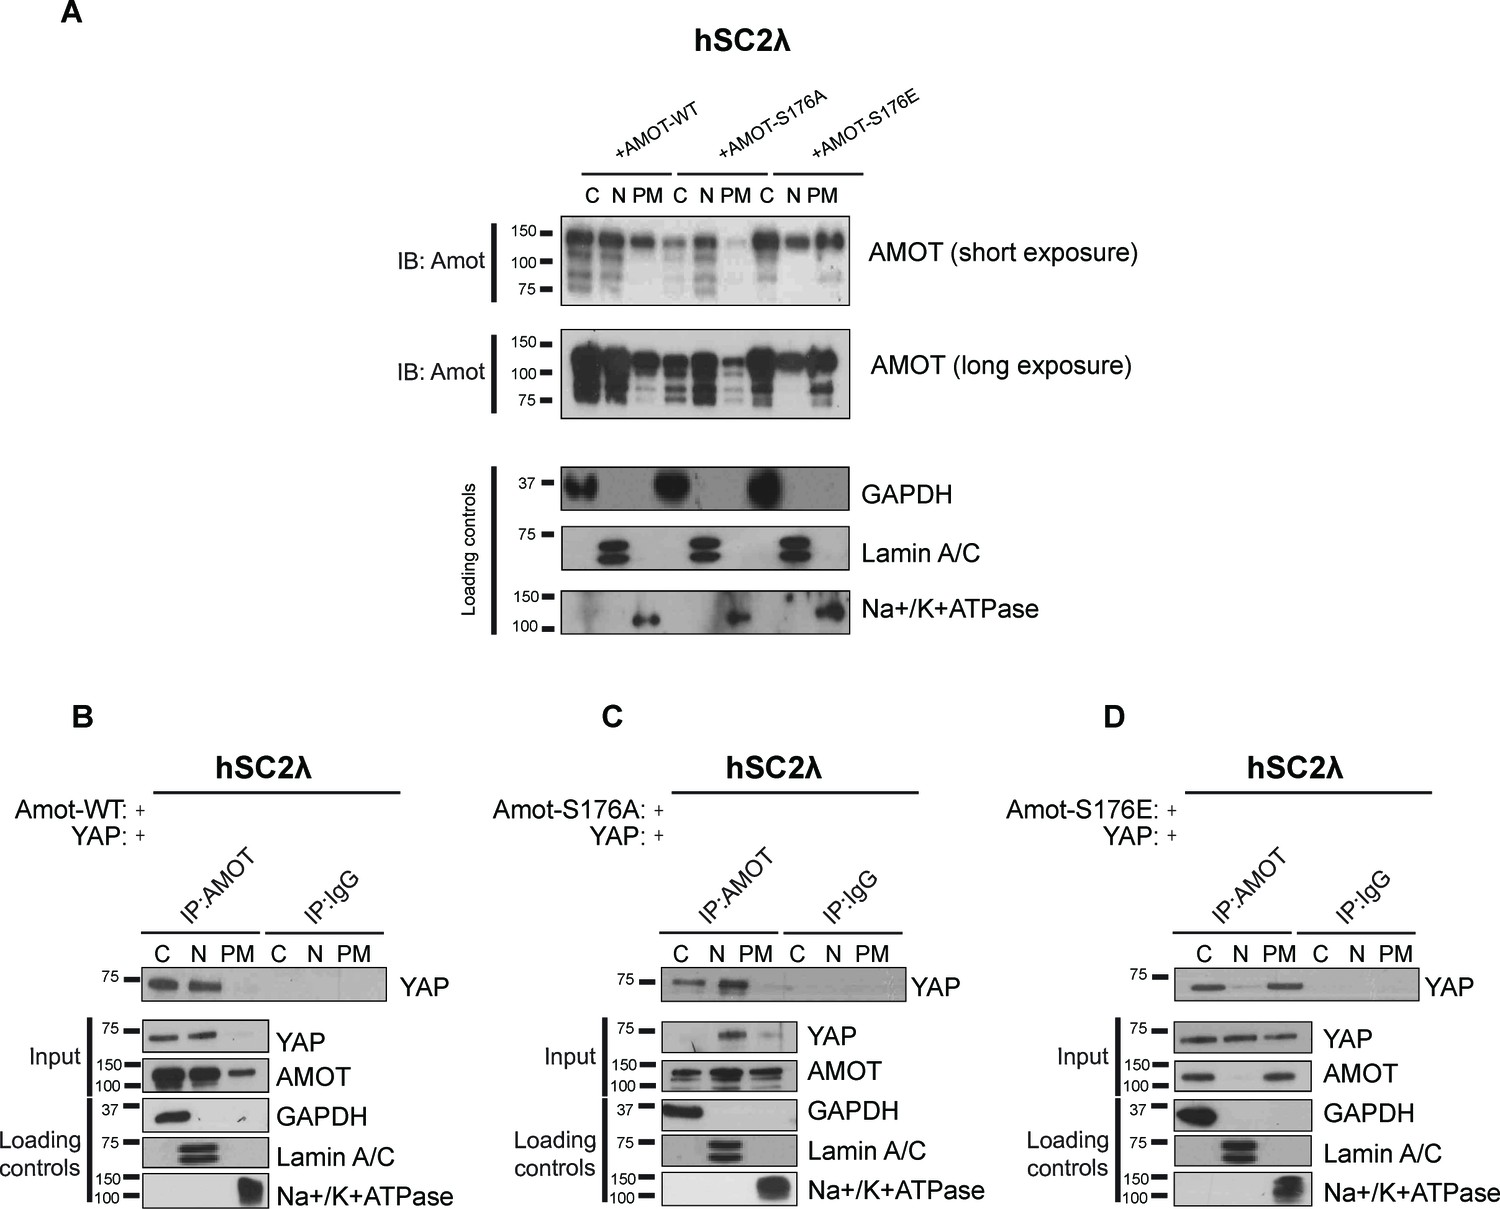
Amot phosphorylation regulates the localization of the Amot/YAP complex in human Schwann cells.
(A) Phosphorylation at Serine 176 shifts Amot-p130 localization. hSC2λ cells were transfected with Amot-WT, Amot-p130S176A or Amot-p130S176E expression plasmids and fractionated into cytoplasm (C), nuclear (N) and plasma membrane (PM) fractions. Immunoblot analysis was conducted using an anti-Amot antibody. GAPDH, Lamin A/C, and Na+/K+ATPase were using as controls for the cytoplasmic, nuclear, and plasma membrane fractions, respectively. (B–D) Phosphorylation state of Amot-p130 mediates Amot/YAP complex localization. hSC2λ cells were co-transfected with YAP and (B) Amot-WT, (C) Amot-p130S176A or (D) Amot-p130S176E and subjected to subcellular fractionation as in (A). Cell lysates (input) and Amot IPs of each one of the subcellular fractions were subjected to immunoblot analysis with anti-YAP antibodies as indicated. Loading controls were as in (A). All western blots shown are representative of three independent experiments.
Figure 4—figure supplement 2
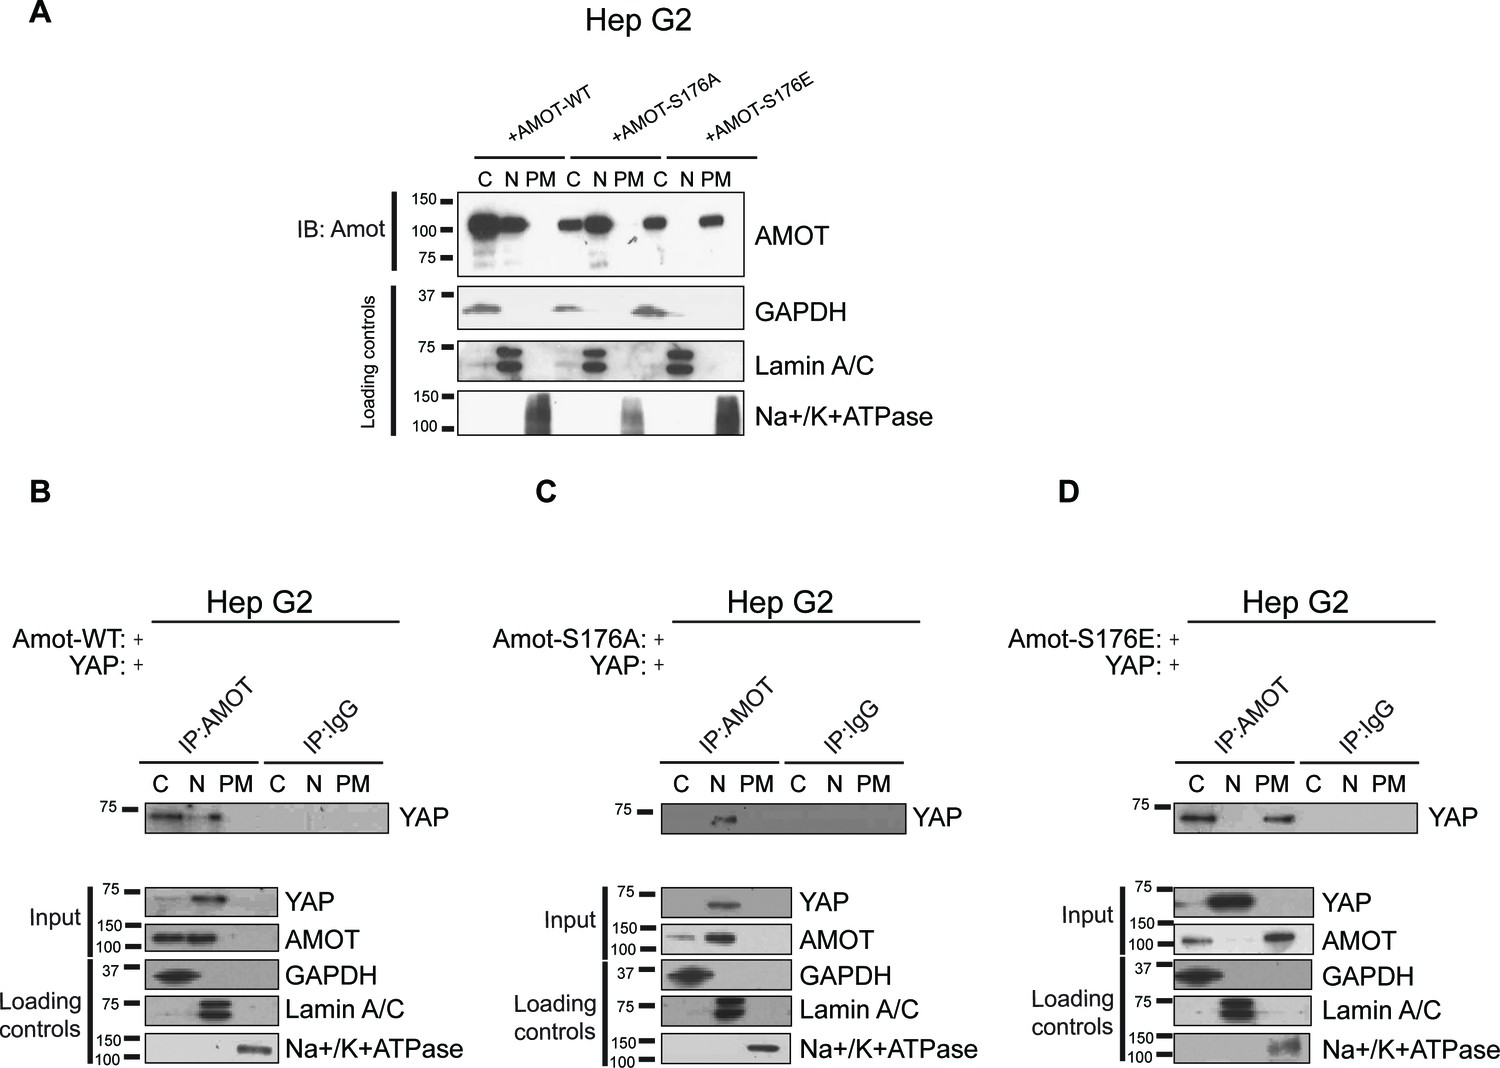
Amot phosphorylation regulates the localization of the Amot/YAP complex in human hepatocellular carcinoma cells.
(A) Phosphorylation at Serine 176 shifts Amot-p130 localization. HepG2 cells were transfected with Amot-WT, Amot-p130S176A or Amot-p130S176E expression plasmids and fractionated into cytoplasm (C), nuclear (N) and plasma membrane (PM) fractions. Immunoblot analysis was conducted using an anti-Amot antibody. GAPDH, Lamin A/C, and Na+/K+ATPase were using as controls for the cytoplasmic, nuclear, and plasma membrane fractions, respectively. (B–D) Phosphorylation state of Amot-p130 mediates Amot/YAP complex localization. HepG2 cells were co-transfected with YAP and (B) Amot-WT, (C) Amot-p130S176A or (D) Amot-p130S176E and subjected to subcellular fractionation as in (A). Cell lysates (input) and Amot IPs of each one of the subcellular fractions were subjected to immunoblot analysis with anti-YAP antibodies as indicated. Loading controls were as in (A). All western blots shown are representative of three independent biological replicates (n = 3).
Figure 5
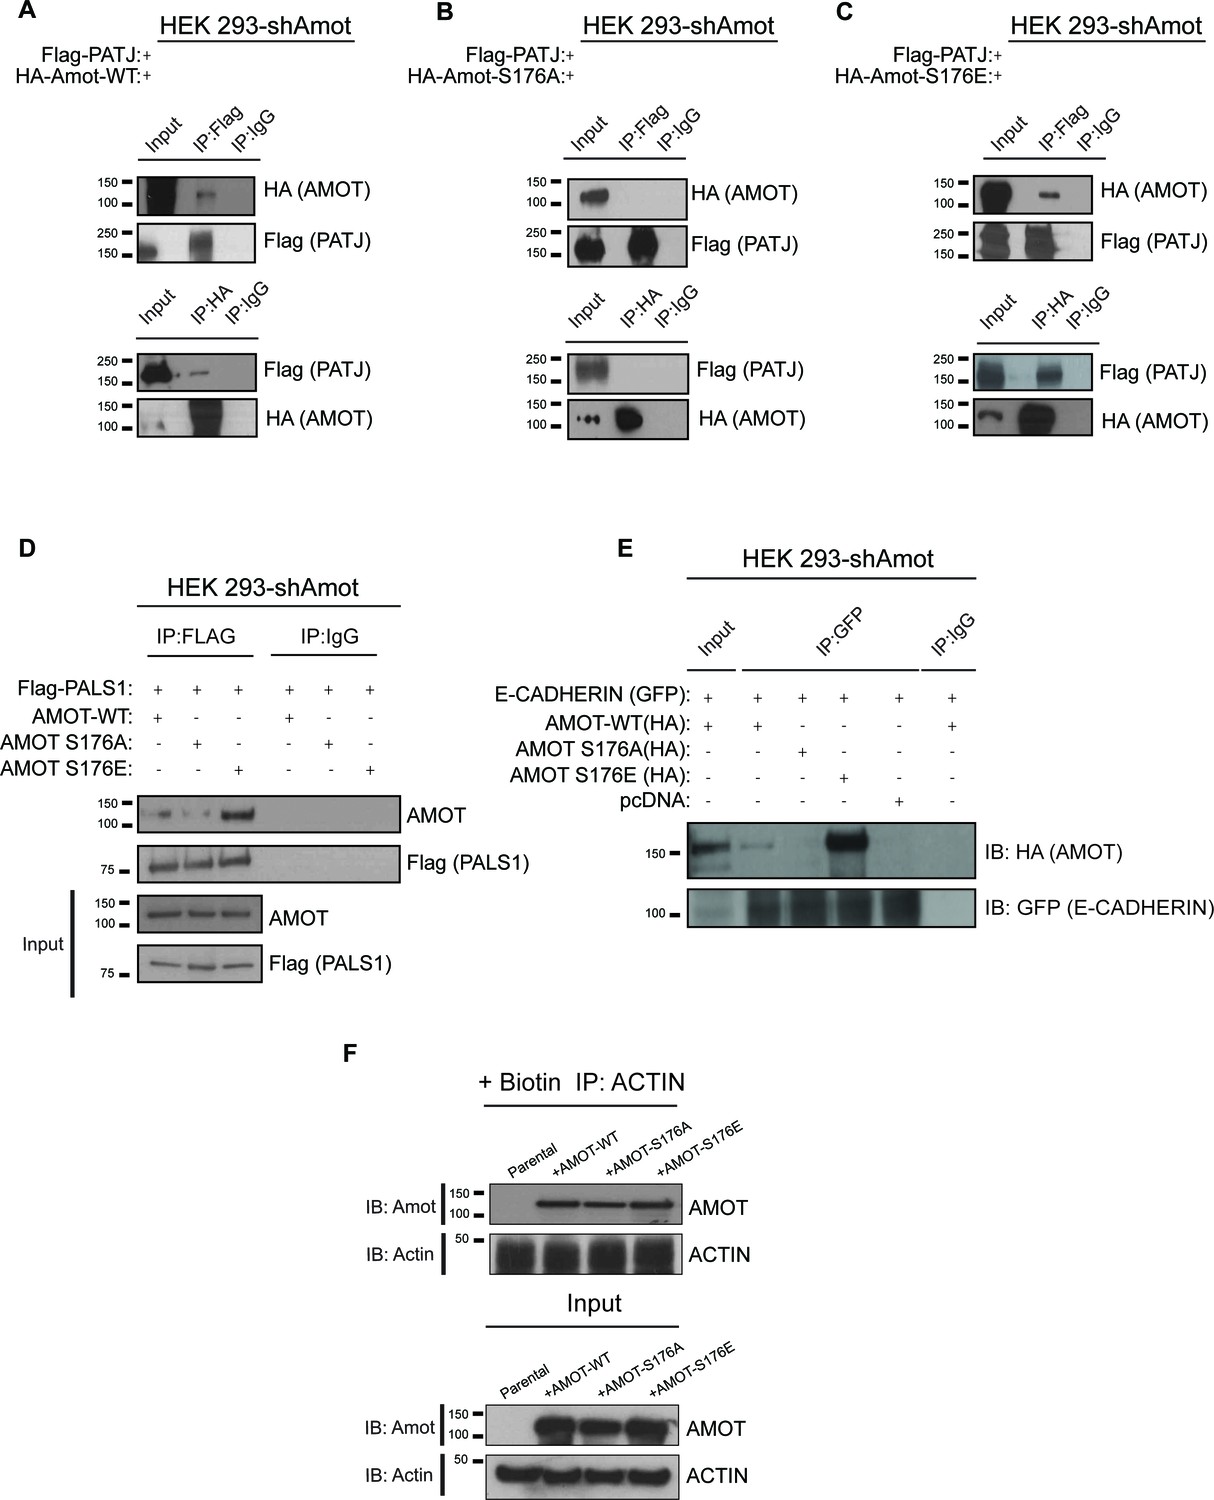
AmotS176 status impacts binding to the junctional proteins PATJ, Pals1 and E-cadherin.
HEK293-shAmot cells were co-transfected with Flag-PATJ and (A) HA-Amot-WT or (B) HA-Amot-p130S176A or (C) HA-Amot-p130S176E. Total lysates (Input) and Flag or HA IPs were subjected to immunoblot analysis with anti-HA and anti-Flag antibodies, as indicated. (D–E) HEK293-shAmot cells were co-transfected with (D) Flag-Pals1 or (E) E-cadherin and relevant Amot alleles as in panels (A–C). Total lysates (input) and Flag IP were subjected to IB analysis with anti-Amot and anti-Flag antibodies as indicated. (F) HEK293-shAmot cells were transfected with expression vectors for HA-Amot-WT, HA-Amot-p130S176A or HA-Amot-p130S176E. Cells were extracted in F-actin stabilizing buffer and F-actin was pulled down using Biotinylated-phalloidin and streptavidin-coupled magnetic beads. Pull downs were then alayzed by western blotting using anti-Amot or Actin antibodies. The blots shown are representative of three biological replicates (n = 3).
Figure 6 with 3 supplements

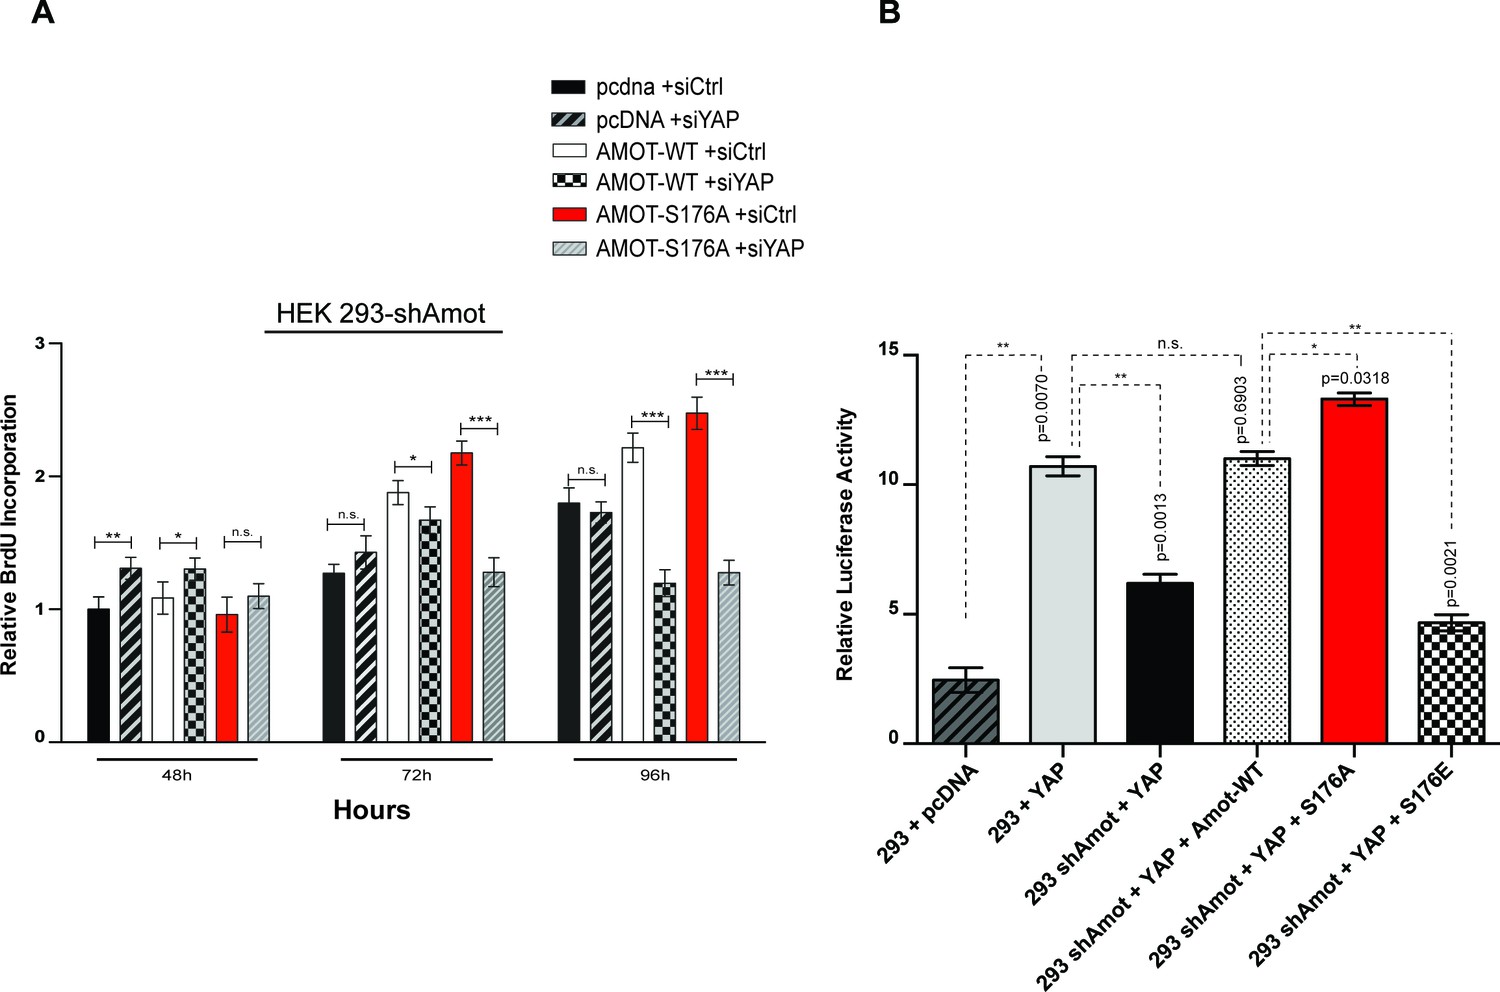
AmotS176A promotes the proliferative and transcriptional activities of YAP.
(A) AmotS176 regulates cellular proliferation. HEK293-shAmot cells were transiently transfected with indicated expression plasmids and total cell numbers were counted over 4 days. Means of each data point were calculated from three independent biological replicates conducted in triplicate. Error bars represent ±S.D. Immunoblot analysis was used to verify the transfection efficiency of the indicated Amot-p130 constructs. Tubulin was used as a loading control. The blots shown are representative of three biological replicates. (B) Amot expression drives proliferative phenotype that is YAP-dependent. HEK293-shAmot cells were co-transfected with the indicated expression plasmid and either a SMARTpool of siRNAs targeting YAP or a non-targeting control (siCtr). Levels of BrdU incorporation compared to HEK293-shAmot+pcDNA+siCtr (set to 1) were determined 48 hr, 72 hr, and 96 hr post co-transfection for all the conditions. Means were calculated from three biological replicates conducted in triplicate. Error bars represent ±S.D. Individual pairwise comparisons were assessed by Student's t-test, *p<0.05; **p<0.01; ***p<0.001; n.s. – non-significant. Exact p-values are indicated in the figure. Immunoblot analysis to confirm efficient knockdown of YAP using two independent siRNAs (siYAP-A and siYAP-B) (see Figure S6) and efficient overexpression of the indicated Amot-p130 constructs in HEK293-shAmot cells. Tubulin was used as a loading control. The blots shown are representative of three biological replicates (n = 3). (C) Amot-p130 serine 176 does not affect Rac1 activation. IB analysis of cell lysates from HEK293-shAmot cells expressing Amot-WT, Amot-p130S176A or Amot-p130S176E with anti-Rac1-GTP, anti-Rac1 and anti-Amot antibodies as indicated. Tubulin was used as a loading control. Cells were serum starved overnight and stimulated with 10 ng/mL EGF for 5’. The blots shown are representative of three biological replicates (n = 3). (D) AmotS176 status regulates YAP transcriptional activity. HEK293 and HEK293-shAmot cells were transfected with indicated constructs and HIP-flash or HOP-flash reporters. Reporter’s firefly luciferase activity was normalized to the levels of Renilla luciferase used as an internal control. The means of luciferase activity were calculated from three biological replicates conducted in quadruplicate. Error bars represent ±S.D. Individual pairwise comparisons were assessed by Student's t-test, **p<0.01; ***p<0.001; n.s. – non-significant. Exact p-values are indicated in the figure. (E) Immunoblot analysis showing efficient transfection of Amot-p130, Amot-p130 mutants, and YAP in cell lysates used in (D). Tubulin was used as a loading control. The blots shown are representative of three biological replicates. (F) AmotS176 status regulates expression of endogenous YAP targets. Expression of the YAP target genes Areg and ApoE was probed in HEK293-shAmot cells expressing Amot-WT, Amot-p130S176A or Amot-p130S176E by quantitative real-time PCR. mRNA levels were compared with the empty vector control (set to 1). Means were calculated from Ct values in three independent biological replicates conducted in triplicate. GAPDH was used to normalize for variances in input cDNA. See Table 1. Error bars represent ±S.D. Individual pairwise comparisons were assessed by Student's t-test, **p<0.01; ***p<0.001; n.s. – non-significant. Exact p-values are indicated in the figure.
-
Figure 6—source data 1
Cell counts for HEK293 cells, treated as described Figure 6A.
- https://doi.org/10.7554/eLife.23966.016
Figure 6—figure supplement 1
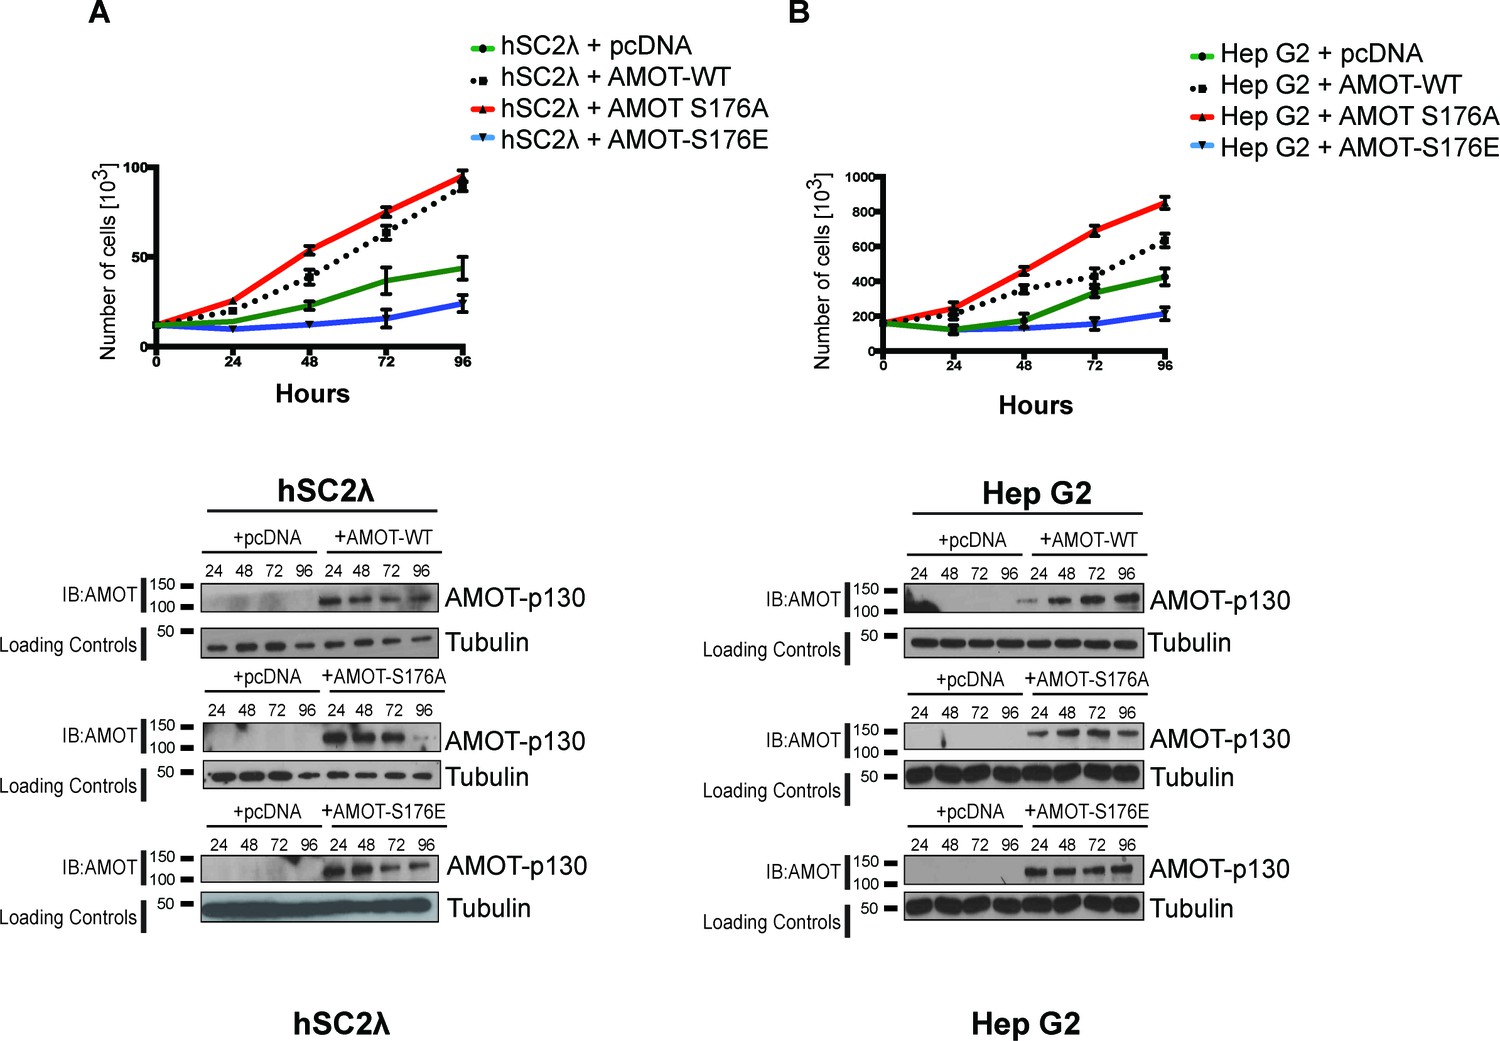
AmotS176A promotes proliferation of human Schwann and hepatocellular carcinoma cells.
(A) hSC2λ or (B) HepG2 cells were cells were transiently transfected with indicated expression plasmids and total cell numbers were counted over 4 days (top). Means of each data point were calculated from three independent biological replicates conducted in triplicate. Error bars represent ±S.D. Immunoblot analysis was used to verify the transfection efficiency of the indicated Amot-p130 constructs (bottom). Tubulin was used as a loading control. The blots shown are representative of three biological replicates.
-
Figure 6—figure supplement 1—source data 1
Cell counts for hSCλ cells, treated as described in Figure 6—figure supplement 1.
- https://doi.org/10.7554/eLife.23966.018
-
Figure 6—figure supplement 1—source data 2
Cell counts for hSCλ cells, treated as described Figure 6—figure supplement 1.
- https://doi.org/10.7554/eLife.23966.019
Figure 6—figure supplement 2
Amot-p130S176 pro-proliferative phenotype is YAP dependent and regulates YAP transcriptional activity.
(A) HEK293-shAmot cells were co-transfected with the indicated plasmid DNAs and siRNAs. Fold variation of BrdU incorporation compared to HEK293-shAmot+pcDNA+siCtr (set to 1) was determined 48 hr, 72 hr, and 96 hr post co-transfection for all the conditions. Means were calculated from three independent biological replicates conducted in triplicate (n = 9). Error bars represent ±S.D. (n = 9). Individual pairwise comparisons were assessed using Student's t-test, *p<0.05; **p<0.01; ***p<0.001; n.s. – non-significant. (B) HEK293 and HEK293-shAmot cells were transfected with indicated constructs and GTIIC-luc reporter. Reporter luciferase activity was normalized to levels of Renilla luciferase used as an internal reporter control. Means of luciferase activity were calculated from three independent biological replicates conducted in quadruplicate (n = 12). Error bars represent ±S.D. Individual pairwise comparisons were assessed using Student's t-test, *p<0.05; **p<0.01; ***p<0.001; n.s. – non-significant. Exact p-values are indicated in the figure.
-
Figure 6—figure supplement 2—source data 1
Counts for BrdU incoporation.
Cells treated as described in Figure 6—figure supplement 2A.
- https://doi.org/10.7554/eLife.23966.021
-
Figure 6—figure supplement 2—source data 2
Counts for luciferase activity.
Cells treated as described in Figure 6—figure supplement 2B.
- https://doi.org/10.7554/eLife.23966.022
Figure 6—figure supplement 3
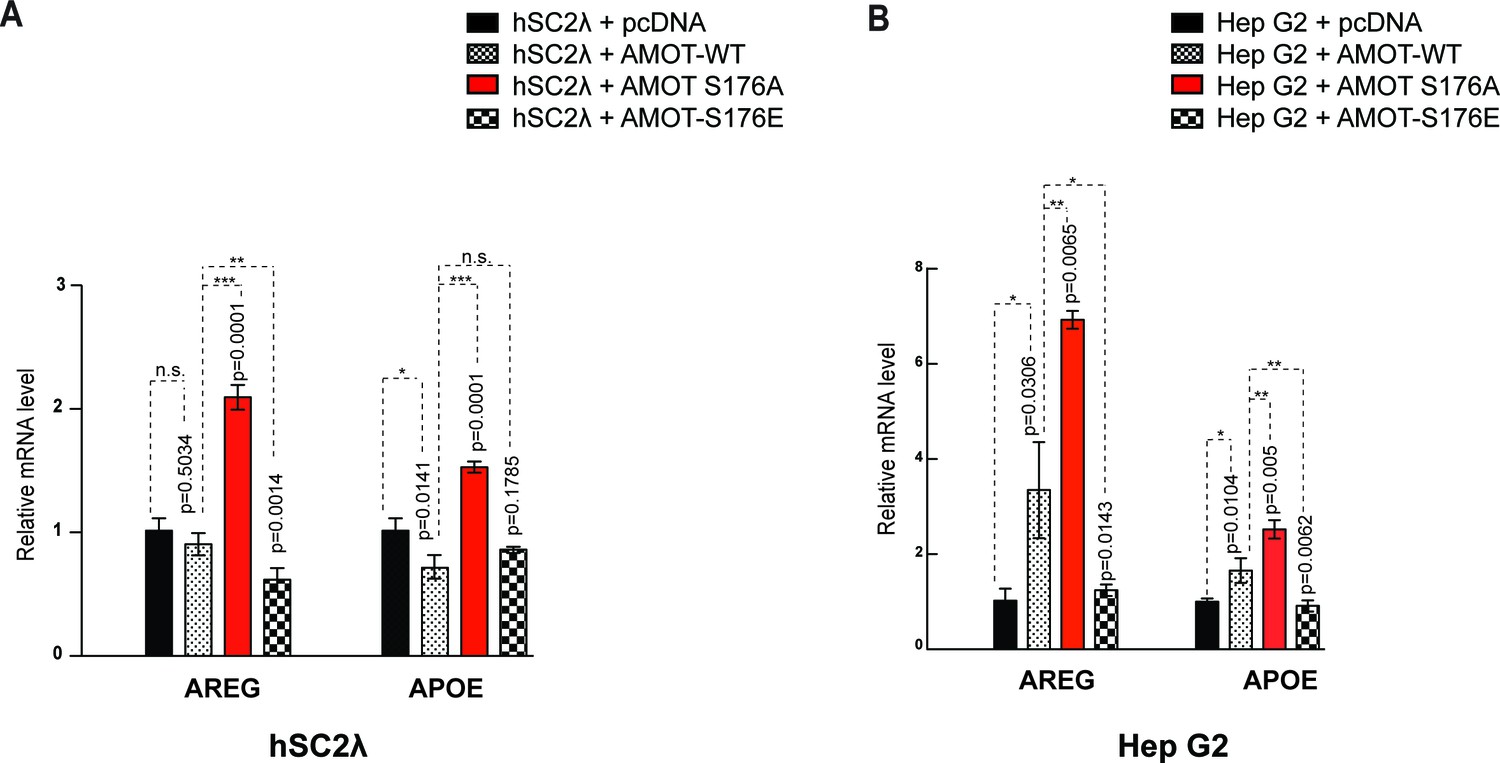
Amot-p130S176 regulates YAP transcriptional activity.
Expression of the YAP target genes Areg and ApoE was assessed by quantitative real-time PCR in (A) hSC2λ or (B) HepG2 cells co-transfected with the indicated plasmid DNAs and siRNAs. Areg and ApoE mRNA levels were compared with the empty vector control (pCDNA, set to 1). Means were calculated from Ct values in three independent biological replicates conducted in triplicate. GAPDH was used to normalize for variances in input cDNA. See Table 1. Error bars represent ±S.D. Individual pairwise comparisons were assessed by Student's t-test, **p<0.01; ***p<0.001; n.s. – non-significant. Exact p-values are indicated in the figure.
-
Figure 6—figure supplement 3—source data 1
Source data for qPCR analysis of AREG expression in hSC-lambda cells.
Analysis as described in Figure 6—figure supplement 3.
- https://doi.org/10.7554/eLife.23966.024
-
Figure 6—figure supplement 3—source data 2
Source data for qPCR analysis of APOE expression in hSC-lambda cells.
Analysis as described in Figure 6—figure supplement 3.
- https://doi.org/10.7554/eLife.23966.025
-
Figure 6—figure supplement 3—source data 3
Source data for qPCR analysis of AREG expression in HepG2 cells.
Analysis as described in Figure 6—figure supplement 3.
- https://doi.org/10.7554/eLife.23966.026
-
Figure 6—figure supplement 3—source data 4
Source data for qPCR analysis of APOE expression in HepG2 cells.
Analysis as described in Figure 6—figure supplement 3.
- https://doi.org/10.7554/eLife.23966.027
Figure 7
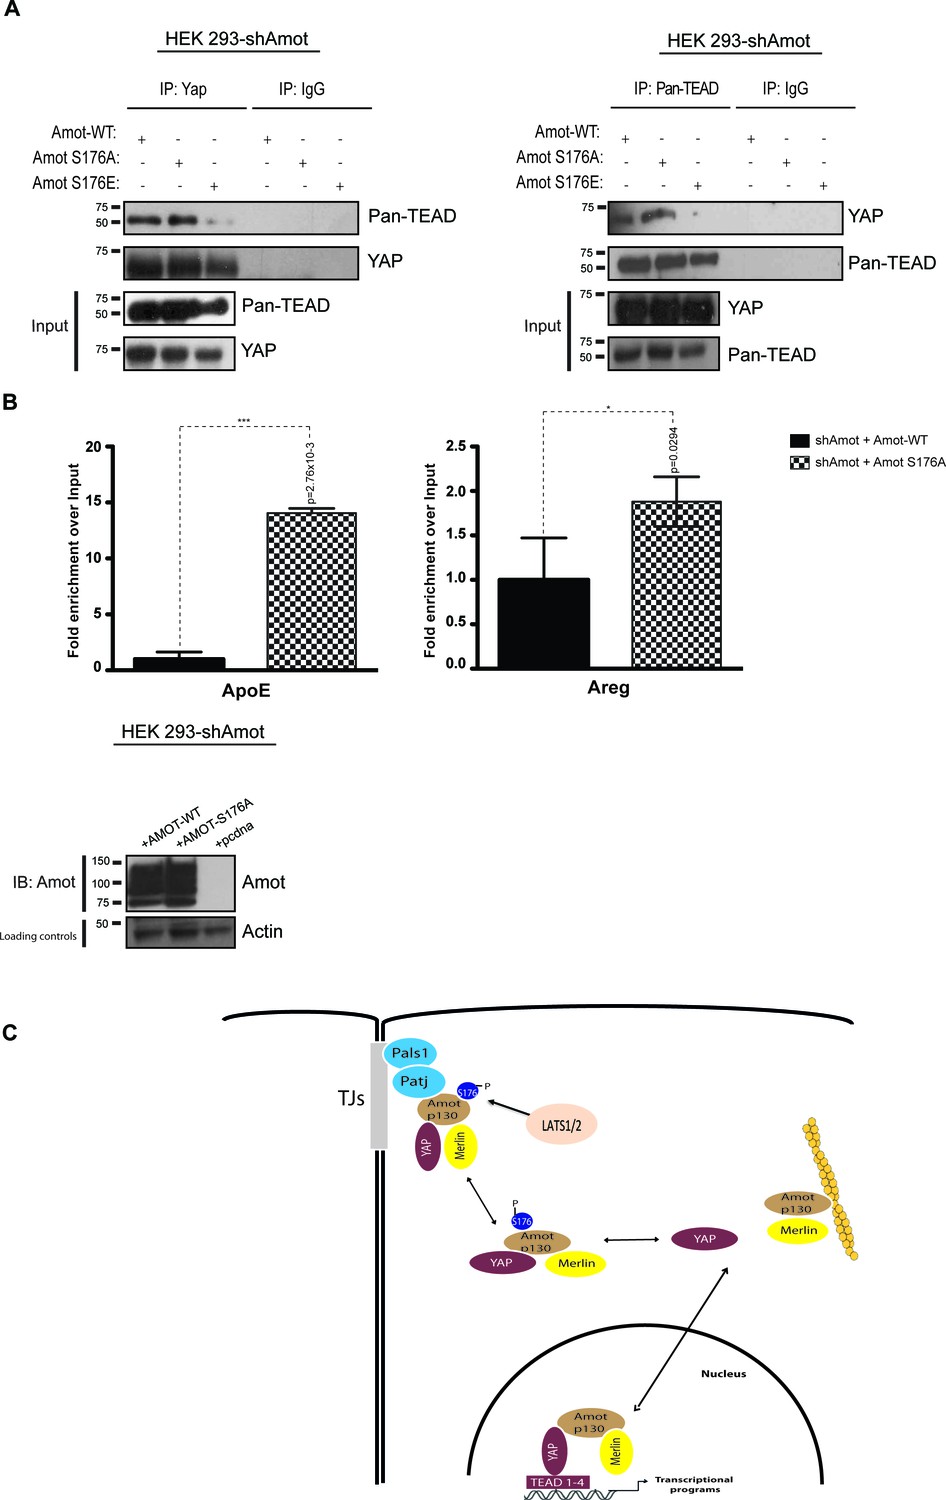
AmotS176A but not AmotS176E is required for formation of the nuclear Yap-Tead complex.
HEK293-shAmot cells were co-transfected with Amot-WT or Amot-p130S176A or Amot-p130S176E. Total lysates (Input) and Pan-Tead or YAP IPs were subjected to immunoblot analysis with anti-Pan-Tead or anti-YAP antibodies, as indicated. The blots shown are representative of three independent biological replicates. (B) ChIP analysis of HEK293T-shAmot cells transfected with Amot-WT, Amot-p130S176A or an empty vector control. Real-time quantitative PCR was performed in eluted DNA using primers targeting the promoter regions of ApoE and Areg. See Table 2. The data show the means ±s.e.m. from three independent biological replicates (n = 3). Individual pairwise comparisons were assessed by Student's t-test, **p<0.01; ***p<0.001; n.s. – non-significant. Exact p-values are indicated in the figure. (C) Proposed model for YAP-Merlin complex regulation by AmotS176. Hypophosphorylation of AmotS176 promotes translocation of the Amot-p130/YAP/Merlin complex from the cytoplasm to the nucleus where it binds to TEADs and activates YAP-dependent transcriptional programs. Conversely, phosphorylation of AmotS176 induces cytoplasmic sequestration and plasma membrane localization of the tertiary complex. At the membrane, the complex associates with the junctional proteins Patj and Pals1 and YAP’s nuclear functions are inhibited. S176 in blue indicates phosphorylation.
-
Figure 7—source data 1
Source data for qPCR analysis of ApoE expression in HEK293 cells.
Analysis as described in Figure 7B.
- https://doi.org/10.7554/eLife.23966.030
-
Figure 7—source data 2
Source data for qPCR analysis of AREG expression in HEK293 cells.
Analysis as described in Figure 7B.
- https://doi.org/10.7554/eLife.23966.031
Tables
Table 1
Primer sequences used in qPCR.
| Gene | Primers | |
|---|---|---|
| Forward | Reverse | |
| Amot | 5’-CAGCTTGCAGAGAAGGAATATGAG-3’ | 5’-CTGGCTTTCTTTATTTTTTGCAAAG-3’ |
| ApoE | 5’-AGGAACTGAGGGCGCTGA-3’ | 5’-AGTTCCGATTTGTAGGCCTTCA-3’ |
| Areg | 5’-TGATCCTCACAGCTGTTGCT-3’ | 5’-TCCATTCTCTTGTCGAAGTTTCT-3’ |
| GAPDH | 5’ – GATCATCAGCAATGCCTCCT-3’ | 5’ – TGTGGTCATGAGTCCTTCCA-3’ |
Table 2
Primer sequences used in CHIP.
| Gene | Primers | |
|---|---|---|
| Forward | Reverse | |
| ApoE | GCGTTCACTGTGGCCTGTCCA | GCATGGAGGACAGCCCTGGC |
| Areg | TGTTCTTCCCAGAAACCCTC | TTTACCTACACCATCTCACAGC |
Download links
A two-part list of links to download the article, or parts of the article, in various formats.
Downloads (link to download the article as PDF)
Open citations (links to open the citations from this article in various online reference manager services)
Cite this article (links to download the citations from this article in formats compatible with various reference manager tools)
Regulation of localization and function of the transcriptional co-activator YAP by angiomotin
eLife 6:e23966.
https://doi.org/10.7554/eLife.23966


