Longevity is impacted by growth hormone action during early postnatal period
- University of Alabama at Birmingham, United States
- Southern Illinois University, School of Medicine, United States
- Leiden University Medical Center, Netherlands
- University of Central Florida, United States
- The Greater Poland Cancer Centre, Poland
Figures
Figure 1
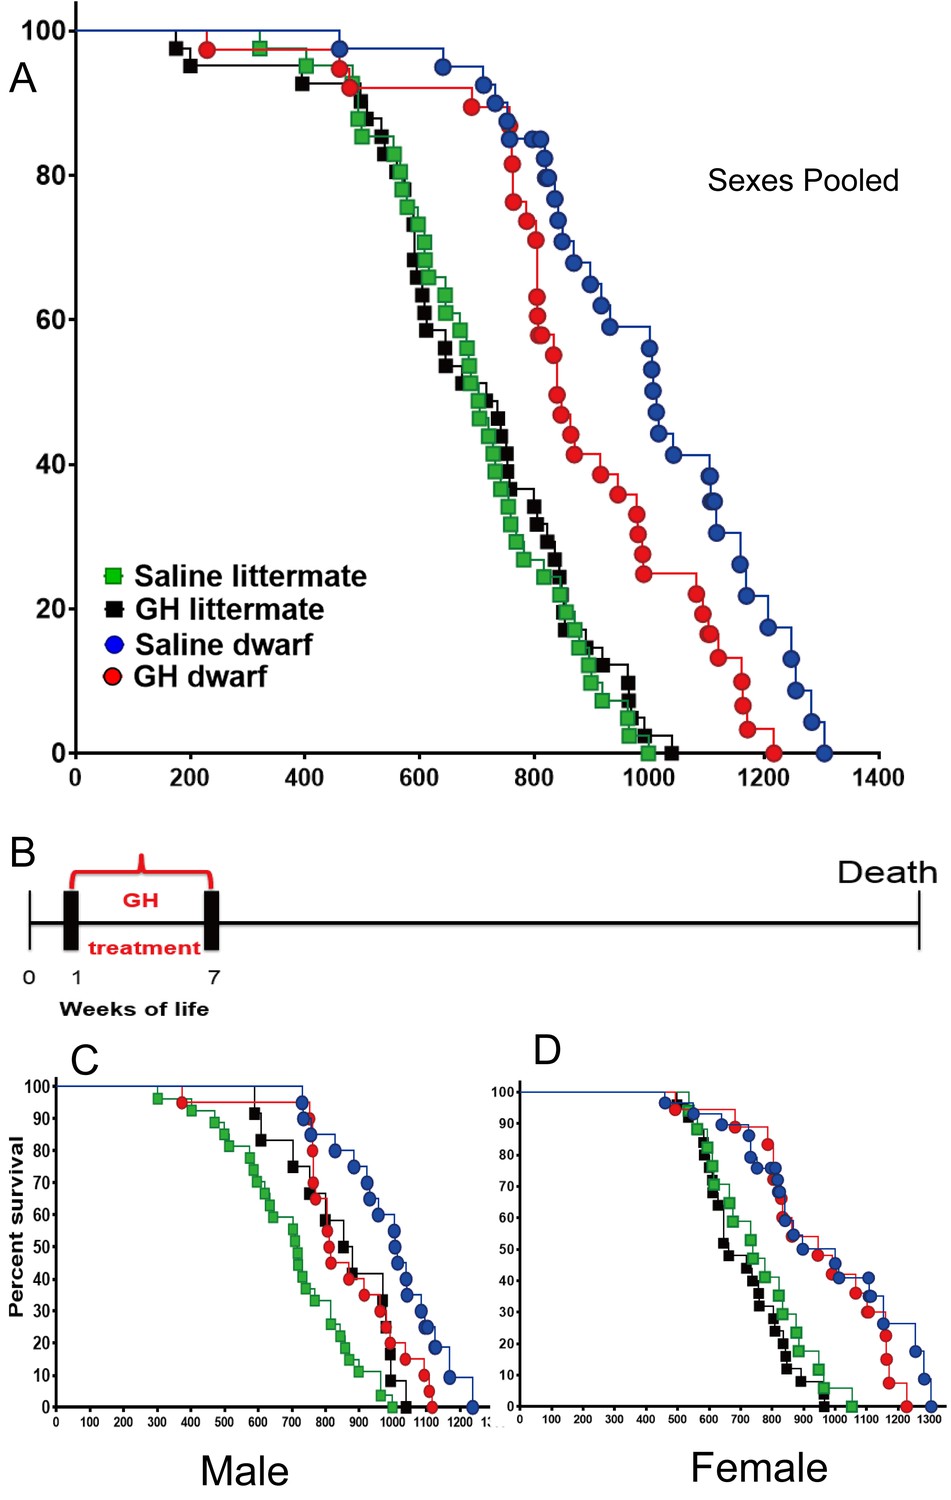
Effects of early-life GH treatment on longevity starting at the first postnatal week.
(A) Sex pooled Kaplan-Meier survival curves for each treatment and genotype: Ames dwarf (Prop1df/df) and Littermate control mice treated with either vehicle (saline) or GH; each point represents a single mouse. N = 41 for control mice groups with Saline; N = 41 for control mice groups with GH; N = 31 for dwarf mice groups with Saline and N = 36 for dwarf mice groups with GH. (B) Experimental scheme detailing administration time of GH and vehicle treatment between postnatal first and seventh week. (C) Male survival curves. (D) Female survival curves.
Figure 2
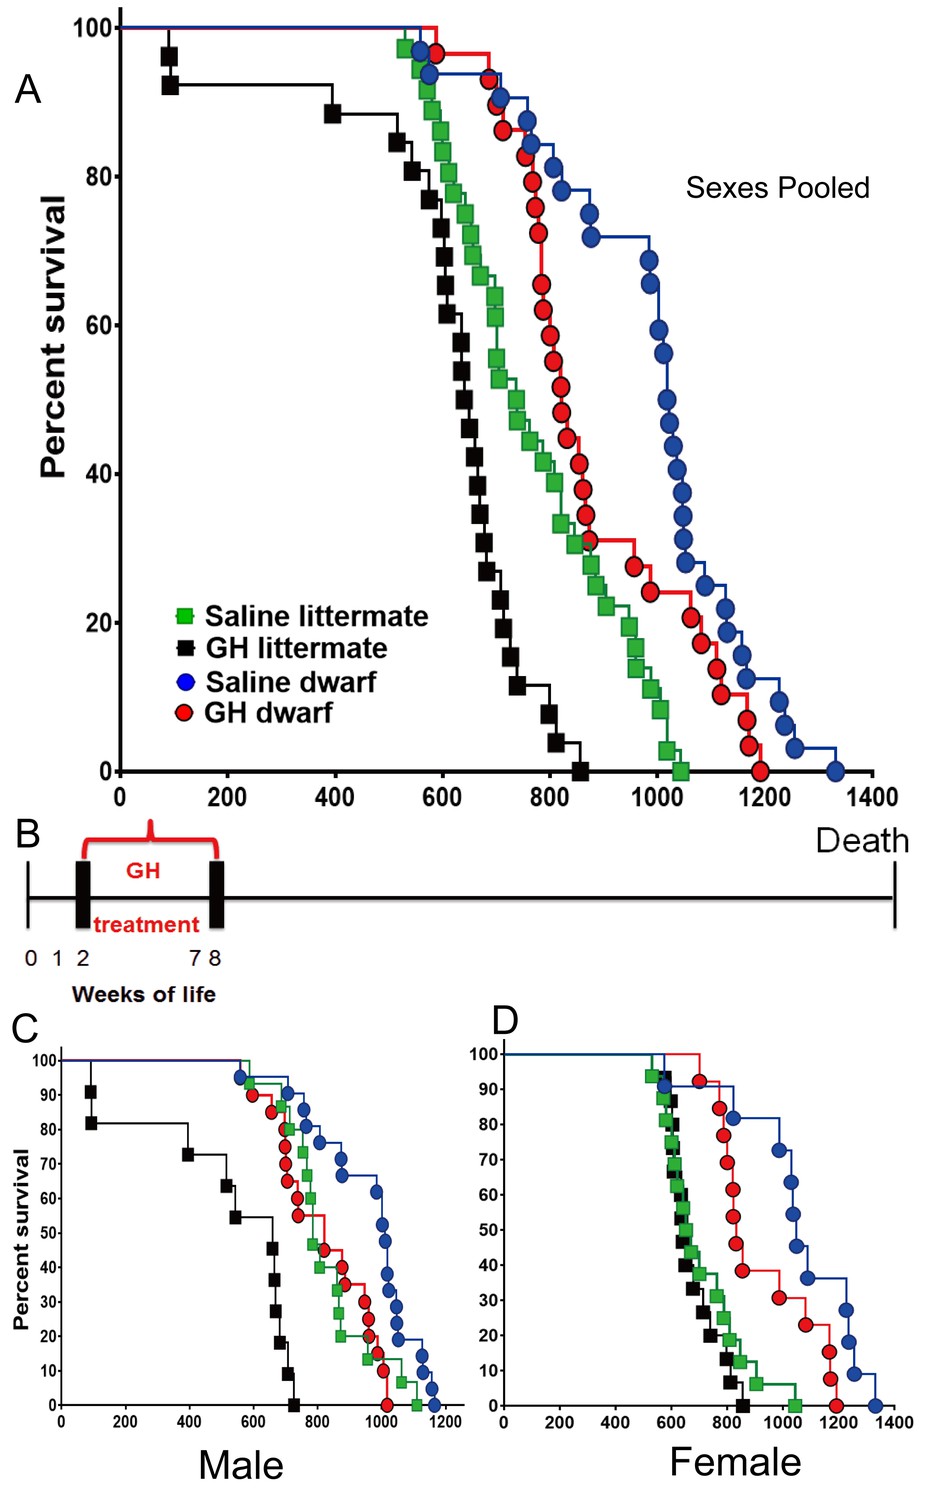
Effects of early-life GH treatment on longevity starting at the second postnatal week.
(A) Sex pooled Kaplan-Meier survival curves for each treatment and genotype: Ames dwarf (df) and Littermate control mice treated with either vehicle (saline) or GH; each point represents a single mouse. N = 36 for control mice groups with Saline; N = 26 for control mice groups with GH; N = 32 for dwarf mice groups with Saline and N = 29 for dwarf mice groups with GH. (B) Experimental scheme detailing administration time of GH and vehicle treatment between postnatal second and eighth week. (C) Male survival curves. (D) Female survival curves.
Figure 3

Age-dependent aging rates of the groups of mice in the first week (A) and the second week (B) GH treatment groups.
The aging rates describe the increases in the mortality rates with age and are expressed in deaths per 10,000 mice per day, which equals the change in mortality rate per day. Data from both sexes were pooled for each genotype. (C and D) Body weight of Ames dwarf and control mice subjected to early-life 6 weeks of GH/vehicle treatment. Time points represent mean ± SE weight of each group. (N = 15 mice/group). Data from both sexes are pooled for each genotype.
Figure 4
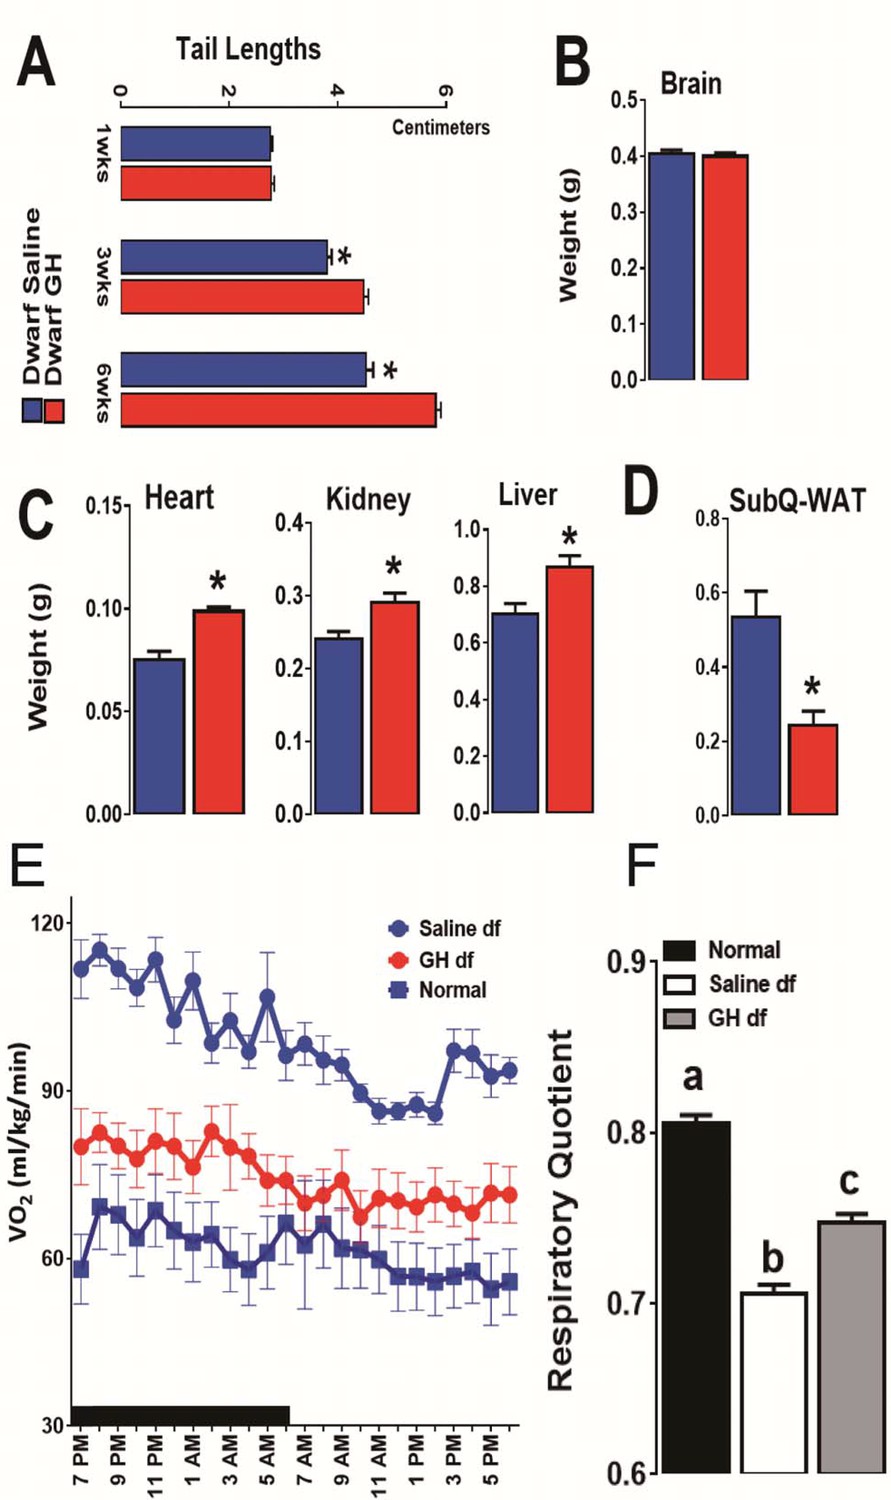
Impact of early-life GH treatment on physiological characteristics.
(A) Tail lengths; the weights of (B) Brain, (C) Heart, Kidney and Liver and (D) Subcutaneous White Adipose Tissues weights presented as absolute values. (E) VO2 values plotted as hourly averages representing either dark or light periods. (F) RQ = respiratory quotient values. each bar represents means ± SEM for 8–10 mice per group. *p<0.05, **p<0.01, Data from male mice are presented.
Figure 5
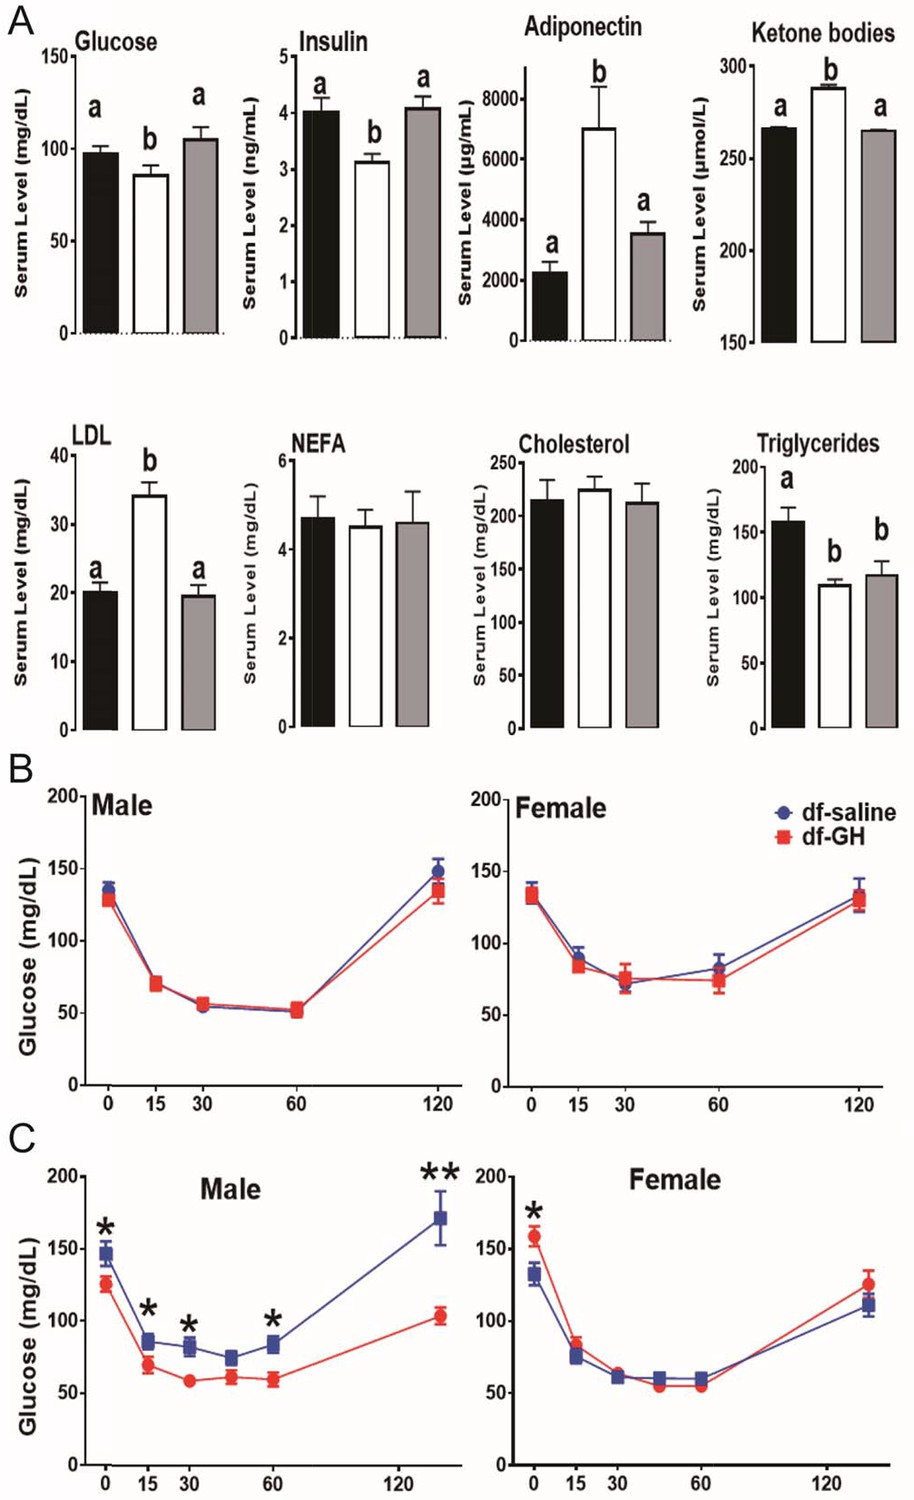
Metabolic alterations in responses to early GH treatment.
(A) Various plasma parameters from male Ames dwarf (Prop1df/df) and Littermate control male mice (N) subjected to early-life GH treatment. Saline-treated-control mice (Black Bar), Saline-treated-dwarf mice (White Bar) and GH-treated-dwarf mice (Grey Bar), a,b values that do not share a superscript letter are statistically significant (p<0.05). Data represent the means ± SEM. Insulin tolerance test (ITT) measured at (B) 6 months and (C) 18 months of age in both male and female mice. Mice were i.p. injected with 1 IU porcine insulin per kg of BW. N = 8 mice per group; *p<0.05.
Figure 6
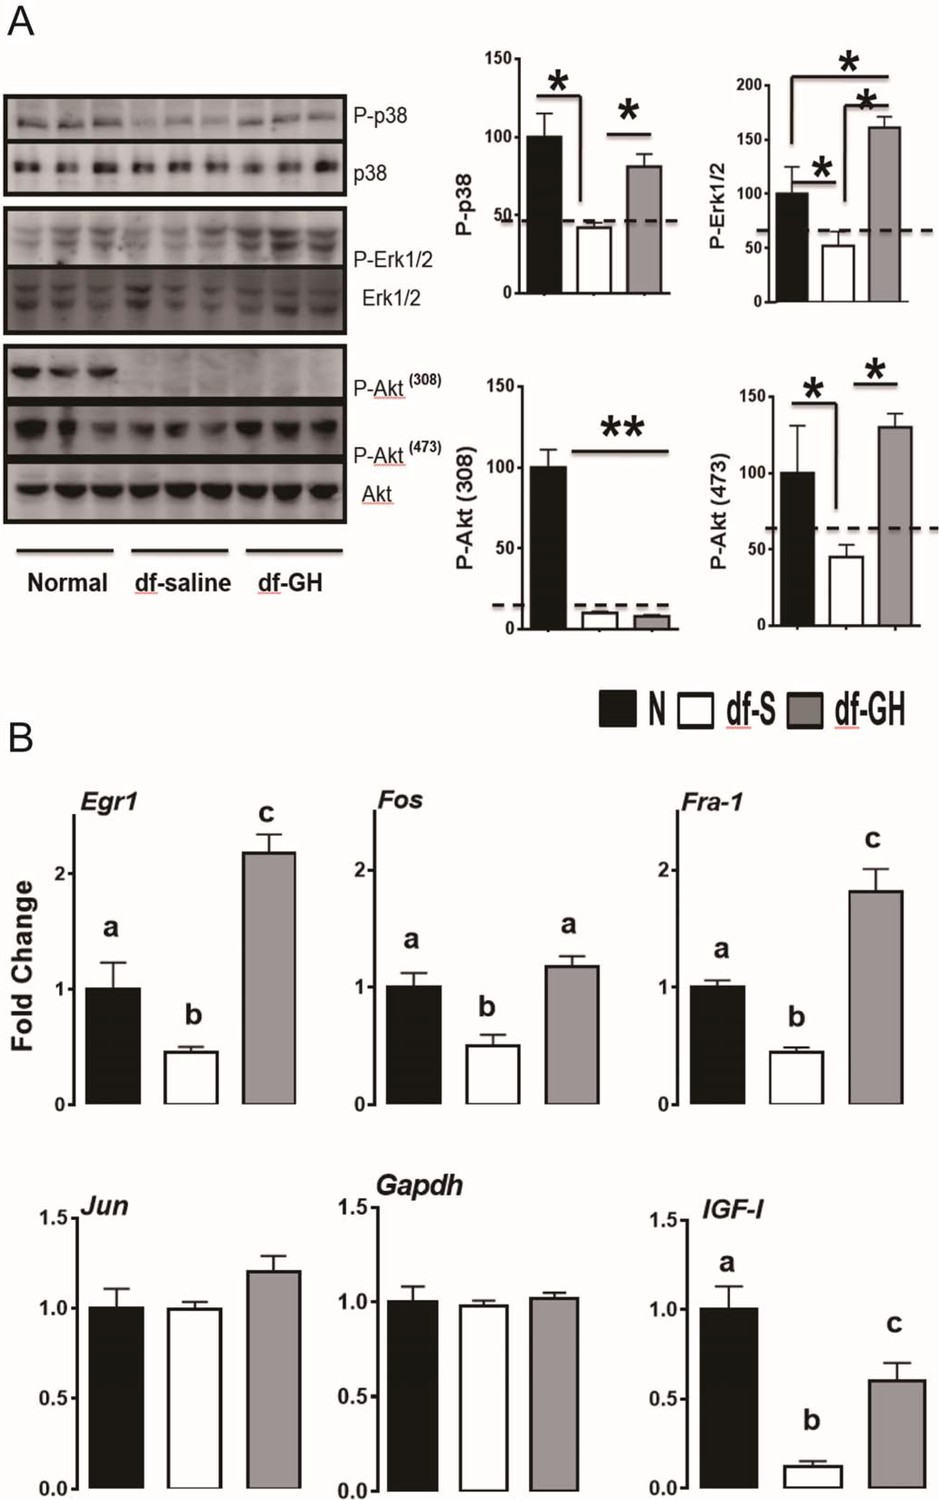
Hepatic cellular stress responsive pathways.
(A) Representative Western blots for phosphorylated and total forms of P38, Erk1/2 and Akt protein in liver lysates of male Ames dwarf (Prop1df/df) and Littermate control male mice (N) subjected to early-life GH or saline treatment. (B) Expression of Egr1, Fos, Fra-1 and IGF-I mRNA levels in the liver of GH treated dwarf and normal mice. Data are normalized to Gapdh values and expressed as a ratio (fold change) to the level seen in saline injected mice. Saline-treated-control mice (Black Bar), Saline-treated-dwarf mice (White Bar) and GH-treated-dwarf mice (Grey Bar), N = 8 male mice per group; *p<0.05, **p<0.01, ***p<0.001. a,b values that do not share a superscript letter are statistically significant (p<0.05).
Figure 7
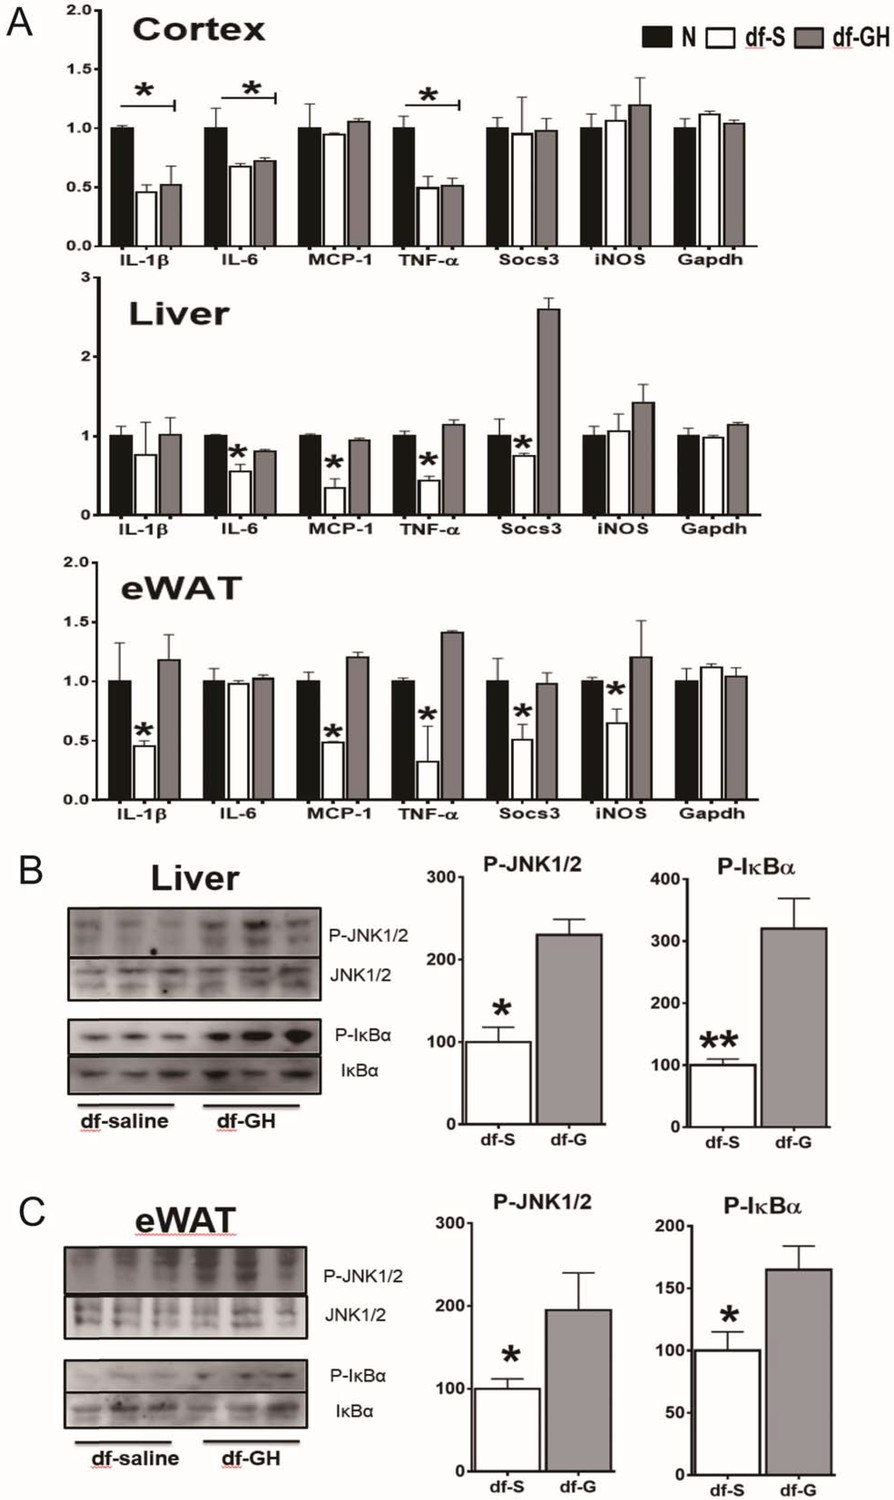
Long-term effects on tissue inflammatory markers.
(A) Effects of early GH treatment on the expression of various inflammatory indices (IL-6, IL-1β, MCP-1, TNF-α, Socs3 and iNOS in WAT, liver, and cerebral cortex by qRT-PCR. Data are normalized to GAPDH or actin values and expressed as a ratio (fold change) to levels of mRNA in control mice. (B) Representative Western blots for phosphorylated and total forms of JNK and IkB in liver and eWAT lysates of dwarf subjected to GH or saline treatment. N = 8 male mice per group; *p<0.05, **p<0.01, ***p<0.001.
Figure 8
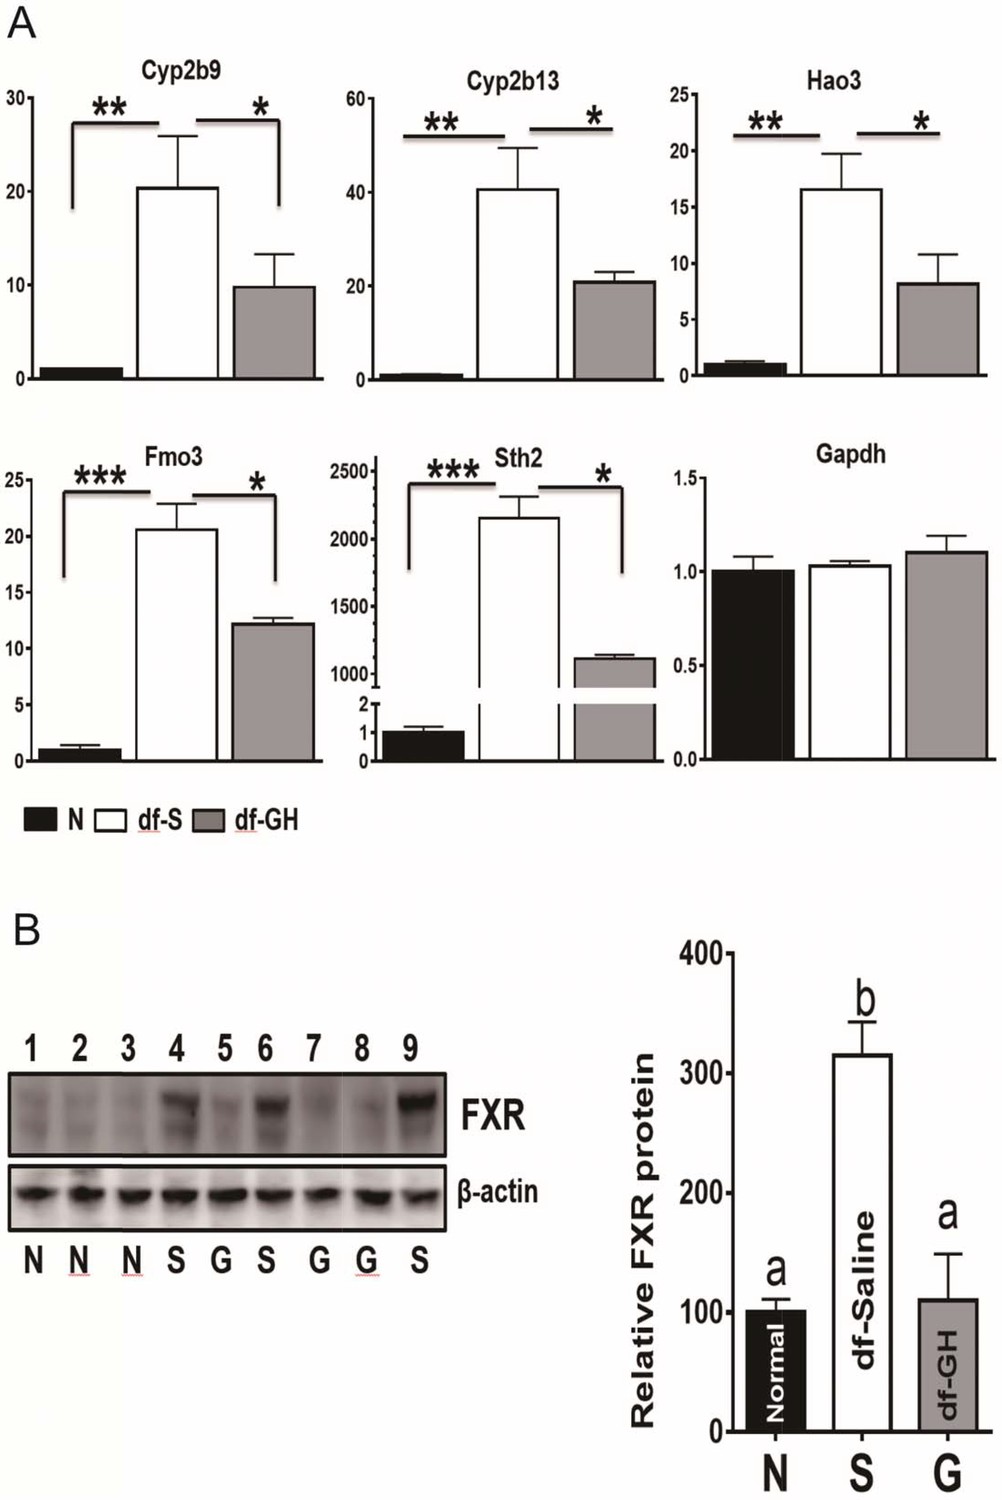
Alterations in Xenobiotic Detoxification Genes (XDG) and FXR.
(A) GH treatment during early-life has a dramatic effects on hepatic XDG expression in male Ames dwarf mice. Typical XDE mRNAs such as Cyp2b9, Cyp2b13, Hao3, FMO3 and Sth2 were measured using real-time RT-PCR. Data are normalized to GAPDH or actin values and expressed as a ratio (fold change) to levels of mRNA in control male mice. (B) Representative Western blots for FXR protein in liver lysates of dwarf and control mice subjected to GH or saline treatment. a,b values that do not share a superscript letter are statistically significant (p<0.05). N = 8 mice per group; *p<0.05, **p<0.01, ***p<0.001.
Additional files
-
Supplementary file 1
Summary of survival curves and statistical information.
- https://doi.org/10.7554/eLife.24059.011
-
Supplementary file 2
SAS output of GLM results.
- https://doi.org/10.7554/eLife.24059.012
Download links
A two-part list of links to download the article, or parts of the article, in various formats.
Downloads (link to download the article as PDF)
Open citations (links to open the citations from this article in various online reference manager services)
Cite this article (links to download the citations from this article in formats compatible with various reference manager tools)
Longevity is impacted by growth hormone action during early postnatal period
eLife 6:e24059.
https://doi.org/10.7554/eLife.24059


