Toxoplasma gondii F-actin forms an extensive filamentous network required for material exchange and parasite maturation
- University of Glasgow, United Kingdom
- Cancer Research United Kingdom Beatson Institute, United Kingdom
- University of Vermont, United States
Figures
Figure 1
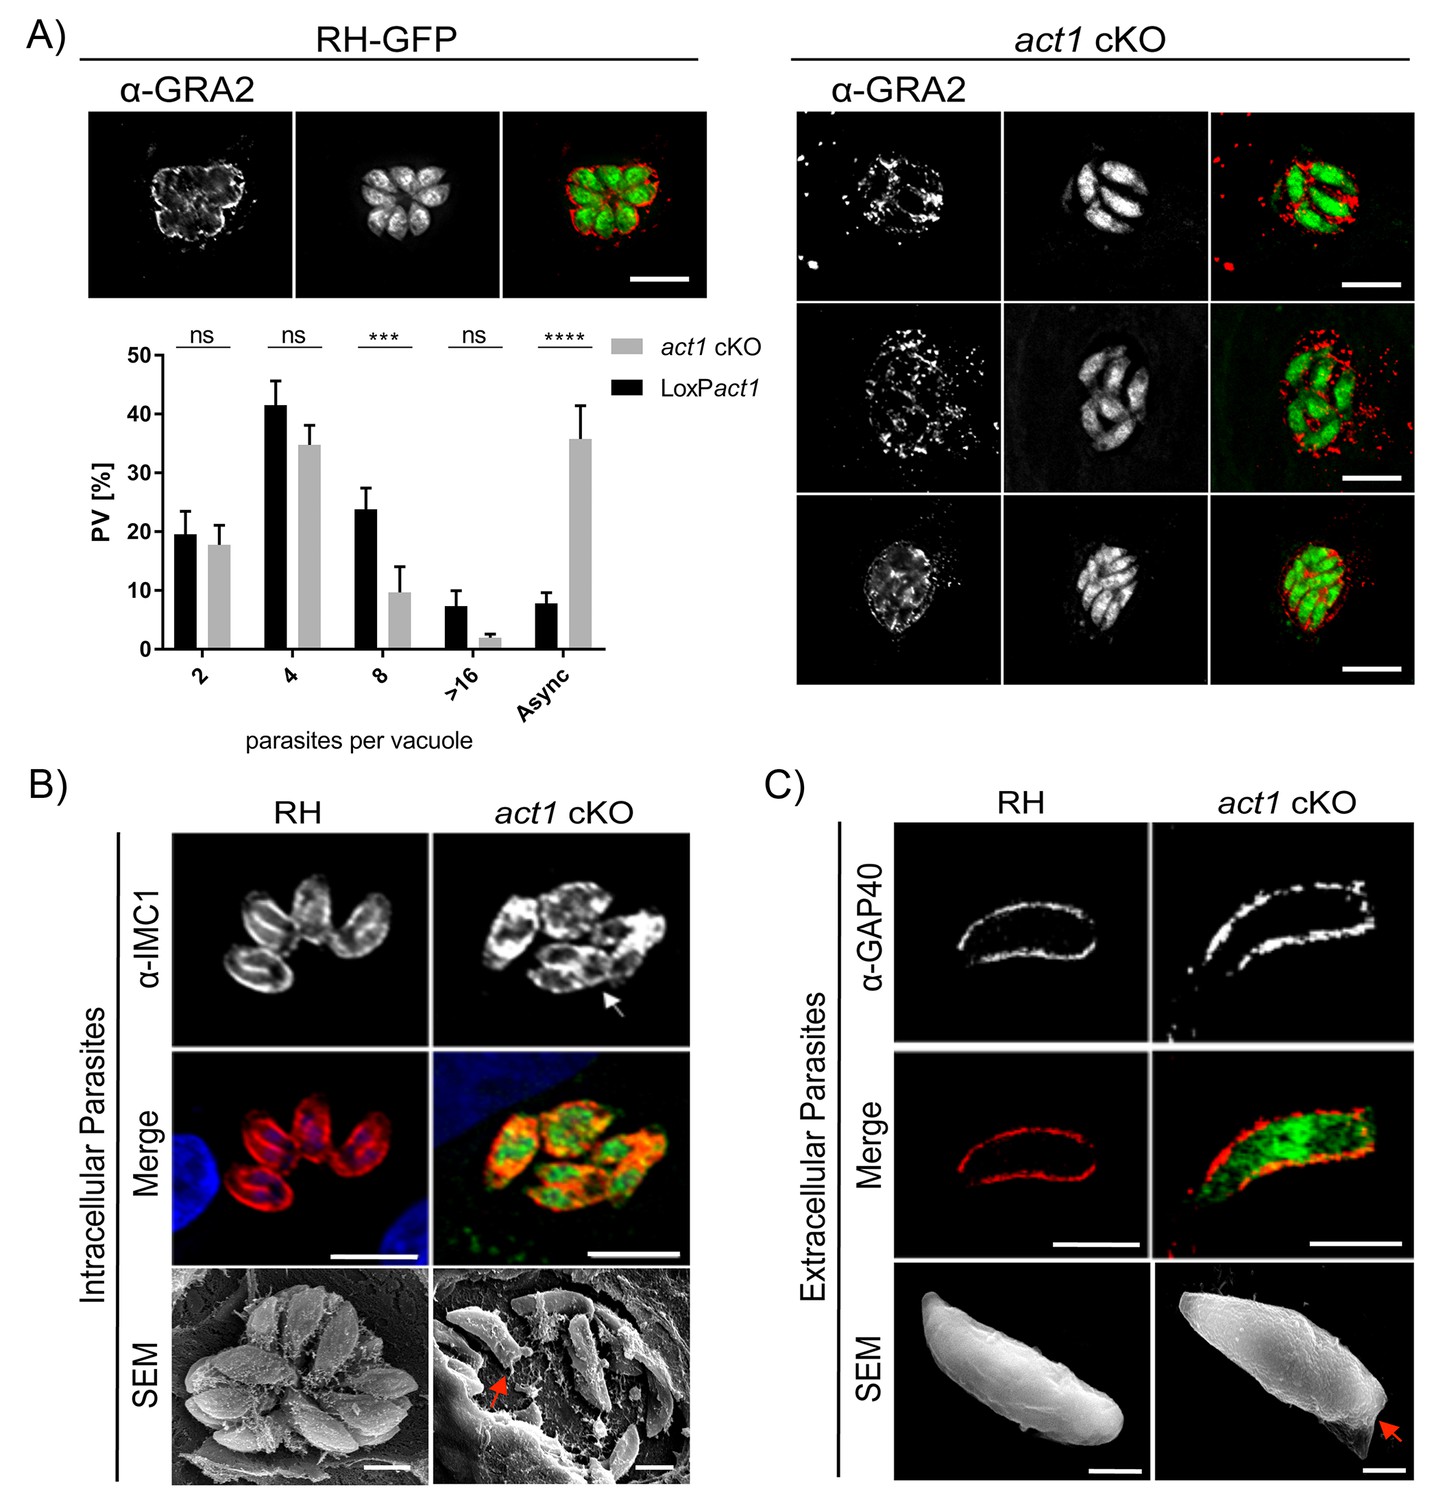
Analysis of intracellular development of act1 cKO.
(A) Conditional null mutants for act1 were induced as previously described in order to excise act1 (Egarter et al., 2014). 96 hr post induction, parasites were fixed and stained with anti-Gra2 to visualise the intravacuolar network. Scale bars: 10 µm. Replication assay of loxPact1 and act1 cKO. Number of nuclei per parasitophorous vacuole were counted 24 hr after inoculation on HFF cells. Mean values of three experiments in triplicate are shown. Asynchronous division is indicated by PVs with unusual amounts of parasites (≠2n). Two-way ANOVA followed by Sidak’s test were used to compare means between groups. ****p<0.0001, ***p<0.001, non-significance (ns) p>0.05. For source data see supplemental information (Figure 1A—source data 1). (B) Top image: The developing IMC of parasites is shown using IFA. Note that in case of act1 cKO individual parasites are in different stages of replication (i.e. white arrow indicates a parasite at the end of replication). Scale bars: 10 µm. Bottom image: Scanning EM analysis in intracellular parasites. Scale bars: 2 µm. Note the disordered appearance of parasites within the PV in absence of ACT1 and flattened bottom of the act1 KO parasites (Red Arrowhead). (C) Analysis of the IMC of the act1 cKO using IFA and scanning EM analysis in extracellular parasites. act1 cKO parasites have a flattened bottom, torpedo shape (Red arrowhead). The posterior pole of the parasite appears to be misformed, indicating a role of ACT1 during the final stages of replication (see also Figure 9). Scale bars: fluorescence images: 5 µm, SEM: 2 µm.
-
Figure 1—source data 1
- https://doi.org/10.7554/eLife.24119.004
Figure 2
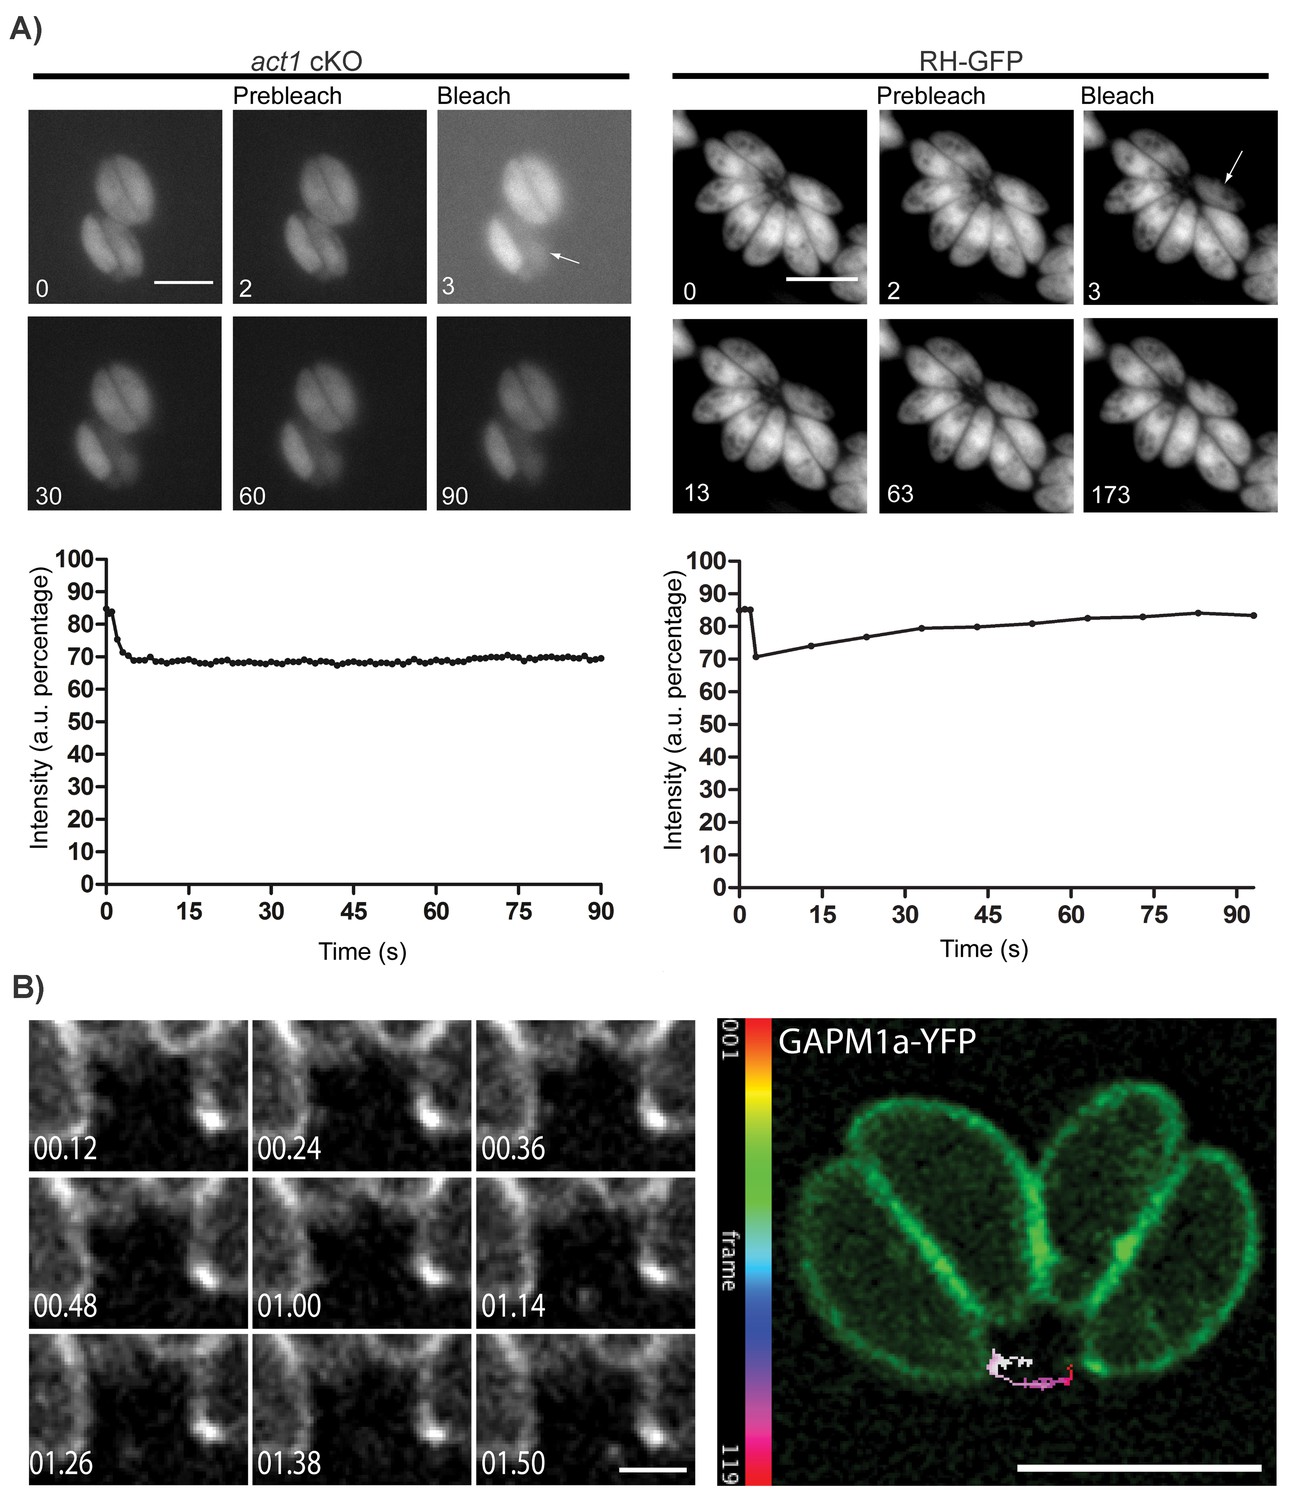
Material transport in between individual parasites within a PV.
(A) FRAP treatment in a conditional act1 cKO 72 hr after excision of act1 (Left panel). FRAP treatment shows no recovery in fluorescence intensity in the bleached cell (arrow) over the duration of the experiment (90 s), indicating that the absence of actin abrogates transport of constitutively expressed YFP between neighbouring cells. FRAP treatment in a wt strain constitutively expressing GFP shows recovery in a bleached cell as soon as 20 s after bleaching (right panel, control experiment). Intensity in the FRAP area was expressed as intensity percentage of the same area in a cell unbleached. Scale bar; 5 µm. See also Videos 1 and 2. FRAP experiments shown are representative for several biological replicates (n > 3). (B) Extracellular vesicles are actively transported in wt parasites. Vesicles positive for GAPM1a-YFP were seen to be transported. Individual vesicles were tracked and their path color coded by frame according to indicated scale. Time is indicated in minutes. Scale bar: 5 µm, detail 1 µm.
Figure 3
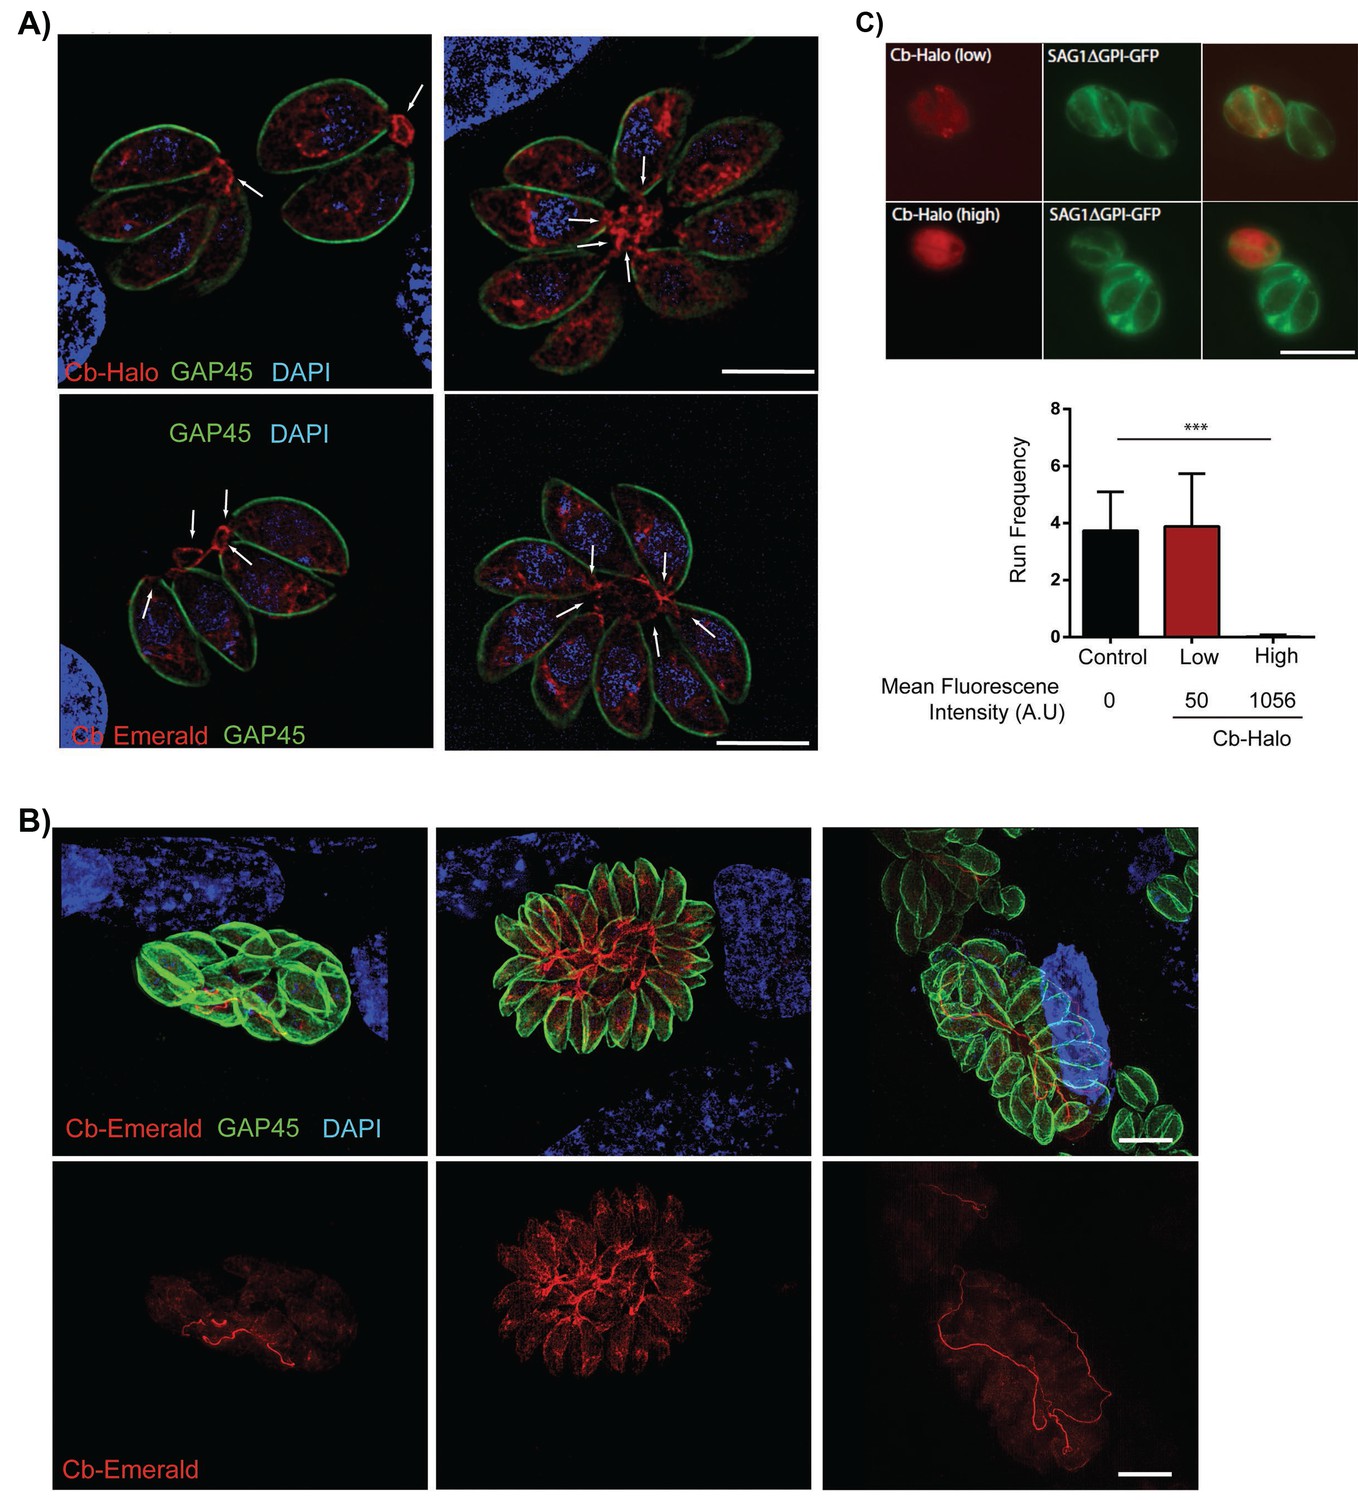
Filamentous actin can be visualized by expression of Cb-Halo and Cb-Emerald.
(A) Sections of parasite vacuoles in two, four, and eight-cell stage stably transfected with Cb-Halo or Cb-Emerald (red). A filamentous network connecting individual cells (arrows) can be visualised using Cb-Halo and Cb-Emerald. Parasites were co-stained with IMC marker, GAP45 (green), DAPI staining (blue) Scale bar 5 µm. (B) Images of larger parasite vacuoles containing 16 or 32 parasites transfected with Cb-Emerald (red). Parasites were co-stained with IMC marker GAP45 (green). Note the formation of the extensive intravacuolar network with long filamentous tubes (see also Figure 7). Scale bar 10 µm (C) Top. Image of parasites expressing SAG1ΔGPI-GFP to label the dense granules and low and high levels of Cb-Halo. Scale bar 10 µm. Bottom. Directed granule run frequency in control (non-expressing) parasites and parasites expressing Cb-Halo at high and low levels. ***p<0.0001; students t-test. Total number of directed runs counted in control, low expression and high expression samples were 183, 150 and 1 respectively. Total number of vacuoles analysed from control, low expression and high expression were 19,17 and 14, respectively, from two independent transfections. Error bars are S.E.M.
Figure 4
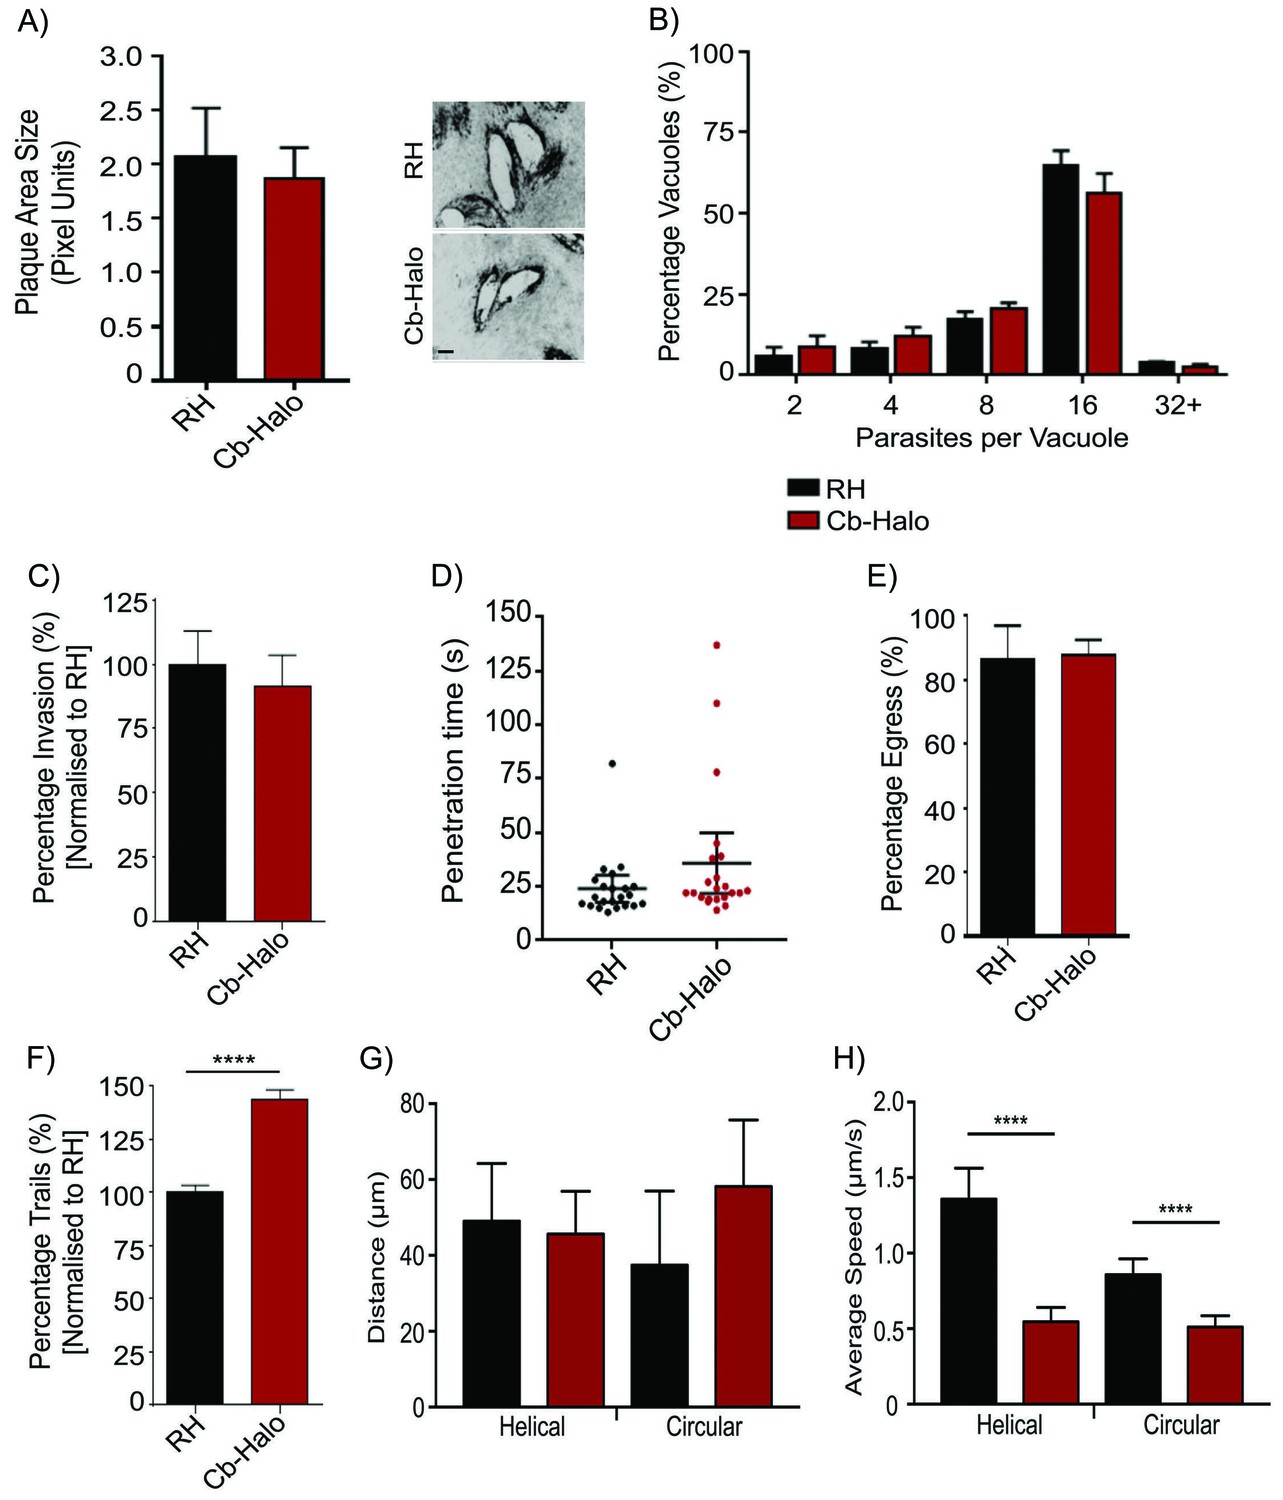
Phenotypic analysis of parasite expressing Cb-Halo.
(A) Left. Growth assay of indicated parasites. After 5 days growth no significant difference in growth rates can be observed. Right. Representative image of plaque area size created. Scale bar, 100 μm. (B) Replication rates between Cb-Halo and RH parasites are comparable. Indicated parasites were inoculated on HFF cells and number of parasites/vacuole was determined. (C) Invasion rates are not significantly different between RH and Cb-Halo expressing parasites. Parasites were allowed to invade for 1 hr, before non-invaded parasites were removed. (D) Penetration time of parasites was determined using time-lapse analysis. Both RH and Cb-Halo expressing parasites are capable to invade the host cell within 30 s. In some cases slower parasites can be detected, although on average the difference is insignificant. n = 22 independent events. (E) No differences in egress could be detected between RH and Cb-Halo parasites. Egress was triggered using Calcium Ionopore A23187 and the number of egress events was determined after 10 min. (F) Trail deposition assay comparing gliding rates between RH and Cb-Halo. Cb-Halo parasites form slightly more trails (*p<0.05). (G,H) Comparison of gliding motility between RH and Cb-Halo. Whereas average run length (G) is identical, parasites expressing Cb-Halo demonstrate slower gliding speeds for helical and circular motility. Parasites were tracked with Fiji wrMTrck software. N = 20 individual events for each condition. All assays were conducted in triplicates. Datasets were compared using two-tailed Student’s t-test. Error bars for A,B,C,E,F represent S.E.M from three independent, biological replicates. Error bars for D, G, H represent 95 % CI. *p<0.05, ****p<0.0001. For source data see supplementary information (Figure 4—source data 1).
-
Figure 4—source data 1
- https://doi.org/10.7554/eLife.24119.012
Figure 5

Chromobodies are specific for parasite F-actin and do not influence total amount of F-actin in the parasite.
(A) Coomassie stained gel showing recombinant Cb purified from bacteria. (B) Left. rCb affinity assays. Coomassie stained gels showing in vitro binding of purified Cb (4 μM) to variable range of skeletal chicken F-Actin concentration (80 μM down to 0 μM). Supernatant (S) and pellet (P) were separated by ultracentrifugation. Right. Quantitative analysis. Ratio between purified Cb in the supernatant and pellet was determined. Solid line is a fit of the binding equation to the data (Kd = 5 ± 1.2 mM). Results obtained from two independent experiments. (C) Interaction between Cb-Halo and actin in T. gondii Cb-Halo expressing strain. Western blot comparison of input lysate (I) and elution (E) obtained from co-immunoprecipitation using beads against the halo-tag with the Cb-Halo strain and RH. Actin pull-down was only detected in the Cb-Halo expressing strain. (D) Sedimentation assays. Actin sedimentation, with and without Jasplakinolide (1 μM) was evaluated for Cb-Halo strain and RH. GRA7 was used as loading control and signal intensity normalisation between conditions. Increased amount of F-actin was found in the pellet of parasites incubated in the presence of Jasplakinolide. However, no difference between RH and parasite expressing Cb-Halo could be detected in both control and Jas treated condition (n = 6).
Figure 6
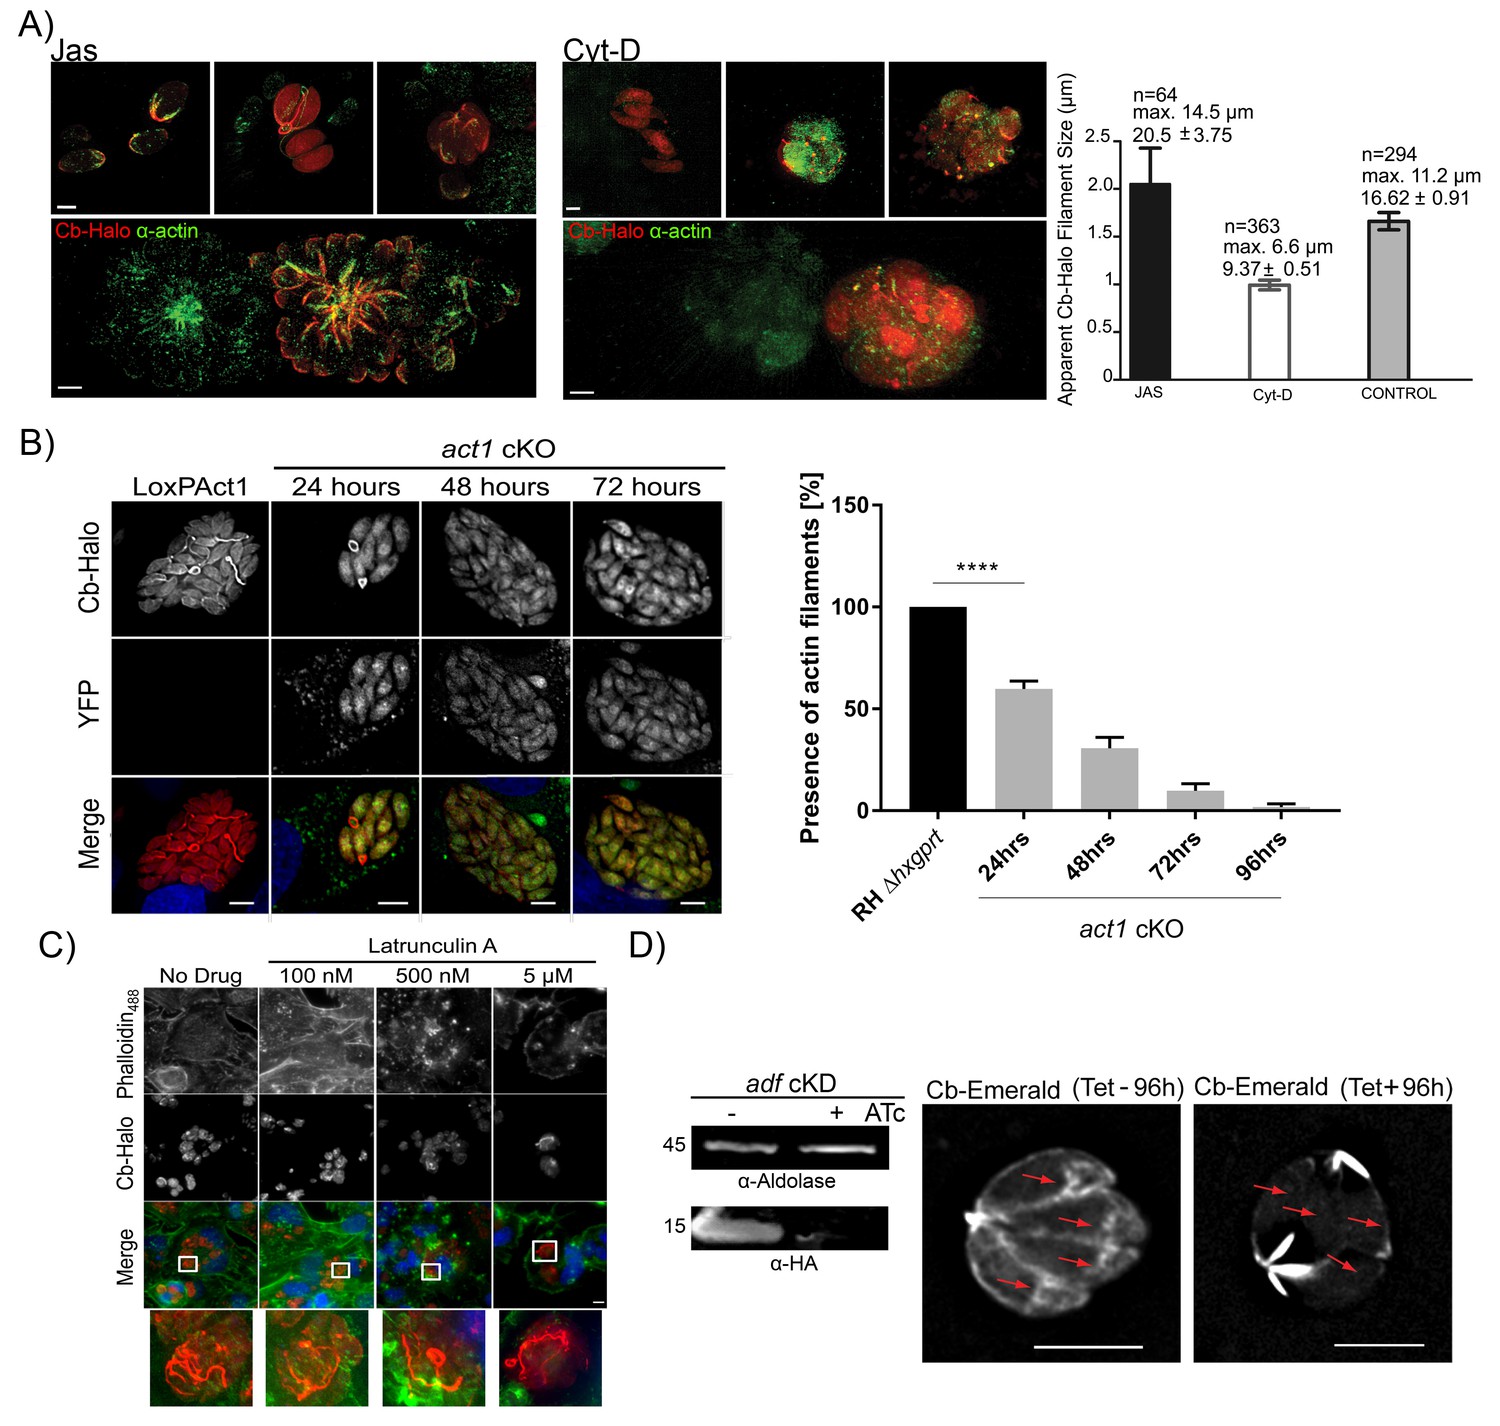
Chromobodies specifically stain parasite F-Actin.
(A) 3D-SIM imaging of parasites transiently expressing Cb-Halo (red) and stained using actin antibody (green) (Angrisano et al., 2012b). Treatment with 100 nM Jas for 1 hr results in formation of an elaborate network, whereas treatment with 2 μM Cyt-D, the filamentous network collapses. Note that in the bottom images a field of view was selected were a transiently transfected PV expressing Cb-Halo is next to a non-transfected PV. Both show identical staining. Scale bars 2 μm. Right: Quantification of the apparent filament size in five representative PVs growth for 24 hr, as measured using default settings in the Ridge Detection Plug In (ImageJ, see Material and Methods), n is the number of filaments, max size is the longest filament found in each condition expressed in µm. Number below indicates average pixels +/- SEM (10 pixels correspond to 1 µm). (B) Expression of Cb-Halo in a conditional act1 cKO. A filamentous network is observed prior to excision of act1. As soon as 24 hr after excision of act1 the network diminishes. Right: The percentage of vacuoles with >8 parasites containing actin filaments in RH Δhxpgrt and act1 cKO were quantified at 24, 48, 72 and 96 hr after induction. Mean values of three experiments in triplicate are shown. One way ANOVA followed by Dunnett’s multiple comparisons test was used to compare means between groups. ***p<0.0001. (C) Host cell actin is not involved in formation of the filamentous network. Parasites were allowed to replicate for 24 hr, before being treated for 3 hr with indicated concentration of Latrunculin A. Host cell F-actin was visualised with Phalloidin488 (green). Scale bars; 10 μm. (D) Analysis of actin dynamics in a conditional mutant for adf. Left: Immunoblot using indicated antibodies. ADF-HA is depleted upon treatment of parasites with 1 μM ATc. Parasites were grown for 96 hr in HFF cells in the presence and absence of inducer, before being artificially released. Equal amounts of parasites were loaded. Right: Representative still image of Video 6 and 7. Parasites were grown for 96 hr in the presence or absence of ATc. Note that upon depletion of ADF no actin filaments can be detected in the cytosol of the parasites (arrows) and F-actin accumulates at the posterior and (to a lesser extent) apical pole of the parasite. Scale bar: 5 μm. For source data (A,B) see supplementary information (Figure 6—source data 1).
-
Figure 6—source data 1
- https://doi.org/10.7554/eLife.24119.016
Figure 7
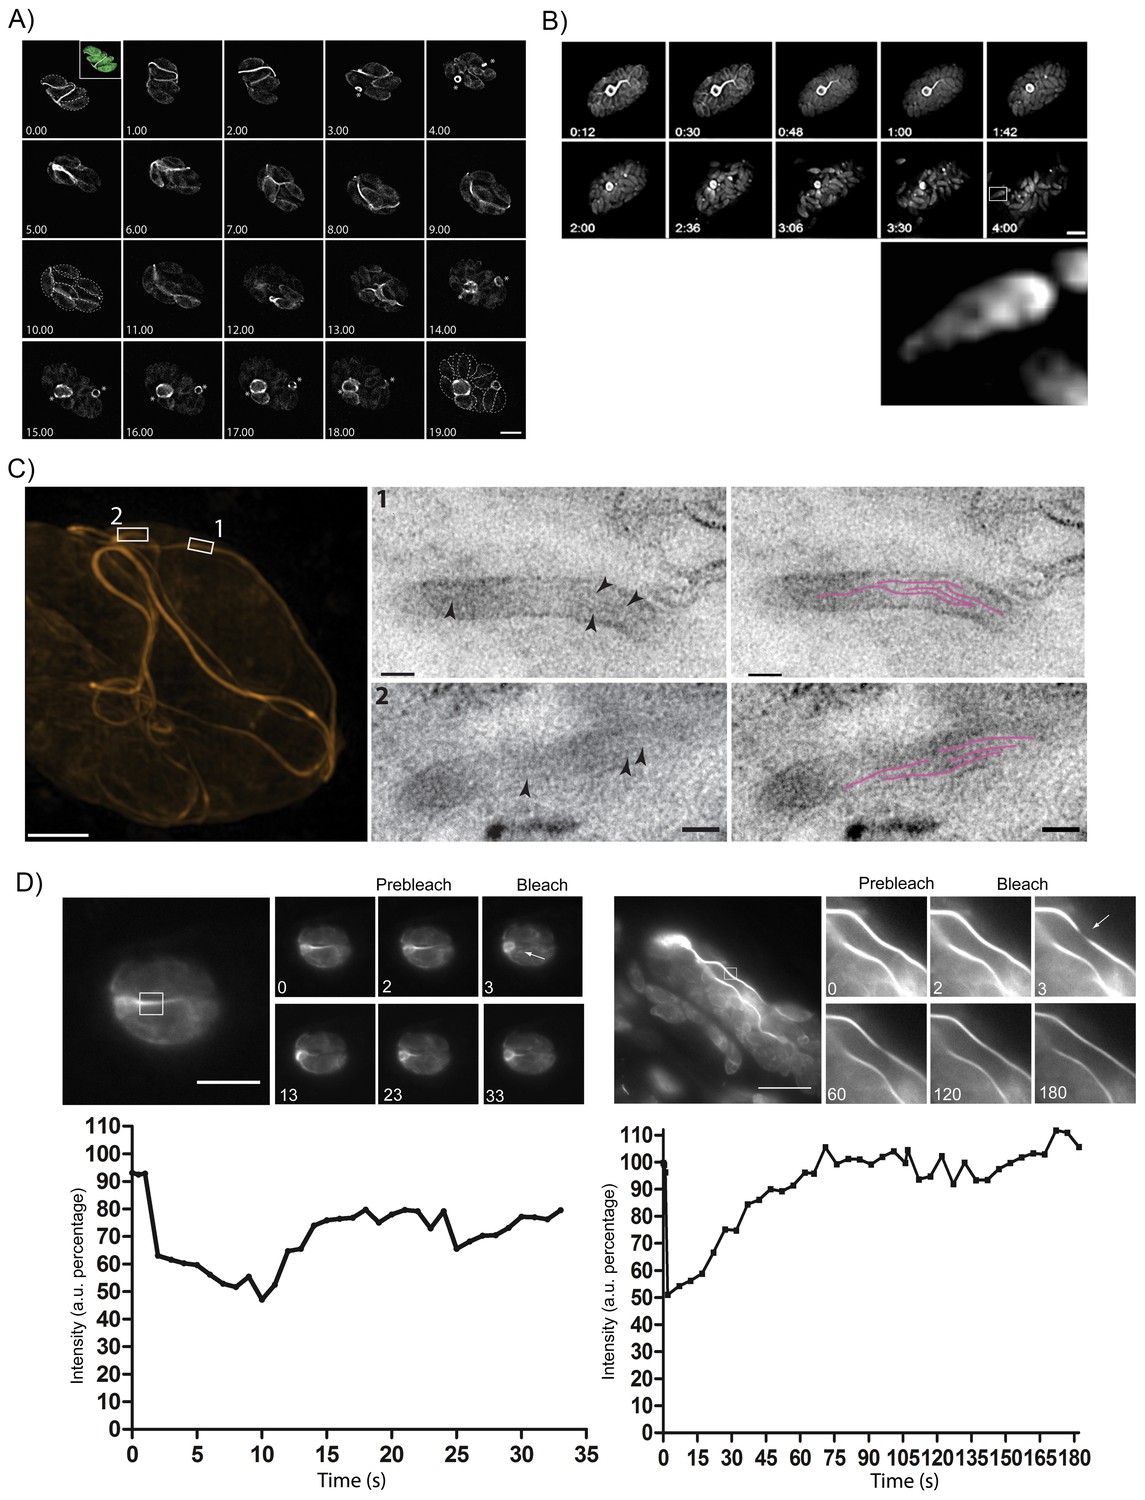
The F-actin network is stable in resting parasites, but highly dynamic during replication and egress.
(A) Analysis of Cb-Halo during two rounds of replication. Images were taken every 30 min for 20 hr (Video 8). The network appears dynamic across the intracellular lifecycle, collapsing into rings during daughter cell emergence (asterisks). Time indicated in hours. Scale bar 5 μm. (B) Collapse of the F-actin network can be triggered by calcium signaling. Parasites were induced for egress with Calcium Ionophore A23187 and imaged at 1 frame per second (Video 9). The network collapses before parasites begin to egress. While filaments quickly collapse, the residual body remains intact during egress and is left behind. Box in lower left image shows freshly egressed parasites (enlarged below), where F-actin appears to accumulate at the posterior pole of the parasite. Time indicated in minutes:seconds. Scale bar, 10 μm. (C) Correlative light electron microscopy (CLEM). A vacuolar network was imaged with 3D-SIM super-resolution microscopy and the same areas were imaged with TEM. Filaments of 5 nm in thickness were present within the network tubules, extending over 100 nm in length. Scale bars: 200 nm (3D-SIM); 50 nm (TEM). (D) FRAP treatment in cells stably expressing Cb-Emerald. The F-actin inside the cells (left panel) and the nanotubular network connecting the parasites (right panel) show different fluorescence recovery times (20 and 60 s respectively), suggesting the presence of different actin dynamics inside the parasite and the filamentous network of the PVs respectively. Intensity in the FRAP area was expressed as intensity percentage of the same unbleached area (filament or nanotubular network). Time is expressed in seconds. Scale bar 5 µm.
Figure 8
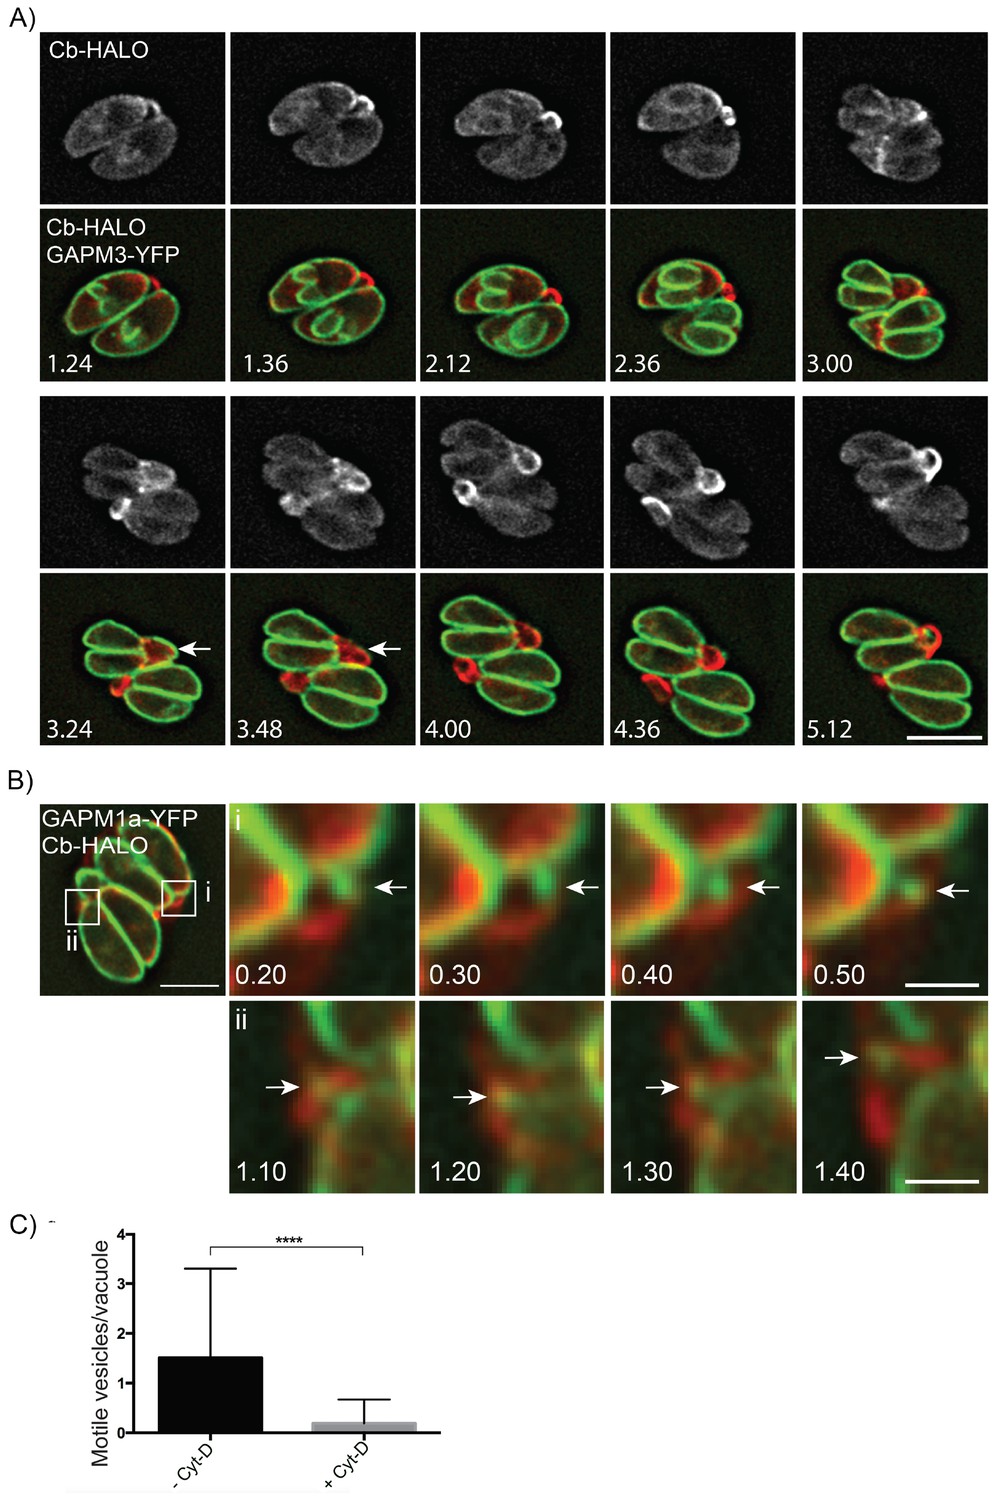
Parasite-derived extracellular vesicles are transported in an F-actin dependent manner.
(A) Parasites co-expressing GAPM3-YFP and Cb-Halo were imaged every 6 min for 5 hr, F-actin can be seen initially connecting the basal end of the parasites before accumulating beneath the forming daughter cells where it appears to concentrate towards the rear of the new daughters during emergence and recycling of the maternal IMC. Note the sudden collapse of the mother IMC into vesicles that appear to move towards the IMC of the nascent daughter cells (arrow). Scale bar 10 μm. (B) In parasites endogenously expressing GAPM1a-YFP, extracellular vesicles could be observed in close apposition to Cb-Halo labelled filaments (arrow). Parasites expressing Cb-Halo were imaged every second for up to 5 min. Extracellular vesicles positive for GAPM1a-YFP were observed to move along F-actin filaments (arrows). Scale bar, 5 μm. (C) The number of vesicles per vacuole that moved within 5 min of imaging were quantified in the presence and absence of 500 nM Cyt-D. At least 60 vacuoles were counted over three independent experiments. ****p<0.0001.
Figure 9
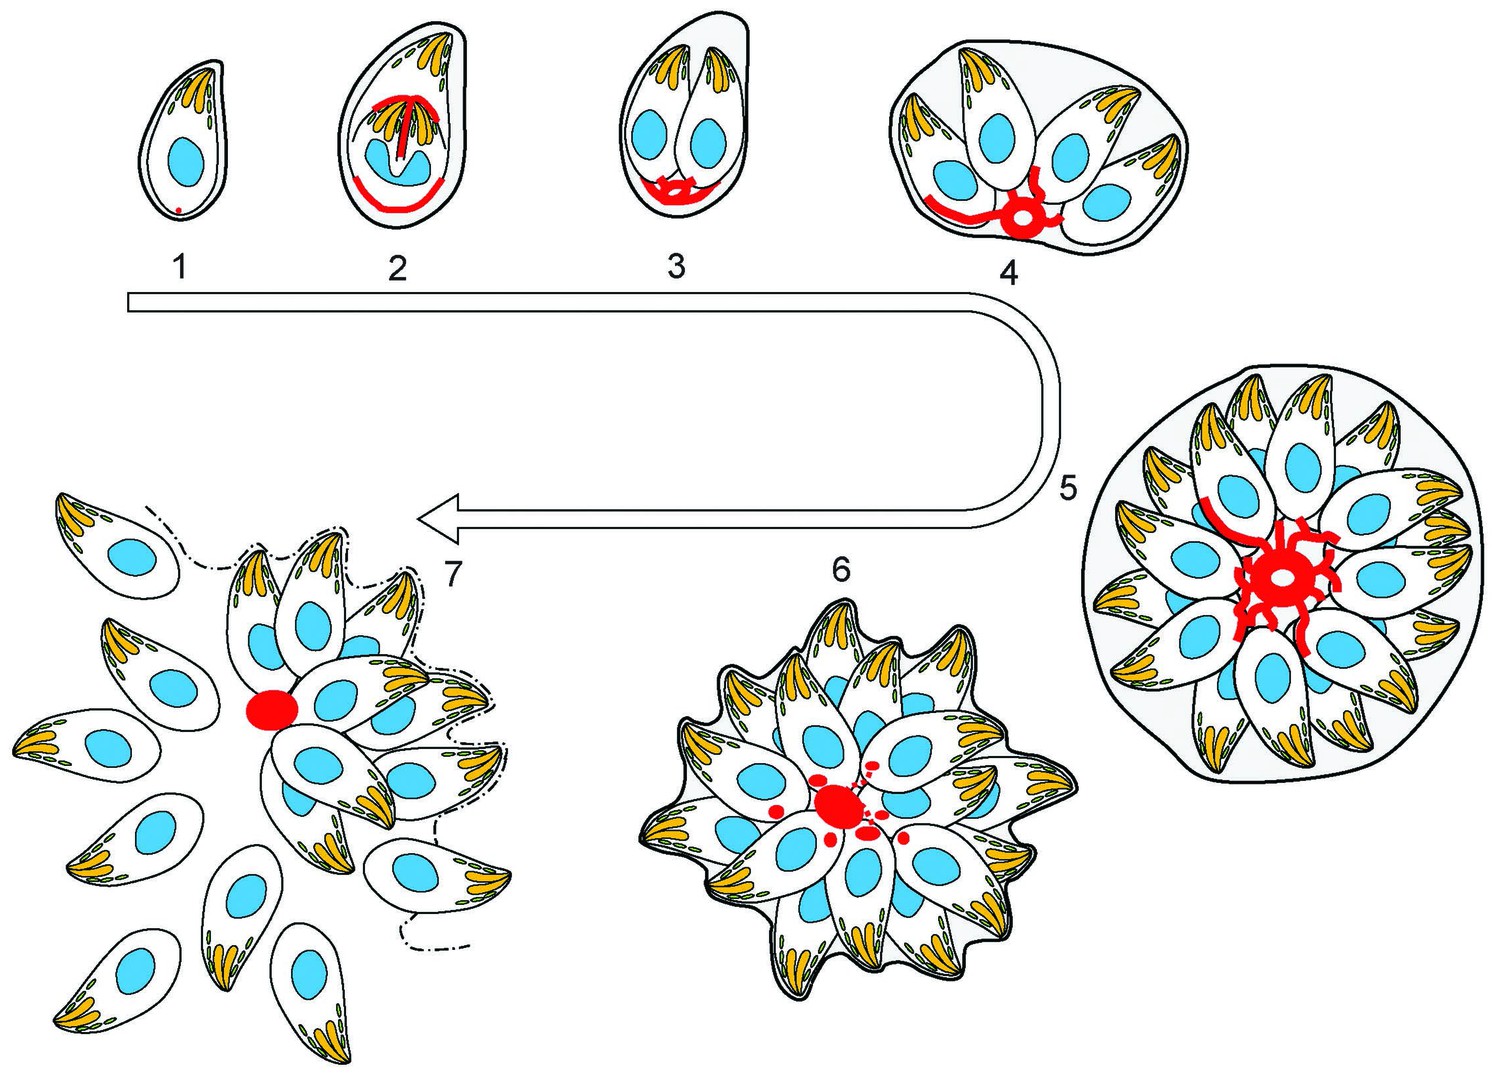
(1) After successful invasion, tachyzoites establish a parasitophorous vacuole and initiate replication.
(2) During daughter cell formation, actin labelling is observed at the IMC of the daughter cells and at the posterior pole of the mother. (3) Once the daughter cells are fully formed, the actin signal strongly localises at the posterior end of the parasites and with the remains of the mothers IMC, as it is recycled. The first actin filamentous network and ring-like structures are visualized. (4–5) Replication continues and the filamentous network is established between the tachyzoites. The actin ring continues to localize at the residual body. (6) The filaments between the parasites and the ring break in a calcium dependent manner prior to egress. The network collapses and dots of actin are detected at the posterior end of tachyzoites. (7) Tachyzoites egressing from the vacuole leave behind an accumulation of actin in the residual body.
Videos
Video 1
FRAP on act1 cKO.
FRAP treatment in a conditional act1 cKO 72 hr after excision of act1 in loxPAct1. After FRAP treatment in a cell in the PV, no recovery in fluorescence intensity was observed. Scale bar 5 µm. Imaging speed 5 fps.
Video 2
FRAP on RH-YFP.
FRAP treatment in a RH strain constitutively expressing GFP shows recovery in a bleached cell after a period of 20 s. Scale bar 5 µm. Imaging speed 5 fps.
Video 3
Vesicular motility of GAPM1A-YFP in parasites endogenous expressing GAPM1a-YFP vesicles positive for GAPM1a-YFP were seen to be transported extracellularly.
A vesicle was tracked and its path indicated. Time is indicated in minutes, scale bar 1 µm.
Video 4
Dense Granule dynamics in intracellular T. gondii parasites expressing SAG1△GPIGFP and low or high levels of CB-Halo.
Imaging speed 10 fps, playback 6x real time.
Video 5
Parasites expressing Cb-Emerald demonstrate highly dynamic F-actin dynamics.
After FRAP treatment in a cell in the PV, recovery of fluorescence intensity is observed due to polymerization of new actin filaments formed from the cell periphery to the bleached cytoplasm region. Scale bar 5 µm. Imaging speed 5 fps.
Video 6
Analysis of actin dynamics in adf cKO expressing Cb-Emerald in absence of ATc.
Note the highly dynamic F-actin within the cytosol of the parasites. Scale bar 5 µm. Imaging speed 5 fps.
Video 7
Analysis of actin dynamics in adf cKO expressing Cb-Emerald in the presence of ATc (when ADF is depleted).
Actin dynamics is almost completely abolished and F-actin can be found concentrated at the posterior end and much less at the apical tip of the parasite. Scale bar 5 µm. Imaging speed 5 fps.
Video 8
Analysis of Cb-Halo during two rounds of replication.
Images were taken every 30 min for 20 hr. The network appears dynamic across the intracellular lifecycle, collapsing into rings during daughter cell emergence before reforming. Scale bar 5 µm.
Video 9
Imaging of F-actin dynamics after addition of Ca2+-Ionophore, images taken every second.
Filaments break up in a calcium dependent manner before parasites start to egress.
Video 10
FRAP of cytosolic filaments.
FRAP treatment in cells stably expressing Cb-Emerald. After FRAP treatment, the F-actin inside the cell shows a fast fluorescence intensity recovery time of 20 s. Scale bar 5 µm. Imaging speed 5 fps.
Video 11
FRAP of filamentous structure.
FRAP treatment in cells stably expressing Cb-Emerald. After FRAP treatment in the nanotubular network, F-actin shows a fluorescence intensity recovery time of 60 s. Scale bar 5 µm. Imaging speed 5 fps.
Video 12
GAPM3-YFP expressing parasites expressing Cb-Halo were imaged every 6 min for 5 hr, F-actin can be seen initially connecting the basal end of the parasites before accumulating beneath the forming daughter cells where it appears to concentrate towards the rear of the new daughters during emergence and recycling of the maternal IMC.
Scale bar 5 µm.
Video 13
Vesicle tracking on F-actin tubules.
Parasites stably expressing GAPM1a-YFP and transiently expressing Cb-Halo were imaged every second and vesicles containing GAPM1a-YFP could be observed to move along Cb-Halo filaments. Time indicated in minutes, scale bar 5 µm.
Download links
A two-part list of links to download the article, or parts of the article, in various formats.
Downloads (link to download the article as PDF)
Open citations (links to open the citations from this article in various online reference manager services)
Cite this article (links to download the citations from this article in formats compatible with various reference manager tools)
Toxoplasma gondii F-actin forms an extensive filamentous network required for material exchange and parasite maturation
eLife 6:e24119.
https://doi.org/10.7554/eLife.24119


