Diverse stimuli engage different neutrophil extracellular trap pathways
- Max Planck Institute for Infection Biology, Germany
- Outpatient Clinic for Primary Immunodeficiencies, Charité Medical School, Germany
- Charité Medical School, Germany
- University of Massachusetts Medical School, United States
- Section for Immunology, Charité–Vivantes GmbH, Germany
Figures
Figure 1 with 1 supplement
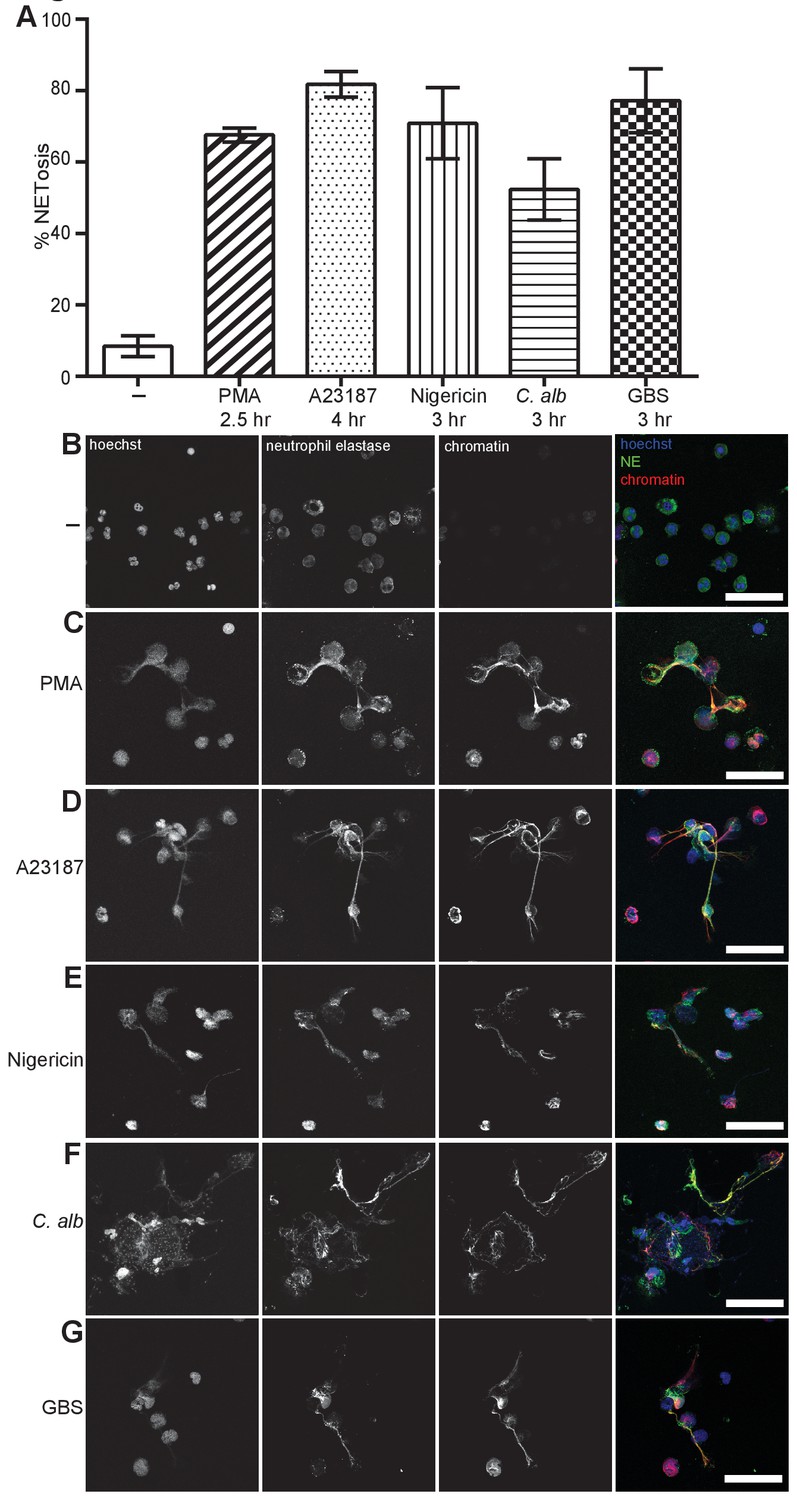
NETosis induction by a range of stimuli.
Primary human neutrophils were stimulated for the indicated times with 50 nM PMA, 5 µM A23187, 15 µM nigericin, MOI 5 opsonized C. albicans or MOI 10 opsonized group B streptococcus (GBS), fixed with 2% PFA and incubated with a DNA stain (Hoechst) and immunolabeled with antibodies directed against Neutrophil Elastase (NE) and chromatin (A–G). (A) NETosis rate was quantified by immunofluorescence. Graph shows mean ± SEM from independent experiments with three different donors. (B–G) Representative confocal microscopy images of (B) non-stimulated neutrophils (-) or NETs induced by (C) PMA (D) A23187, (E) nigericin (F) C. albicans or (G) GBS and stained with Hoechst (blue) and immunolabeled for NE (green) and chromatin (red). Scale bars, 50 μm.
-
Figure 1—source data 1
This data is the mean values of three independent NETosis assays in response to the five stimuli of interest and was used to generate the histogram in Figure 1A.
- https://doi.org/10.7554/eLife.24437.004
Figure 1—figure supplement 1
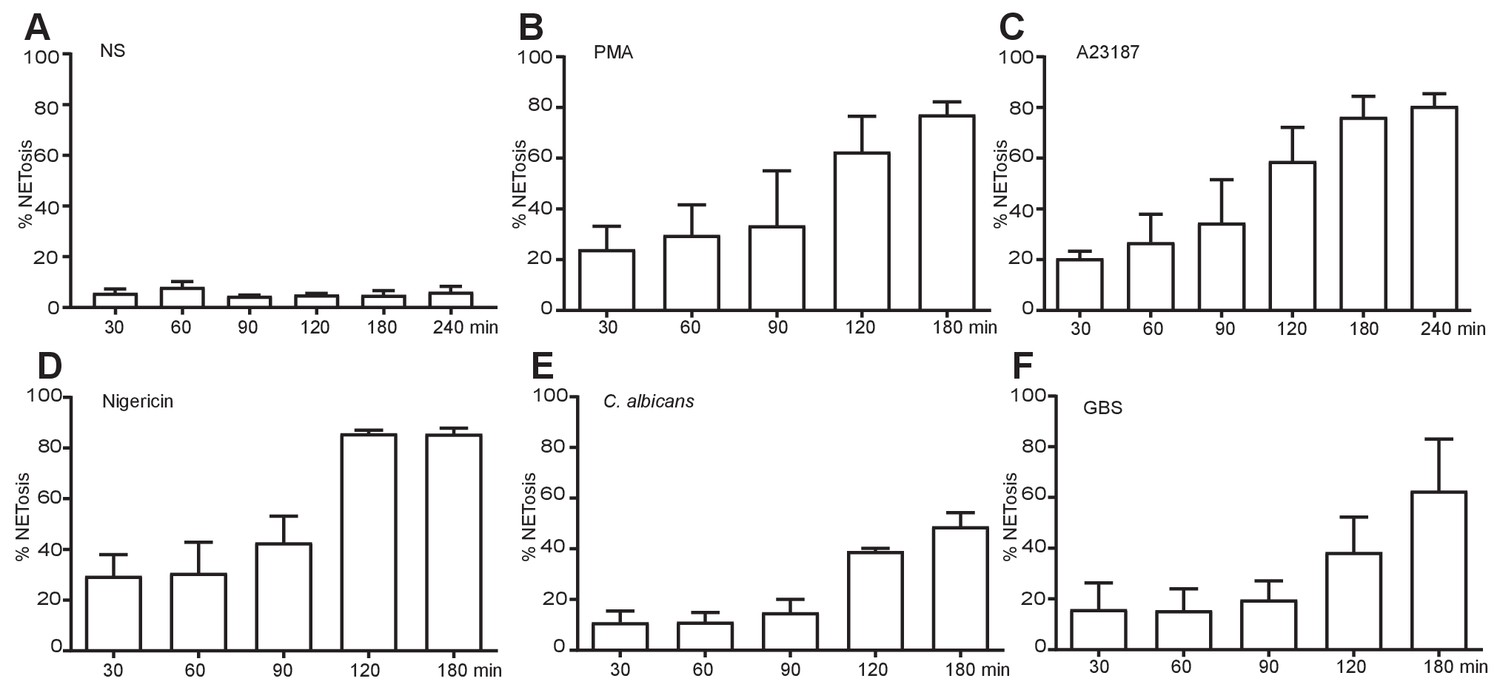
NET induction over time with the five stimuli of interest.
Primary human neutrophils were stimulated for the indicated times with 50 nM PMA (B), 5 µM A23187 (C), 15 µM nigericin (D), MOI 5 C. albicans (E) or MOI 10 GBS (F), fixed with 2% PFA and incubated with a DNA stain (Hoechst) and immunolabeled with antibodies directed against Neutrophil Elastase (NE) and chromatin. NETosis rate was quantified by immunofluorescence. Graph shows mean ± SEM from independent experiments with three different donors.
Figure 2
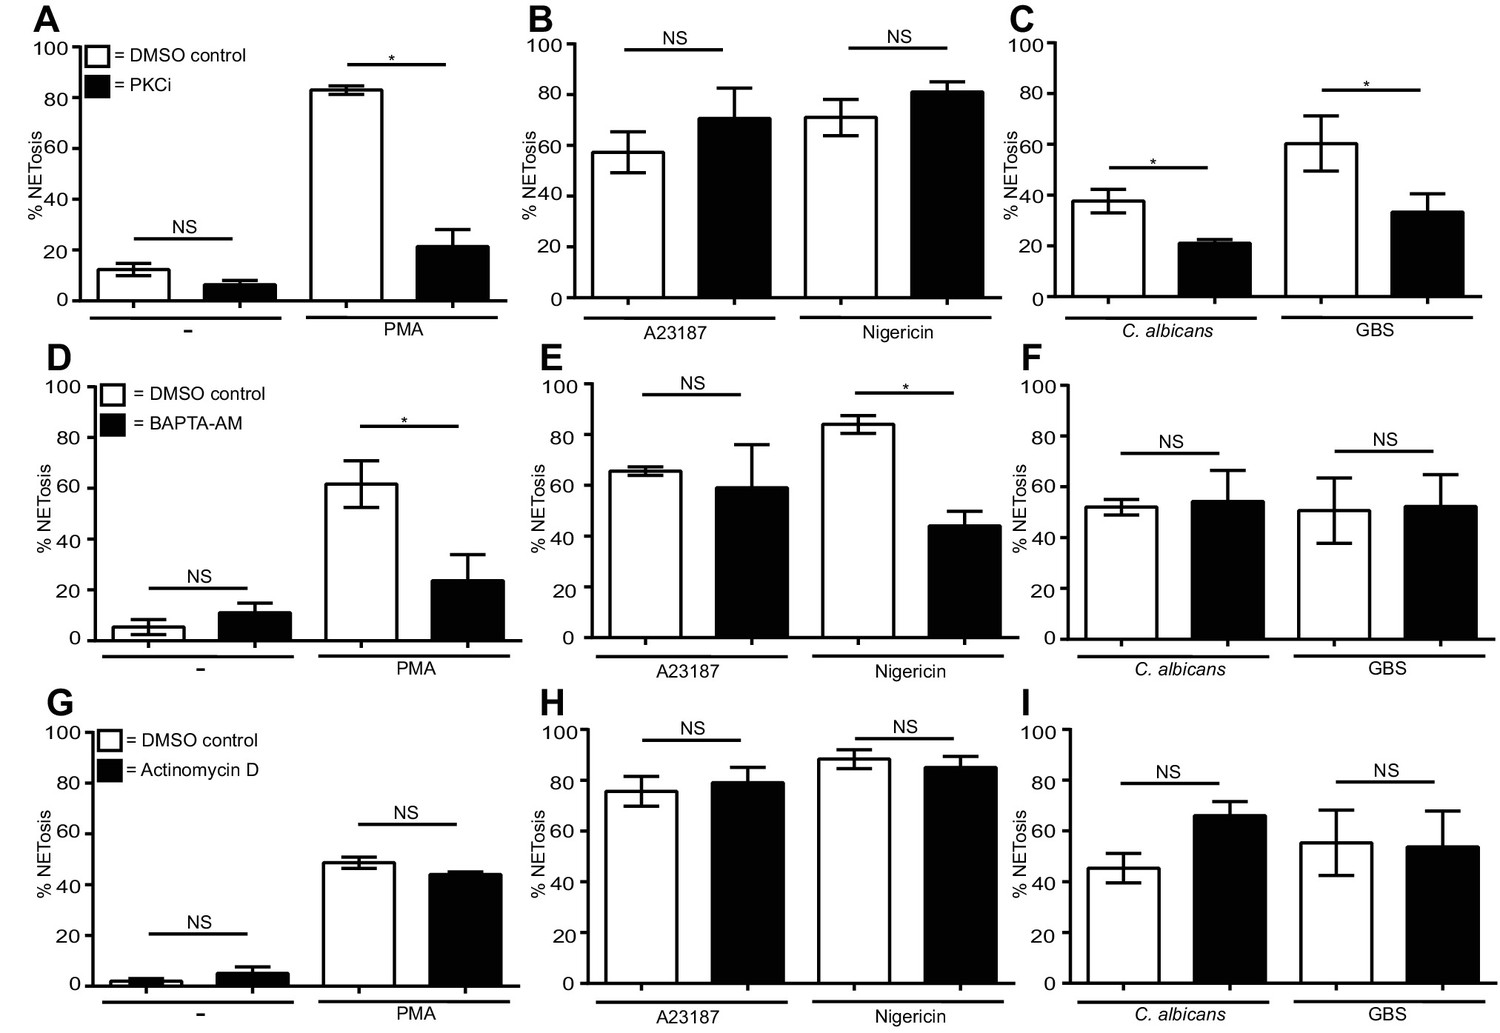
Differential requirements for PKC and calcium and a lack of requirement of transcription for NET induction by the stimuli of interest.
(A–C) NETosis rate in PKC inhibited neutrophils. Primary neutrophils were pre-treated with the PKC inhibitor Gö6976 (1 µM) for 30 min and stimulated with (A) PMA, (B) A23187 or nigericin, and (C) C. albicans or GBS for 2.5–4 hr and analysed for NET production by immunofluorescence. (D–F) NETosis rate in neutrophils pre-treated with the calcium chelator BAPTA-AM (10 µM) for 30 min and stimulated with (D) PMA, (E) A23187 or nigericin and (F) C. albicans or GBS for 2.5–4 hr and analysed for NET production by immunofluorescence. (G–I) NETosis rate in neutrophils pre-treated with actinomycin D (1 µg/ml) for 30 min and stimulated with (G) PMA, (H) A23187 or nigericin and (I) C. albicans or GBS for 2.5–4 hr and then analysed for NET production by immunofluorescence. Graphs show mean ± SEM from three independent experiments. *p<0.05, NS = not significant.
-
Figure 2—source data 1
This data is the mean values of three independent NETosis assays in response to the five stimuli of interest in the presence of the PKC inhibitor Gö6976 (Figure 2A–C), the calcium chelator BAPTA-AM (Figure 2D–F) and actinomycin D (Figure 2G–I) and was used to generate the histograms in Figure 2.
- https://doi.org/10.7554/eLife.24437.013
Figure 3 with 1 supplement
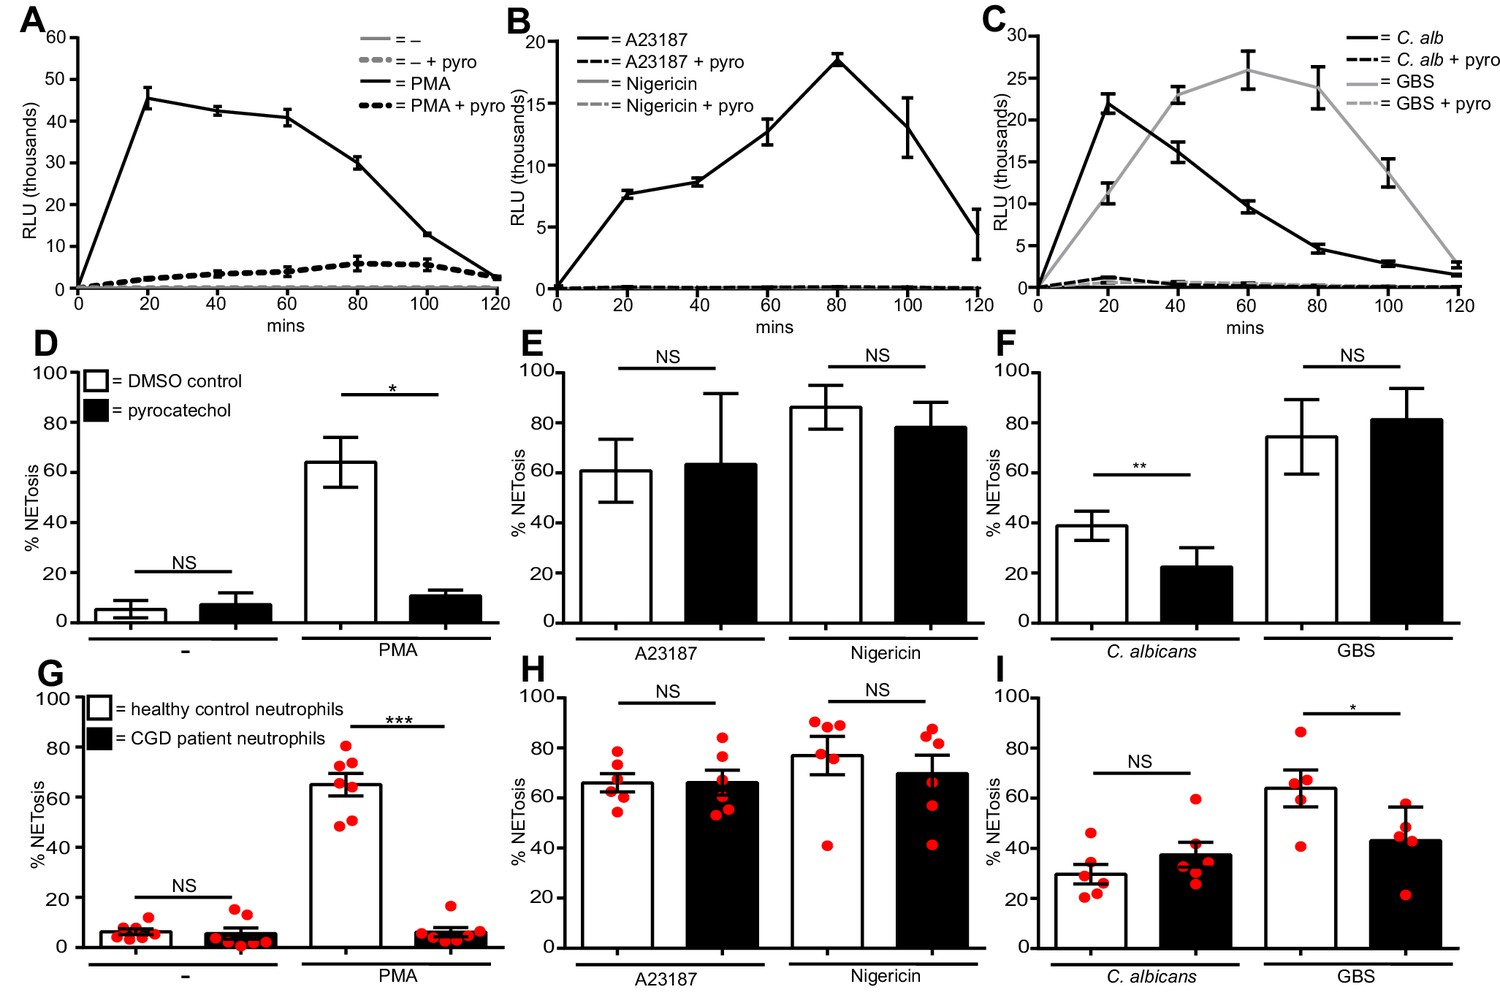
Diverse stimuli have different ROS requirements for NETosis.
ROS production by neutrophils (A–C). ROS production was measured over a 2-hr time course in the presence or absence of the ROS scavenger pyrocatechol (pyro, 30 µM) in response to (A) PMA, (B) A23187 or nigericin and (C) C. albicans or GBS stimulation. Shown is a representative of three independent experiments. (D–F) NETosis rate of neutrophils pre-treated for 30 min with pyrocatechol or (G–I) NETosis rate of healthy control neutrophils and CGD patients stimulated with (D and G) PMA, (E and H) A23187 or nigericin and (F and I) C. albicans or GBS. (A–C) Graphs show mean ± SD from a representative of three independent experiments. (D–F) Graphs shows mean ± SEM from three independent experiments. (G–I) Graphs show mean ± SEM from five to seven independent experiments using neutrophils from five independent CGD patients (each represented by a red circle). *p<0.05, **p<0.01, ***p<0.001, NS = not significant.
-
Figure 3—source data 1
This data is the mean values of three independent NETosis assays in response to the five stimuli of interest in the presence of the ROS scavenger pyrocatechol and was used to calculate the histograms in Figure 3D–F.
This data also shows the means from seven independent experiments with CGD patient neutrophils and was used to generate the histograms in Figure 3G–I.
- https://doi.org/10.7554/eLife.24437.015
Figure 3—figure supplement 1
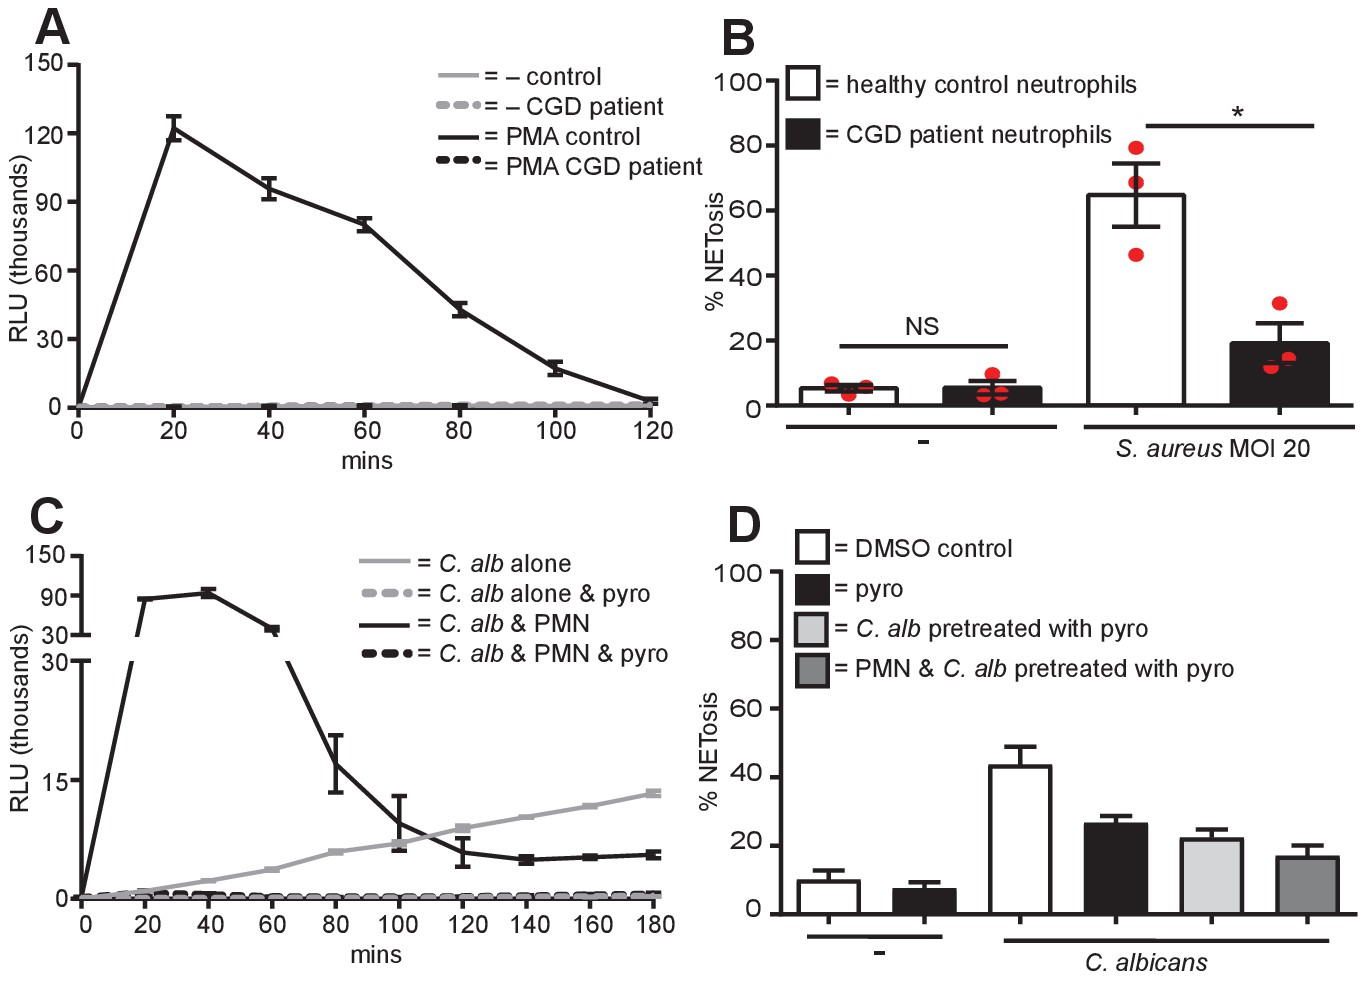
No ROS production in CGD patient neutrophils, S. aureus requires ROS for NET production and C. albicans produces ROS.
(A) ROS production by CGD neutrophils. Neutrophils from a healthy control donor and a CGD patient were examined for the production of ROS in response to PMA stimulation over a 2-hr time course. Graph shows mean ± SD from a representative of five independent ROS assays carried out with CGD patient neutrophils. (B) CGD patient neutrophils are impaired for S. aureus-induced NETosis. Healthy and CGD patient neutrophils were stimulated with S. aureus at a MOI of 20 for 4 hr and NETosis was examined as previously described. Graph shows mean ± SEM from three independent experiments. (C) C. albicans produces ROS. C. albicans-induced ROS was measured over a 3-hr time course in the presence or absence of either neutrophils (PMN) or pyrocatechol (pyro). Graph shows mean ± SD from a representative of three independent experiments. (D) NETosis in response to C. albicans utilises ROS generated from C. albicans. Healthy neutrophils or C. albicans were pre-treated with pyrocatechol for 30 mins. Cells were then stimulated with C. albicans at a MOI of 5 for 3 hr and NETosis was examined as previously described. Graph shows mean ± SEM from three independent experiments.
Figure 4

Myeloperoxidase is essential for PMA, C. albicans and GBS-induced NETosis but not for A23187 and nigericin-induced NET formation.
(A–F) NETosis rate in response to (A and D) PMA, (B and E) A23187 or nigericin and (C and F) C. albicans or GBS. (A–C) Primary neutrophils were pre-treated for 30 min with 500 µM ABAH or a DMSO control, stimulated as indicated for 2.5–4 hr and analysed for NET production by immunofluorescence. Graphs show mean ± SEM from three independent experiments. (D–F) Healthy control neutrophils and neutrophils from a MPO-deficient patient were stimulated as outlined above. Graphs show mean ± SD from a representative of two independent experiments from a single MPO-deficient donor. *p<0.05, **p<0.01, ***p<0.001, NS = not significant.
-
Figure 4—source data 1
This data is the mean of three independent NETosis assays in response to the five stimuli of interest in the presence of the MPO inhibitor ABAH and was used to generate the histograms in Figure 4A–C.
This data also shows the raw data used to calculate the mean of a representative experiment using MPO-deficient neutrophils used to generate the histograms in Figure 4D–F.
- https://doi.org/10.7554/eLife.24437.019
Figure 5
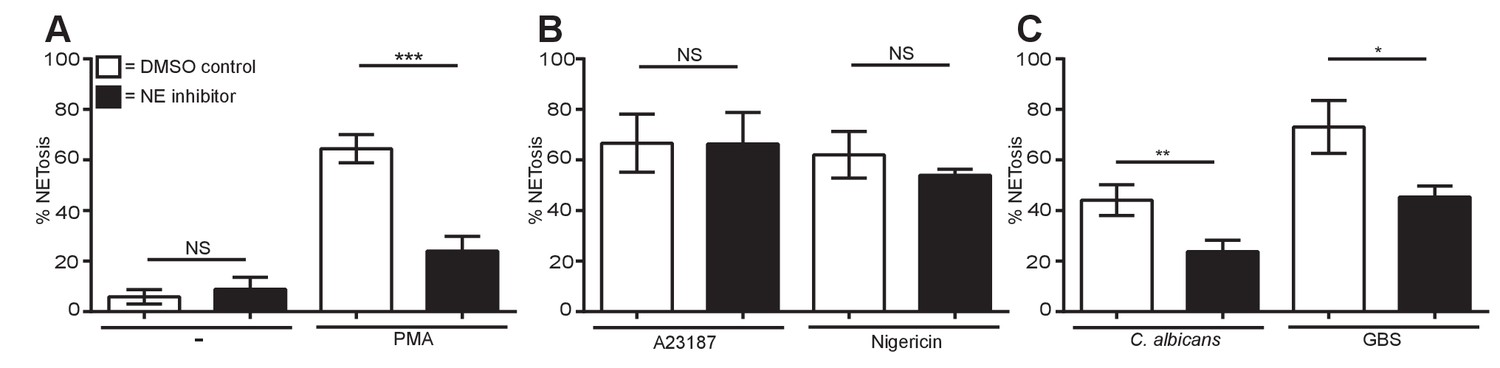
Neutrophil elastase is required for PMA, C. albicans and GBS-induced NETosis but not for A23187 or nigericin NET production.
(A–C) NETosis rate of neutrophils during NE inhibition. Primary neutrophils were pre-treated for 30 min with a neutrophil elastase inhibitor (GW311616A, 20 µM) or a DMSO control and stimulated for 2.5–4 hr with (A) PMA, (B) A23187 or nigericin and (C) C. albicans or GBS and analysed for NET production by immunofluorescence. Graphs show mean ± SEM from three independent experiments. *p<0.05, **p<0.01, ***p<0.001, NS = not significant.
-
Figure 5—source data 1
This data is the mean of three independent NETosis assays in response to the five stimuli of interest in the presence of a NE inhibitor and was used to generate the histograms in Figure 5A–C.
- https://doi.org/10.7554/eLife.24437.021
Figure 6 with 2 supplements
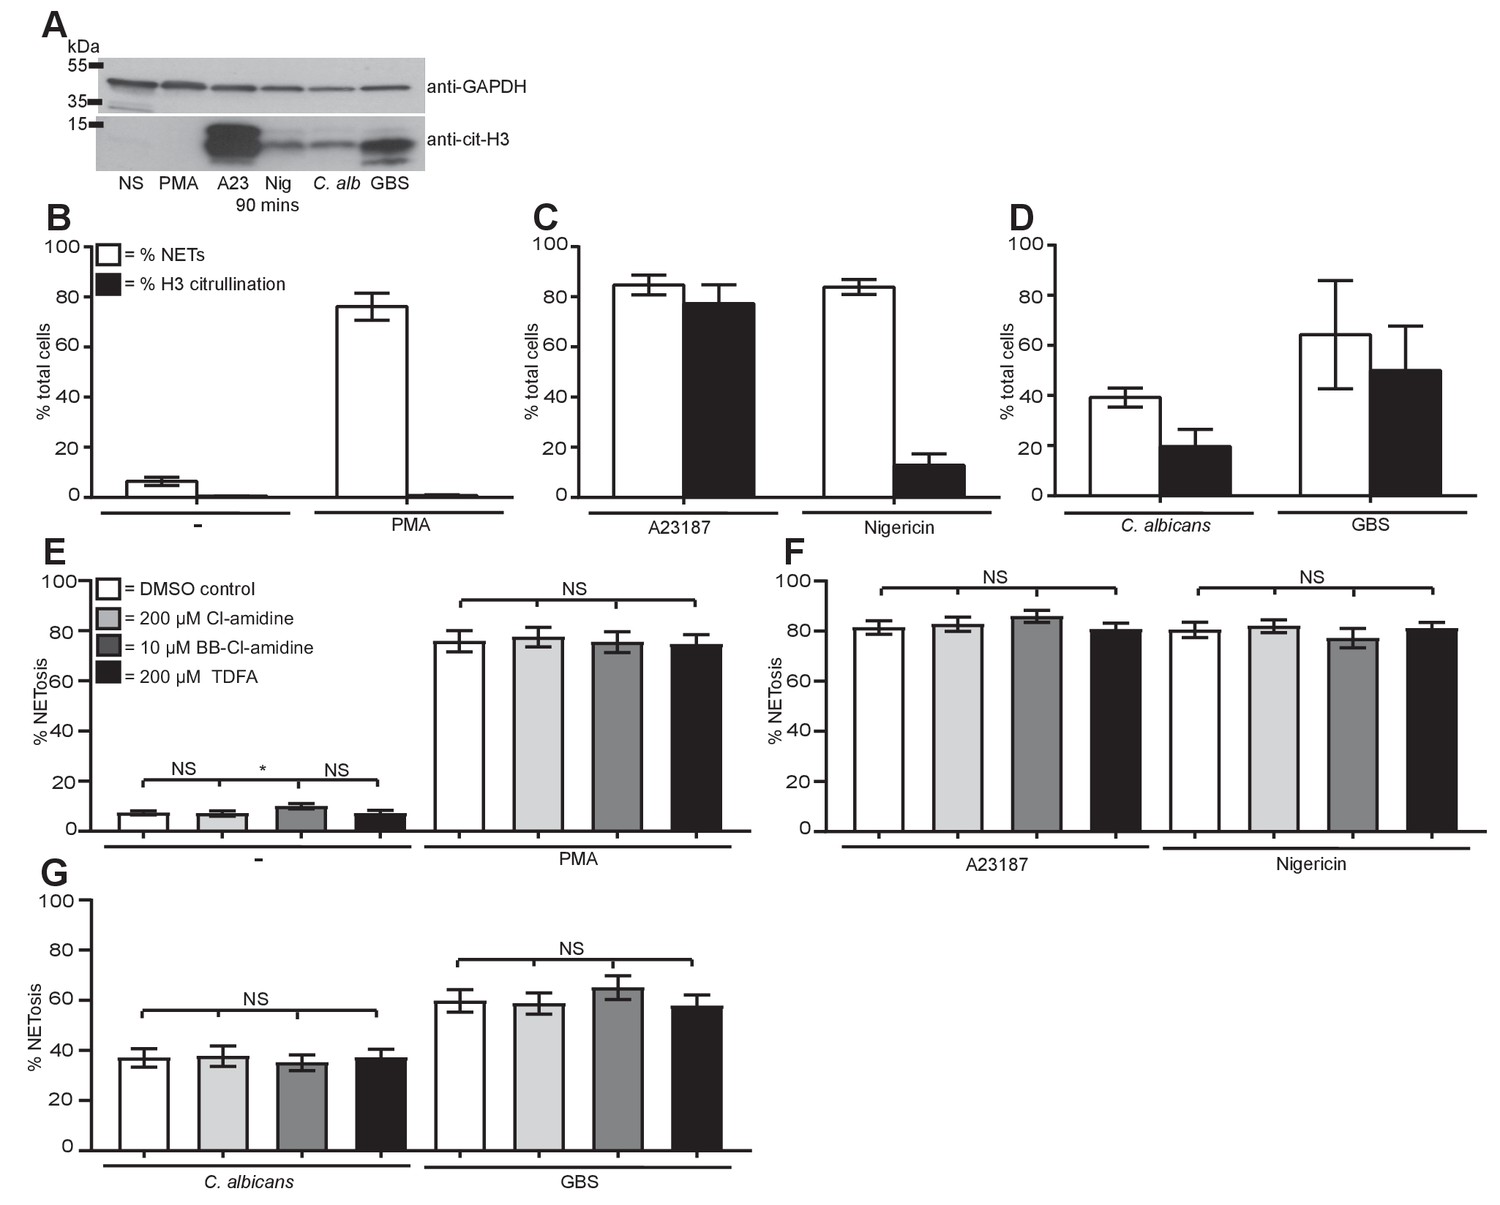
Citrullination of histone H3 occurs during NETosis but is not required for NET induction.
(A–D) Histone H3 was citrullinated during NETosis in response to all stimuli bar PMA. (A) Primary neutrophils were stimulated for 90 min with PMA, A23187, nigericin, C. albicans or GBS, lysed and assayed for the presence of citrullinated histone H3 and GAPDH by SDS-PAGE electrophoresis and Western immunoblotting. (B–D) NETosis rate and percentage of citrullinated cells in response to (B) PMA, (C) A23187 or nigericin and (D) C. albicans or GBS. Graphs show mean ± SD from a representative of two independent experiments. (E–G) NETosis rate in neutrophils pre-treated with the PAD inhibitor Cl-amidine at 200 µM, BB-Cl-amidine at 10 µM, TDFA at 200 µM, or DMSO as control and stimulated with (E) PMA, (F) A23187 or nigericin and (G) C. albicans or GBS and analysed for NET production by immunofluorescence. Graphs show mean ± SEM from 10 independent experiments. *p<0.05, NS = not significant.
-
Figure 6—source data 1
This data is the mean of ten independent NETosis assays in response to the five stimuli of interest in the presence of the PAD inhibitors and was used to generate the histograms in Figure 6.
- https://doi.org/10.7554/eLife.24437.023
Figure 6—figure supplement 1
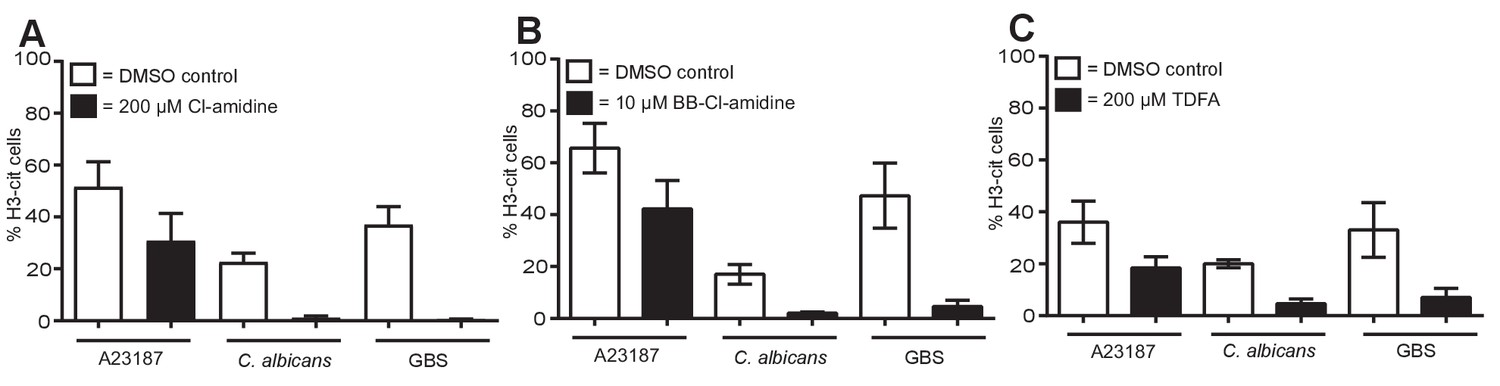
PAD inhibitors reduce histone H3 citrullination.
Neutrophils were pre-treated with (A) 200 µM Cl-amidine, (B) 10 µM BB-Cl-amidine or (C) 200 µM TDFA, stimulated with A23187, C. albicans or GBS for 3–4 hr, fixed, stained with an antibody against citrullinated histone H3 and hoechst and analysed for percentage of cells citrullinated on histone H3 by immunofluorescence. Graphs show mean ± SEM from three independent experiments.
Figure 6—figure supplement 2
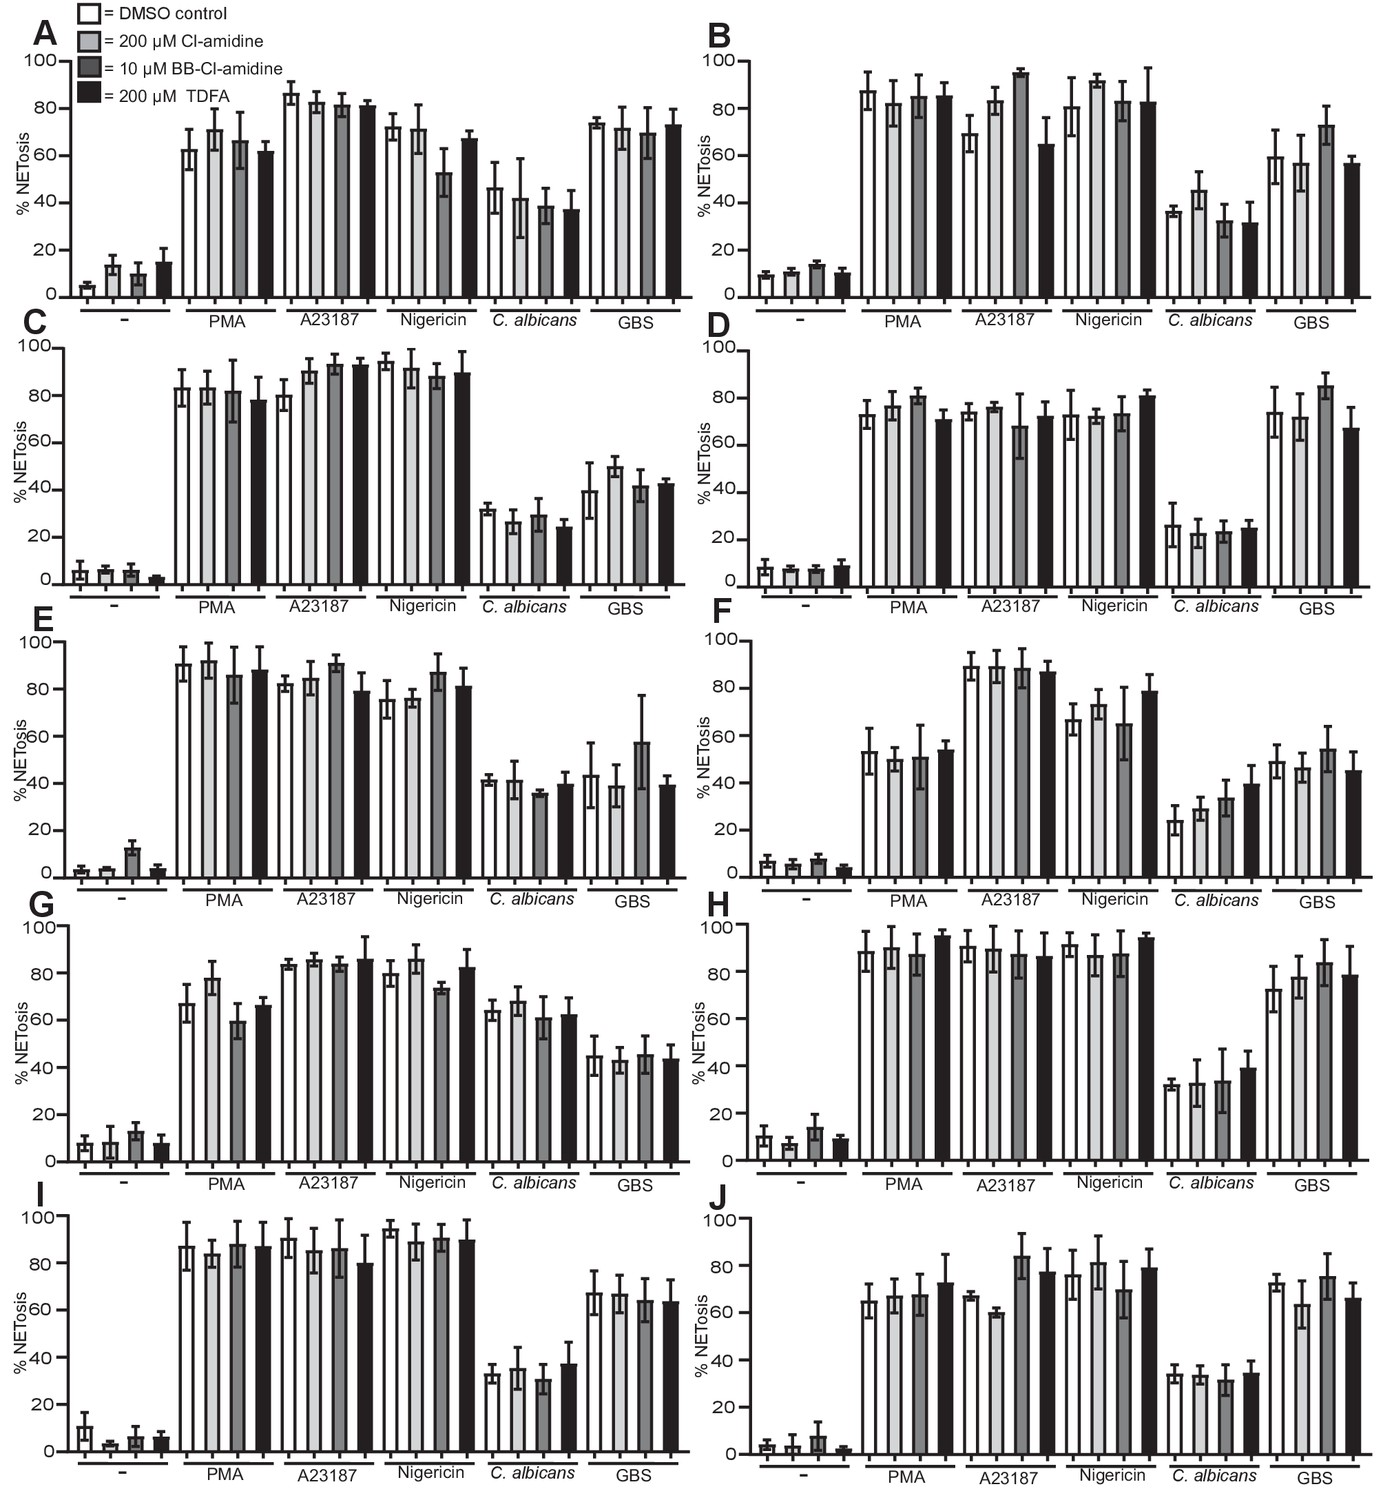
PAD inhibitors do not prevent NETosis.
(A–J) Neutrophils were pre-treated with Cl-amidine at 200 µM (light grey bars), BB-Cl-amidine at 10 µM (dark grey bars), TDFA (black bars) at 200 µM, or DMSO as control (white bars), stimulated with PMA, A23187, nigericin, C. albicans or GBS for 2.5–4 hr and analysed for NET production by immunofluorescence. Graphs show mean ± SD from 10 independent experiments.
Figure 7
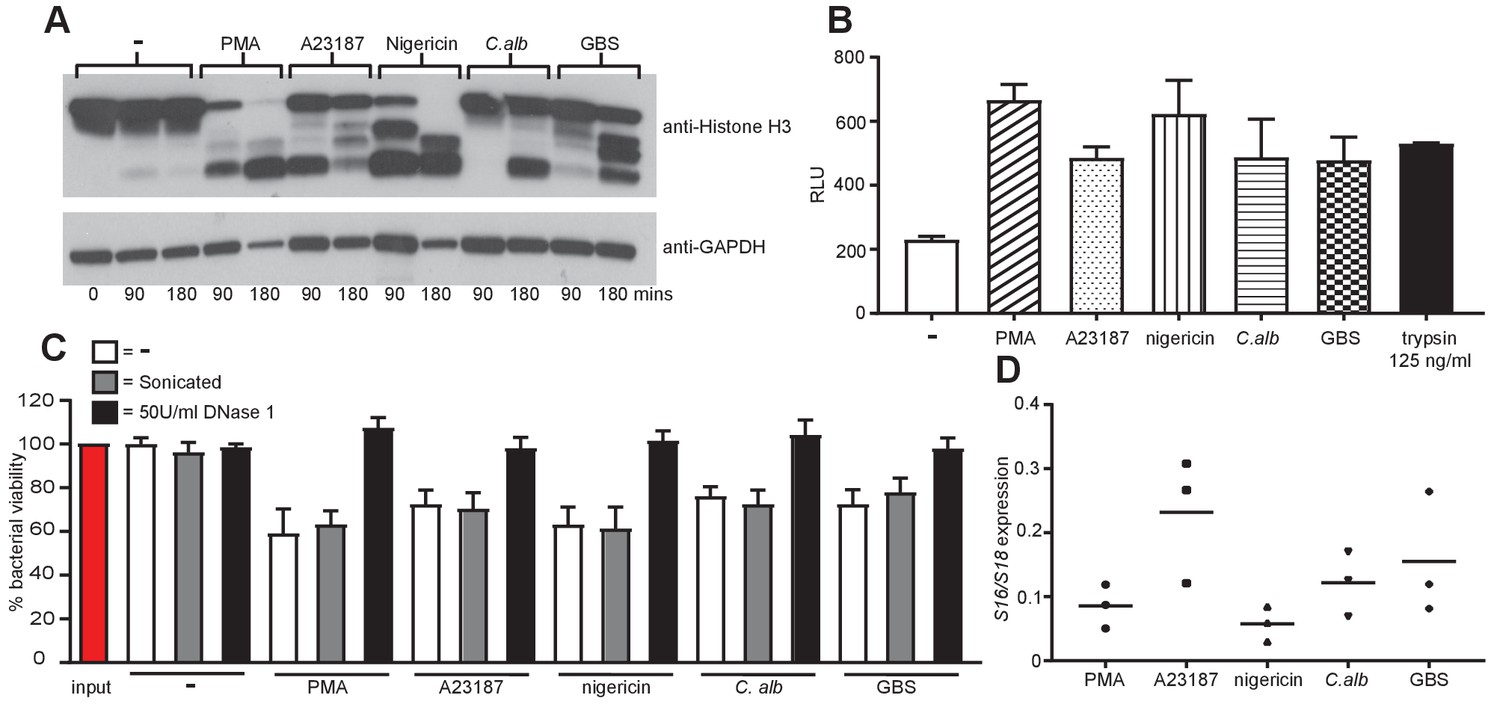
NETs are proteolytically active, kill bacteria and are mainly composed of chromosomal DNA.
(A) NETosis leads to histone H3 degradation. Primary neutrophils were stimulated for 90 and 180 min with PMA, A23187, nigericin, C. albicans or GBS, lysed and assayed for the presence of histone H3 and GAPDH by SDS-PAGE electrophoresis and Western immunoblotting. Shown is a representative of three independent experiments. (B) Isolated NETs are proteolytically active. NETosis was induced for 4 hr, NETs were isolated after treatment with AluI for 20 min, the DNA content was determined and 200 ng/ml DNA was tested for its proteolytic activity using the Pierce Fluorescent Protease Assay Kit according the manufacturer’s instructions. 100 µl of non-stimulated neutrophil supernatant was used to determine the background activity and 125 ng/ml trypsin was added as a positive control. (C) NETs can kill E. coli. Neutrophils were stimulated to produce NETs for 4 hr. Phagocytosis was inhibited by the addition of Cytochalasin D and E. coli at a MOI of 1 were added in the presence or absence of 50 U/ml DNase 1. After 1 hr the cells, NETs and E. coli were collected (selected samples were sonicated), serially diluted, plated on tetracycline-resistant agar plates and incubated for 24 hr at 37°C followed by CFU counts to determine killing. (D) NETs are primarily composed of chromosomal DNA. 4 hr post NET induction the NETs were isolated by MNase treatment, followed by proteinase K treatment. NET DNA was isolated by phenol-chloroform extraction and the ratio of S18 to S16 DNA was analysed by real-time PCR. Graphs show mean ± SEM from three independent experiments.
Figure 8 with 1 supplement
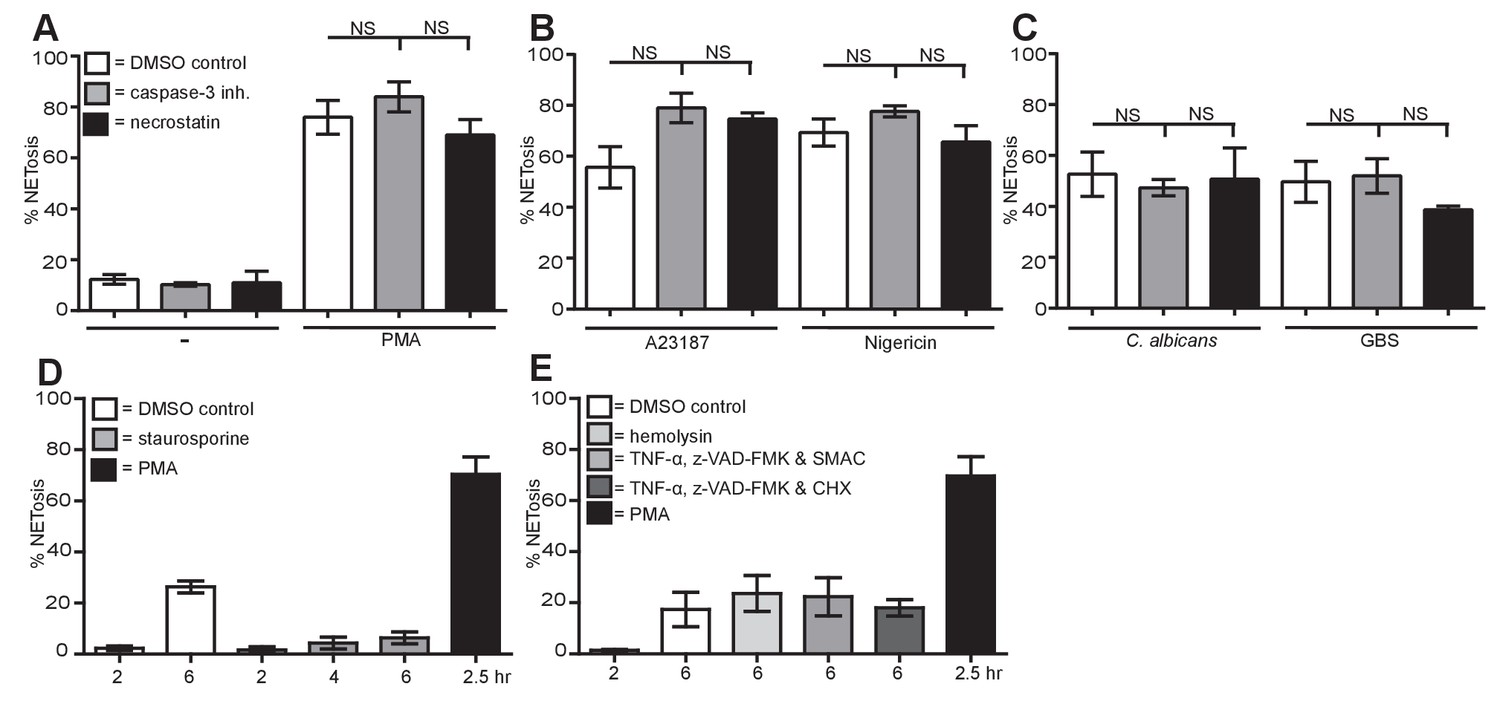
NETosis is a unique form of cell death different from apoptosis, necrosis and necroptosis.
(A–C) NETosis occurs in the presence of apoptosis and necroptosis inhibitors. Primary human neutrophils were pre-treated for 30 min with 20 µM caspase-3 inhibitor or 30 µM necrostatin or a DMSO control and stimulated with (A) PMA, (B) A23187 or nigericin and (C) C. albicans or GBS for 2.5–4 hr and analysed for NET production by immunofluorescence. Graphs show mean ± SEM from three independent experiments. (D) NETosis rate in the presence of the apoptosis inducer staurosporine. Primary neutrophils were stimulated for 2–6 hr with staurosporine (500 nM) or PMA and analysed for NET induction by immunofluorescence. Graphs show mean ± SEM from three independent experiments. (E) NETosis rate in response to necrosis or necroptosis inducers. Primary neutrophils were stimulated with α-hemolysin (25 µg/ml) to induce necrosis or with TNF-α (50 ng/ml), Z-VAD-FMK (50 µM) and a SMAC mimetic (100 nM) or cycloheximide (25 µg/ml) to induce necroptosis for 6 hr and analysed for NET production by immunofluorescence. Graphs show mean ± SEM from three independent experiments. NS = not significant.
-
Figure 8—source data 1
This data is the mean of three independent NETosis assays in response to the five stimuli of interest in the presence of necrostatin or caspase 3 inhibitor and was used to generate the histograms in Figure 8A–C.
- https://doi.org/10.7554/eLife.24437.028
Figure 8—figure supplement 1
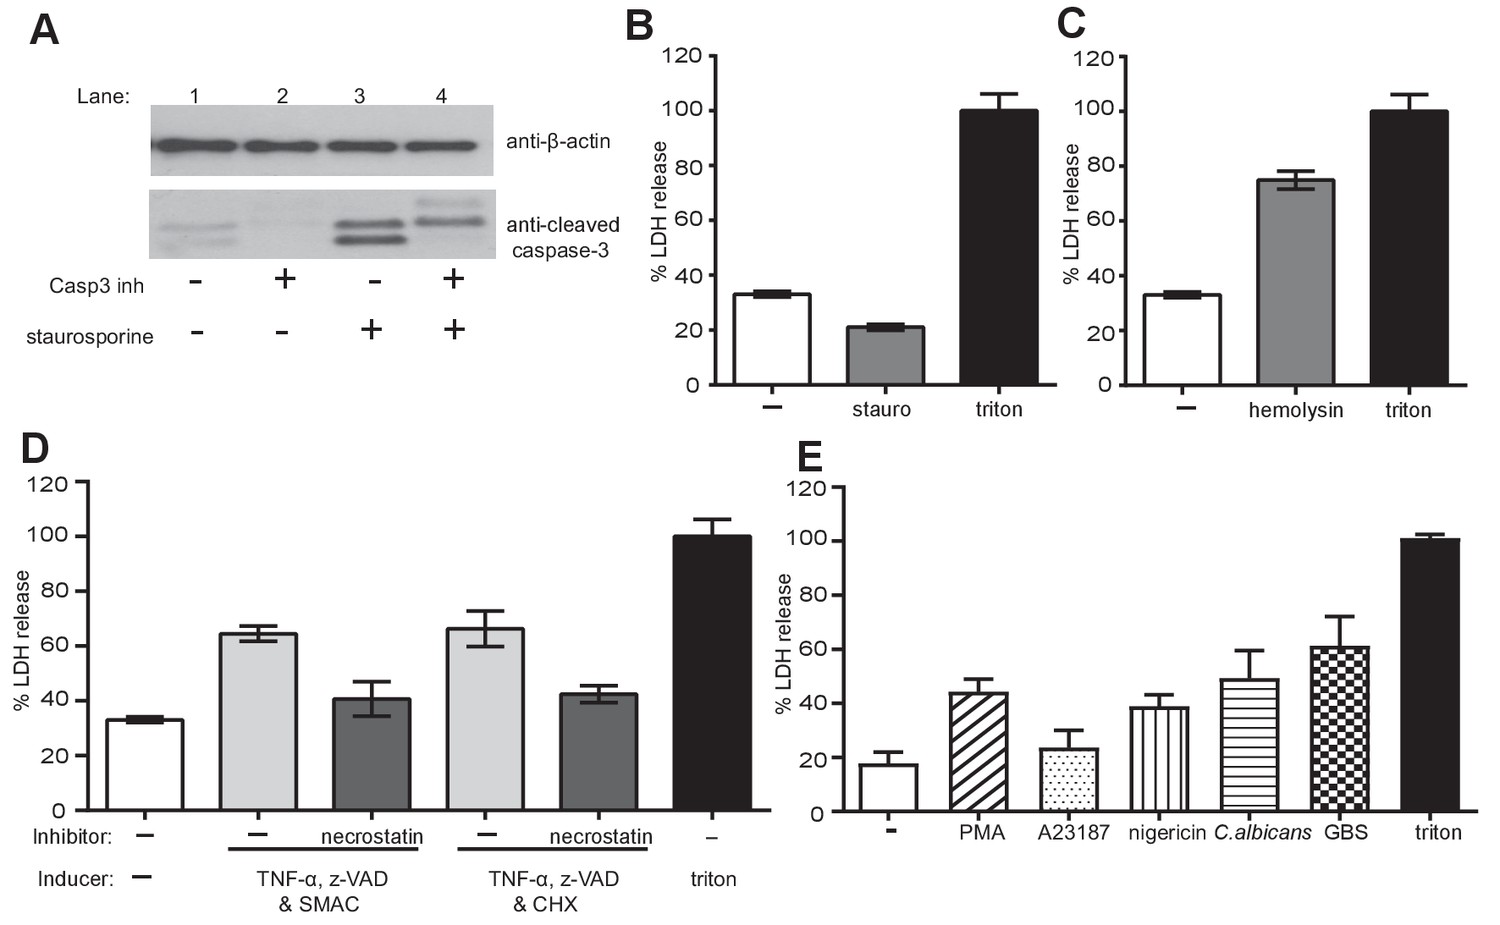
Apoptosis, necrosis and necroptosis can be induced in primary neutrophils, NETosis results in LDH release.
(A) Staurosporine induced caspase-3 cleavage in neutrophils. Primary neutrophils were pre-treated with a caspase-3 inhibitor for 30 mins, stimulated with staurosporine for 3 hr; cell lysates were generated and assayed for the presence of cleaved caspase-3 and β-actin by SDS-PAGE electrophoresis and Western immunoblotting. Data shown is a representative of three independent experiments. (B) Staurosporine does not induce LDH release. Neutrophils were stimulated with staurosporine for 21 hr and LDH release was measured as per the manufacturer’s instructions. (C) Neutrophils were stimulated for 21 hr with α-hemolysin and LDH release was measured. (D) Neutrophils were pre-treated with a necrostatin inhibitor for 30 min and stimulated with TNF-α, Z-VAD-FMK and a SMAC mimetic or cycloheximide (CHX) for 21 hr and LDH release was measured. (C–D) Graphs show mean ± SD from a representative of two independent experiments. (E) LDH is released in NETosis. Neutrophils were treated with the indicated stimuli for 4 hr and LDH release was measured. Graph shows mean ± SEM from three independent experiments. Treatment of neutrophils with triton-X100 was used to normalise the data with triton treatment set to 100% LDH release.
Videos
Video 1
No NETosis in non-stimulated primary neutrophils
Primary neutrophils were stained with Draq5 (blue) and cell impermeable Sytox Green (green) and imaged for 6 hr using a Leica SP8 AOBS confocal microscope. Video is representative of three independent experiments.
Video 2
PMA induced NETosis in primary neutrophils
Primary neutrophils were stained with Draq5 (blue) and cell impermeable Sytox Green (green), stimulated with 50 nM PMA and imaged for 6 hr using a Leica SP8 AOBS confocal microscope. The appearance of the green colour indicated NETosis. Video is representative of three independent experiments.
Video 3
A23187 induced NETosis in primary neutrophils
Primary neutrophils were stained with Draq5 (blue) and cell impermeable Sytox Green (green), stimulated with 5 µM A23187 and imaged for 6 hr using a Leica SP8 AOBS confocal microscope. The appearance of the green colour indicated NETosis. Video is representative of three independent experiments.
Video 4
Nigericin induced NETosis in primary neutrophils
Primary neutrophils were stained with Draq5 (blue) and cell impermeable Sytox Green (green), stimulated with 15 µM nigericin and imaged for 6 hr using a Leica SP8 AOBS confocal microscope. The appearance of the green colour indicated NETosis. Video is representative of three independent experiments.
Video 5
C. albicans induced NETosis in primary neutrophils.
Primary neutrophils were stained with Draq5 (blue) and cell impermeable Sytox Green (green), stimulated with MOI 5 C. albicans and imaged for 6 hr using a Leica SP8 AOBS confocal microscope. The appearance of the green colour indicated NETosis. Video is representative of three independent experiments.
Video 6
GBS induced NETosis in primary neutrophils.
Primary neutrophils were stained with Draq5 (blue) and cell impermeable Sytox Green (green), stimulated with MOI 10 GBS and imaged for 6 hr using a Leica SP8 AOBS confocal microscope. The appearance of the green colour indicated NETosis. Video is representative of three independent experiments.
Tables
Table 1
CGD patient donors. Nomenclature for genotypes is according to den Dunnen and Antonarakis (den Dunnen and Antonarakis, 2001).
| Donor | Age | Nucleotide change | Mutation | Amino acid change | Residual activity |
|---|---|---|---|---|---|
| 1 | 24 | CYBB c.742dupA | insertion | p.Ile248AsnfsX36 | No |
| 2 | 25 | CYBB c.868C > T | nonsense | p.Arg290X | No |
| 3 | 18 | CYBB c.1421T > G | missense | p.Leu474Arg | No |
| 4 | 26 | CYBB c.868C > T | nonsense | p.Arg290X | No |
| 5 | 29 | CYBA c.371C > T | missense | p.Ala124Val | Yes |
Additional files
-
Supplementary file 1
Graphical abstract: The diverse mechanisms of NETosis.
In this study, we investigated whether NETosis occurs through a single signalling pathway or is induced by the five stimuli of interest in a diverse manner. As demonstrated, NETosis in response to C. albicans and GBS requires ROS, MPO and NE and induces histone H3 citrullination. This is in comparison to the NETosis seen in response to A23187 and nigericin during which none of the molecules highlighted above are required but citrullination of histone H3 does occur. Finally, we re-confirm that PMA-induced NETosis requires ROS, MPO and NE but does not result in the citrullination of histone H3.
- https://doi.org/10.7554/eLife.24437.030
Download links
A two-part list of links to download the article, or parts of the article, in various formats.
Downloads (link to download the article as PDF)
Open citations (links to open the citations from this article in various online reference manager services)
Cite this article (links to download the citations from this article in formats compatible with various reference manager tools)
Diverse stimuli engage different neutrophil extracellular trap pathways
eLife 6:e24437.
https://doi.org/10.7554/eLife.24437


