A diverse host thrombospondin-type-1 repeat protein repertoire promotes symbiont colonization during establishment of cnidarian-dinoflagellate symbiosis
- Victoria University of Wellington, New Zealand
- Western Oregon University, United States
- Oregon State University, United States
- Dragonfly Data Science, New Zealand
- Planktovie sas, France
Figures
Figure 1
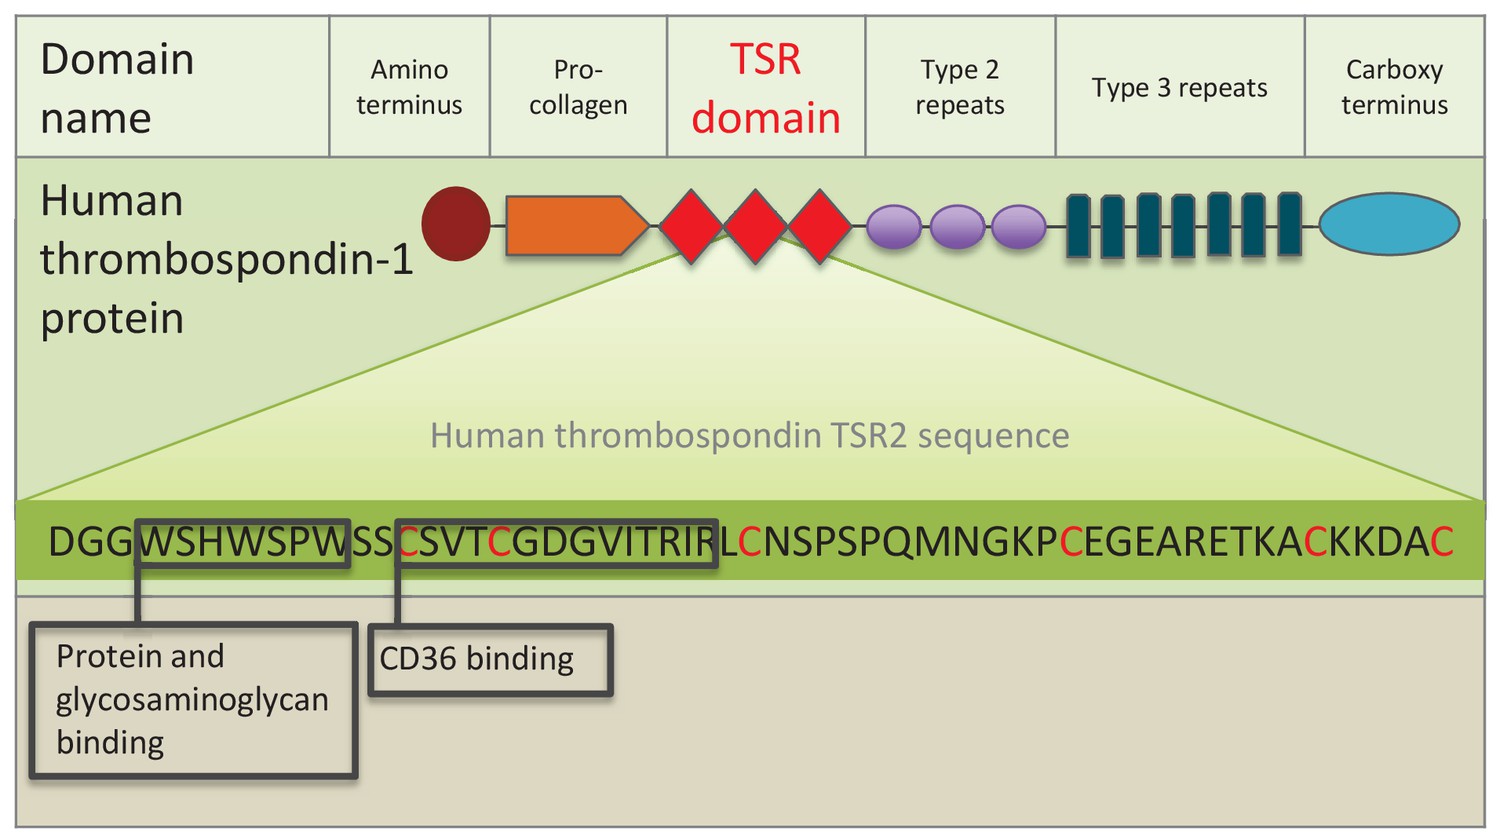
Schematic representation of human thrombospondin 1 protein.
The three TSR (Thrombospondin Structural homology Repeat) domains are depicted by three red diamonds. The amino acid sequence of the second TSR sequence is shown with six conserved cysteines in red. Known binding motifs and capabilities of the human thrombospondin TSR domain two are listed and depicted in boxes. (Redrawn from Zhang and Lawler, 2007).
Figure 2 with 1 supplement
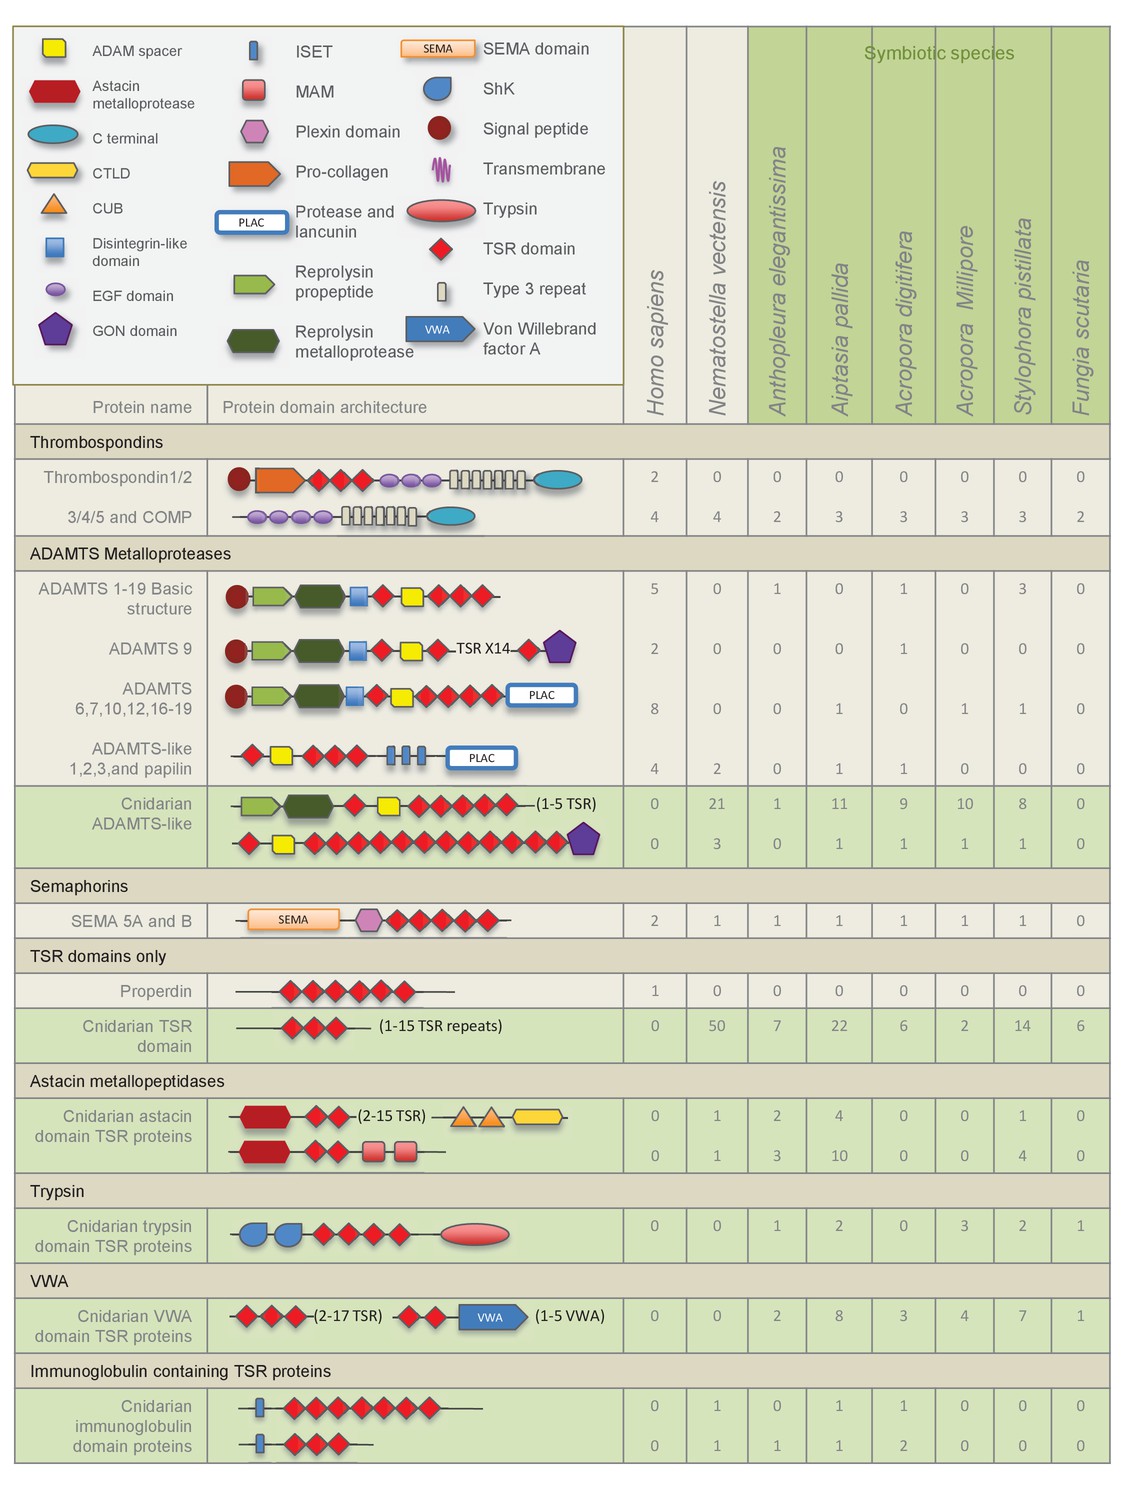
Domain architecture of cnidarian TSR super-family proteins compared to known vertebrate TSR-domain-containing proteins.
https://doi.org/10.7554/eLife.24494.004
Figure 2—figure supplement 1
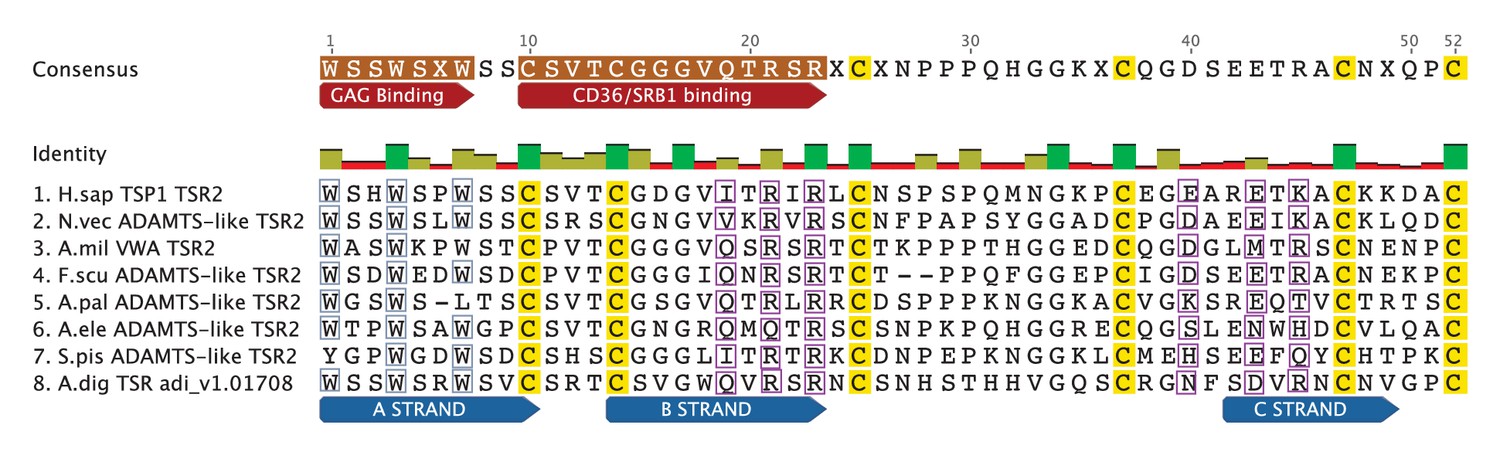
The TSR domain is very well conserved from cnidarians up to humans, with binding motifs for glycosaminoglycans (GAGs) and the type B scavenger receptors, CD36/SRB1.
All three-dimensional folding sites are present as described by Tan et al. (2002) for the crystal structure of human TSP1 TSR2. Six conserved cysteine residues are highlighted in yellow and form three disulfide bridges (C1–C5, C2–C6 and C3–C4). Three conserved tryptophan residues are shown in blue boxes and mark the ‘WXXW’ protein-binding motif. Amino acids that form the R layers are marked with purple boxes, and pairings forming 3 R layers are as follows: R3-R4, R2-R5 and R1-R6. The Β strands are annotated at the bottom in blue strands A, B and C. Please refer to Tan et al. (2002) for a more detailed explanation of the three-dimensional folding.
Figure 3 with 1 supplement
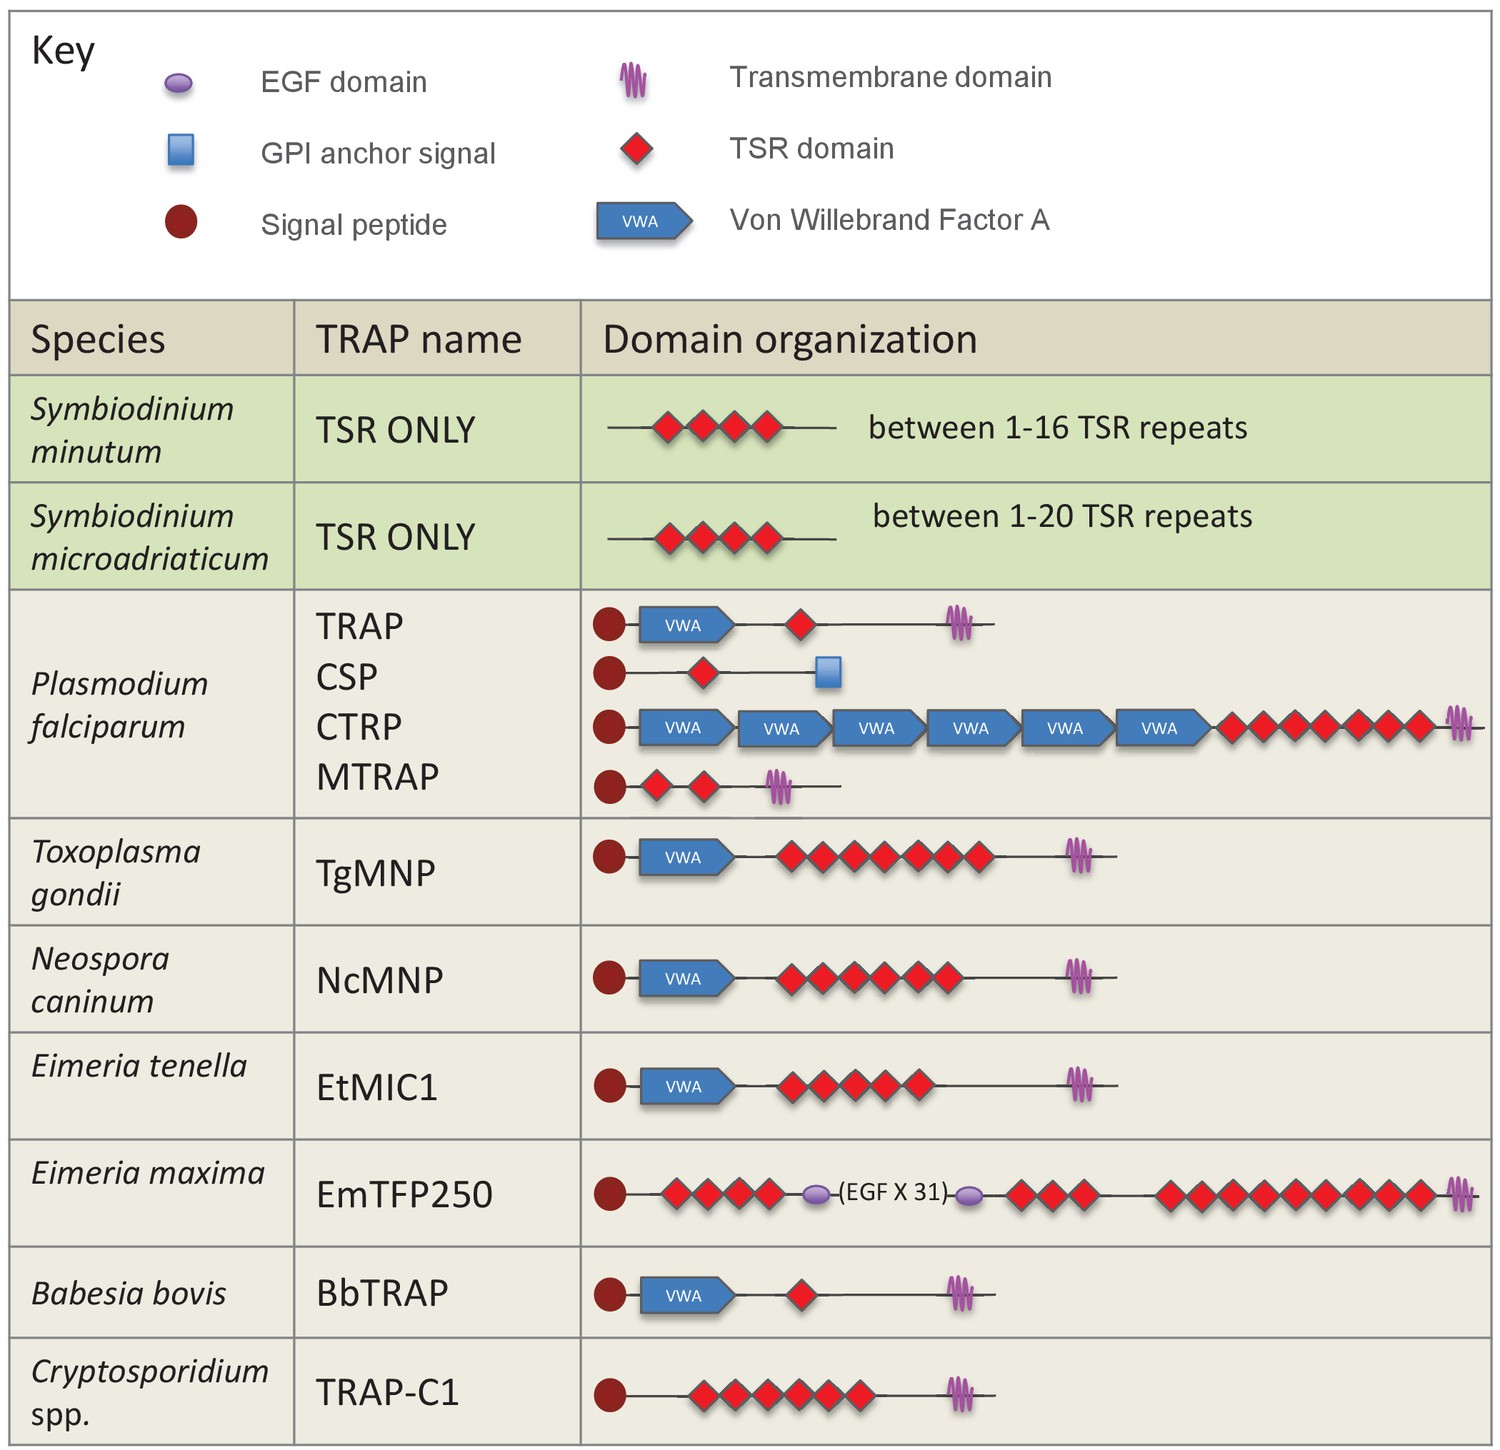
Schematic representation of members of the TSR gene family in dinoflagellates and apicomplexan parasites.
TSRs from the dinoflagellates Symbiodinium minutum and S. microadriaticum are shown in green. Apicomplexan TRAP proteins are shown in beige.
Figure 3—figure supplement 1
TSR domain alignment compares apicomplexan TRAP TSR domains with TSR domains from the dinoflagellates Symbiodinium minutum and S. microadriaticum, TSR 2 from human TSP1, and ADAMTS-like TSR domains from the anemones Nematostella vectensis and Aiptasia pallida.
Positioning and absence of specific cysteine residues (colored yellow) in TRAP and Symbiodinium TSRs will result in different patterns of disulfide bonds and three-dimensional folding. Binding sites for glycosaminoglycans (GAGs) and the scavenger receptors CD36/SRB1 (annotated in red) are somewhat conserved.
Figure 4 with 2 supplements
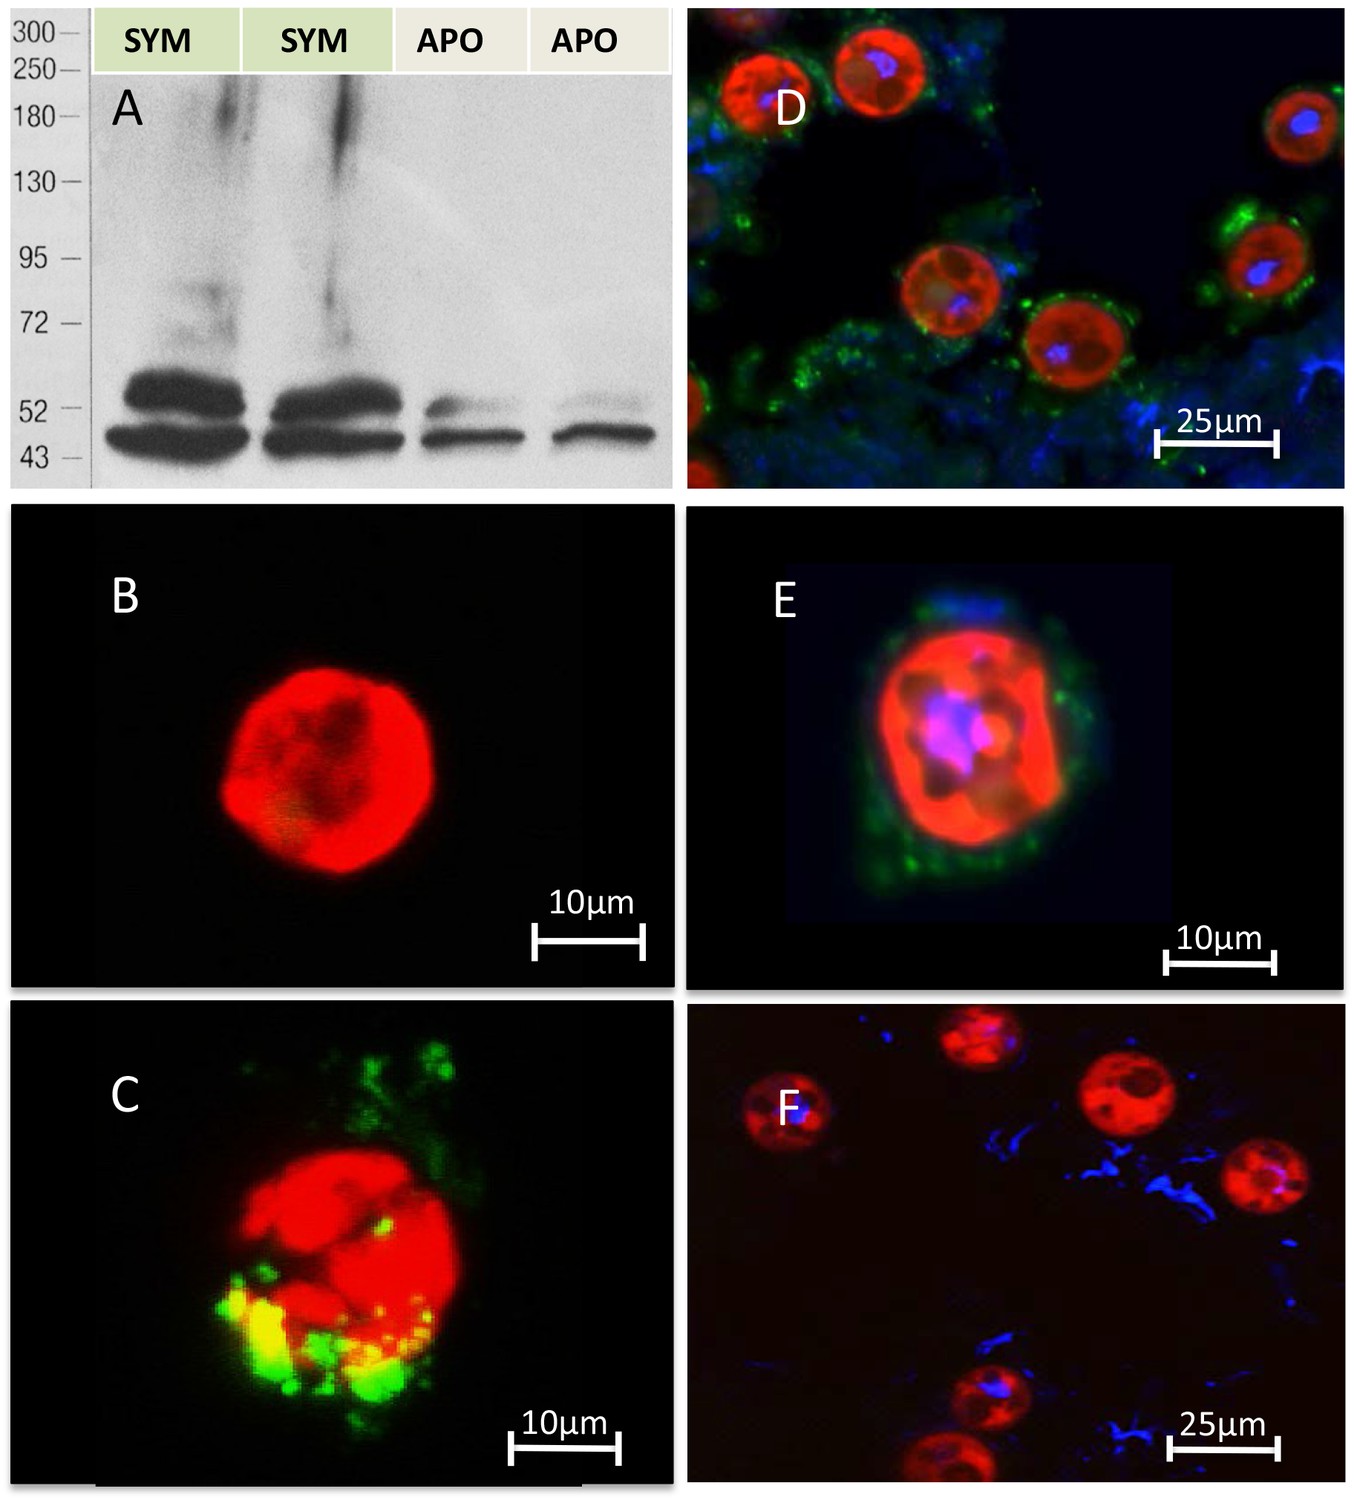
Immuno-analyses using anti-thrombospondin show evidence of TSRs in symbiotic anemone host tissues.
(A) Immunoblots of symbiotic (SYM) and aposymbiotic (APO) A. pallida label bands at 40 and 47 kDa in symbiotic anemones and a single band at 40 kDa in aposymbiotic anemones. (B, C) Confocal images of dinoflagellate cells taken from (B) culture or (C) freshly isolated cells taken from A. pallida homogenates. A fluorescent probe conjugated to anti-human thrombospondin does not label cells from culture (B) but strongly labels host cell debris and/or membranes associated with freshly isolated cells (C). (D, E) Confocal images of cryosections from symbiotic A. pallida gastrodermal tissue stained with anti-thrombospondin at lower (D) and higher (E) magnification. Anti-thrombospondin labelling is evident in host tissues surrounding symbionts. (F) Confocal image of control anemone cryosections incubated with secondary antibody only. No anti-thrombospondin labeling is evident. Green = anti-thrombospondin, Red = algal autofluorescence, blue = DAPI stain of host and symbiont nuclei.
Figure 4—figure supplement 1
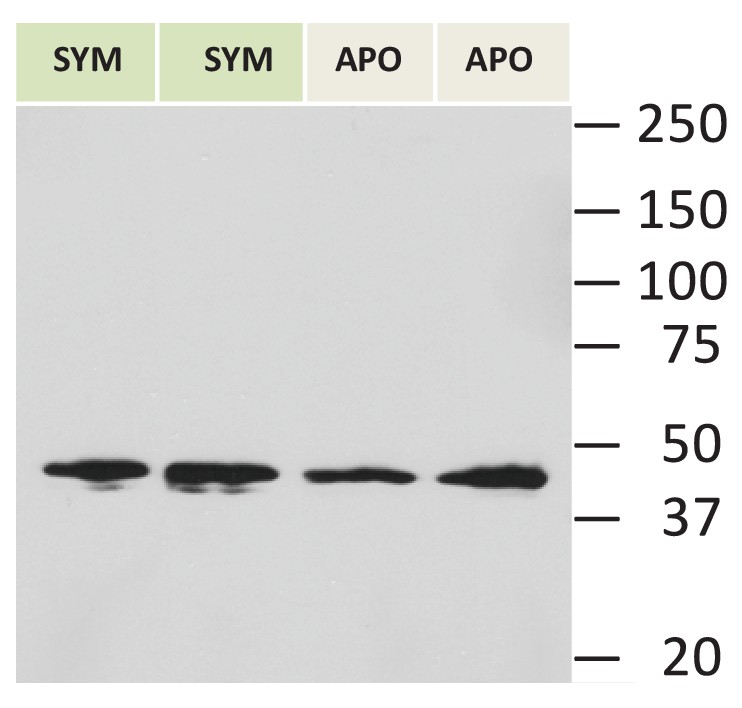
A: Actin control for immunoblot blot in Figure 4.
https://doi.org/10.7554/eLife.24494.009
Figure 4—figure supplement 2
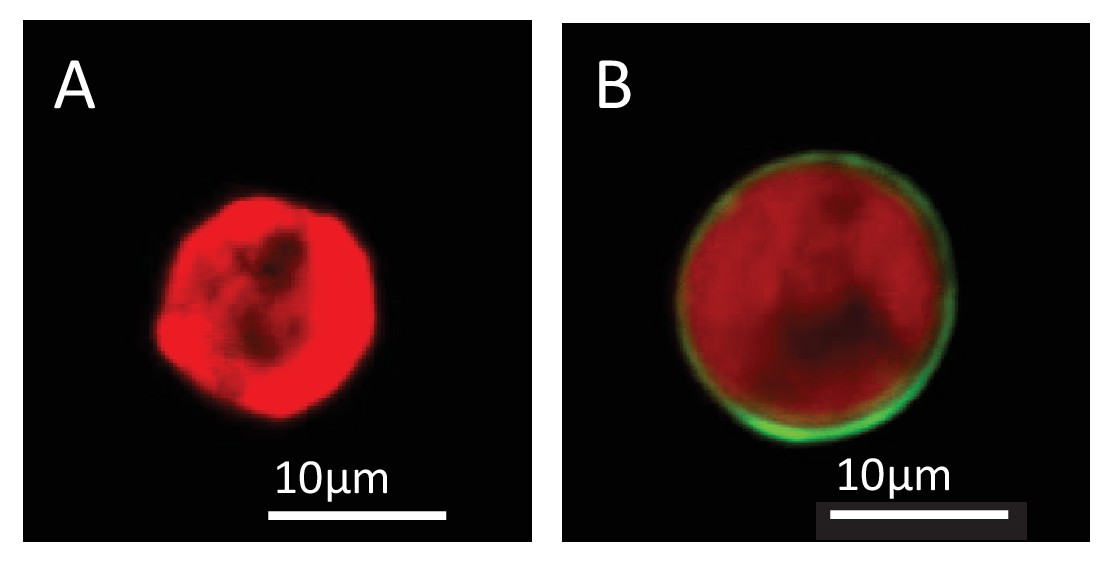
Lipophilic membrane staining of dinoflagellate cells using Dil.
Lipophilic membrane stain Dil was absent from (A) cultured algae but present in (B) freshly isolated symbionts. This is evidence of the presence of a symbiosome membrane surrounding freshly isolated symbionts.
Figure 5
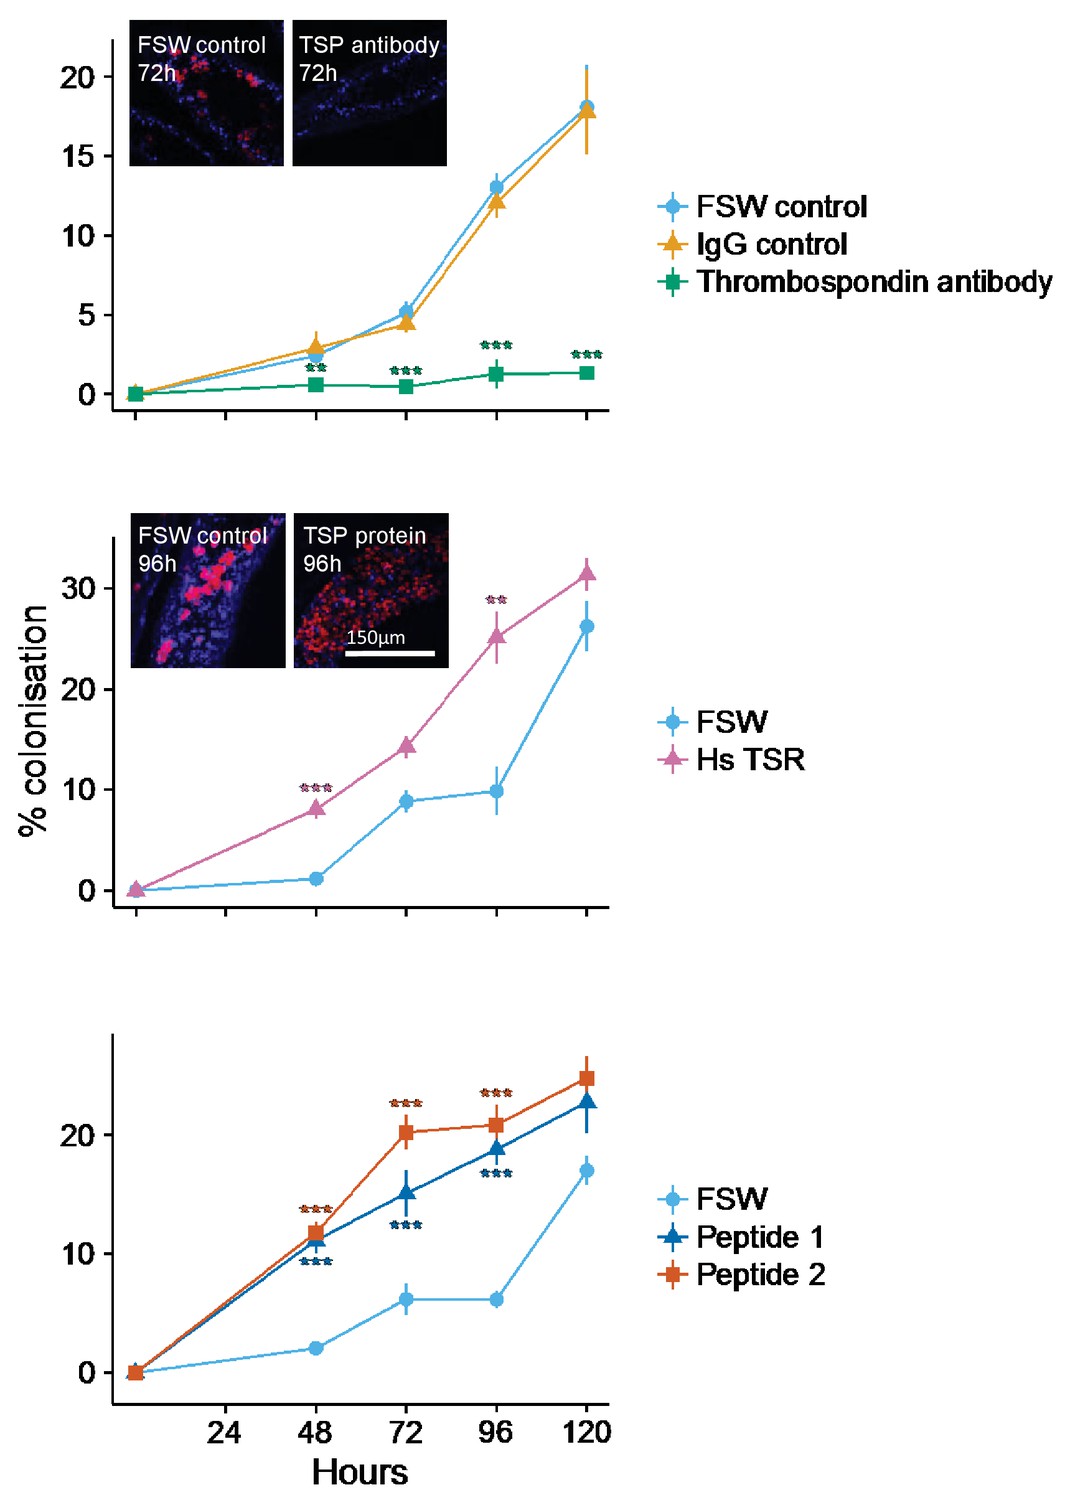
Kinetics of recolonization after antibody and peptide treatments.
(A) Anemones pre-incubated in an anti-human thrombospondin (green) show decreased colonization success compared FSW-only (light blue) and IgG (orange) controls. Inset: confocal images show representative tentacle slices at 72 hr post-inoculation. (B) The addition of exogenous human thrombospondin-1 (purple) significantly increased the colonization rate during colonization, compared to control anemones in FSW (blue). Inset confocal images show representative tentacle slices at 96 hr post-inoculation. (C) The effect of synthetic TSR peptides 1 (blue) and 2 (orange) on colonization rates compared to the control anemones in FSW. Anemones treated with both peptides 1 and 2 showed increased uptake of algae during colonization. Statistical significance of treatment effects was assessed using mixed effects models, with contrasts calculated between individual treatments and FSW at each time-point; ***p<0.001; *p<0.05; p<0.1.
-
Figure 5—source data 1
Source data used for statistical analyses described in results and depicted in Figure 5A: Long-form table with experimental results described in the results section Blocking TSR domains inhibits symbiont uptake by host anemones and shown in Figure 5A.
Treatments labels are FSW: Filtered Sea Water, anti-TSR: anti-human thrombospondin antibody, Igg: IgG control.
- https://doi.org/10.7554/eLife.24494.012
-
Figure 5—source data 2
Summary statistics (mean and s.e.) displayed in Figure 5A.
Summary statistics for results in section Blocking TSR domains inhibits symbiont uptake by host anemones as shown in Figure 5A.
- https://doi.org/10.7554/eLife.24494.013
-
Figure 5—source data 3
Source data used for statistical analyses described in results and depicted in Figure 5B.
Long-form table with experimental results described in the results section Addition of exogenous human thrombospondin-1 results in ‘super colonization’ of hosts by symbionts and shown in Figure 5B. Treatments labels are FSW: Filtered Sea Water, Hs-TSR: Homo sapiens exogenous TSR protein treatment.
- https://doi.org/10.7554/eLife.24494.014
-
Figure 5—source data 4
Summary statistics (mean and s.e.) displayed in Figure 5B.
Summary statistics for results in section Addition of exogenous human thrombospondin-1 results in ‘super colonization’ of hosts by symbionts as shown in Figure 5B.
- https://doi.org/10.7554/eLife.24494.015
-
Figure 5—source data 5
Source data used for statistical analyses described in results and depicted in Figure 5C.
Long-form table with experimental results described in the results section Addition of exogenous A. pallida TSR peptide fragments during inoculation increases colonization success and shown in Figure 5C.
- https://doi.org/10.7554/eLife.24494.016
-
Figure 5—source data 6
Summary statistics (mean and s.e.) displayed in Figure 5C.
Summary statistics for results in section Addition of exogenous A. pallida TSR peptide fragments during inoculation increases colonization success as shown in Figure 5C.
- https://doi.org/10.7554/eLife.24494.017
Figure 6
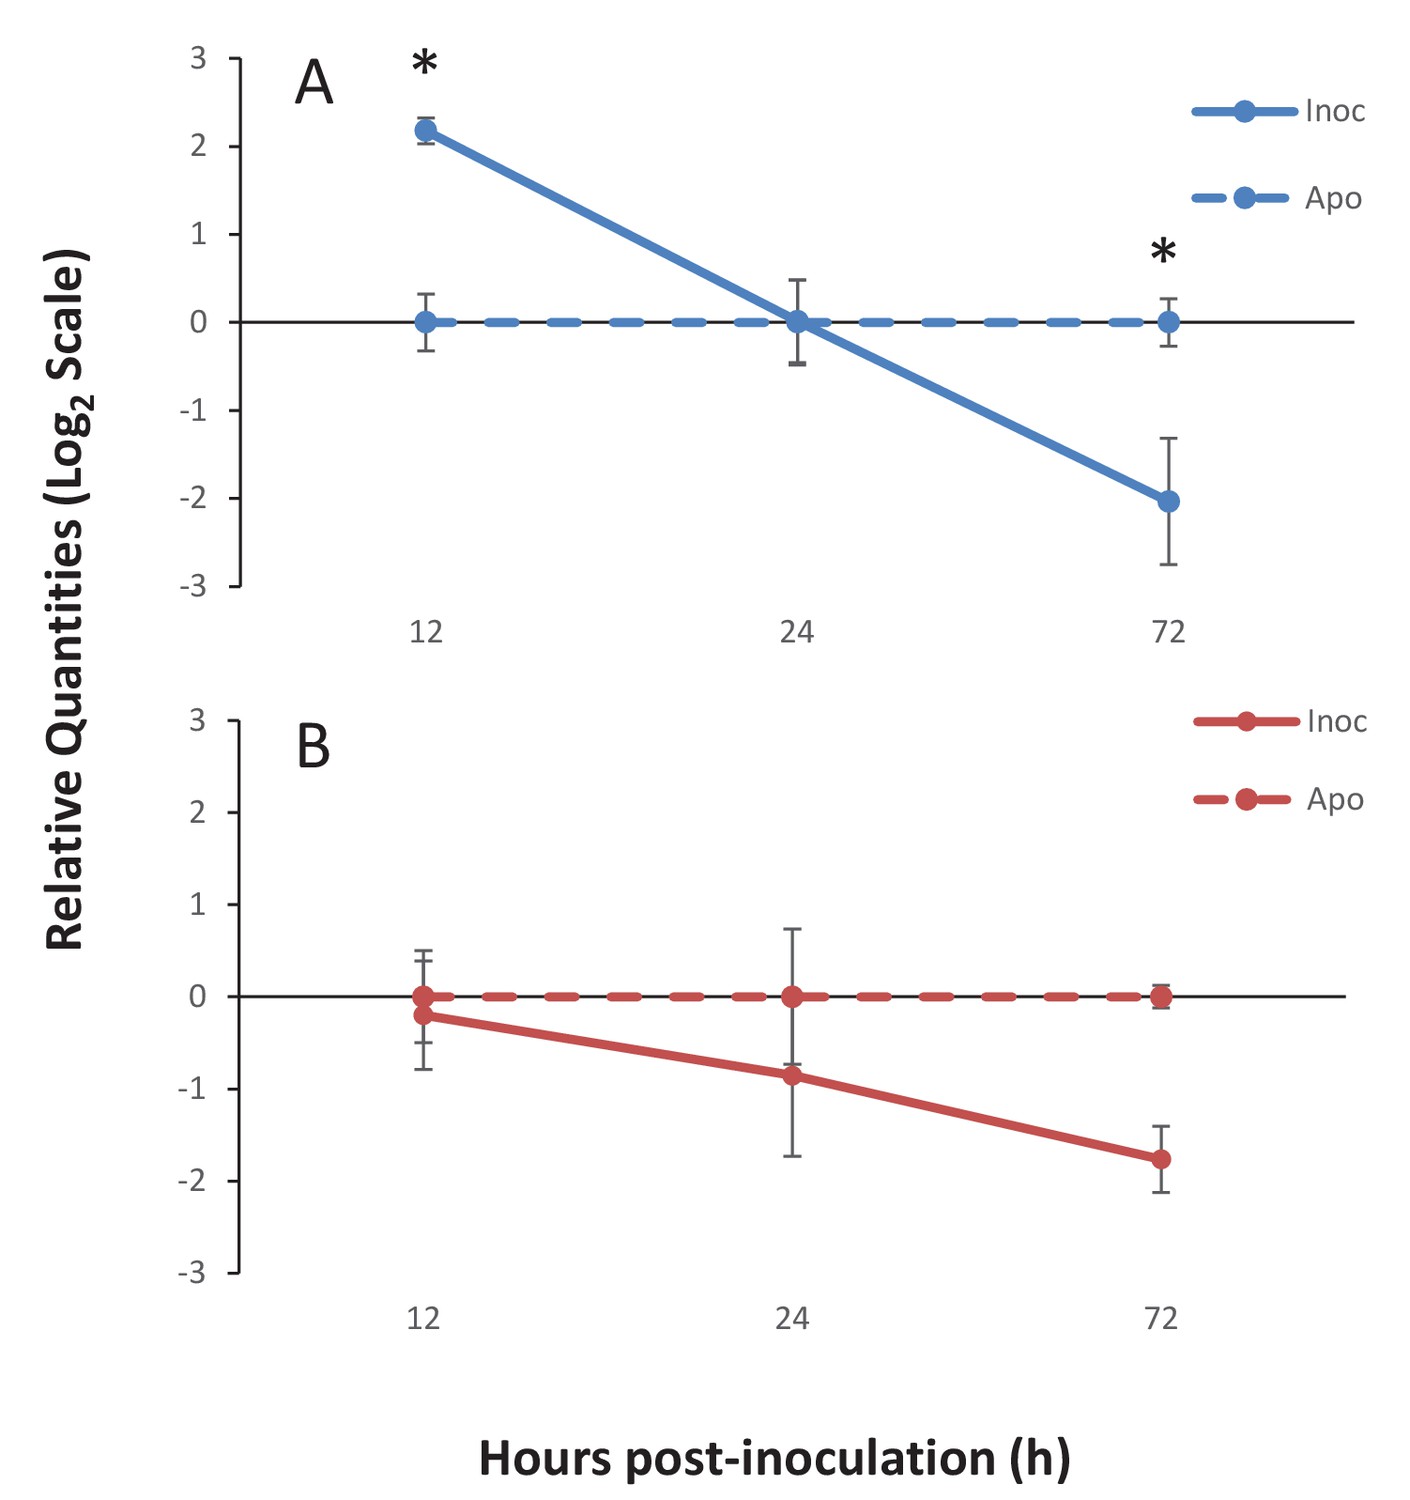
Gene expression of Ap_Sema5 and Ap_Trypsin-like at the onset of symbiosis.
The relative quantities from qPCR on the log2 scale are shown for animals that were inoculated with symbionts (‘Inoc’; solid line) and those that remained aposymbiotic (‘Apo’; dashed line). Bars represent means ± SE (n = 3) and stars represent significantly different levels of expression between the inoc and apo treatments at a particular time point (two-way ANOVA, Tukey’s post hoc test). *p<0.05, **p<0.01.
-
Figure 6—source data 1
Source data used for statistical analyses described in results and depicted in Figure 6.
Long-form table with experimental results described in the results section Ap_Sema-5 expression increases at early time-points during the onset of symbiosis and shown in Figure 6.
- https://doi.org/10.7554/eLife.24494.019
Figure 7
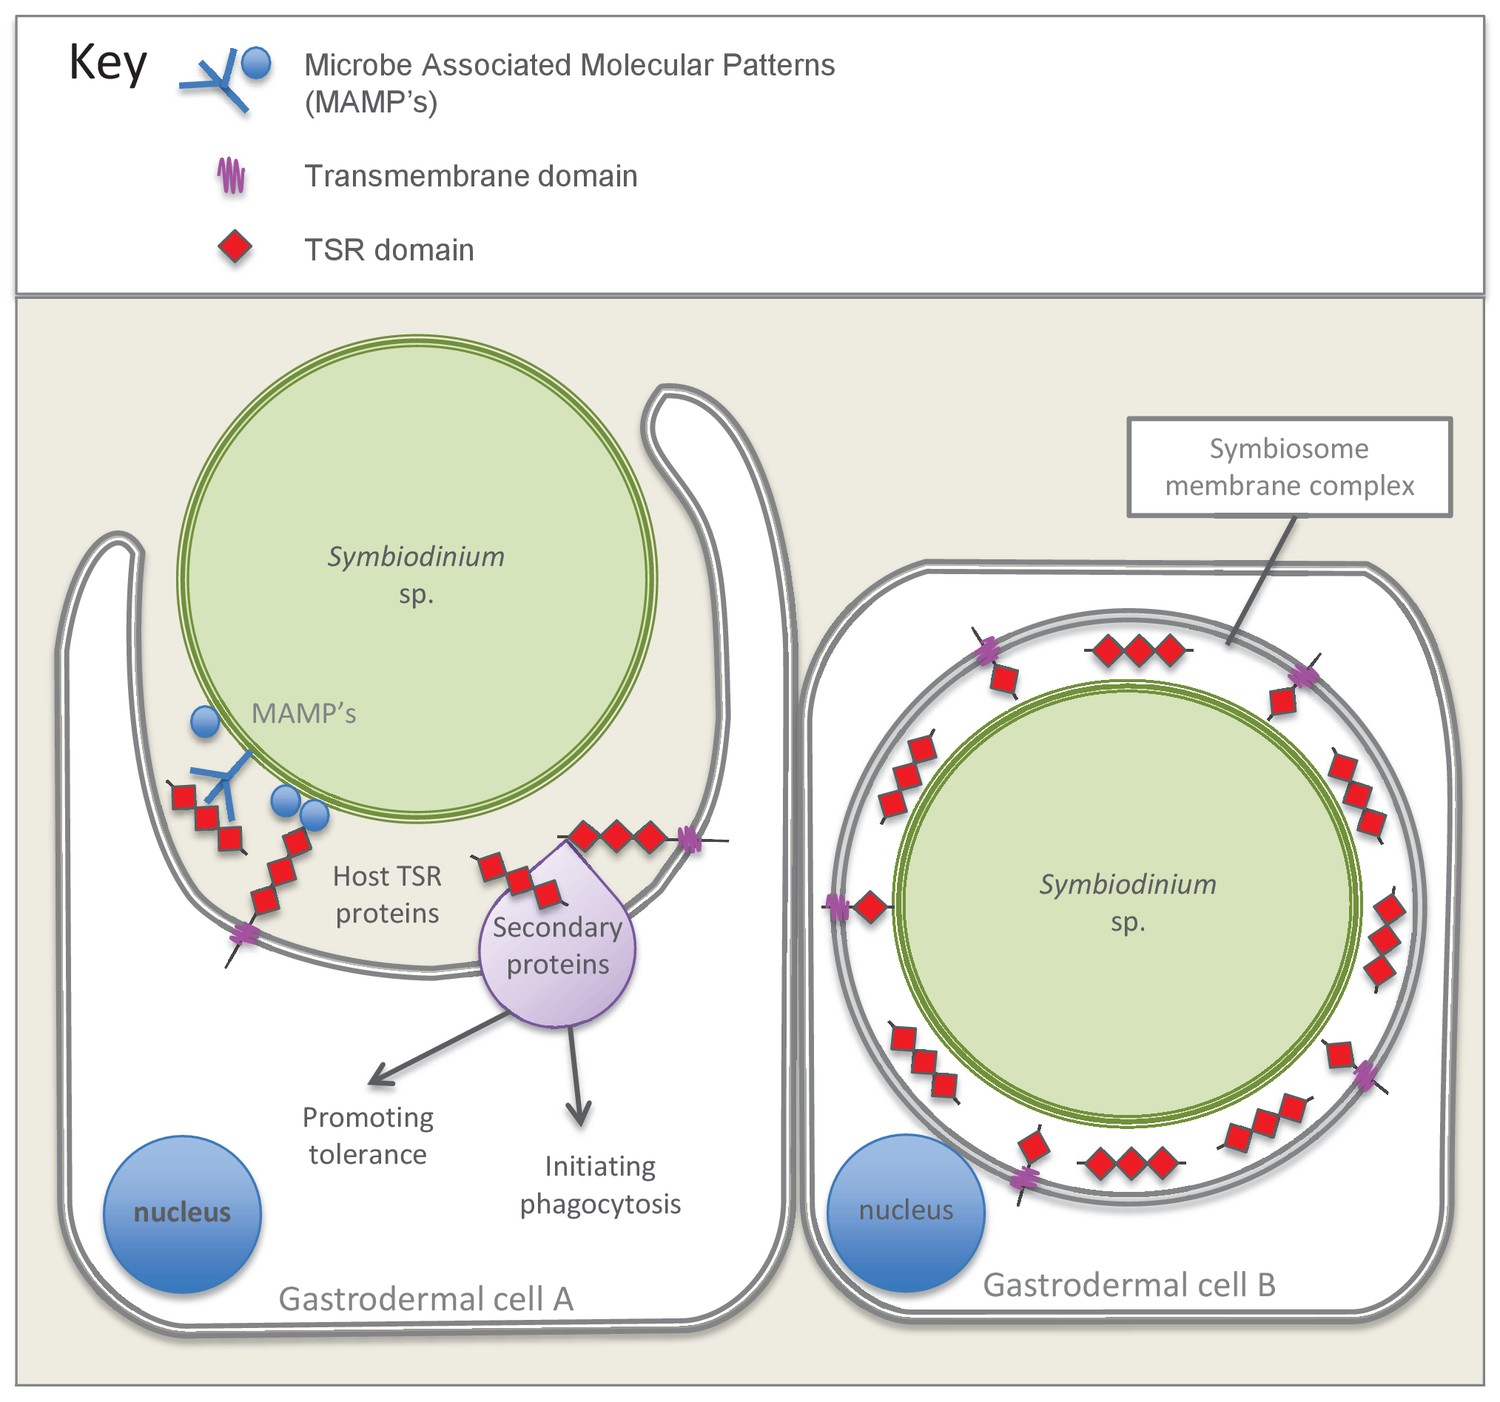
Model summarizing the evidence emerging from immunolocalization and functional experiments.
Gastrodermal cell A depicts an aposymbiotic host cell in the process of symbiont acquisition. Results indicate that the addition of soluble TSR proteins promotes and enhances symbiont colonization. We suggest that secreted host TSR proteins may interact with MAMPs and/or secondary proteins to promote tolerance and initiate phagocytosis. Peptide experiments provide evidence against the hypothesis that membrane-linked host TSRs are serving as PRRs to promote inter-partner recognition; we hypothesize that host TSR proteins are secreted rather than membrane-anchored (see discussion text for further explanation). Gastrodermal cell B depicts a symbiotic host cell. Fluorescence microscopy suggests that TSR proteins are expressed within the host-derived symbiosome membrane complex and are concentrated around the symbionts within host gastrodermal tissue.
Figure 8
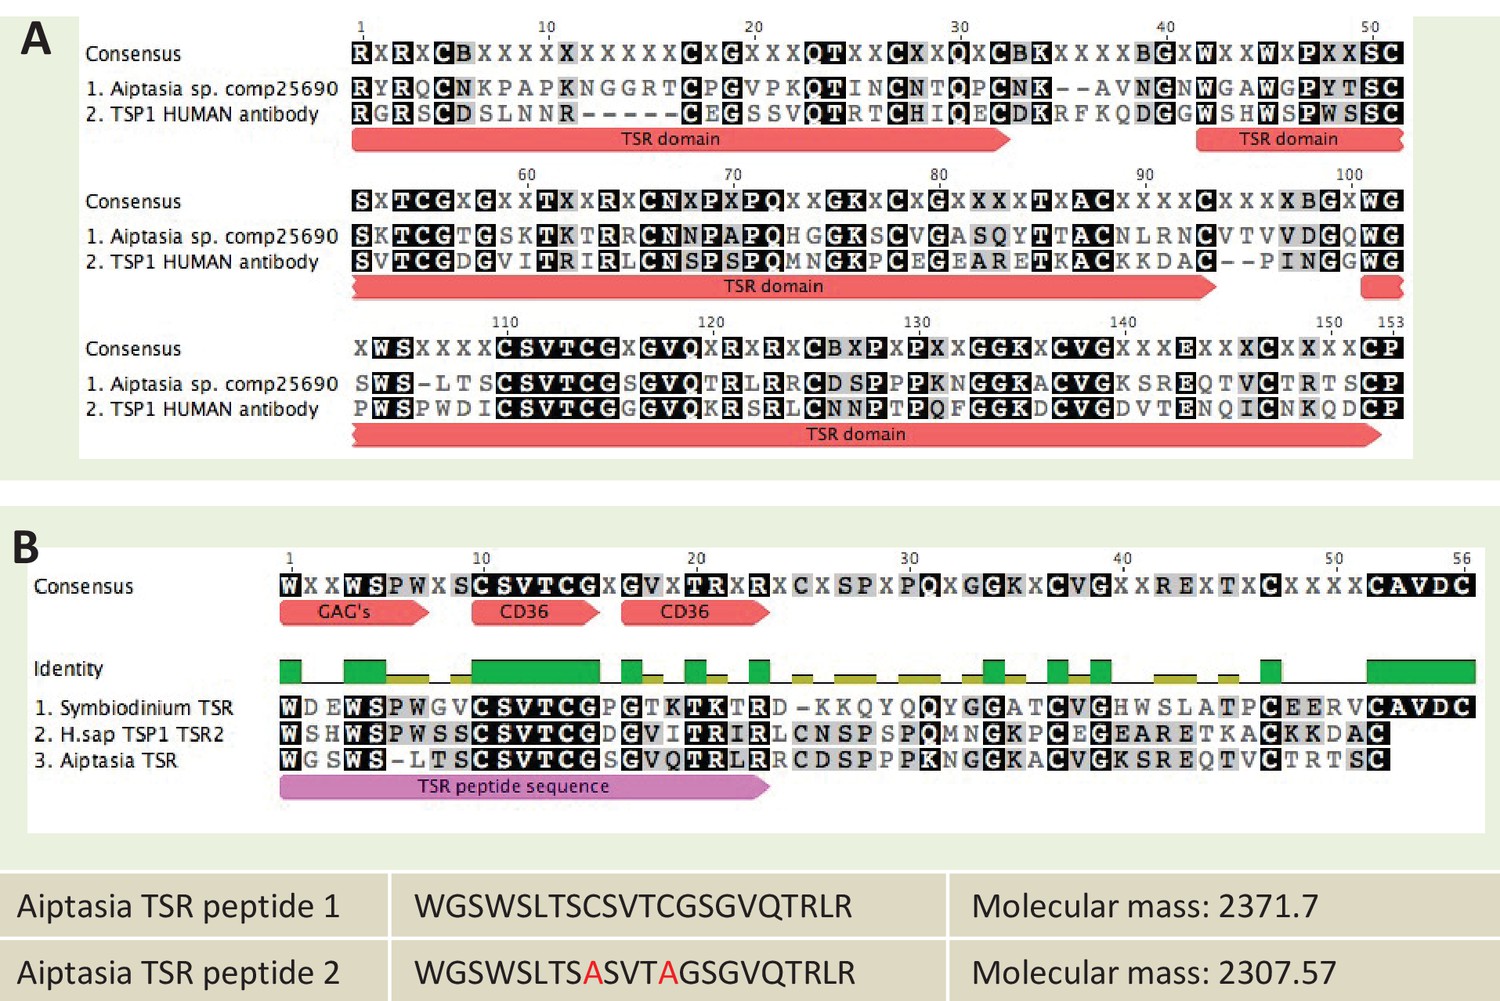
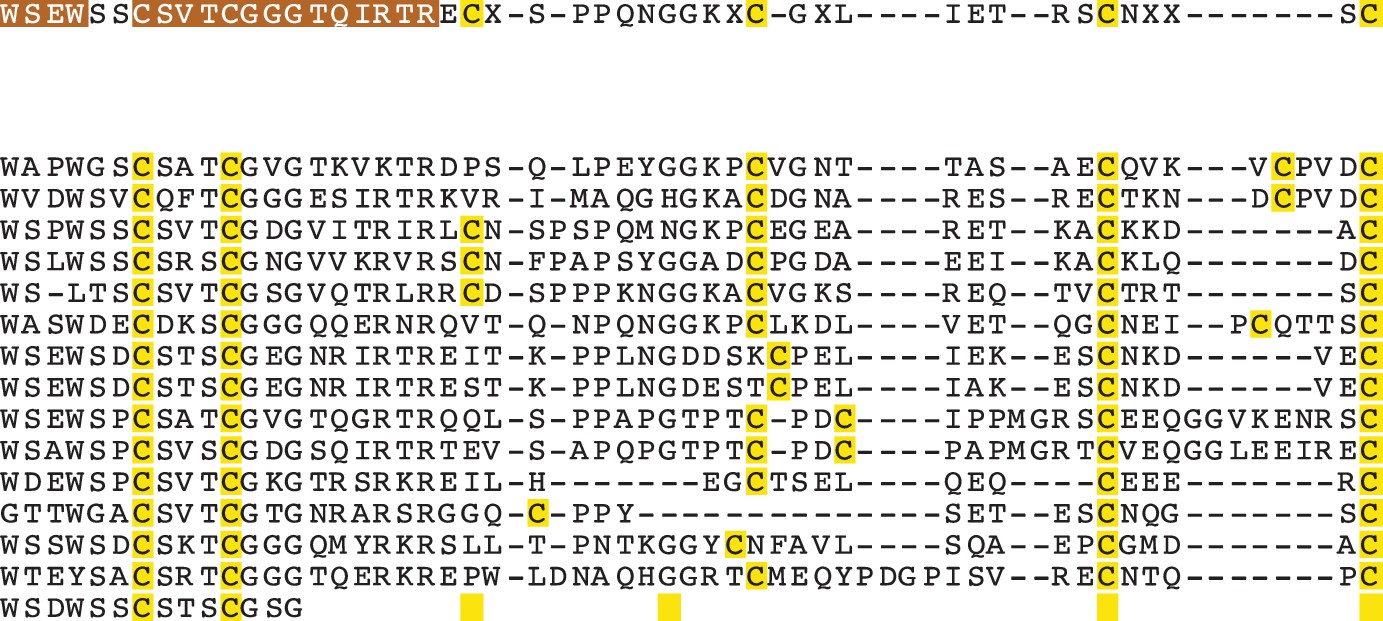
Sequence information for thrombospondin antibody and TSR peptide fragments used in this study.
(A) Alignment of the second TSR domains from human thrombospondin 1 and TSR proteins from the anemone Aiptasia pallida and the dinoflagellate Symbiodinium minutum. In red are the binding sites for glycosaminoglycans (GAGs) and CD36; greyscale indicates the % identity of the three sequences. Pink annotation indicates the TSR peptide sequence covering all three binding domains; inset are the synthetic peptide sequences for experimental peptides. In Peptide 2, the cysteine residues were replaced with alanine residues, as shown in red. (B) A section of the antibody-binding region of the human thrombospondin 1/2 antibody (H-300, sc-14013 from Santa Cruz Biotechnology), aligned to a TSR protein fragment from Aiptasia sp. Legends for Supplementary Material.
Tables
Table 1
Anthozoan and Dinoflagellate resources
| Organism | Family | Developmental stage | Symbiotic state | Data type | Publication |
|---|---|---|---|---|---|
| Nematostella vectensis | Edwardsiidae | Larvae | Non-symbiotic | Genome | Putnam et al. (2007) |
| Anthopleura elegantissima | Actiniidae | Adult | Aposymbiotic | Transcriptome | Kitchen et al., 2015 |
| Aiptasia pallida | Aiptasiidae | Adult | Aposymbiotic | Transcriptome | Lehnert et al. (2012) |
| Aiptasia pallida | Aiptasiidae | Adult | Symbiotic | Genome | Baumgarten et al. (2015) |
| Acropora digitifera | Acroporidae | Sperm | Symbiotic | Genome | Shinzato et al. (2011) |
| Acropora millepora | Acroporidae | Adult and Larvae | Symbiotic | Transcriptome | Moya et al. (2012) |
| Fungia scutaria | Fungiidae | Larvae | Aposymbiotic | Transcriptome | Kitchen et al., 2015 |
| Stylophora pistillata | Pocilloporidae | Adult | Symbiotic | Genome | Voolstra et al., submitted |
| Symbiodinium minutum | Symbiodiniaceae | culture ID Mf1.05b.01 | Dinoflagellate culture | Genome | Shoguchi et al. (2013) |
| Symbiodinium microadriaticum | Symbiodiniaceae | strain CCMP2467 | Dinoflagellate culture | Genome | Aranda et al. (2016) |
Additional files
-
Supplementary file 1
Tabulated TSR sequences identified from searches of six cnidarian and two dinoflagellate resources and TSR sequences from other organisms used in this study.
Sequences are sorted by protein type or source organism.
- https://doi.org/10.7554/eLife.24494.023
-
Supplementary file 2
Summary of fluorescent dyes and their excitation and emission wavelengths used for confocal microscopy
- https://doi.org/10.7554/eLife.24494.024
-
Supplementary file 3
Primers for initial PCR of TSR sequences.
- https://doi.org/10.7554/eLife.24494.025
-
Supplementary file 4
Primers used for qPCR of Ap_Sema5 and Ap_Trypsin-like amplicons.
- https://doi.org/10.7554/eLife.24494.026
-
Source code 1
R-code for statistical analyses performed for data displayed in Figures 5 and 6.
- https://doi.org/10.7554/eLife.24494.027
Download links
A two-part list of links to download the article, or parts of the article, in various formats.
Downloads (link to download the article as PDF)
Open citations (links to open the citations from this article in various online reference manager services)
Cite this article (links to download the citations from this article in formats compatible with various reference manager tools)
A diverse host thrombospondin-type-1 repeat protein repertoire promotes symbiont colonization during establishment of cnidarian-dinoflagellate symbiosis
eLife 6:e24494.
https://doi.org/10.7554/eLife.24494


