Evolution of an intricate J-protein network driving protein disaggregation in eukaryotes
- Heidelberg University, Germany
- German Cancer Research Center (DKFZ), Germany
- Heidelberg Institute for Theoretical Studies, Germany
- University of Heidelberg, Germany
- École Polytechnique Fédérale de Lausanne, Switzerland
- Inserm, U1054, France
- CNRS, UMR 5048, Centre de Biochimie Structurale, Université de Montpellier, France
Figures
Figure 1 with 3 supplements
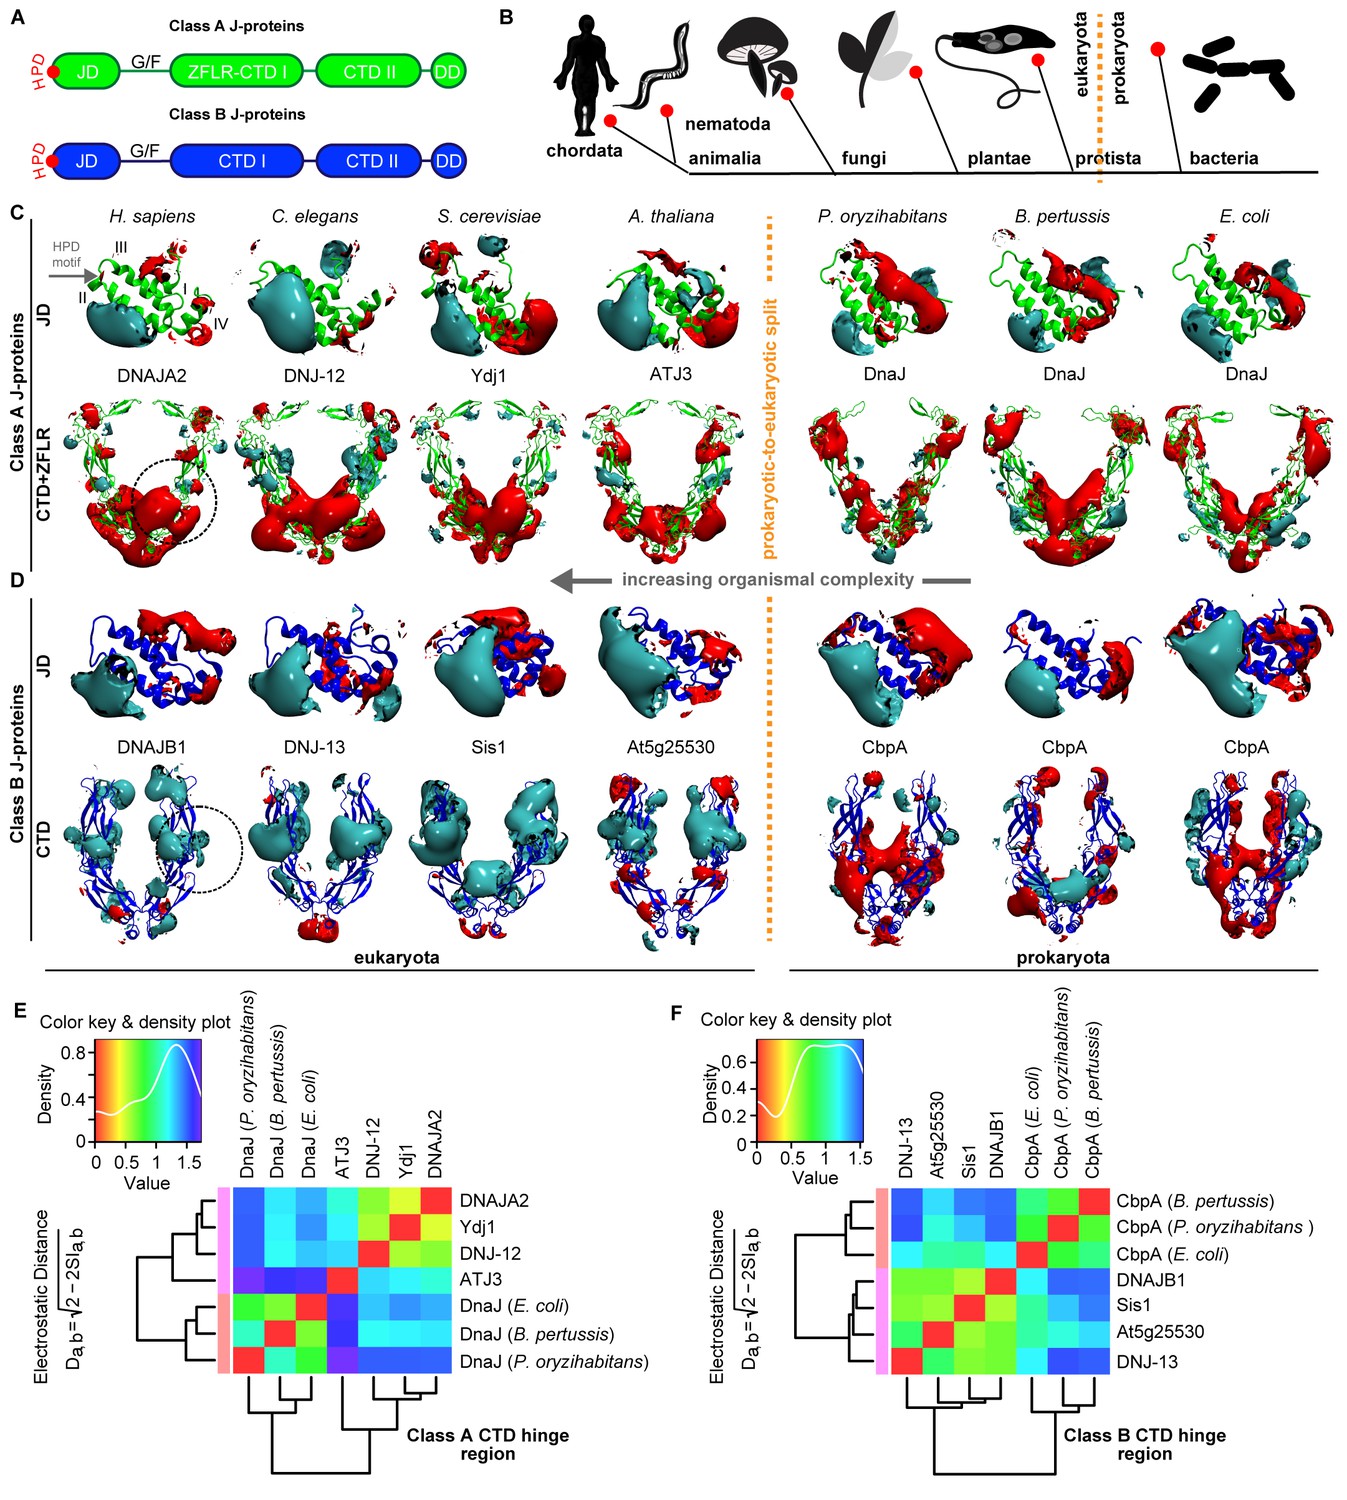
Conservation of class-specific electrostatic potential distributions predict interclass J-protein complex formation in eukaryotes.
(A) Domain architecture of class A and class B J-proteins (shown as protomers). Class A J-proteins have an N-terminal J-domain (JD), a glycine/phenylalanine-rich flexible region (G/F), C-terminal β-sandwich domains (CTD-I and II) and a CTD-I inserted zinc-finger-like region (ZFLR). The Hsp70-interacting HPD motif is indicated in red. Protomer dimerization to form homodimers occurs at the dimerization domain (DD). The ZFLR in CTD-I is absent in the domain architecture of class B J-proteins. (B) Evolutionary tree ranking the kingdoms of organisms analyzed in this study. (C, D) Electrostatic isopotential contour maps (cyan + 1, red −1 kcal/mol/e) of CTD homodimers and of J-domains of class A (green cartoon diagrams) (C) and class B (blue cartoon diagrams) (D) J-proteins. Roman numerals show the four α-helices on class A JD. J-proteins from the following organisms are compared: Homo sapiens (DNAJA2, DNAJB1), Caenorhabditis elegans (DNJ-12, DNJ-13), Saccharomyces cerevisiae (Ydj1, Sis1), Arabidopsis thaliana (ATJ3, At5g25530), Pseudomonas oryzihabitans, Bordetella pertussis and Escherichia coli (DnaJ, CbpA). The dashed circles on the CTDs of DNAJA2 and DNAJB1 represent the spherical region used for local PIPSA analysis of electrostatic potential similarity. (E, F) Local PIPSA analysis results for class A CTD (E) and class B CTD (F) electrostatic potentials. The electrostatic potentials in the spherical regions (radius of 25 Å) indicated by the dashed black circles in (C) and (D) were clustered by similarity using Ward’s clustering. The heat maps show clustering of J-proteins by similarity (higher similarity indicated by a red shift).
Figure 1—figure supplement 1
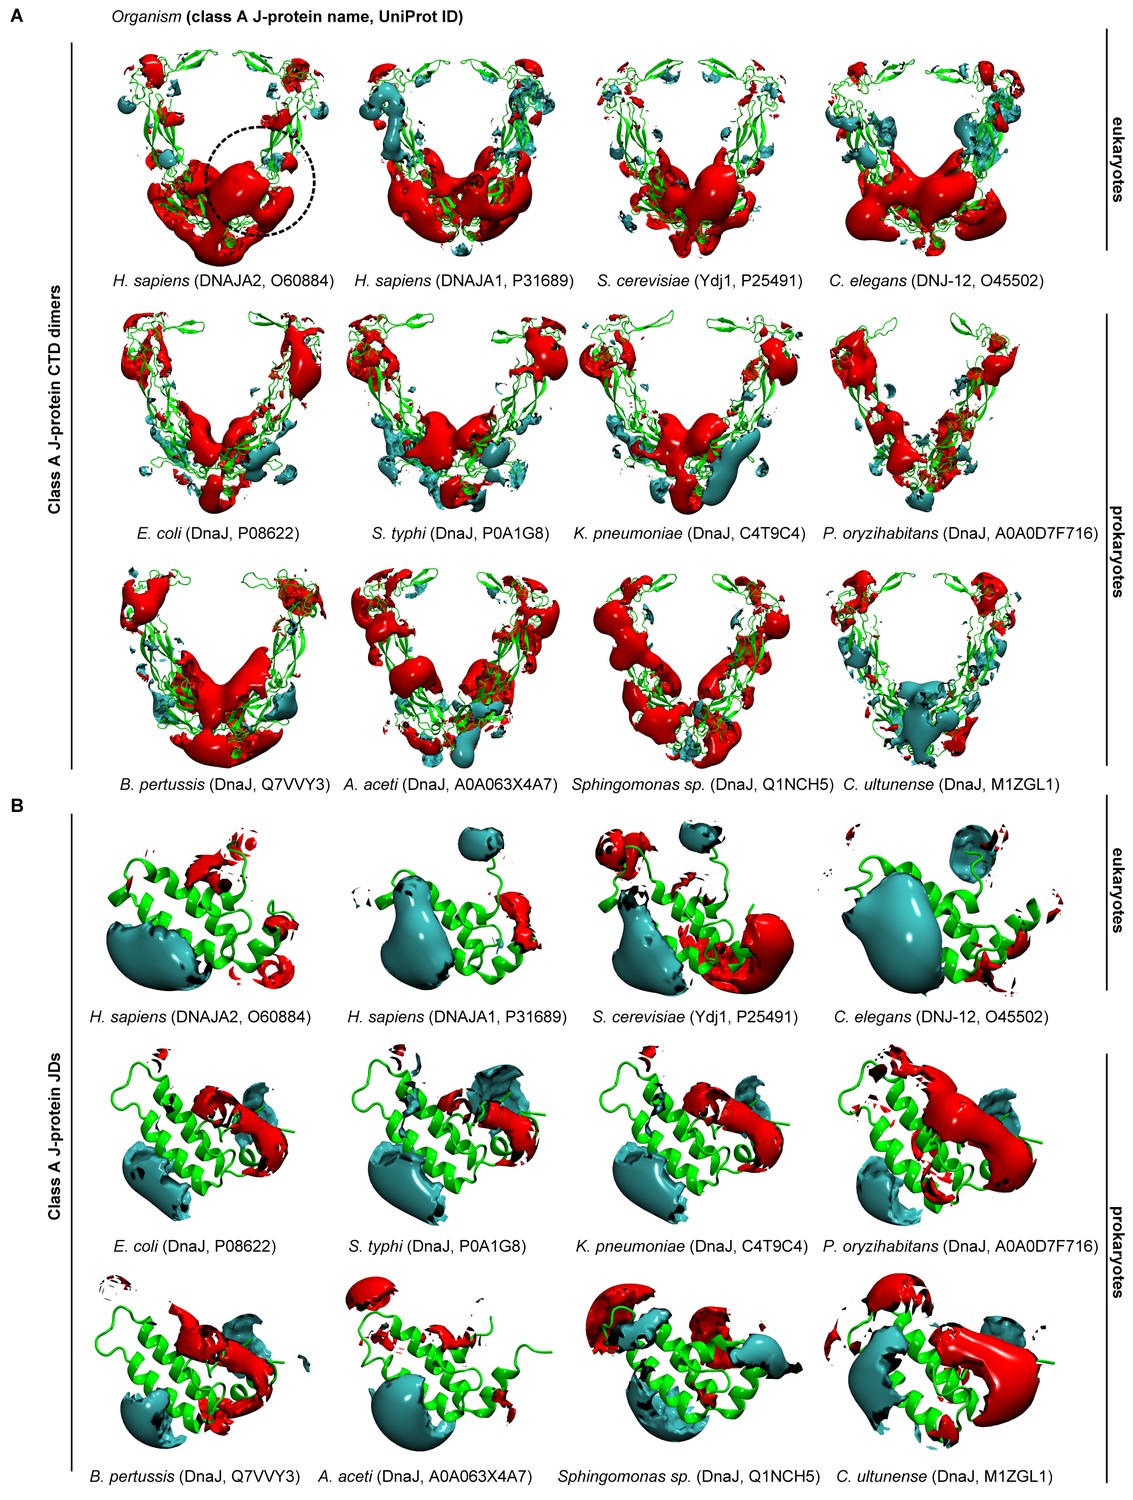
Electrostatic isopotential contour maps of class A J-proteins from humans, fungi, nematodes and bacteria.
(A) Class A CTD dimers (cyan +1, red −1 kcal/mol/e). The protein structure is depicted in green cartoon representation. The J-protein name and corresponding Uniprot ID are given in parentheses for each organism. The human class A J-proteins are represented by DNAJA1 (P31689) and DNAJA2 (O60884). Saccharomyces cerevisiae (Ydj1, P25491) and Caenorhabditis elegans (DNJ-12, O45502) represent fungi and nematodes, respectively. Bacterial DnaJ are represented from the following subgroups: alphaproteobacteria (A0A063 × 4A7, Q1NCH5), betaproteobacterium (Q7VVY3), gammaproteobacteria (P08622, P0A1G8, C4T9C4, A0A0D7F716) and firmicute (M1ZGL1). (B) As in (A) Class A JDs.
Figure 1—figure supplement 2
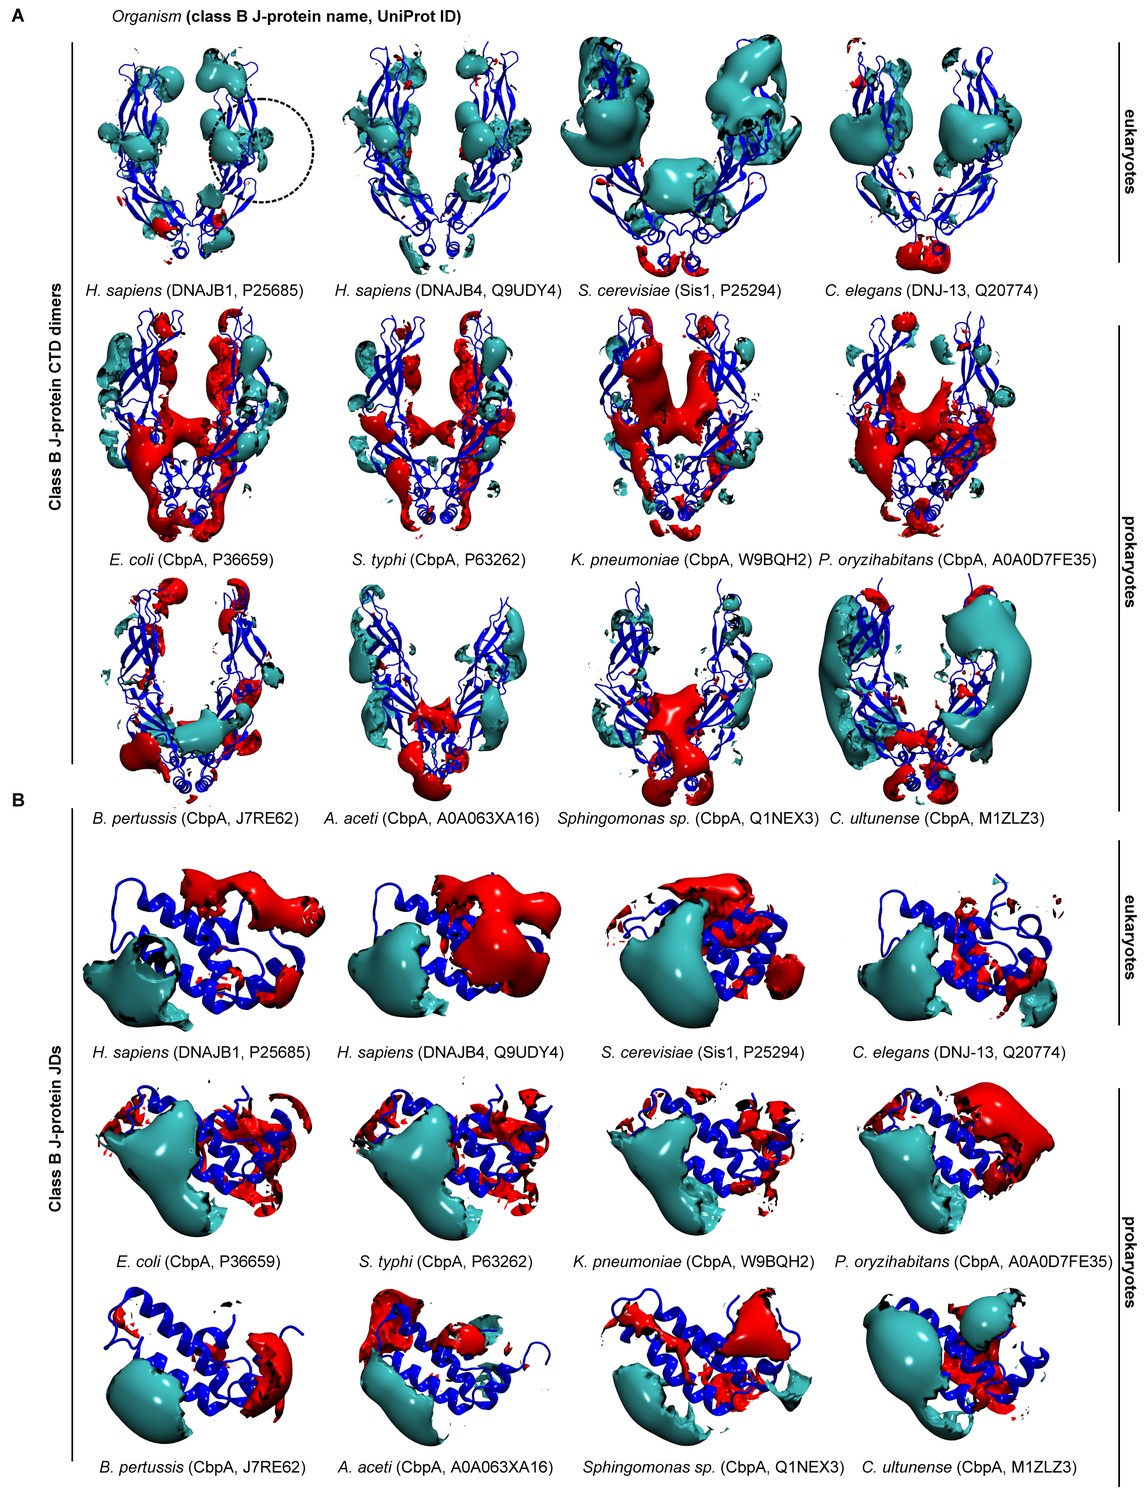
Electrostatic isopotential contour maps of class B J-proteins from humans, fungi, nematodes and bacteria.
(A) Class B CTD dimers (cyan + 1, red −1 kcal/mol/e). CTD dimer structure depicted in blue cartoon representation. The J-protein name and corresponding Uniprot ID are given in parentheses for each organism. Human class B J-proteins are represented by DNAJB1 (P25685) and DNAJB4 (Q9UDY4). Saccharomyces cerevisiae (Sis1, P25294) and Caenorhabditis elegans (DNJ-13, Q20774) represent fungi and nematodes, respectively. Bacterial CbpA is represented by the following subgroups: alphaproteobacteria (A0A063XA16, Q1NEX3), betaproteobacterium (J7RE62), gammaproteobacteria (P36659, P63262, Q9BQH2, A0A0D7FE35) and firmicute (M1ZLZ3). (B) As in (A) Class B JDs.
Figure 1—figure supplement 3
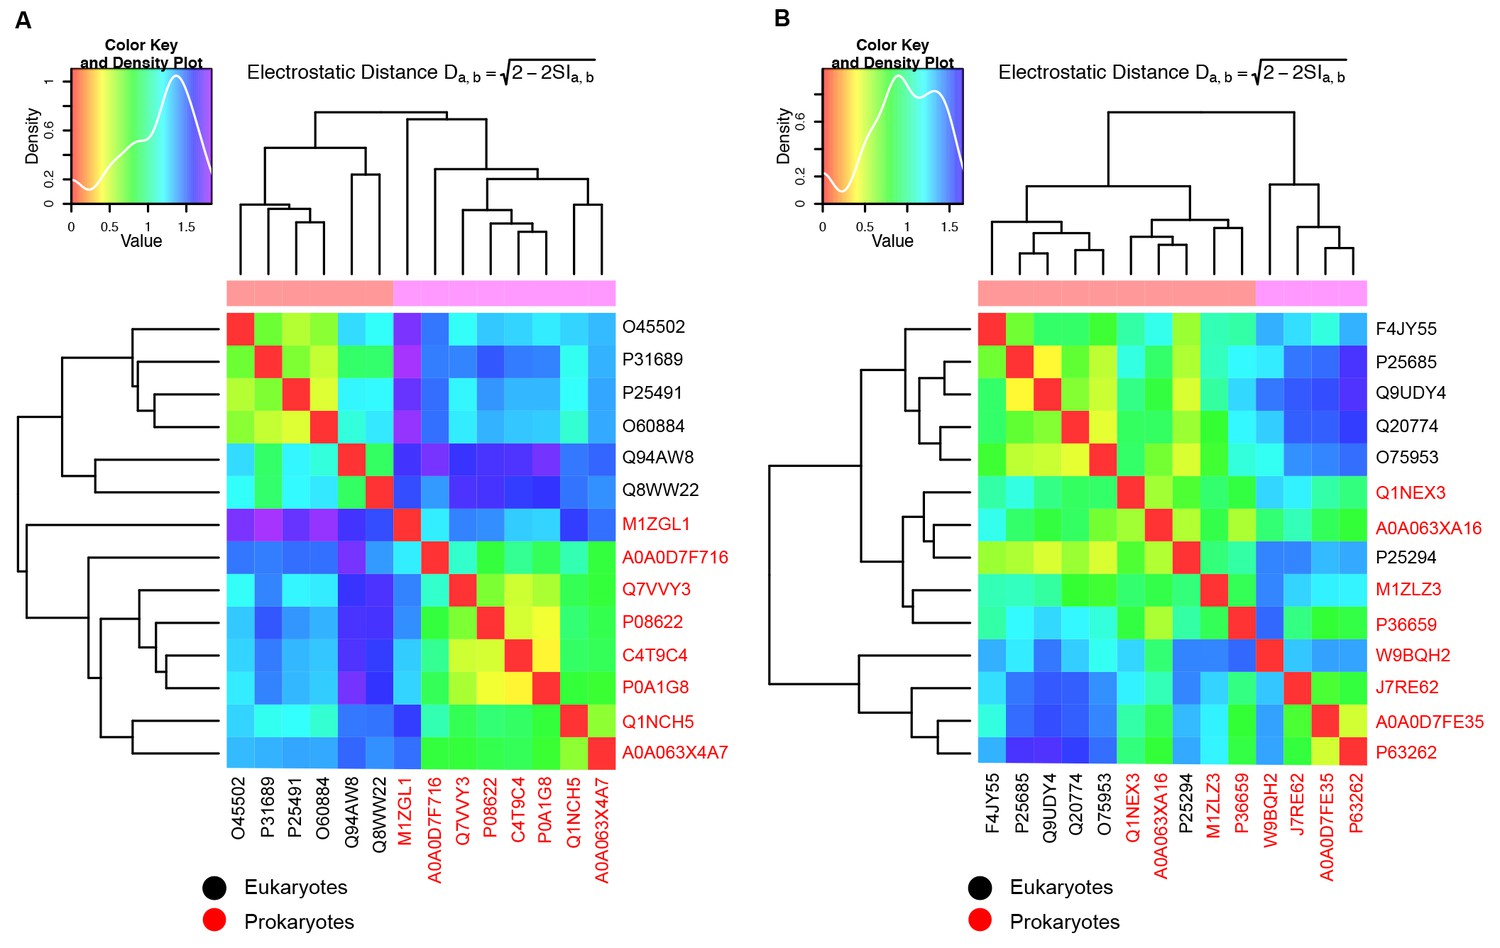
Evaluation of JD interaction sites on CTDs of the opposite class J-proteins.
(A,B) Local PIPSA analysis of electrostatic potentials at (A) class B JD interaction sites on CTDs of class A J-proteins and (B) class A JD interaction sites on CTDs of class B J-proteins. Eukaryotic sequences are colored in black and prokaryotic ones in red. The electrostatic potentials in the spherical region (radius of 25 Å) indicated by the dashed black circles (Figure 1—figure supplement 1A and Figure 1—figure supplement 2A) were clustered by electrostatic distance using Average (a) and Ward’s (b) clustering. The heat map shows clustering of J-proteins according to electrostatic distance (high similarity indicated by a red shift). The color key and density plot is depicted on the top left.
Figure 2 with 2 supplements
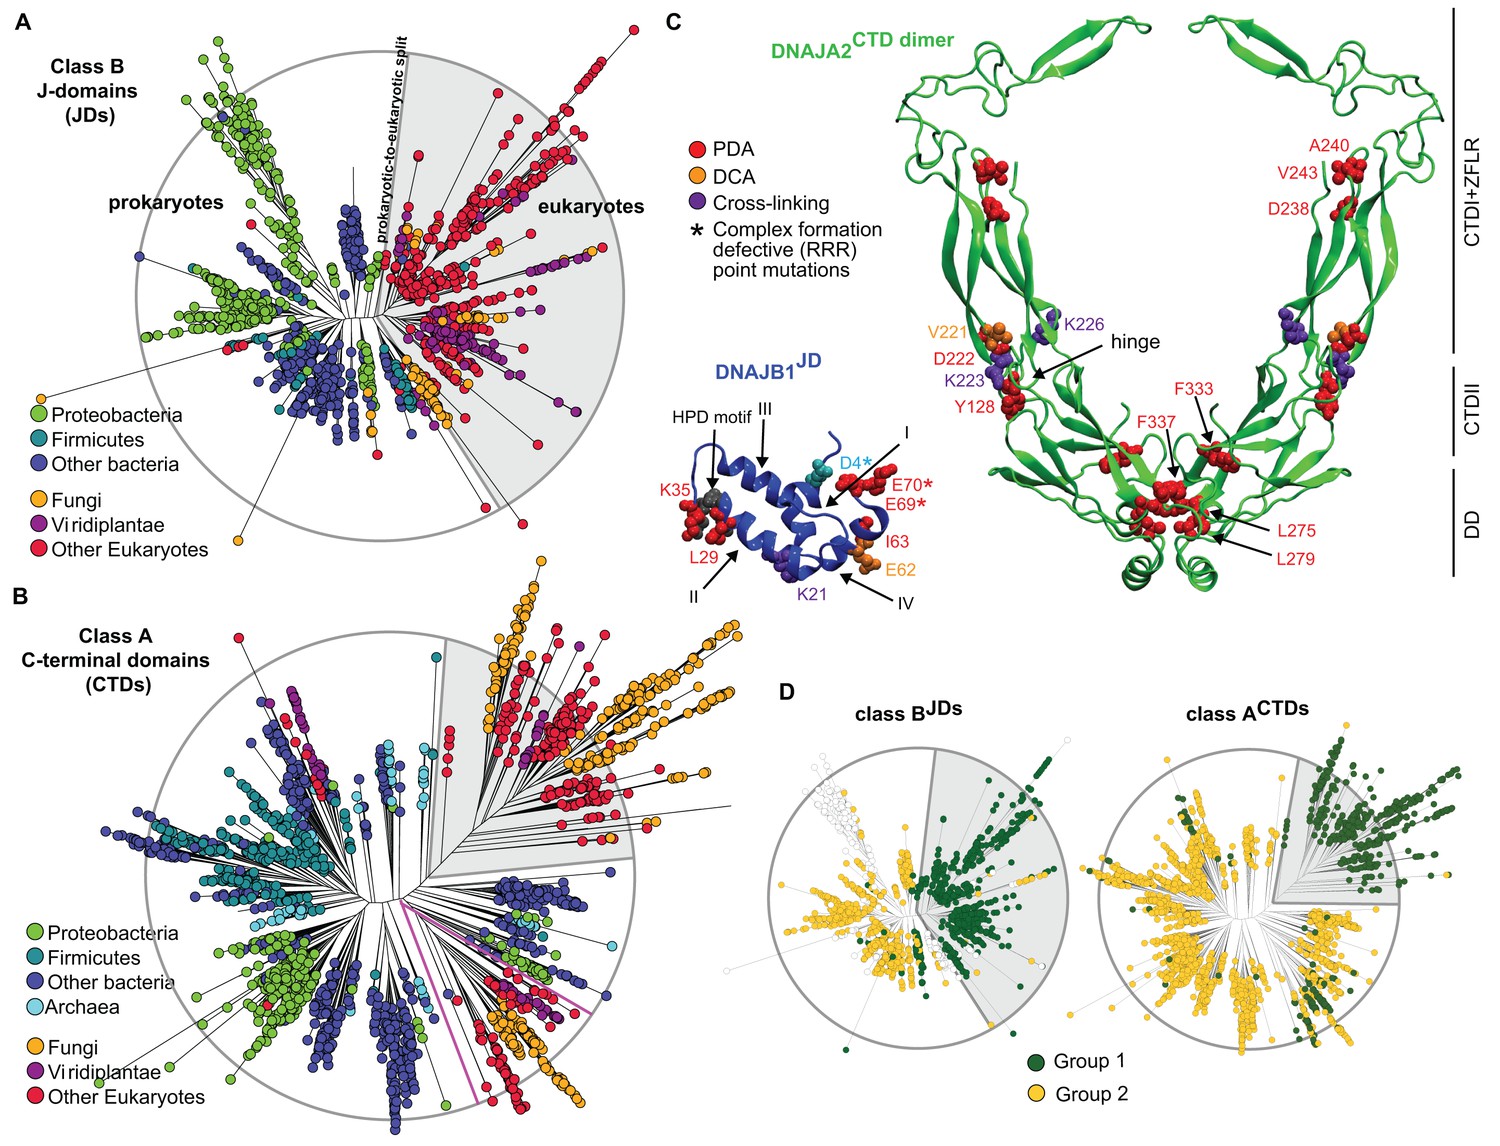
Phylogenetic and coevolutionary analyses of the JD-CTD interaction between class A and B J-proteins.
(A) Phylogenetic tree of class B J-domains. Color-coding separates different phylogenetic groups. Grey area highlights the separation of eukaryotes (fungi, viridiplantae and other eukaryotes) from prokaryotes (proteobacteria, firmicutes and other bacteria) and Archaea. (B) As in (A), phylogenetic tree of class A CTDs. Pink lines delimit organellar sequences of eukaryotic organisms. (C) Structural view of most discriminating positions predicted by PDA (red) plotted on JD of DNAJB1 (blue, five positions) and CTD of DNAJA2 (green, nine positions). DCA-derived coevolving residue pairs depicted on DNAJB1JD and DNAJA2CTD (orange). Experimentally determined cross-linking residues between DNAJB1 and the DNAJA2 are indicated in purple (Nillegoda et al., 2015). Location of the triple charge reversion (E/D→R) mutations that disrupts interclass J-protein complex formation between DNAJB1 and DNAJA2 denoted by (*) (Nillegoda et al., 2015). The HPD motif of DNAJB1JD is shown in grey. Roman numerals show the four α-helices on JD. (D) Mapping of sequence clustering derived from PDA (see Materials and methods) using the most discriminating positions on to JD and CTD trees of class B and class A J-proteins, respectively. The two identified groups (green and yellow nodes) covered 81% in the case of the clustering done on the JDs and 100% when clustering was done on the CTDs. Unclassified sequences are depicted in white.
Figure 2—figure supplement 1
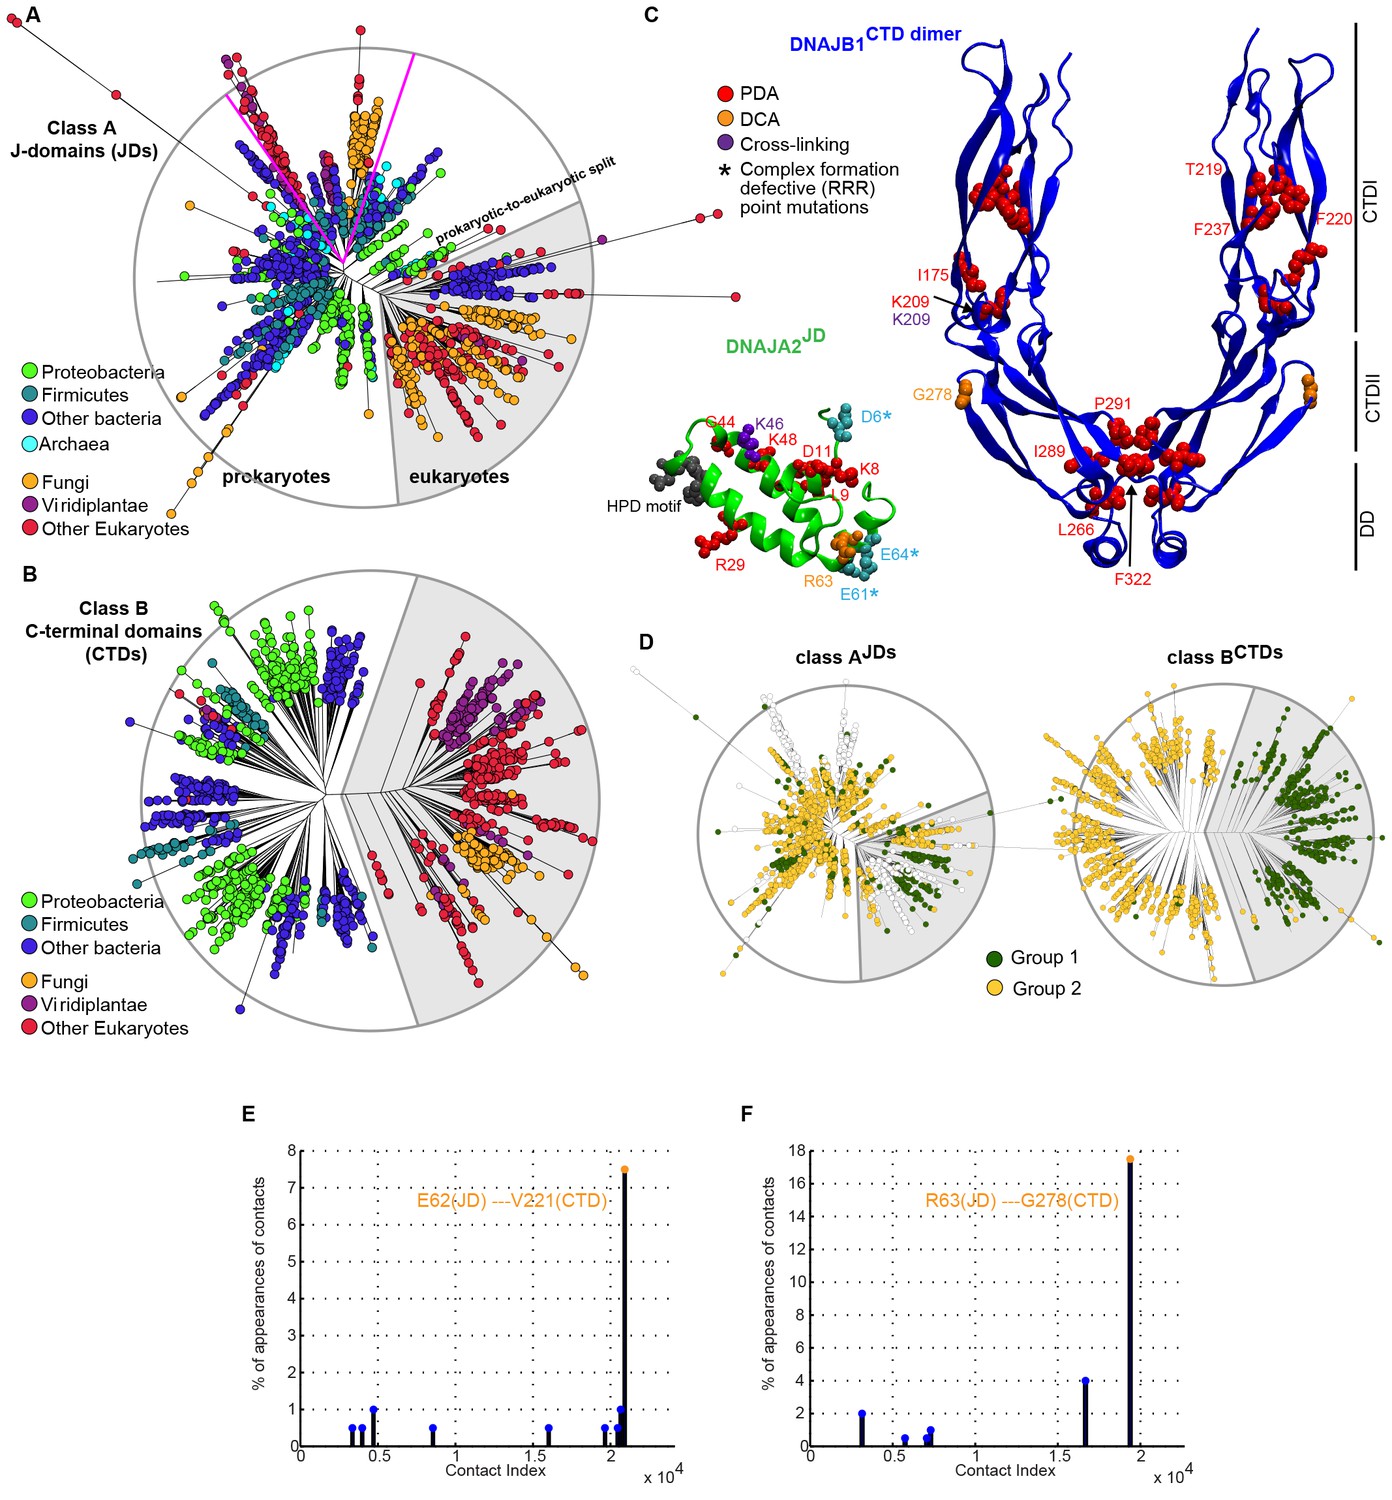
Phylogenetic and coevolutionary analyses between class AJDs and class BCTDs.
(A) Phylogenetic tree built from the J-domains of class A J-proteins. Color-coding separates different phylogenetic groups. Grey area highlights the separation of eukaryotes (fungi, viridiplantae and other eukaryotes) from prokaryotes (proteobacteria, firmicutes and other bacteria) and Archaea. (B) As in (A), built from the CTDs of class B J-proteins. Pink lines delimit organellar sequences of eukaryotic organisms. (C) Structural view of PDA predicted most discriminating positions (red) plotted on the JD of DNAJA2 (green, six positions) and the CTD of DNAJB1 (blue, nine positions). DCA derived coevolving residue pairs depicted on DNAJB1JD and DNAJA2CTD (orange). Experimentally determined cross-linking residues between the DNAJA2JD and the DNAJB1CTD are indicated in purple (Nillegoda et al., 2015). Location of the triple charge reversion (E/D→R) mutations that disrupts interclass J-protein complex formation between DNAJB1 and DNAJA2 denoted by (*) (Nillegoda et al., 2015). The HPD motif of DNAJB1JD is shown in grey. (D) Mapping of sequence clustering derived from PDA (see Materials and methods) using the most discriminating positions on to JD and CTD trees of class A and class B J-proteins, respectively. The two identified groups (green and yellow nodes) covered 78% in the case of the clustering done on the JDs and 100% when clustering was done on the CTDs. Unclassified sequences are depicted in white. (E) Graph showing the distribution of predicted DCA pairs between class BJDs and class ACTDs. The threshold for obtaining statistically significant inter-protein coevolving pairs was set at 5% of contact appearance after 300 realizations. DCA-derived coevolving residue pair on DNAJA2JD and DNAJB1CTD (orange). Neighboring charged residues are depicted in black. (F) As in (E) graph showing the distribution of predicted DCA pairs between class AJDs and class BCTDs.
Figure 2—figure supplement 2
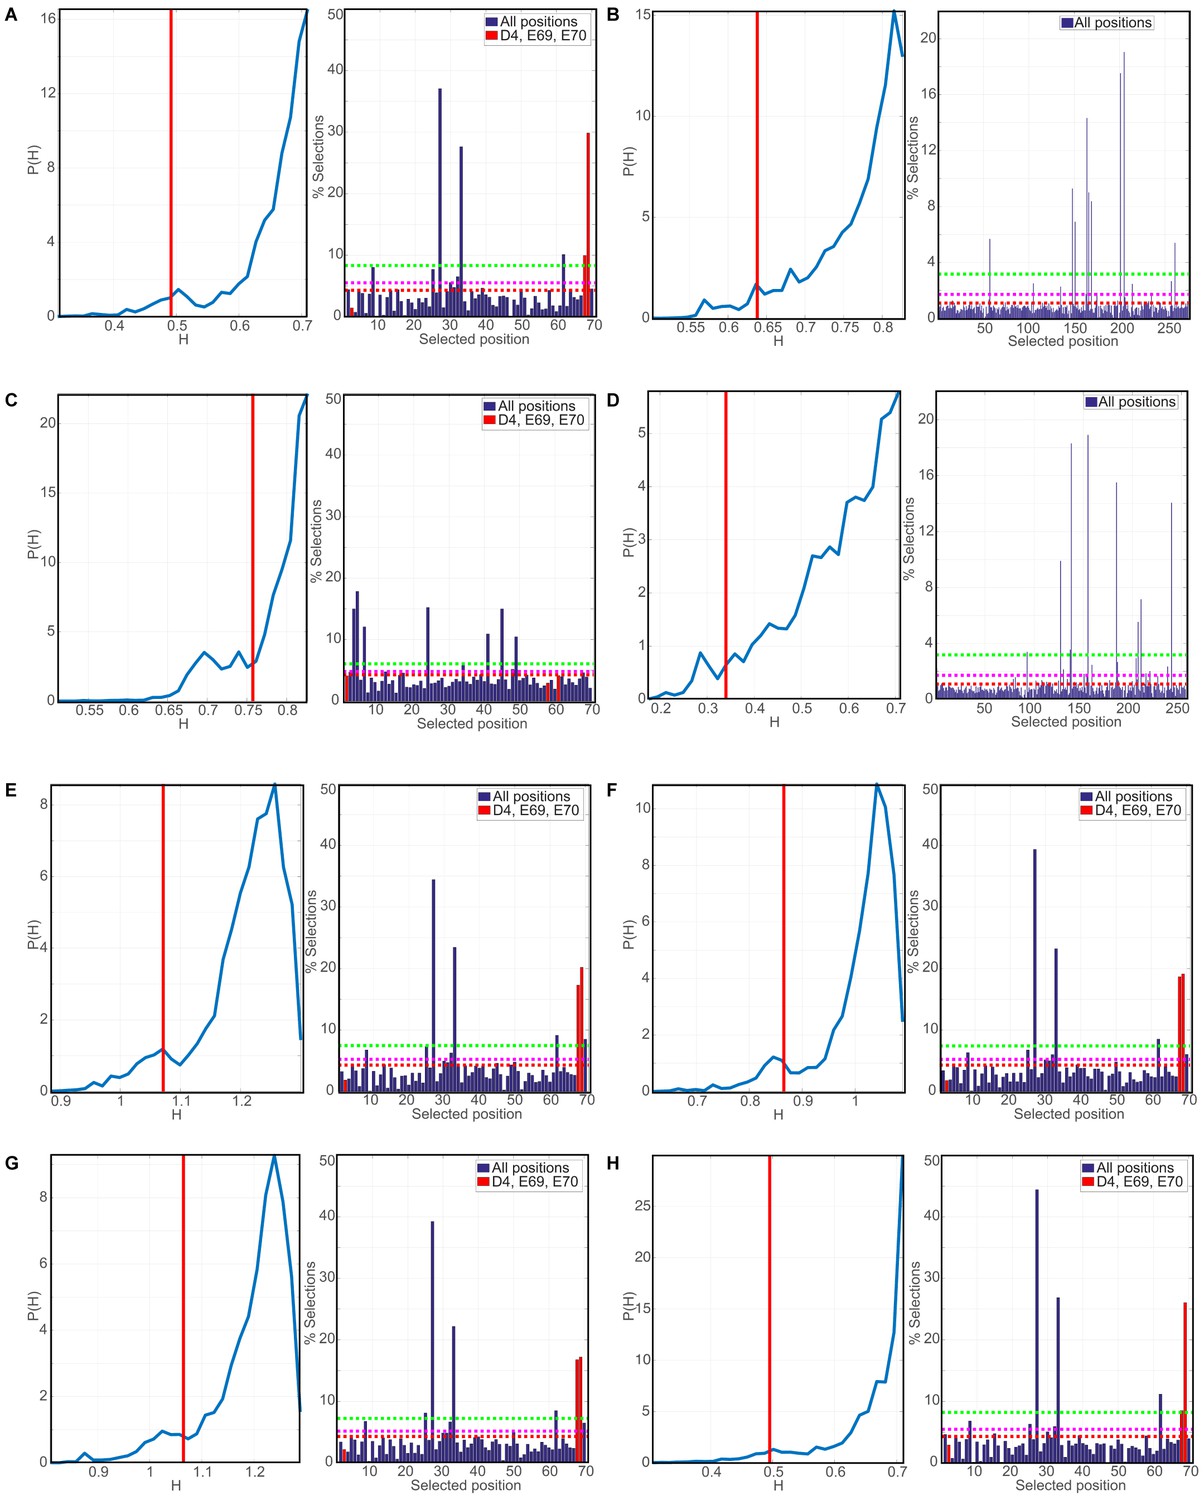
Evaluation of robustness in Phylogenetic Discriminant Analysis.
In all right sub-panels, the numbering corresponds to the indexing of the MSAs and not of individual sequences. The red vertical red lines indicate the mixing score of the reference triplet (D6, E61, E64 for DNAJA2; D4, E69, E70 for DNAJB1) for the J-domains and the 5th percentile for the CTDs, which lack a reference triplet. In all right panels, the dashed red lines mark the mean selection rate of the null model, while the magenta (resp. green) dashed lines mark 3 (resp. 10) standard deviations of the mean selection rate (See Materials and methods). (A) PDA derived p-value and top positions for class B JDs. Left: Distribution of the mixing scores H (entropy) indicative of discriminatory power, the lower H the greater the discriminatory power (see Materials and methods). Right: Histogram of the percentage of appearances of positions in triplets having a lower mixing score H than the reference triplet (positions indicated in red). (B) as in (A) PDA-derived p-value and top positions for class A CTDs. The vertical red line marks the mixing score limiting the 5th percentile. (C) PDA derived p-value and top positions for class B JDs. (D) PDA derived p-value and top positions for class B CTDs. (E) Robustness analysis of PDA of class B JDs. Included groups: Other prokaryotes, other eukaryotes, fungi, and proteobacteria. (F) Robustness analysis of PDA of class B JDs. Included groups: Other prokaryotes, other eukaryotes, fungi, proteobacteria and firmicutes. (G) Robustness analysis of PDA of class B JDs. Included groups: Other prokaryotes, other eukaryotes, fungi, proteobacteria, firmicutes and viridiplants. (H) Robustness analysis of PDA of class B JDs using Modularity Clustering method.
Figure 3 with 2 supplements
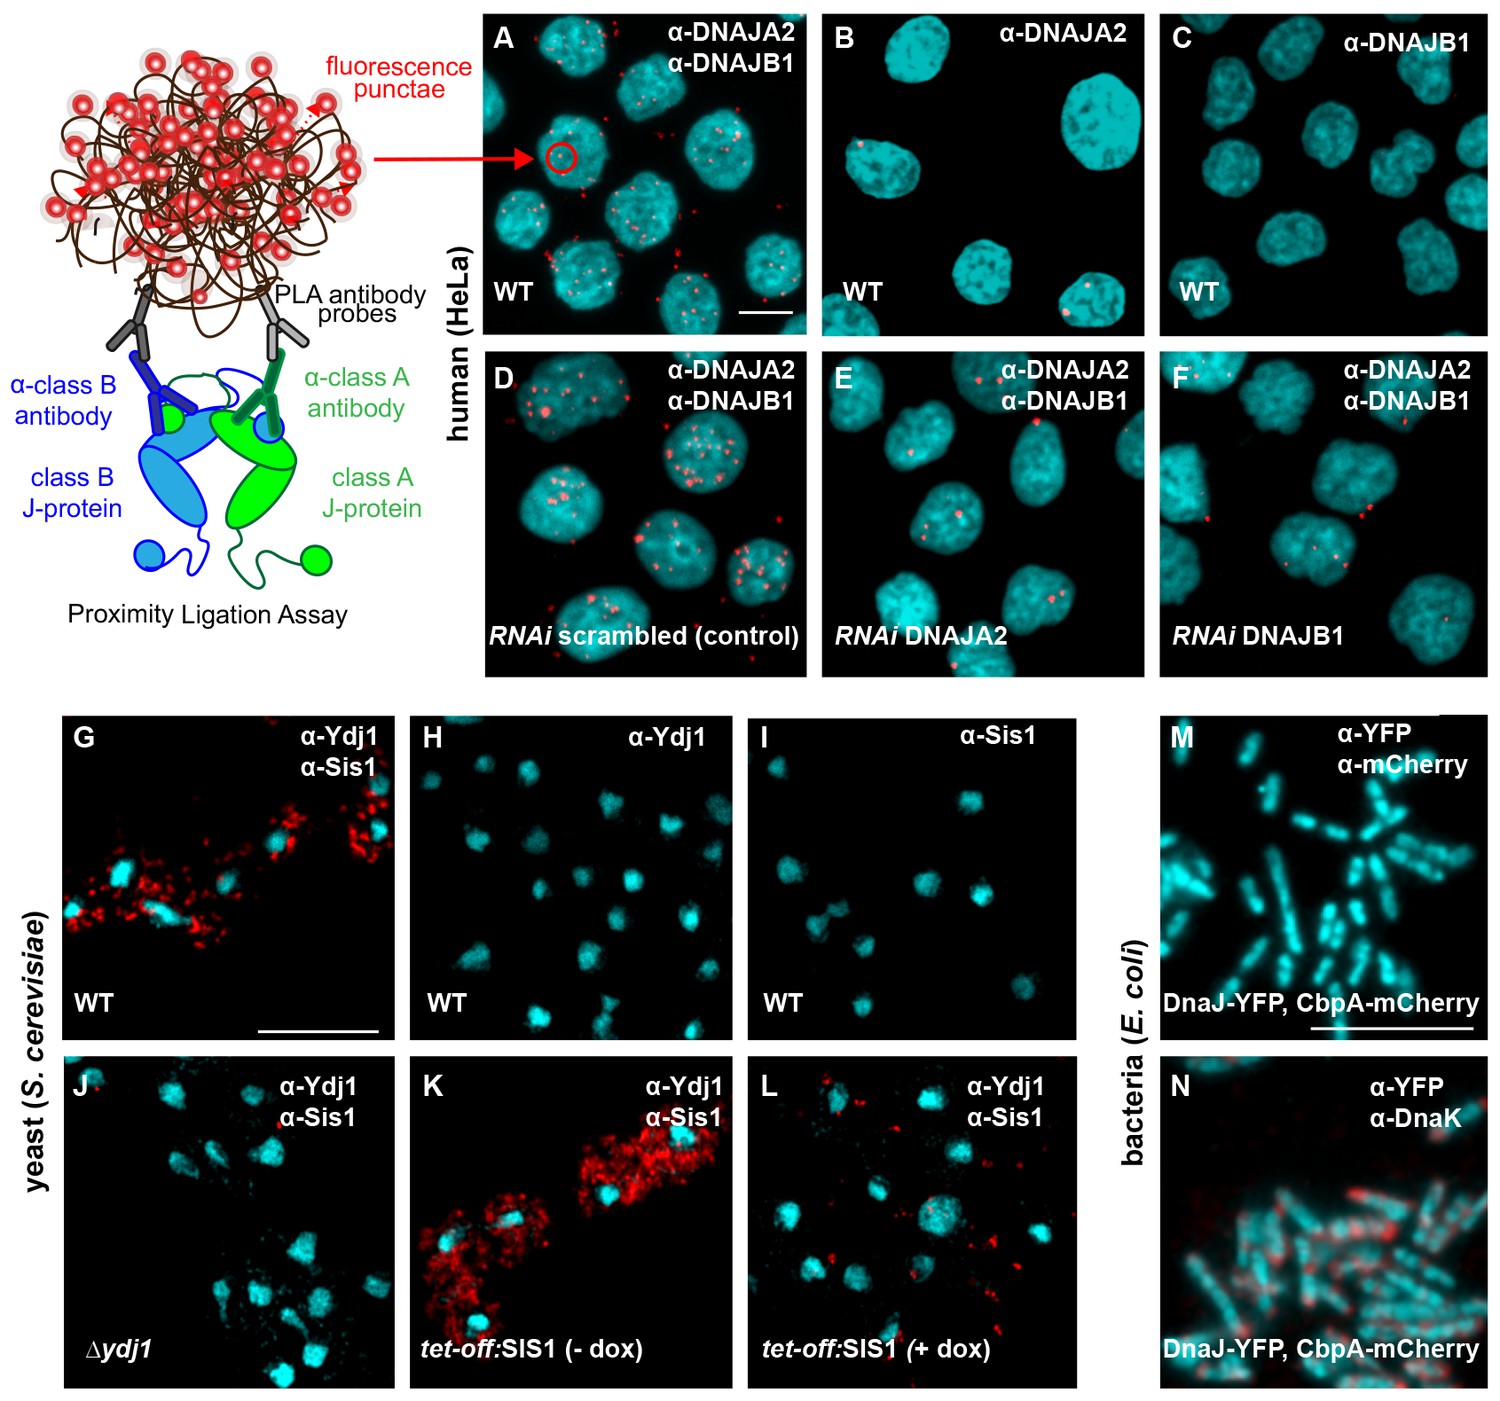
Interclass J-protein complexes occur in human and yeast cells, but not in bacteria.
(A–F) Detection of interclass J-protein complexes in human cells. (A) DNAJA2 (class A) and DNAJB1 (class B) form interclass complexes in HeLa cells. Red punctae reflect fluorescent signal amplification from single DNAJA2+DNAJB1 interaction events using an in situ proximity ligation assay. Fluorescently labeled oligonucleotides (red) hybridize to amplified the DNA proximity signal (see cartoon on left). Nuclei stained with DAPI (cyan). (B, C) Technical controls of PLA for antibody specificity. (B) PLA performed with anti-DNAJA2 antibody only. (C) PLA performed with anti-DNAJB1 antibody only. (D–F) RNAi knockdown of either DNAJA2 (E) or DNAJB1 (F) disrupts interclass J-protein complex formation in HeLa cells. Control reaction with scrambled RNAi shown in (D). (G–L) Interclass J-protein complex formation in yeast (Saccharomyces cerevisiae) cells. (G) Appearance of red punctae denotes complex formation between Ydj1 (class A) and Sis1 (class B). Nuclei stained with DAPI (cyan). (H) PLA performed with anti-Ydj1 antibody only. (I) PLA performed with anti-Sis1 antibody only. (J) Ydj1-Sis1 complex formation is abrogated in cells with Ydj1 gene knocked out. (K, L) PLA against Ydj1 and Sis1 in S. cerevisiae cells depleted of Sis1. Sis1 expression is switched off (tet-off) in the absence (K) or presence (L) of doxycycline (see Methods). (M) No complexing events occur between DnaJ-YFP (class A) and CbpA-mCherry (class B) in Escherichia coli log phase cells after signal amplification. Primary antibodies directed toward YFP and mCherry tags. Bacterial DNA stained with DAPI (cyan). (N) Complex formation detected between DnaJ-YFP (class A) and DnaK in log phase E. coli cells. Primary antibodies target YFP tag and DnaK. Scale bar = 10 μm. n (biological repeats) = 3.
Figure 3—figure supplement 1
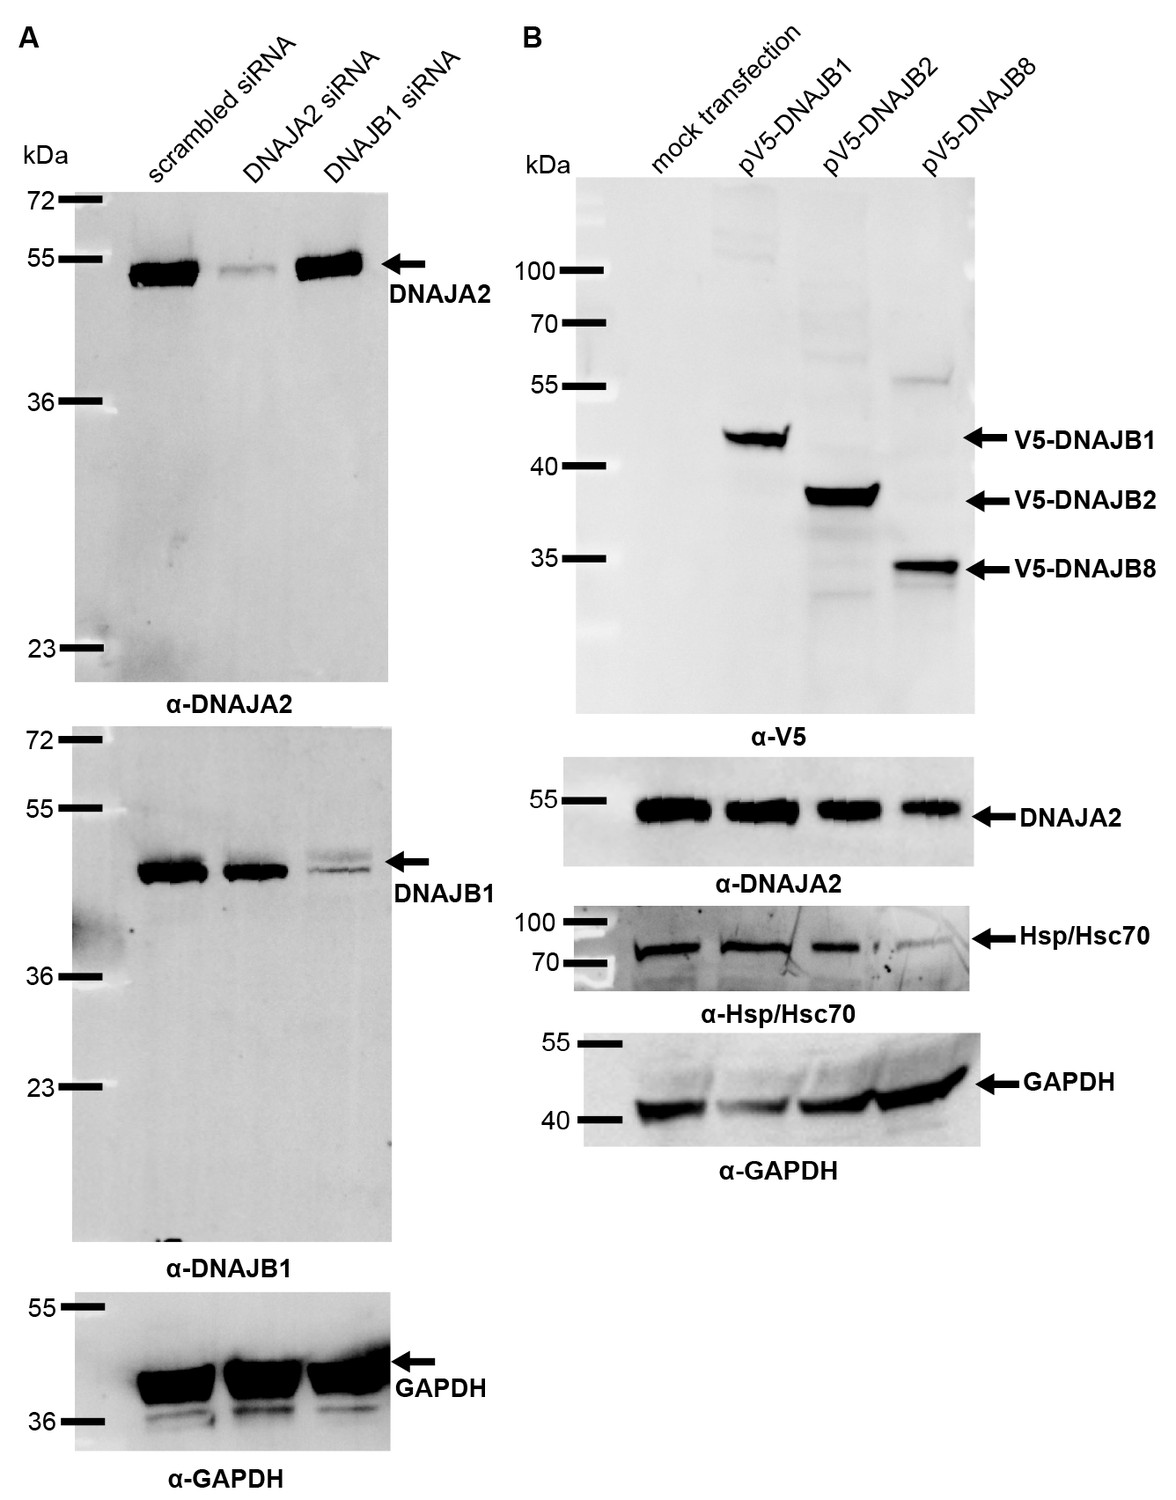
J-protein levels after knockdown or overexpression in HeLa cells.
(A) Western blot of DNAJA2 and DNAJB1 levels remaining after specific RNAi knockdowns. Control treatment performed with non-specific scrambled RNAi. GAPDH levels used as loading control. (B) Protein levels of V5-DNAJB1, V5-DNAJB2 and V5-DNAJB8 after overexpression in HeLa cells. GAPDH, loading control.
Figure 3—figure supplement 2

Yeast and bacterial class A and class B J-protein levels analyzed by western blotting.
(A) Immunoblotting for Ydj1 and Sis1 in wild type (WT) and ∆ydj1 Saccharomyces cerevisiae strains. Sis1 levels are measured as reference J-protein control. Pgk1, loading control. (B) Doxycycline induced knockdown of Sis1 (see Materials and methods). Ydj1 levels are measured as reference J-protein control. Pgk1, loading control. (C) Specificity determination of Ydj1 and Sis1 antibodies used in PLA. (D) Immunoblotting for YFP and mCherry using lysates from log and stationary phase Escherichia coli cells expressing CbpA-mCherry and DnaJ-YFP. CbpA-mCherry is expressed under the endogenous promoter. DnaJ-YFP levels shown after 2 hr of IPTG (25 µM) induction. DnaJ-YFP is expressed at moderate levels even in the absence of IPTG due to promoter leakage. S2 protein, loading control. (E) PLA for DnaJ-YFP and CbpA-mCherry in stationary phase E. coli cells. Primary antibodies target YFP and mCherry tags of DnaJ and CbpA. Bacterial DNA stained with DAPI (cyan). (F) As in (E), PLA for CbpA-mCherry and DnaK in stationary phase E. coli cells. Primary antibodies target mCherry tag and DnaK. Scale bar = 10 μm. n (biological repeats) = 2.
Figure 4 with 2 supplements
Interclass J-protein communication has distinct functional consequences for prokaryotic and eukaryotic protein disaggregation systems.
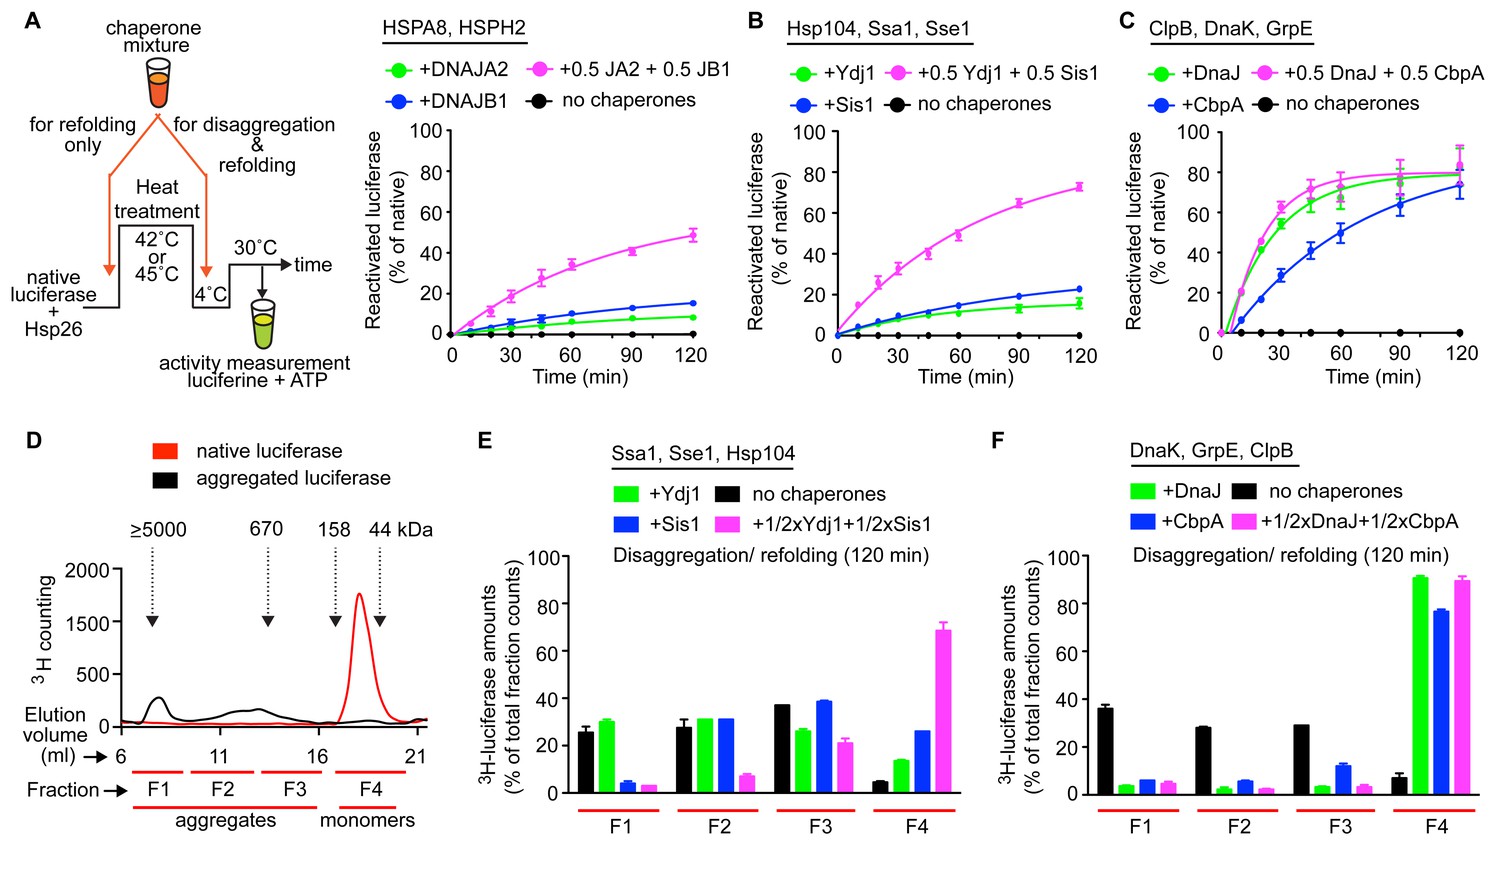
(A) Scheme for in vitro disaggregation/refolding and refolding-only reactions. Solubilization of preformed heat-aggregated luciferase using the human HSPA8-HSPH2 (Hsp70-Hsp110) system with DNAJA2 (Class A, green), DNAJB1 (Class B, blue) or DNAJA2+DNAJB1 (magenta). Control reaction containing aggregates without chaperone mix (black). n = 3. (B) As in (A), reactivation of luciferase aggregates by the yeast Hsp104-Ssa1 (Hsp100-Hsp70) bichaperone disaggregation system with J-proteins Ydj1 (class A, green),Sis1 (Class B, blue) and Ydj1+Sis1 (magenta). The NEF is Sse1, which is homologous to HSPH2. n = 3. (C) Reactivation of aggregated luciferase by the bacterial ClpB-DnaK (Hsp100-Hsp70) bichaperone system with GrpE (NEF) in the presence of DnaJ (Class A, green), CbpA (Class B, blue) or DnaJ+CbpA (magenta). (D) SEC profile of aggregated 3H-luciferase (elution fractions F1-F3, black). Soluble luciferase monomers (~63 kDa) elute in fraction F4 (red). MW scale on top in kDa. (E,F) Aggregate quantification for F1-F4 in SEC profile obtained with yeast (E) and bacterial (F) bichaperone systems after 120 min of disaggregation. Profiles show the disappearance of 3H-luciferase from aggregates (F1-F3) with concomitant accumulation of the disaggregated monomers in F4. Black bars indicate aggregate levels obtained from control reactions lacking chaperones. Values normalized to total counts in each reaction. n = 3. Error bars reflect mean ± sem. See Materials and methods for protein concentrations used.
Figure 4—figure supplement 1
Yeast class A and B J-proteins form interclass complexes to synergize disaggregation activity of the Hsp104-Ssa1 bichaperone system.
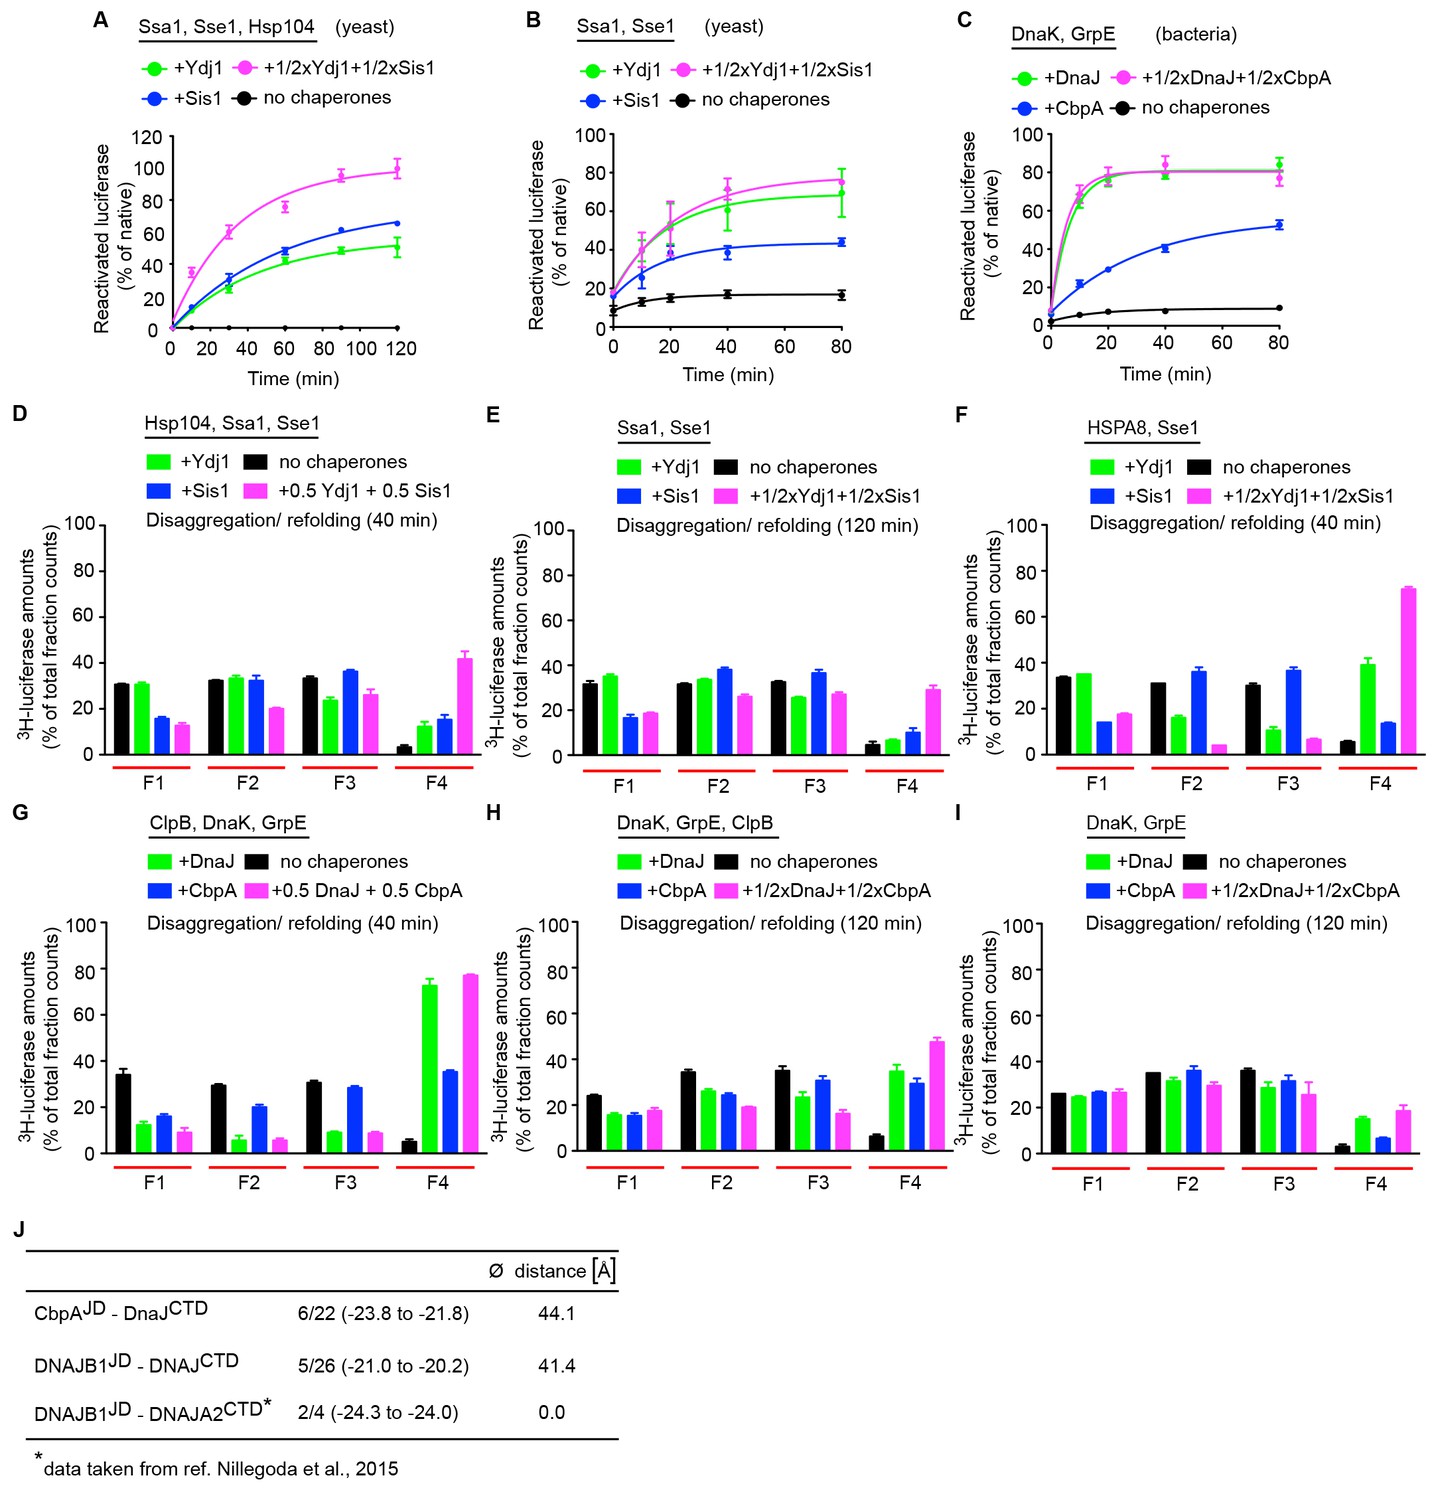
(A) Reactivation of heat-aggregated luciferase using yeast Hsp104-Ssa1 (Hsp100-Hsp70) bichaperone disaggregation system with J-proteins Ydj1 (class A),Sis1 (Class B) and Ydj1+Sis1 under saturating chaperone levels. The NEF is Sse1. n = 3. (B) Refolding of heat inactivated monomeric luciferase (see Materials and methods) by the yeast Hsp70 chaperone system. Class A, class B and class A+B J-protein containing reactions are indicated by green, blue and magenta, respectively. (C) As in (B), refolding of heat inactivated luciferase by the bacterial Hsp70 chaperone system. (D) Quantification of aggregates remaining in SEC profile after disaggregation/refolding of aggregated 3H-luciferase (40 min) by the yeast Hsp104-Ssa1 bichaperone system with either a class A or a class B J-protein alone (green (class A) or blue (class B)) or class A+B J-proteins combined (magenta). Control reaction without chaperones (black). Elution fractions F1 to F4 (red lines). F1,void volume, size of the luciferase aggregates eluted ≥5000 kDa; F2, aggregates ~ 700 to~4000 kDa; F3, aggregates ~ 200 to~700 kDa, F4 disaggregated monomers (~63 kDa). Values normalized to total counts in each reaction. n = 3. (E) As in (D), aggregate quantification after treatment with yeast Hsp70 chaperone system (120 min disaggregation). n = 2. (F) As in (E), aggregate quantification after treatment with yeast Hsp70 chaperone system substituted with human HSPA8 (40 min disaggregation). n = 2. (G) Quantification of aggregates remaining in SEC profile after disaggregation/refolding of aggregated tritiated luciferase (40 min) by bacterial ClpB-DnaK bichaperone system. n = 3. (H) Aggregate quantification after treatment with bacterial ClpB-DnaK bichaperone system (120 min disaggregation). A further threefold lower chaperones levels used from non-saturating conditions (see Materials and methods). n = 3. (I) Aggregate quantification after treatment with bacterial Hsp70 chaperone system (120 min disaggregation). n = 2. Error bars reflect mean ± sem. See Materials and methods for protein concentrations used. (J) Brownian Dynamics docking results for Escherichia coli DnaJCTD with either CbpAJD or DNAJB1JD. Total number of clusters per simulation, denominator; number of selected clusters (corresponding to 90% of all docked complexes), numerator. The range of average energy values for the selected clusters (in units of kT) is shown in parentheses. The average distance of the center of geometry (COG) of the cluster representatives to the COG of the cluster representatives of the previously docked DNAJB1JD to the DNAJA2CTD is given (see Materials and methods). The selected clusters indicate a defined binding mode and large negative energy values indicate favorable binding. The docked site for the E. coli DnaJ CTD differs from that for human DNAJA2.
Figure 4—figure supplement 2
Cross species communication between class A and B J-proteins in protein refolding and protein disaggregation.
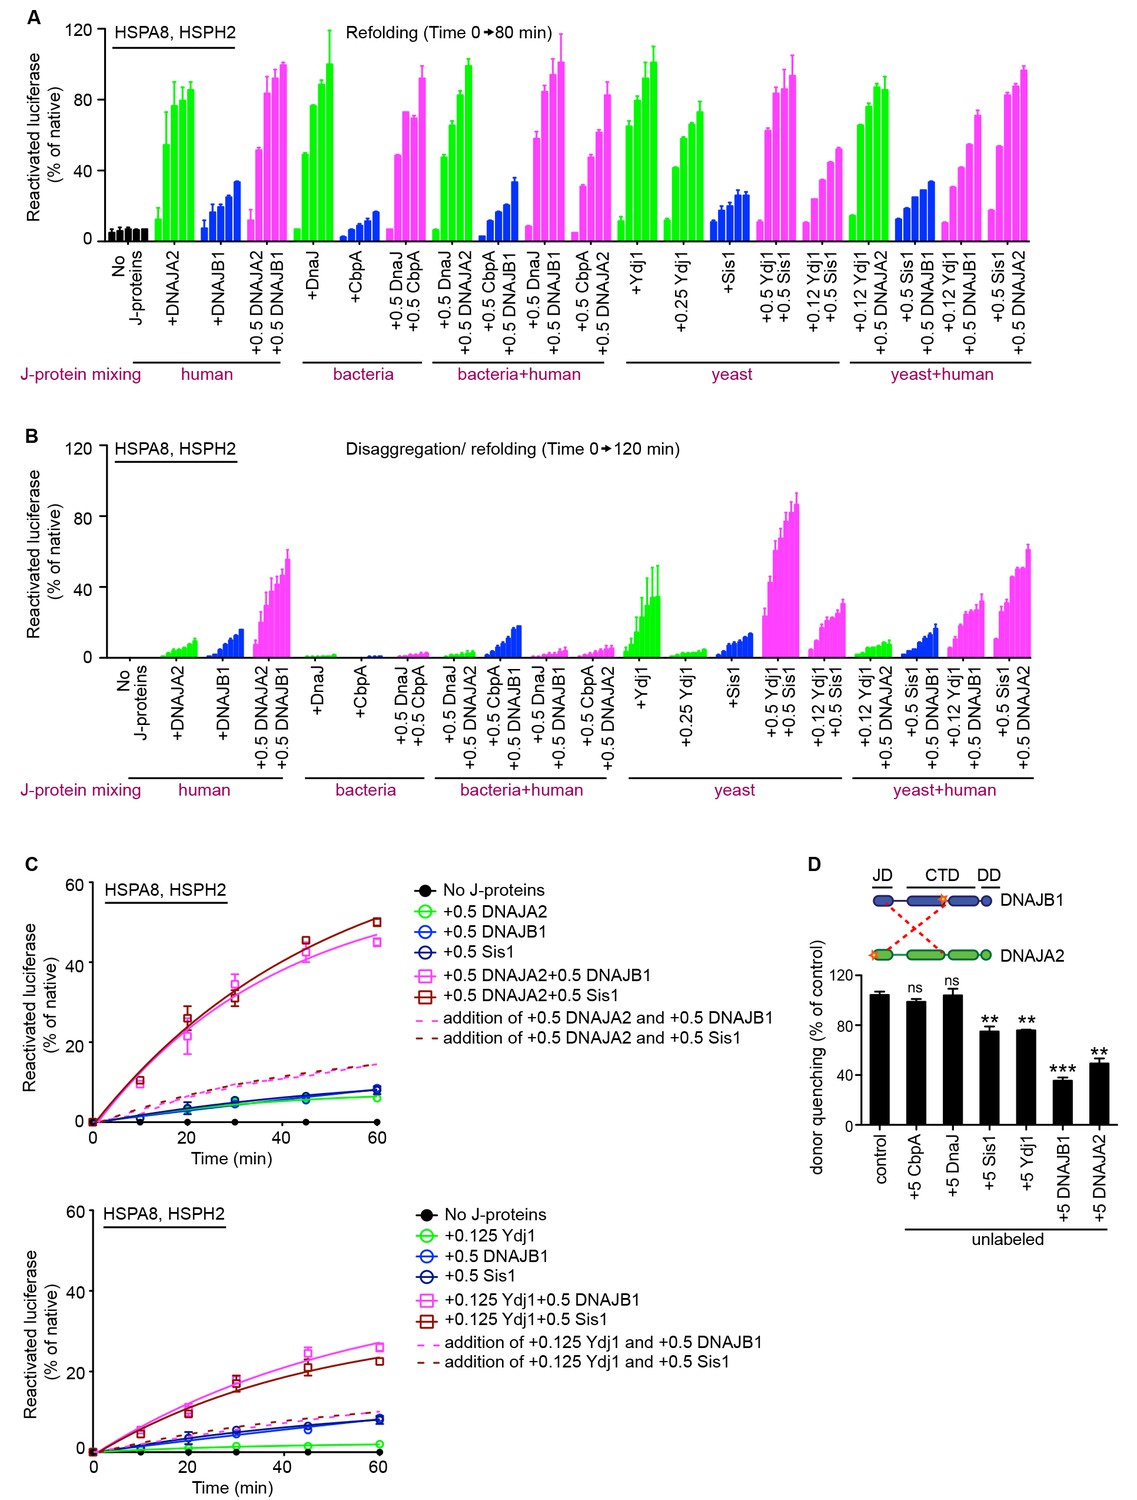
(A) Refolding of heat inactivated monomeric luciferase by human, yeast and bacterial class A and B J-proteins in combination with human HSPA8-HSPH2 chaperone system. Class A, class B and class A+B J-protein containing reactions are indicated by green, blue and magenta, respectively. J-proteins in the combinations are indicated below the graph. n = 2. (B) As in (A), disaggregation/refolding of heat aggregated luciferase by human, yeast and bacterial class A and B J-proteins in combination with HSPA8-HSPH2 chaperone system. n = 2. (C) Cross species cooperation of yeast and human J-proteins via interclass J-protein complex formation to synergize protein disaggregation. Dotted and solid lines plot additive and synergistic affects, respectively. Values for the additive curves were obtained by tallying the measurements obtained for single J-protein reactions at the concentrations used in the A+B combination experiments. n = 2. (D) Competition of unlabeled bacterial, yeast and human J-proteins for the JD-CTD interaction formed between labeled DNAJB1 and DNAJA2 analyzed by FRET. Bars represent donor quenching efficiency of JD and CTD intermolecular interactions. Cartoons above graph show fluorophore positions mapped onto DNAJB1 and DNAJA2 protomers. Red dotted lines indicate intermolecular JD-CTD bidirectional interactions. n = 3. Two-tailed t-test **p<0.01, ***p<0.001.
Figure 5 with 1 supplement

A naturally occurring discriminatory strategy correctly pairs J-proteins for specialized functions in eukaryotes.
(A) Structural organization of canonical (DNAJB1) and non-canonical (DNAJB2 and DNAJB8) members of the class B J-protein subfamily. (B) Reactivation of aggregated luciferase by the human Hsp70-based disaggregase system with canonical and non-canonical J-proteins under saturating chaperone levels. n = 3. See Materials and methods for protein concentrations used. (C) Competition of unlabeled DNAJB1, DNAJB2 and DNAJB8 for the JD-CTD interaction between DNAJB1 and DNAJA2 analyzed by FRET. Bars represent donor quenching efficiency of JD and CTD intermolecular interactions. Cartoon shows fluorophore positions mapped onto DNAJB1 and DNAJA2 protomers. Red dotted lines indicate intermolecular JD-CTD bidirectional interactions. The N-terminus of DNAJA2JD and the C-terminus of DNAJB1CTD (at residue Cys278) were labeled with the acceptor fluorophore ReAsH and the donor fluorophore Alexa Fluor 488, respectively. n = 3. Two-tailed t-test **p<0.01. (D) Electrostatic isopotential contour maps (cyan + 1, red −1 kcal/mol/e) of the J-domains of DNAJB1, DNAJB2 and DNAJB8. DNAJB1RRR is the triple mutant of DNAJB1 (D4R, E69R, E70R) that fails to interact with opposite class CTDs (Nillegoda et al., 2015). (E–L) Interclass interactions between V5-DNAJB1 (control), V5-DNAJB2 and V5-DNAJB8 with either DNAJA2 (E–H) or Hsp70 (I–L) captured by PLA in HeLa cells. Red punctae reflect a single complex formation event between the indicated J-proteins. PLA controls for antibody specificities in mock transfected cells (E, I). Nuclei stained with DAPI (cyan). Scale bar = 10 μm. n (biological repeats) = 2. The Hsp70 antibody recognizes both human Hsp70 and Hsc70 variants.
Figure 5—figure supplement 1
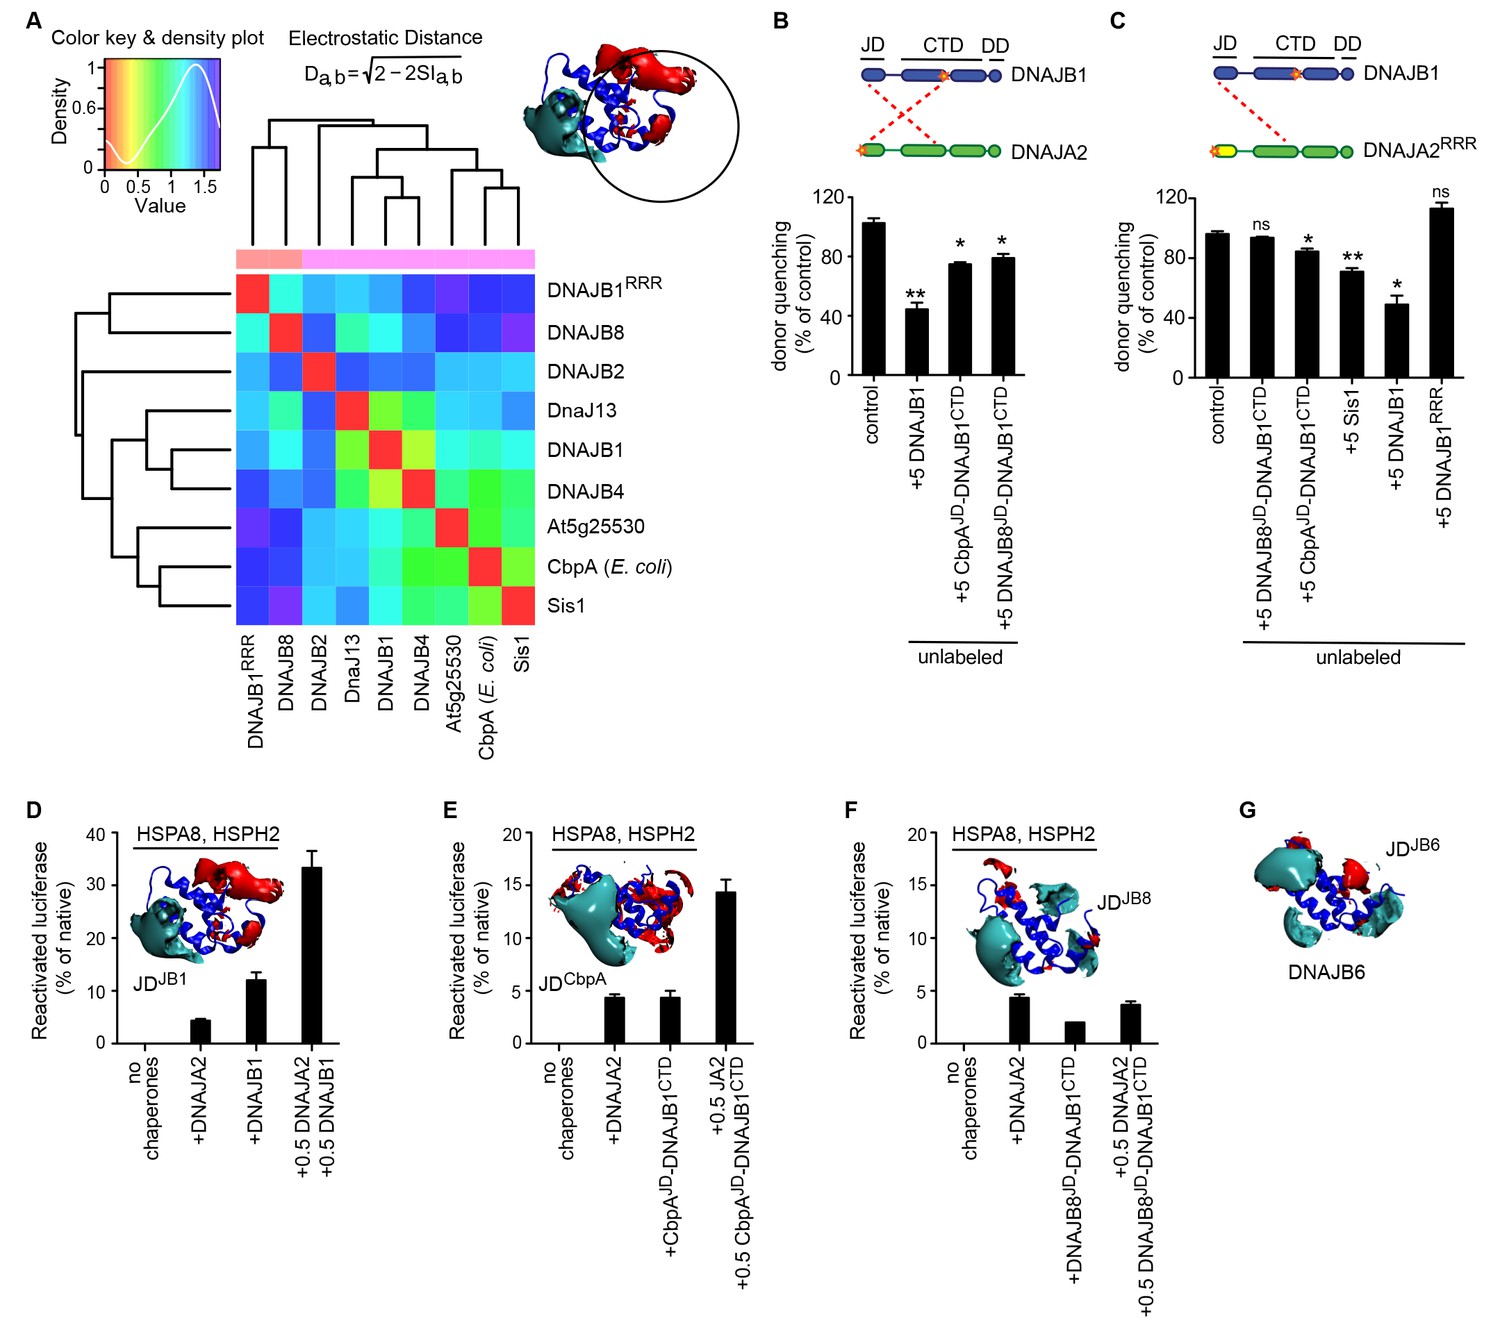
The J-domain of DNAJB8 is insufficient for interclass J-protein cooperation and disaggregation synergy.
(A) Local PIPSA analysis results comparing the electrostatic potentials of eukaryotic class B JD in the region around α-helices I and IV and the mutated residues in DNAJB1RRR (inset, black circle indicating the spherical region analyzed in PIPSA). The JD from Escherichia coli (P36659, CbpA) was included as a control. The electrostatic potentials were clustered by similarity using Ward’s clustering. The heat maps show clustering of J-proteins by similarity (higher similarity indicated by a red shift). (B) FRET assays measuring the competition of wild-type DNAJB1 or J-domain chimeras of DNAJB1 with the JD-CTD interaction between DNAJB1 and DNAJA2. Bars represent donor quenching efficiency of JD and CTD intermolecular interactions. Cartoons above graph show fluorophore positions mapped onto DNAJB1 and DNAJA2 protomers. Red dotted lines indicate intermolecular JD-CTD bidirectional interactions. n = 3. Two-tailed t-test *p<0.05, **p<0.01, ns = not significant. (C) As in (B), FRET assays measuring the competition of wild type DNAJB1, Sis1, DNAJB1RRR or J-domain chimeras of DNAJB1 with the JD-CTD interaction between DNAJB1 and DNAJA2RRR. RRR denotes J-domain charge reversal mutations D4R, E69R, E70R for DNAJB1 and D6R, E61R, E64R for DNAJA2. n = 3. (D–F) Disaggregation/refolding of heat aggregated luciferase by human HSPA8-HSPH2 chaperone system containing DNAJB1, CbpAJD(E. coli)-DNAJB1CTD and DNAJB8JD-DNAJB1CTD. Interclass J-protein combinations are generated with class A J-protein DNAJA2. Inset, electrostatic isopotential contour maps of JDs of DNAJB1, E coli CbpA and DNAJB8 (cyan + 1, red −1 kcal/mol/e). n = 3. Error bars reflect mean ± sem. See Methods for protein concentrations used. (G) Electrostatic potential of the J-domain of human DNAJB6.
Figure 6
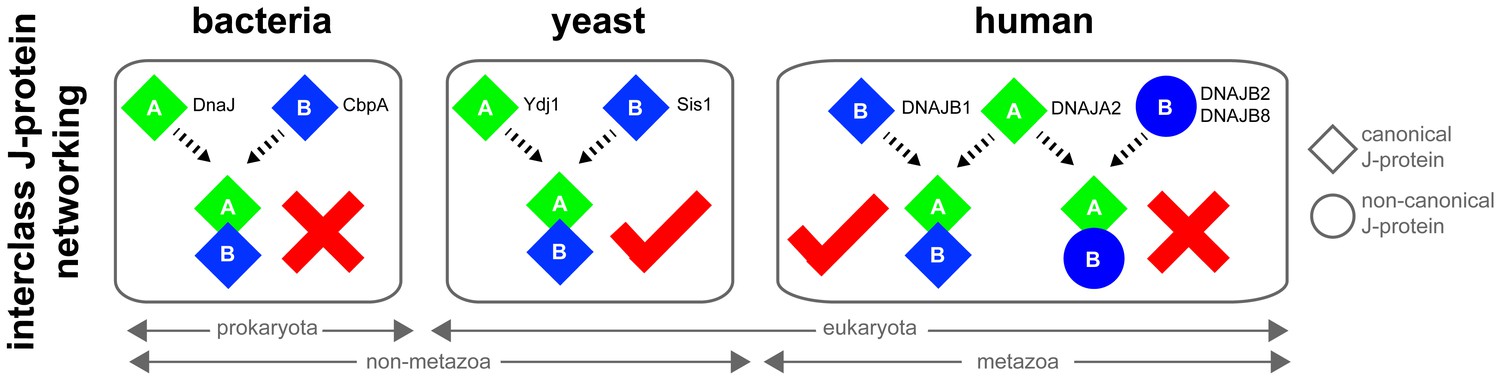
Canonical class A and class B members form interclass J-protein networks in eukaryotic cells.
Cytosolic yeast and human canonical class A and class B members (e.g. Ydj1 and Sis1, Saccharomyces cerevisiae; DNAJA2 and DNAJB1, Homo sapiens) form interclass J-protein complexes via complementary binding interfaces at the JDs and the hinge regions of CTDs. E. coli cytosol contains only a single pair of canonical class A (DnaJ) and class B (CbpA) J-proteins. These bacterial J-proteins however fail to form interclass J-protein complexes due to the lack of complementary structural features required to establish intermolecular JD-CTD contacts.
Download links
A two-part list of links to download the article, or parts of the article, in various formats.
Downloads (link to download the article as PDF)
Open citations (links to open the citations from this article in various online reference manager services)
Cite this article (links to download the citations from this article in formats compatible with various reference manager tools)
Evolution of an intricate J-protein network driving protein disaggregation in eukaryotes
eLife 6:e24560.
https://doi.org/10.7554/eLife.24560


