Chemotactic network responses to live bacteria show independence of phagocytosis from chemoreceptor sensing
- National Institute of Diabetes and Digestive and Kidney Diseases, The National Institutes of Health, United States
Figures
Figure 1 with 1 supplement
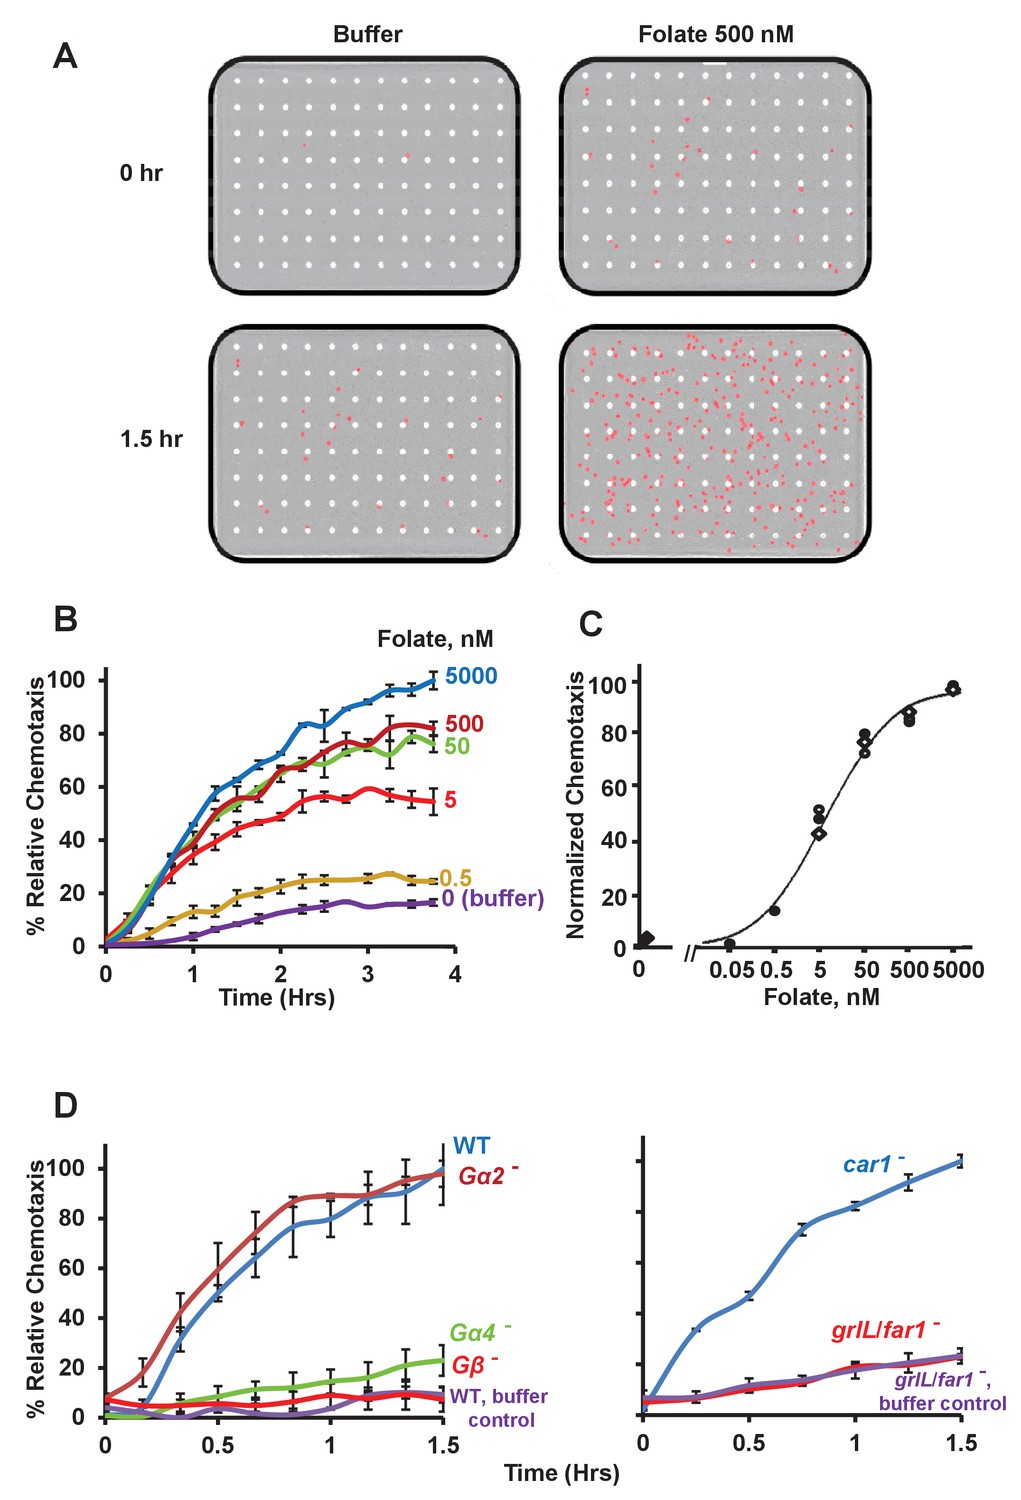
Chemotactic dose-response to folate.
(A) Images of Dictyostelium (in red) that have migrated through membrane pores (in white) in response to either control buffer or the chemoattractant folate, at 0 and 1.5 hr. (B) Time-course quantification of Dictyostelium migration to various dose concentrations of folate. Relative chemotaxis is normalized to 5000 nM folate at 4 hr. Standard deviations are shown based upon three replicates. (C) Quantified dose-response for Dictyostelium chemotaxis to folate. Curve fit is for an EC50 = 5 nM. Symbols presented are means from three separate experiments at 2 hr. (D) Time-course quantification of WT and Gα2-, Gα4-, Gβ-, car1-, and grlL/far1-null Dictyostelium migration to 500 nM folate or to buffer controls. Relative chemotaxis is normalized to WT (or car1-null) Dictyostelium at 1.5 hr; WT shows 10–20% higher relative chemotaxis to folate at 1.5 hr than does car1-null. Standard deviations are shown based upon three replicates.
Figure 1—figure supplement 1
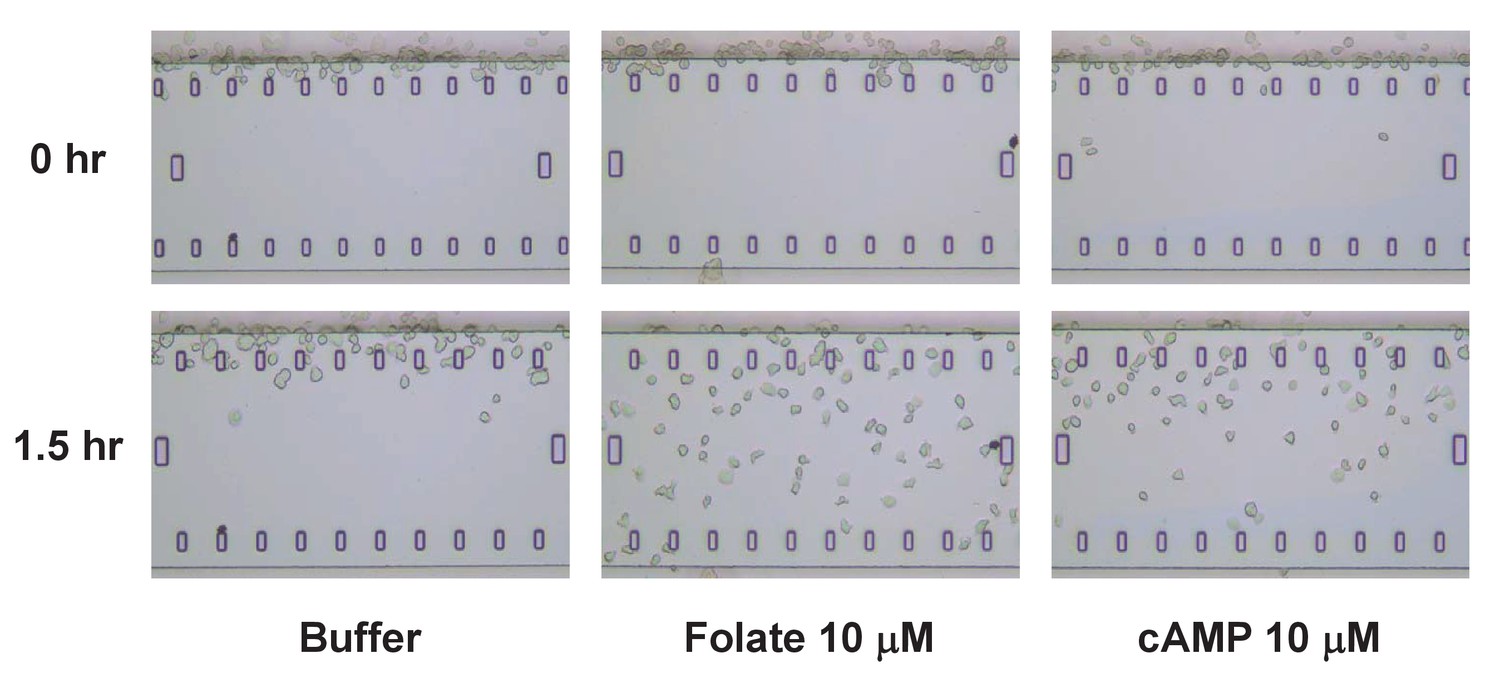
TaxiScan images of chemotaxing Dictyostelium.
Time-course TaxiScan images of growing Dictyostelium migrating toward a buffer control, 10 μM folate, or 10 μM cAMP, at 0 and 1.5 hr. This also relates to data in Figure 3.
Figure 2
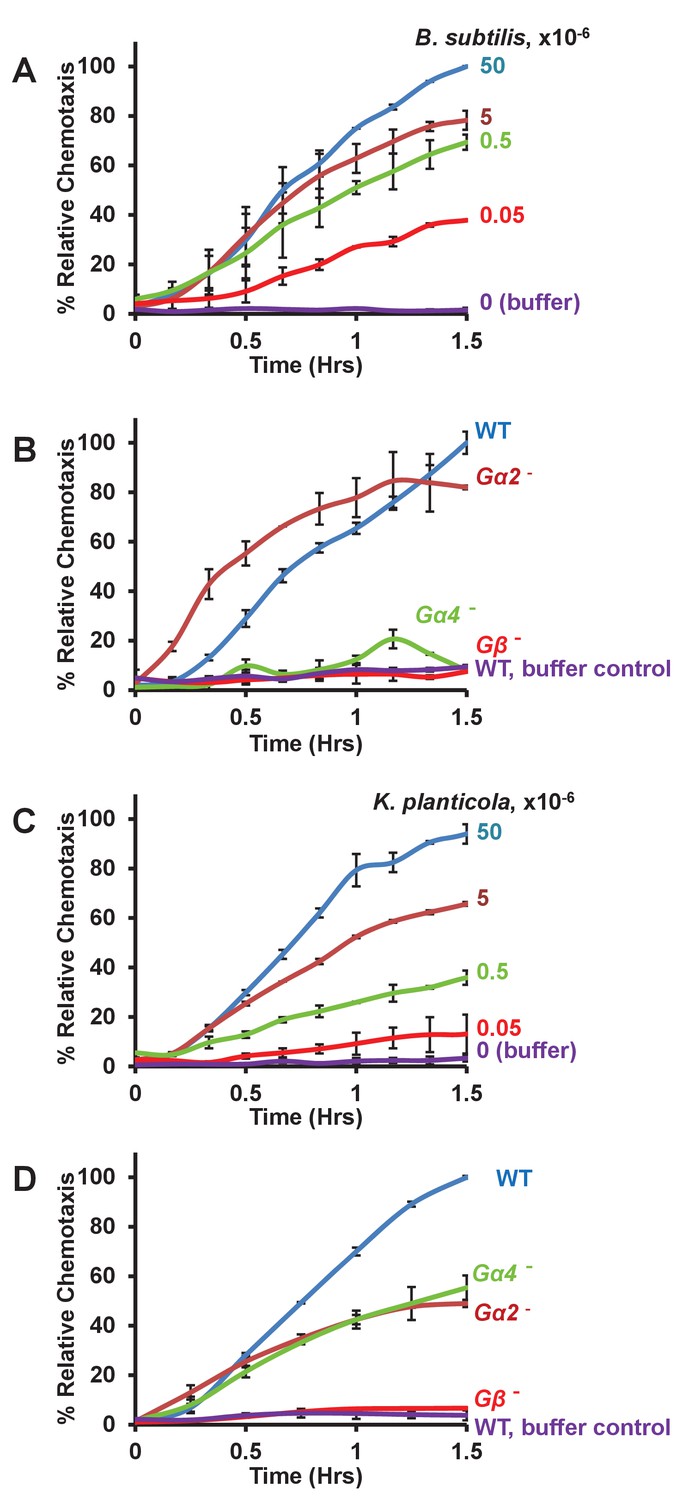
Chemotaxis to live bacteria.
(A) Time-course quantification of WT Dictyostelium migration to various numbers of Bacillus subtilis. Relative chemotaxis is normalized to 5 × 10⁷ bacteria at 1.5 hr. Standard deviations are shown based upon three replicates. (B) Time-course quantification of WT and Gα2-, Gα4-, and Gβ-null Dictyostelium migration to 5 × 10⁷ Bacillus subtilis or to buffer controls. Relative chemotaxis is normalized to WT Dictyostelium at 1.5 hr. Standard deviations are shown based upon three replicates. (C) Time-course quantification of WT Dictyostelium migration to various numbers of Klebsiella planticola. Relative chemotaxis is normalized to 5 × 10⁷ bacteria at 1.5 hr. Standard deviations are shown based upon three replicates. (D) Time-course quantification of WT and Gα2-, Gα4-, and Gβ-null Dictyostelium migration to 5 × 10⁷ Klebsiella planticola or to buffer controls. Relative chemotaxis is normalized to WT Dictyostelium at 1.5 hr Standard deviations are shown based upon three replicates.
Figure 3
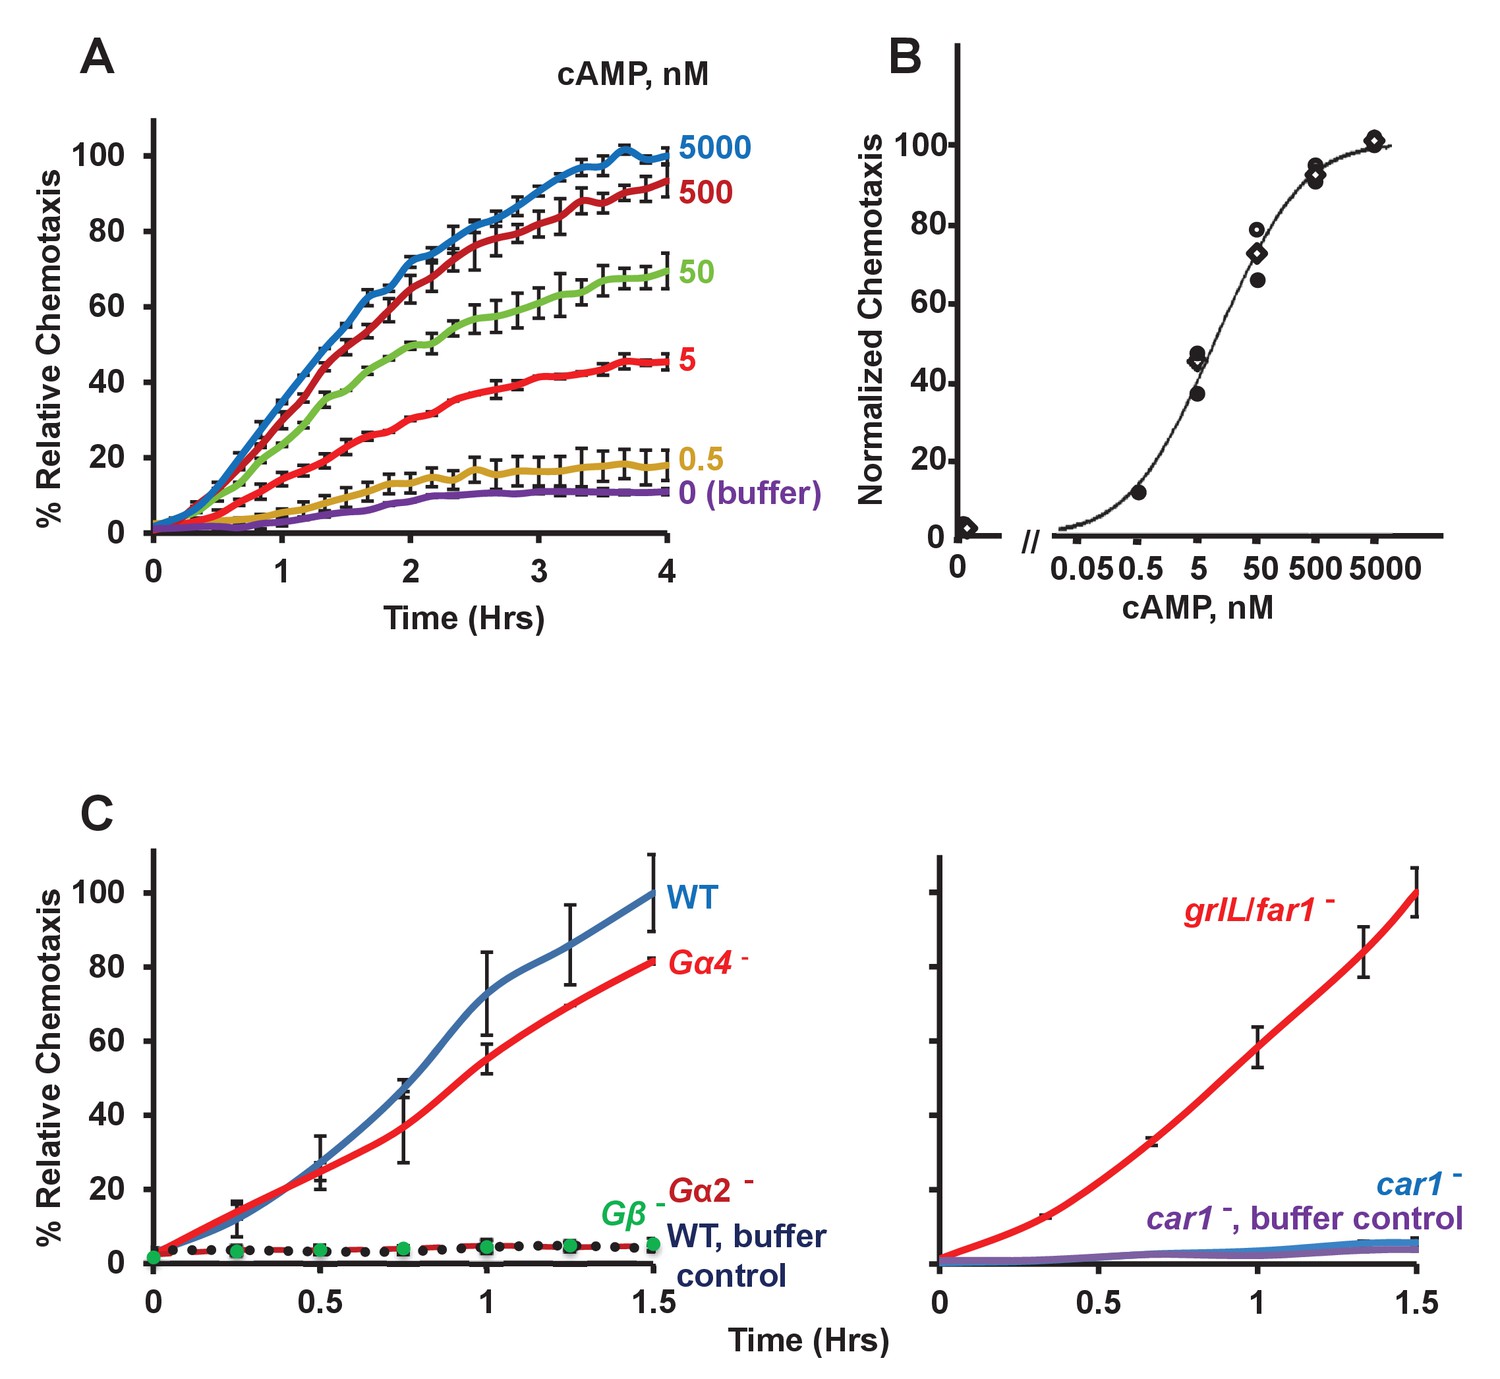
Chemotactic dose-response to cAMP.
(A) Time-course quantification of Dictyostelium migration to various dose concentrations of cAMP. Relative chemotaxis is normalized to 5000 nM cAMP at 4 hr. Standard deviations are shown based upon three replicates. (B) Quantified dose-response for Dictyostelium chemotaxis to cAMP. Curve fit is for an EC50 = 6 nM. Symbols presented are means from three separate experiments at 2 hr. (C) Time-course quantification of WT and Gα2-, Gα4-, Gβ-, car1-, and grlL/folR-null Dictyostelium migration to 50 nM cAMP or to buffer controls. Relative chemotaxis is normalized to WT (or grlL/folR-null) Dictyostelium at 1.5 hr; grlL/far1-null shows 10–20% higher relative chemotaxis to folate at 1.5 hr than does WT. Standard deviations are shown based upon three replicates.
Figure 4 with 2 supplements
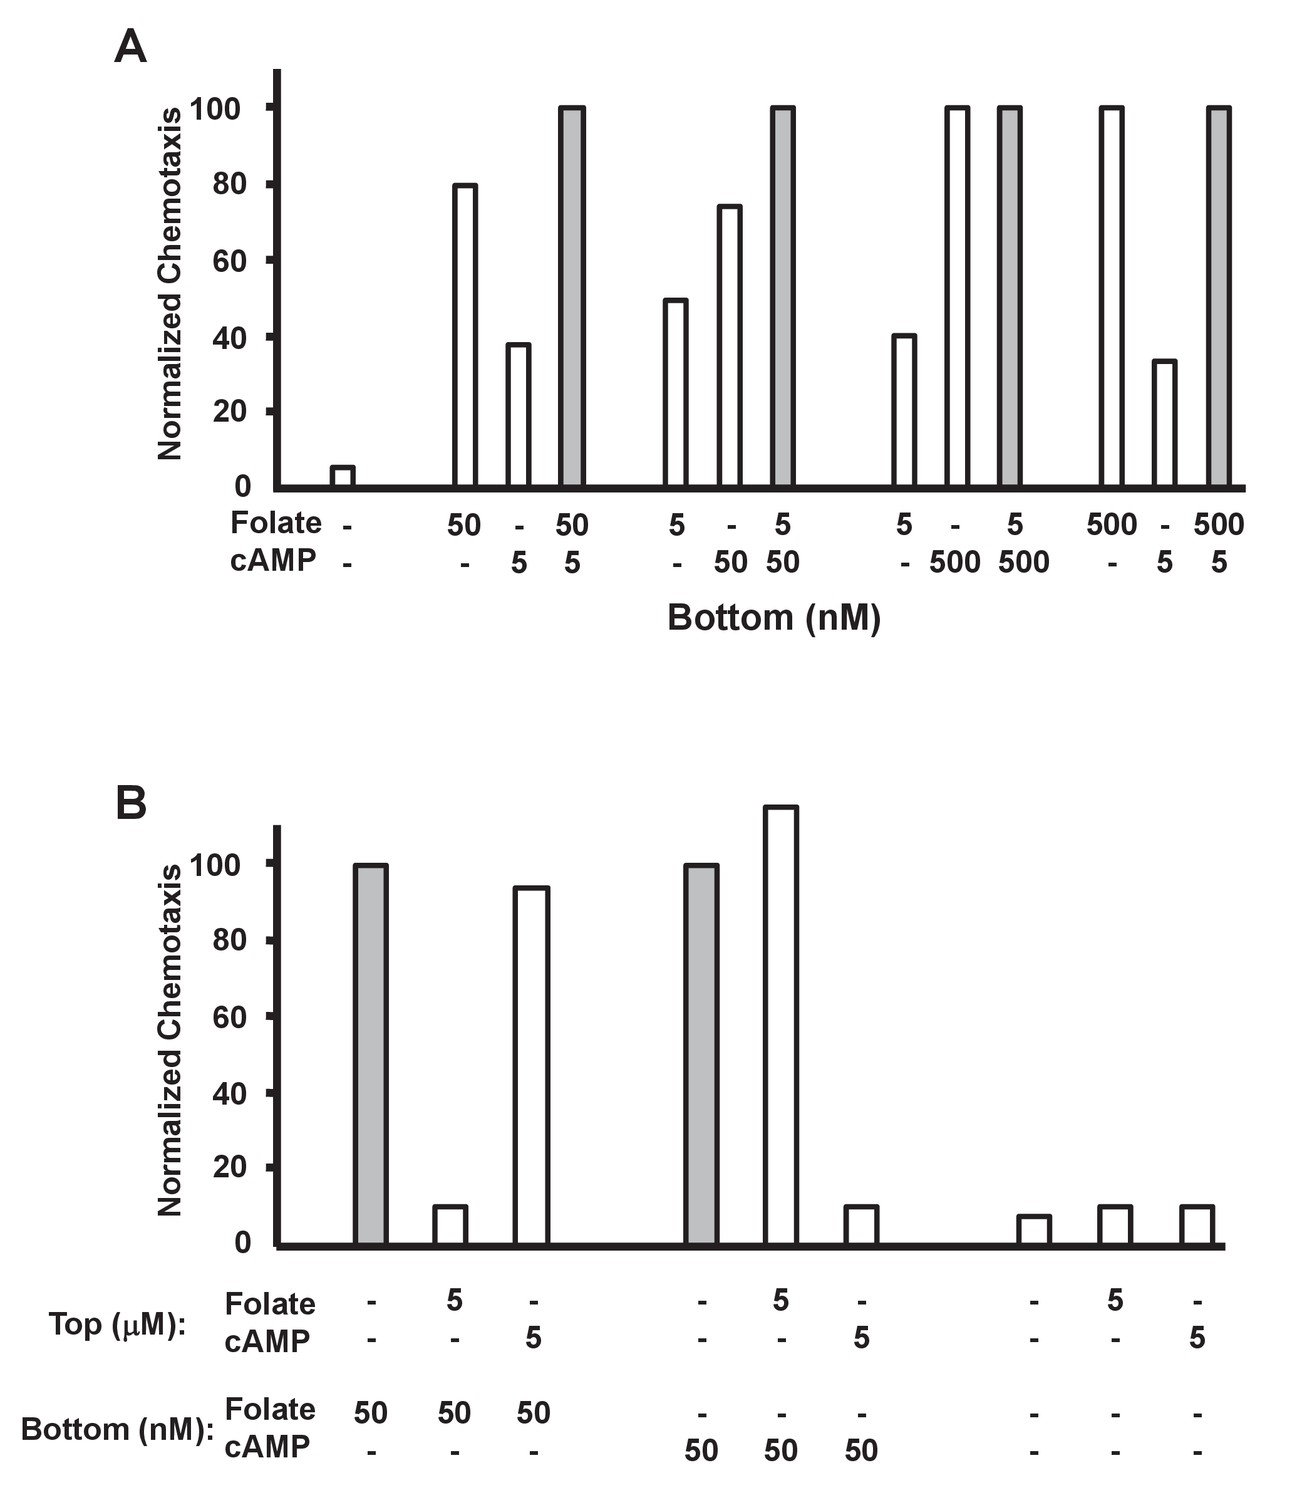
Additive and competitive effects of folate and cAMP to chemotaxis.
(A) Quantified additive effects of folate and cAMP to chemotaxis. Folate and/or cAMP was used as a chemoattractant in the bottom chamber at varying concentrations (see Figure 4—figure supplement 1), as indicated. Normalizations were to maximum (shaded bar) chemotaxis within each 3-grouping. For SD statistics, etc. see Figure 4—figure supplement 1. (B) Quantified competitive effects of folate and cAMP to chemotaxis. Folate or cAMP was used as a chemoattractant in the bottom chamber, with or without a saturating (5 μM) folate or cAMP competitor in the top chamber (see Figure 4B—figure supplement 2), as indicated. Normalizations were to non-competed (shaded bar) chemotaxis within each 3-grouping. For SD statistics, etc. see Figure 4—figure supplement 2.
Figure 4—figure supplement 1
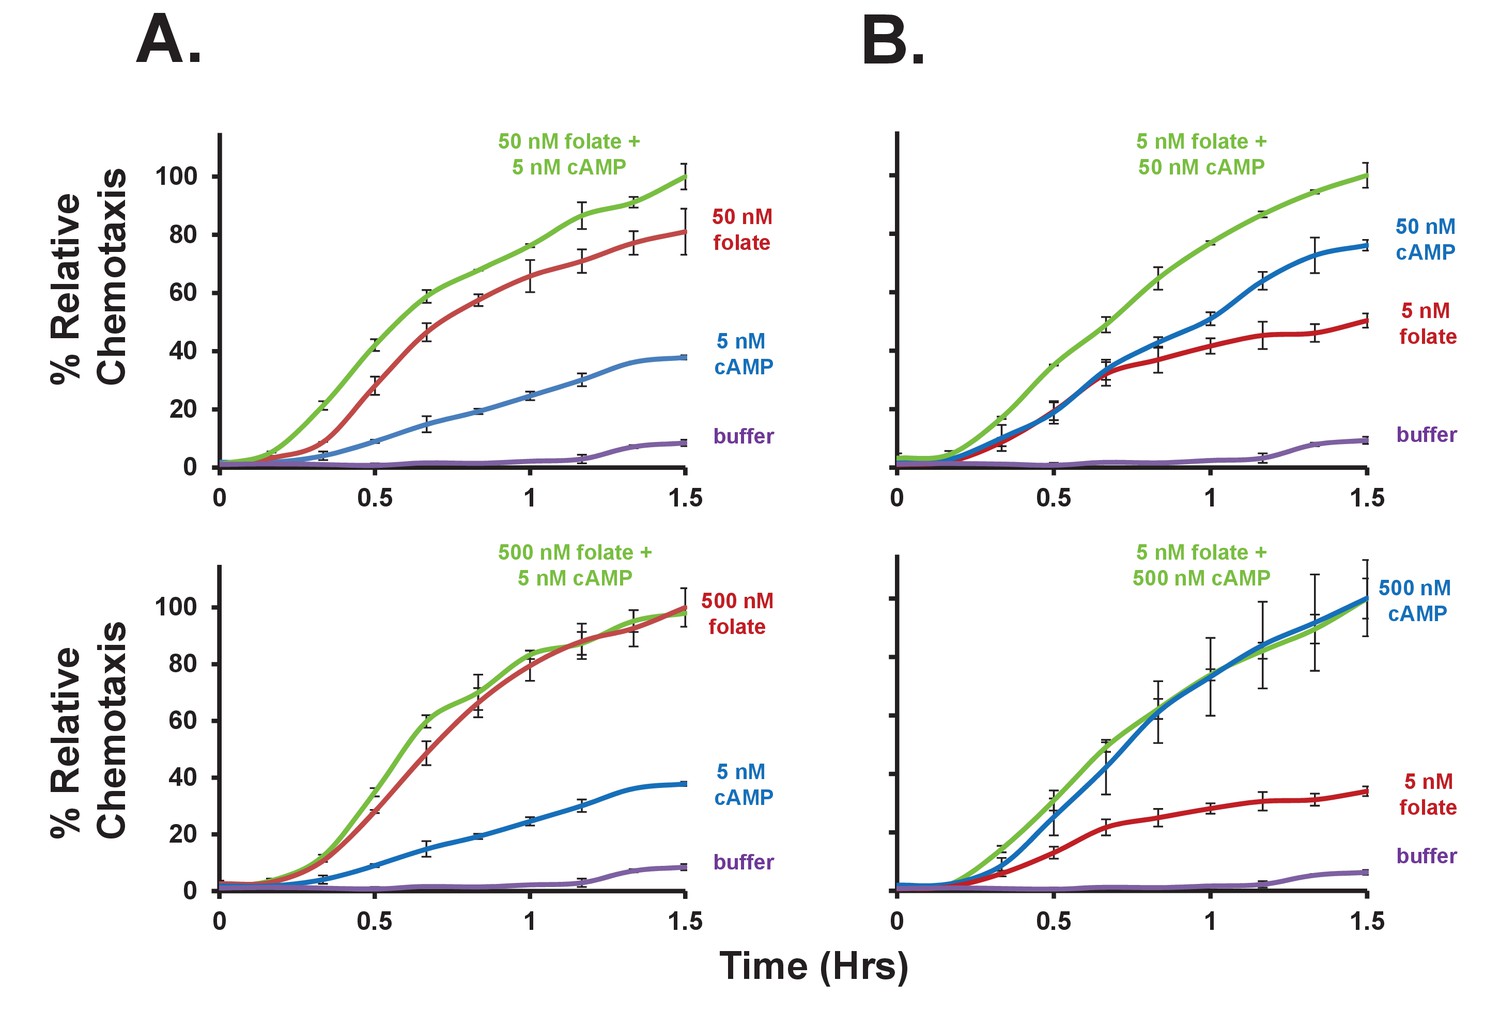
Additive effects of folate and cAMP to chemotaxis.
(A) Time-course quantification of Dictyostelium migration to 5 nM cAMP, saturating (500 nM) folate, or non-saturating (50 nM) folate, alone or in a combinatorial mix of 5 nM cAMP + folate, as indicated. Migration to buffer control is included. (B) Time-course quantification of Dictyostelium migration to 5 nM folate, saturating (500 nM) cAMP, or non-saturating (50 nM) cAMP, alone or in a combinatorial mix of 5 nM folate + cAMP, as indicated. Migration to buffer control is included. Normalizations were to maximal chemotaxis at 1.5 hr, wthin each grouping. Standard deviations are shown based upon three replicates. Relative chemotaxis data are quantified in Figure 4A.
Figure 4—figure supplement 2

Competitive effects of folate and cAMP to chemotaxis.
Time-course quantification of Dictyostelium migration to folate or cAMP in the bottom chamber, with or without a saturating (5 μM) folate or cAMP competitor in the top chamber, as indicated. Normalizations were to uncompleted chemotaxis at 1.5 hr, within each grouping. Standard deviations are shown based upon three replicates. Relative chemotaxis data are quantified in Figure 4B.
Figure 5
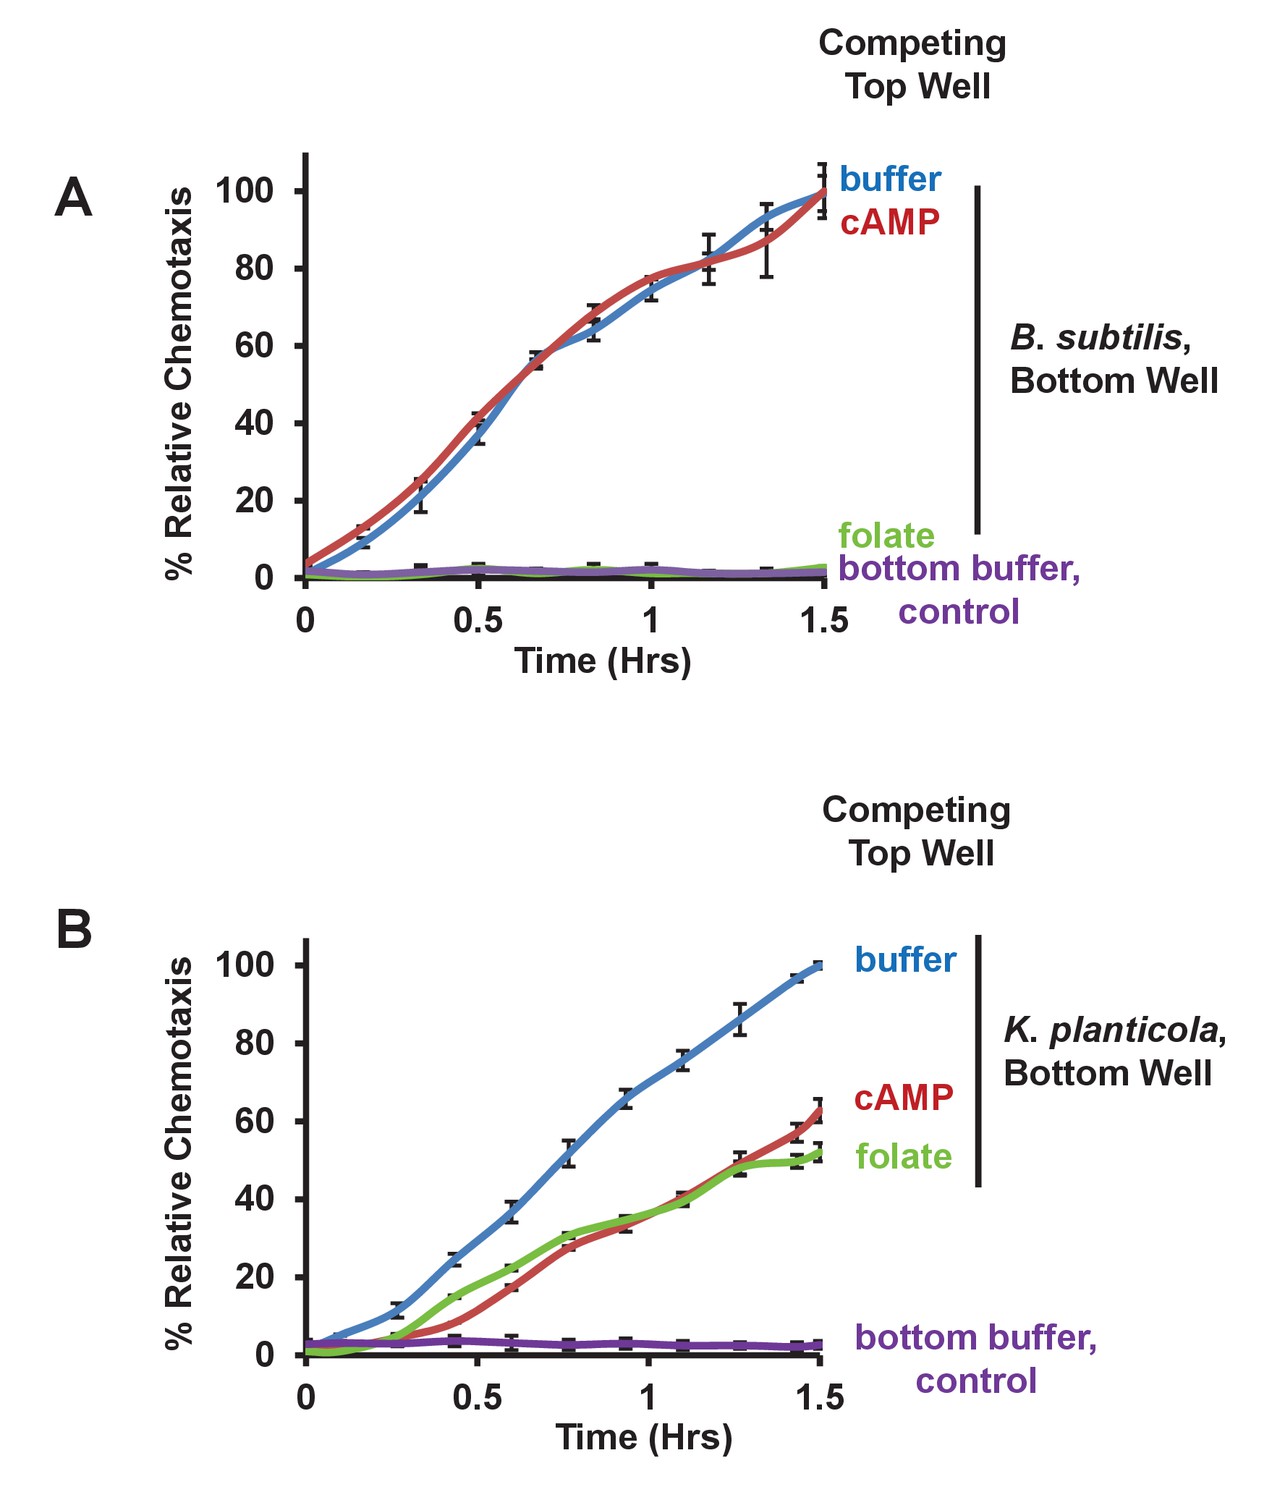
Chemotaxis to live bacteria in the presence of competing chemoattractants.
(A) Time-course quantification of WT Dictyostelium migration to 5 × 10⁷ Bacillus subtilis or to buffer controls in the presence of competing levels of 5 μM folate or 5 μM cAMP in the top well, as indicated. Relative chemotaxis is normalized to WT Dictyostelium at 1.5 hr without any competitor. Standard deviations are shown based upon three replicates. (B) Time-course quantification of WT Dictyostelium migration to 5 × 10⁷ Klebsiella planticola or to buffer controls in the presence of competing levels of 5 μM folate or 5 μM cAMP in the top well, as indicated. Relative chemotaxis is normalized to WT Dictyostelium at 1.5 hr without any competitor. Standard deviations are shown based upon three replicates.
Figure 6 with 2 supplements
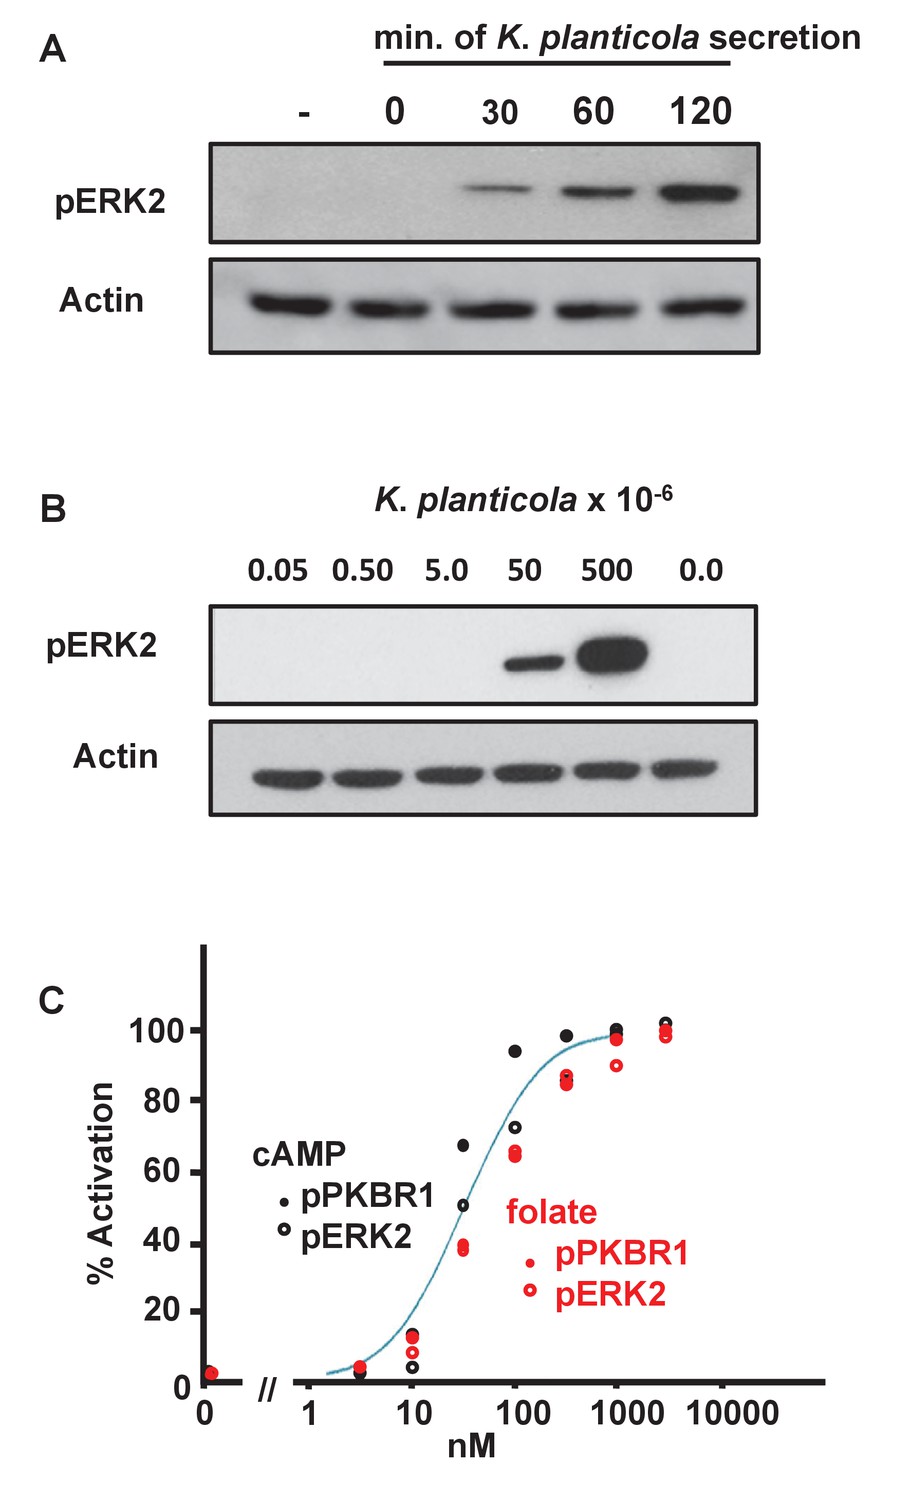
Biochemical responses of Dictyostelium to bacterially secreted chemoattractants.
(A) Time-course accumulation of secreted chemoattractants by Klebsiella planticola, at 5 × 10⁷ bacteria/ml, as assayed by pERK2 activation. Dictyostelium were stimulated with supernatants from Klebsiella planticola cultures incubated for the times indicated. Proteins were immunoblotted to α-pERK2 to confirm appropriate time courses for activation and adaptation. 30 s samples were separately immunoblotted for pERK2 activation and normalizing actin. (B) Density-dependent effect of secreted chemoattractants by Klebsiella planticola, as assayed by pERK2 activation. Klebsiella planticola were washed from media and incubated at 5 × 10⁹ cells/ml in buffer for 2 hr. The bacterial supernatant was collected, and the volumes equivalent to the cell numbers indicated were used to stimulate Dictyostelium. Proteins were immunoblotted to α-pERK2 to confirm appropriate time courses for activation and adaptation. 30 s samples were separately immunoblotted for pERK2 activation and normalizing actin. (C) Quantified dose-response for the phosphorylations of PKBR1, at 15 s, and ERK2, at 30 s, to folate (see Figure 6—figure supplement 1) and cAMP (see Figure 6—figure supplement 2), and normalized to actin. Curve fit is for an EC50 = 30 nM.
Figure 6—figure supplement 1
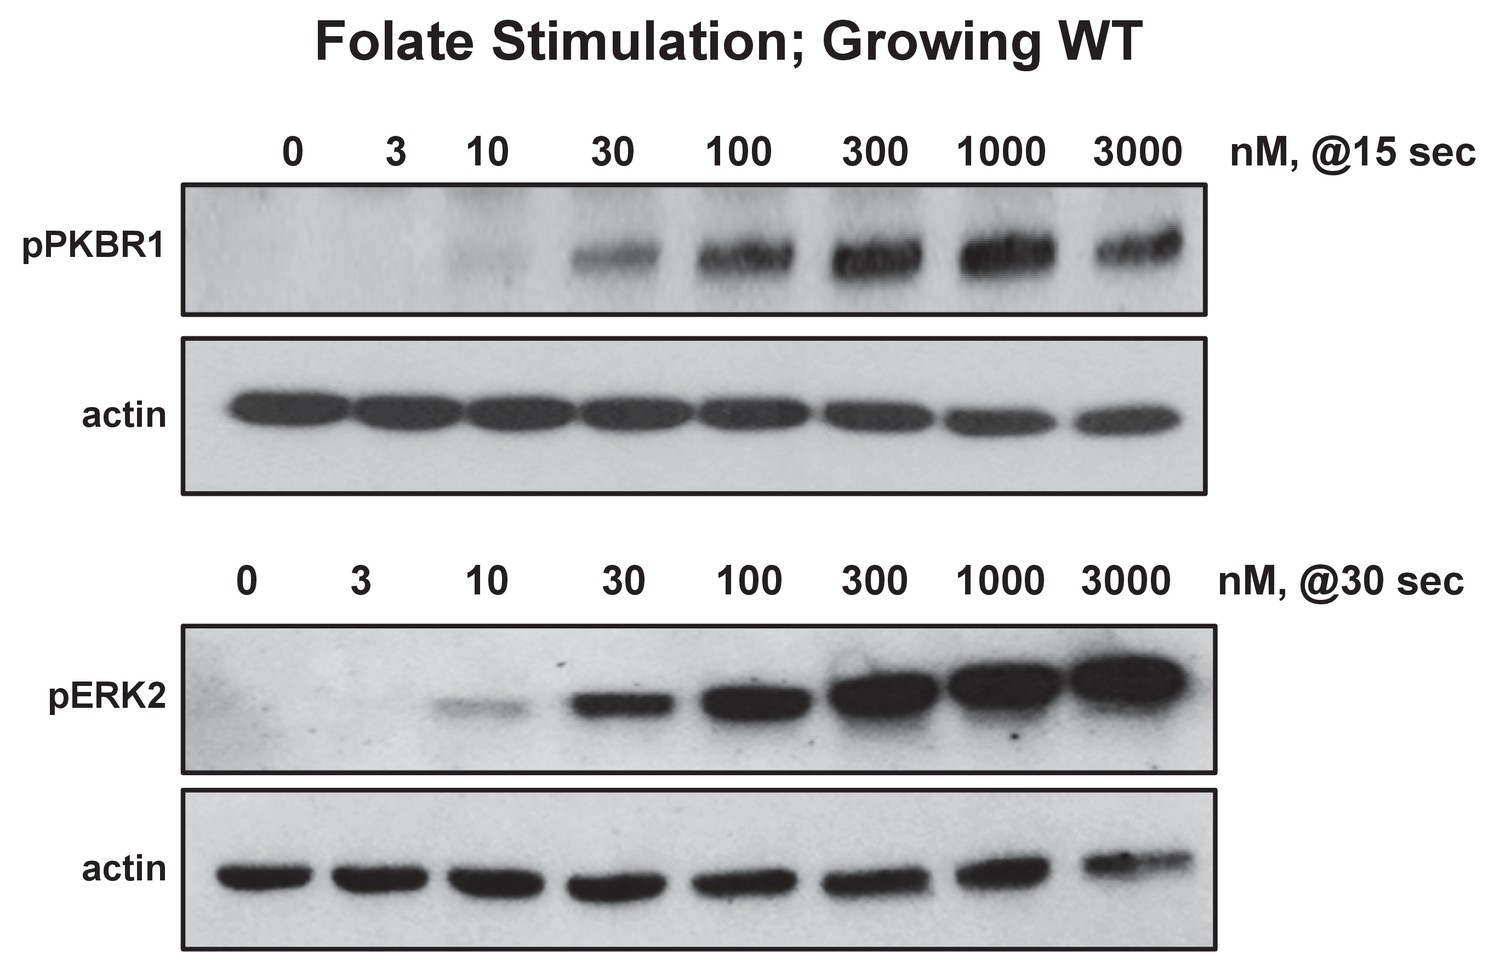
Biochemical dose-responses to folate.
Cells were stimulated with various concentrations of folate, as indicated, and samples taken at 0, 15, 30, 60, and 180 s. Proteins were immunoblotted to α-pKPBR1 or α-pERK2 to confirm appropriate time courses for activation and adaptation. Shown are 15 s samples separately immunoblotted for pPKBR1 activation and normalizing actin and 30 s samples separately immunoblotted for pERK2 activation and normalizing actin.
Figure 6—figure supplement 2
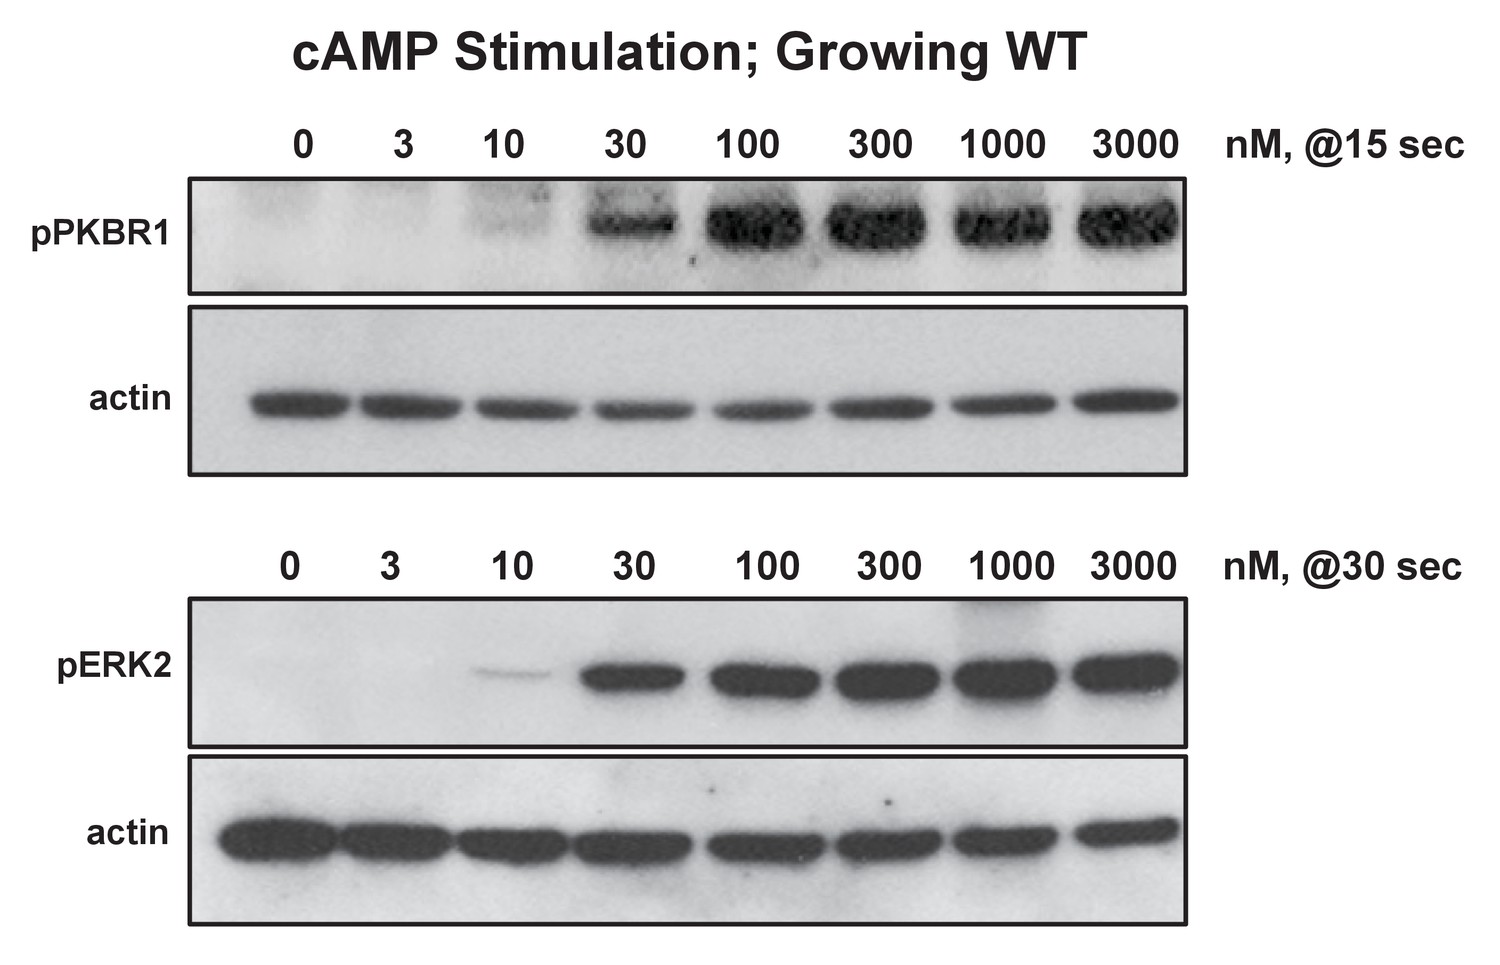
Biochemical dose-responses to cAMP.
Cells were stimulated with various concentrations of cAMP, as indicated, and samples taken at 0, 15, 30, 60, and 180 s. Proteins were immunoblotted to α-pKPBR1 or α-pERK2 to confirm appropriate time courses for activation and adaptation. 15 s samples were separately immunoblotted for pPKBR1 activation and normalizing actin; 30 s samples were separately immunoblotted for pERK2 activation and normalizing actin.
Figure 7

Loss of GPCRs in Dictyostelium impairs chemotaxis but not phagocytosis.
(A) Fluorescent images of pHrodo-labelled E. coli (in red) engulfed by WT Dictyostelium over time. Time-course quantification of WT and Gα4- and Gβ-null fluorescence normalized to WT at 1.5 hr. Standard deviations are shown based upon three replicates. (B) FOR CHEMOTAXIS: Time-course chemotaxis quantification of grlL/far1- and car1-null cells and their respective GPCR-expressing cell lines to 500 nM folate or 500 nM cAMP (as indicated), with buffer controls. Relative chemotaxis is normalized to the respective GPCR-expressing cell line at 1.5 hr. Standard deviations are shown based upon three replicates. FOR PHAGOCYTOSIS: Time-course phagocytosis quantification of pHrodo-labelled E. coli by grlL/far1- and car1-null cells and their respective GPCR-expressing cell lines, normalized to the respective null cells at 1.5 hr. Standard deviations are shown based upon three replicates. (C) FOR CHEMOTAXIS: Time-course chemotaxis quantification of WT, grlL/far1-null and GrlL/fAR1-expressing cells to live pHrodo-labelled B. subtilis. Relative chemotaxis is normalized to WT at 1.5 hr. Standard deviations are shown based upon three replicates. FOR PHAGOCYTOSIS: Time-course phagocytosis quantification of live pHrodo-labelled B. subtilis by WT, grlL/far1-null, and GrlL/fAR1-expressing cells, normalized to WT at 1.5 hr. Standard deviations are shown based upon three replicates.
Figure 8
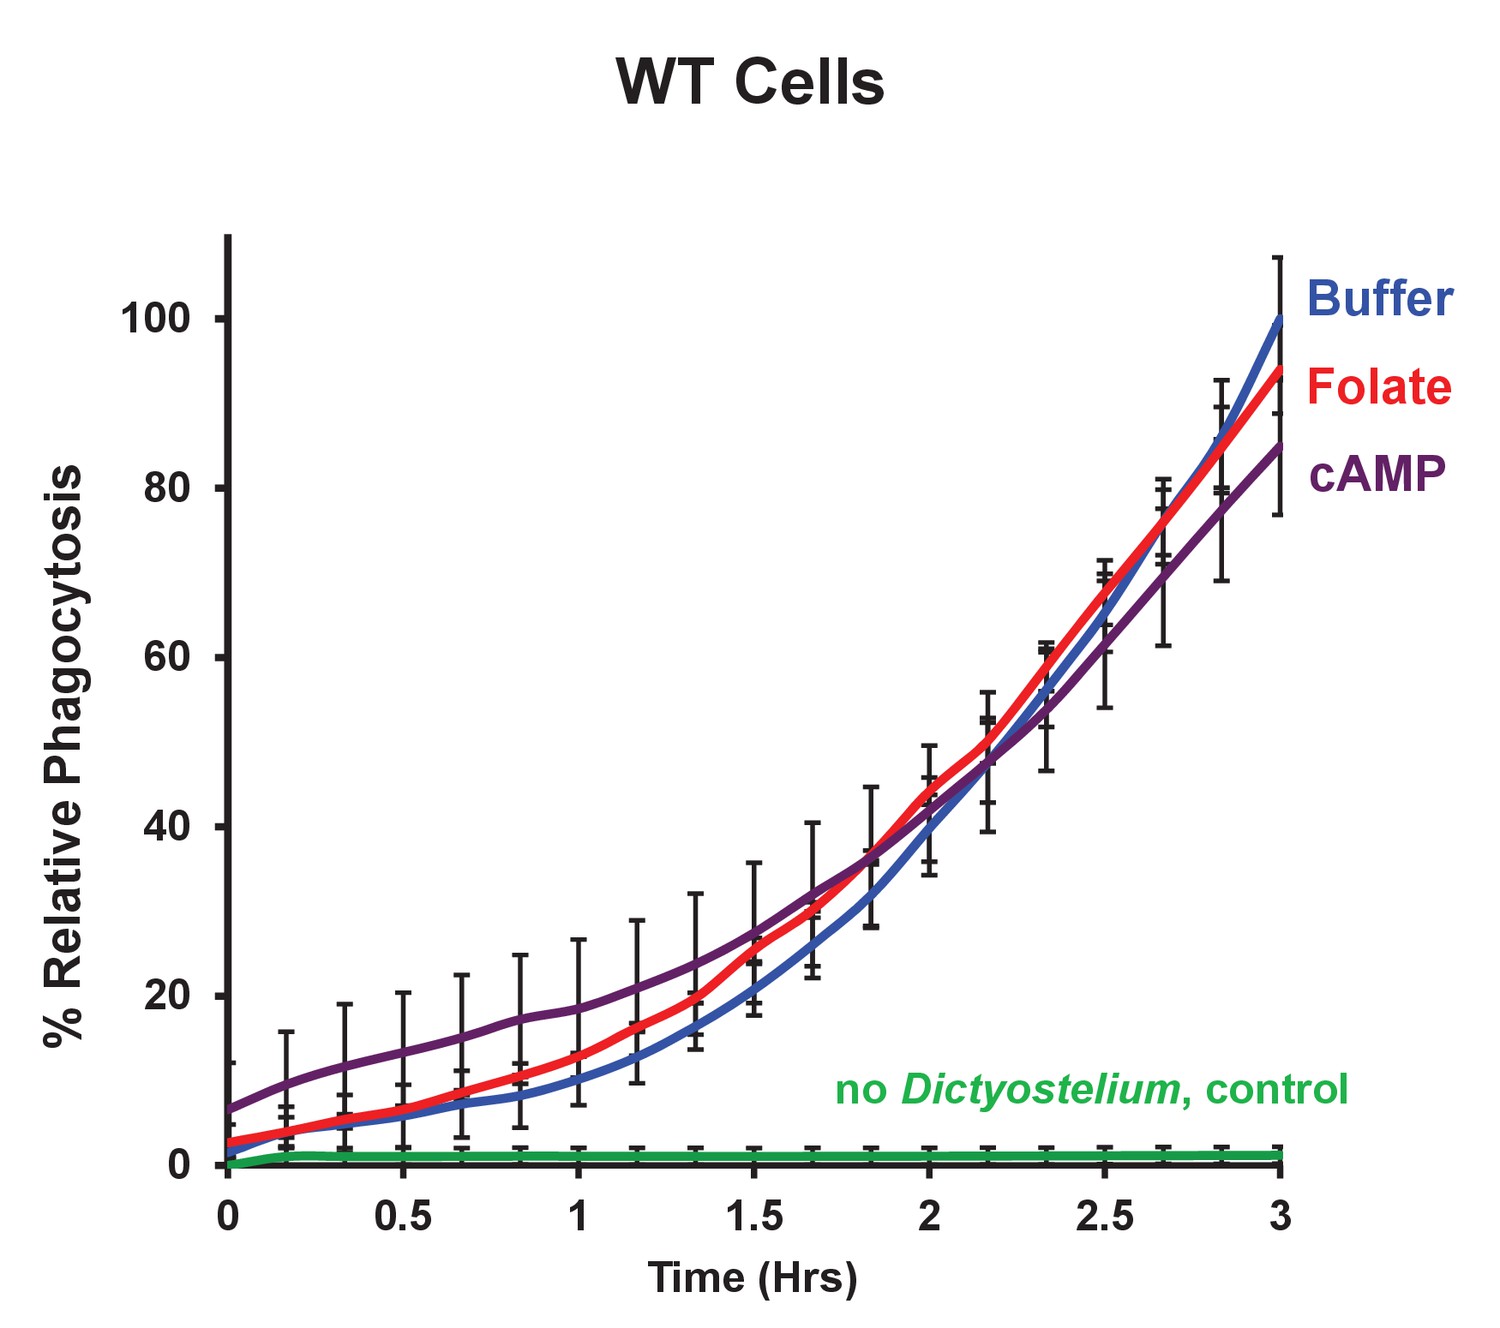
Chemoattractant-stimulation does not activate phagocytosis.
Time-course phagocytosis quantification of pHrodo-labelled E. coli by control WT or chemotactically-stimulated WT cell lines, normalized to buffer treated control cells at 3 hr. Standard deviations are shown based upon three replicates.
Figure 9 with 2 supplements
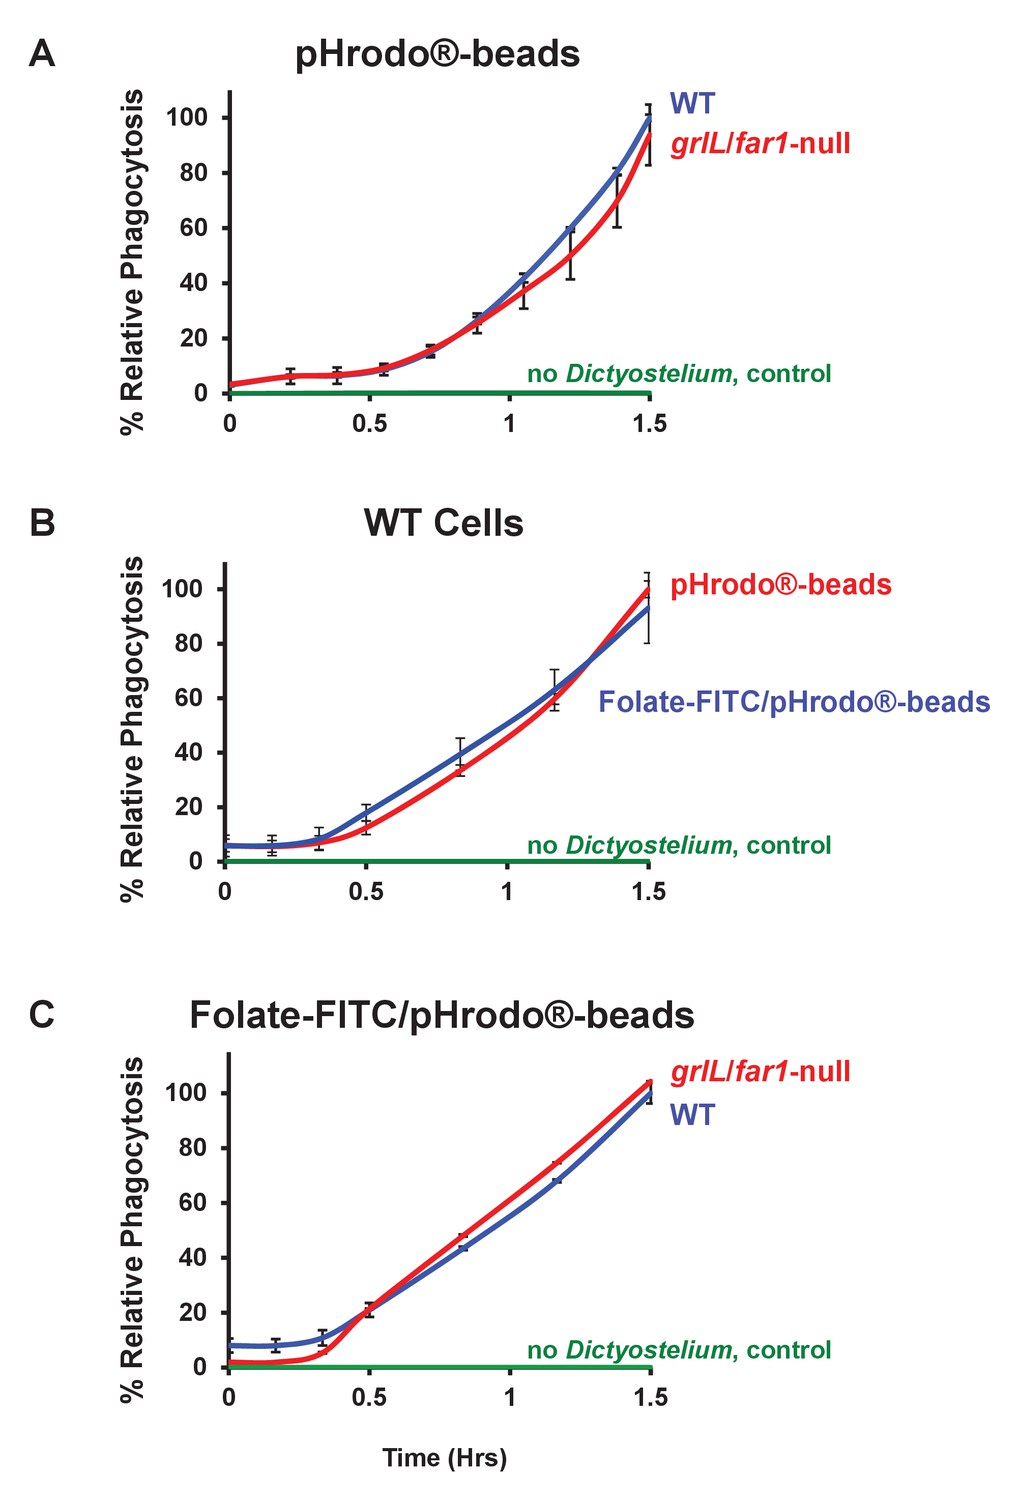
Folate surface coating of latex beads does not stimulate their phagocytosis by Dictyostelium.
(A) Time-course phagocytosis quantification of pHrodo-labelled latex beads (see Figure 9—figure supplement 1) by WT or grlL/far1-null cells, normalized to WT cells at 1.5 hr. Standard deviations are shown based upon three replicates. (B) Time-course phagocytosis quantification of pHrodo-labelled and Folate- FITC/pHrodo-labelled latex beads (see Figure 9—figure supplements 1 and 2) by WT Dictyostelium, normalized to pHrodo-beads at 1.5 hr. Standard deviations are shown based upon three replicates. (C) Time-course phagocytosis quantification of Folate-FITC/pHrodo-labelled latex beads (see Figure 9—figure supplement 2) by WT or grlL/far1-null cells, normalized to WT cells at 1.5 hr. Standard deviations are shown based upon three replicates.
Figure 9—figure supplement 1
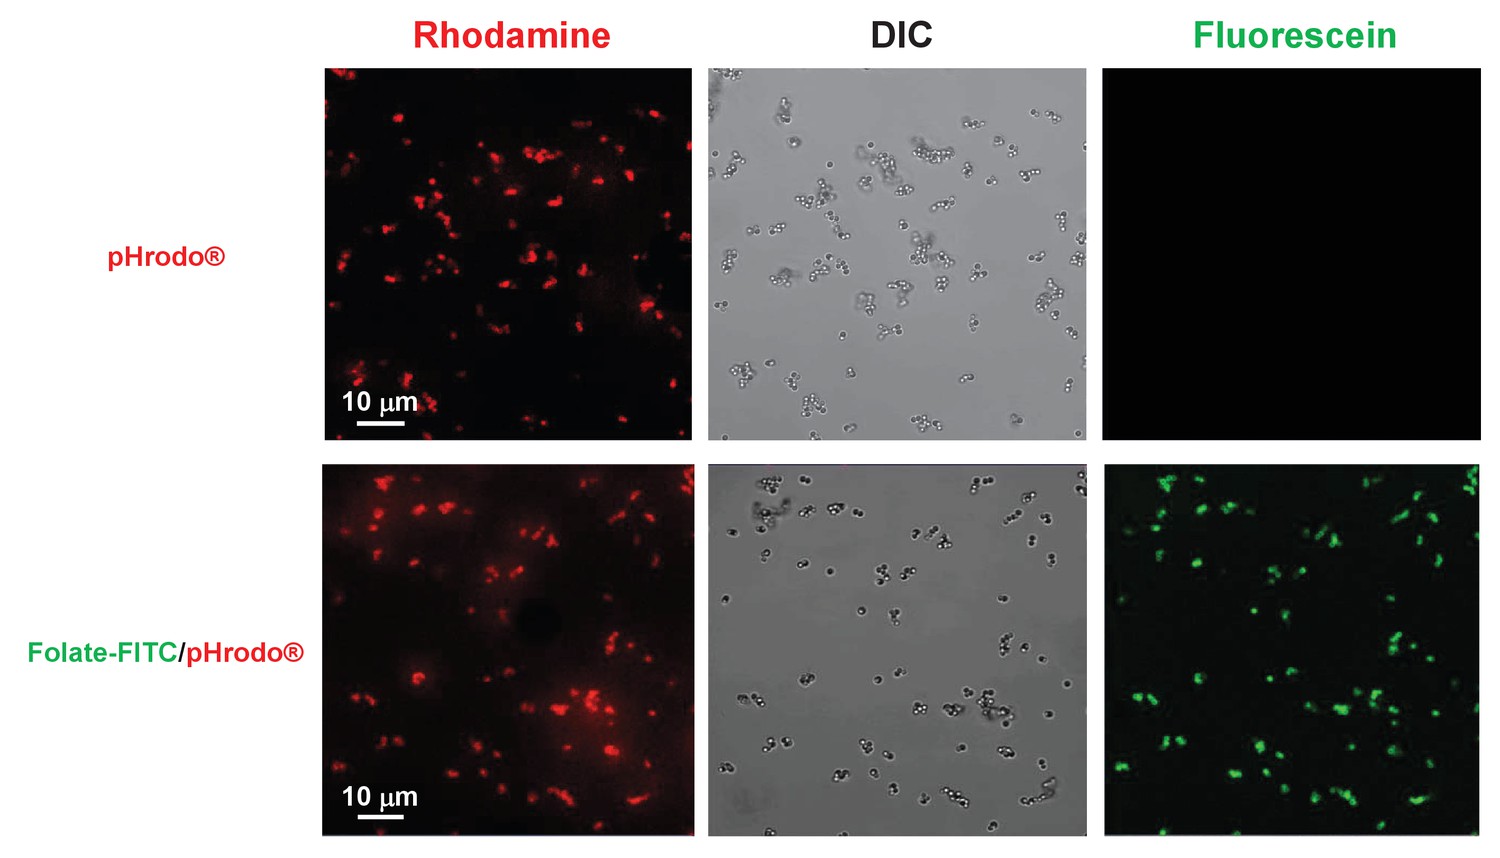
Co-localization of pHrodo and Folate-FITC labels to all latex beads.
1 μM latex beads were complexed with pHrodo and confocal imaged for DIC and rhodamine and fluorescein fluorescence. pHrodo-labelled latex beads were secondarily labelled with Folate-FITC and confocal imaged for DIC and rhodamine and fluorescein fluorescence.
Figure 9—figure supplement 2
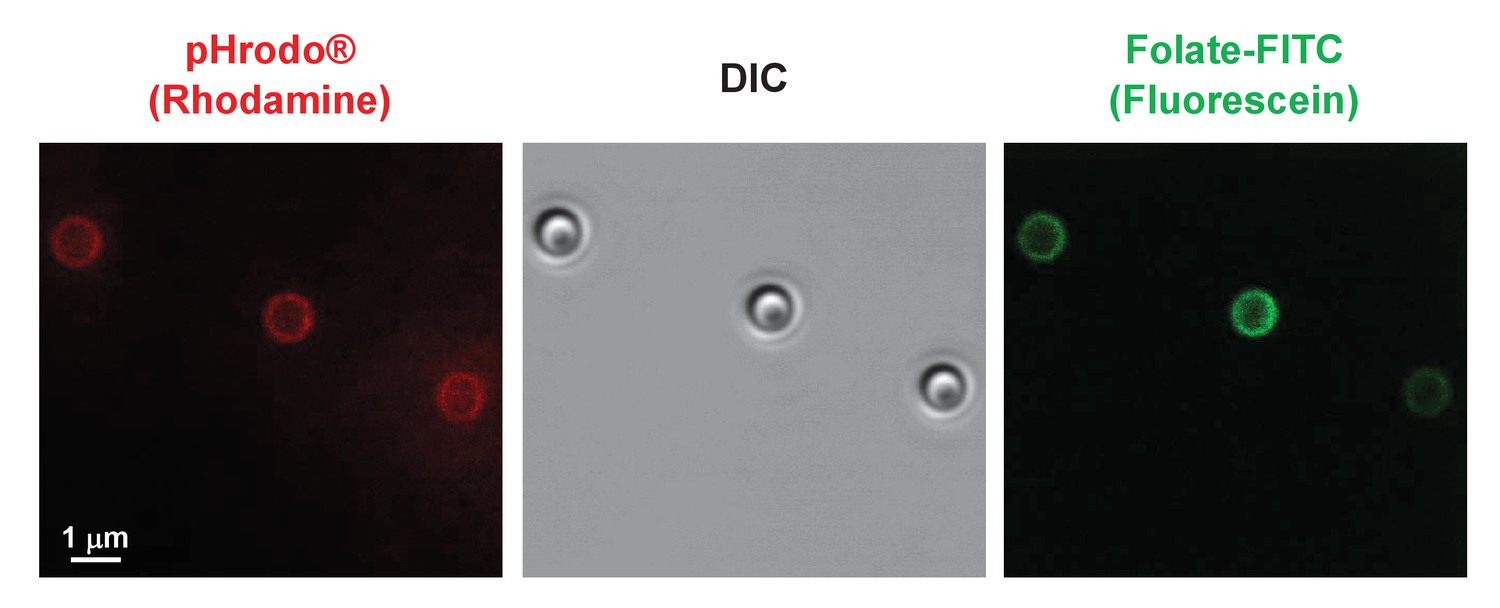
Co-localization of pHrodo and Folate-FITC labels to all latex beads.
Folate-FITC/pHrodo-labelled latex beads shown at high confocal image magnification for DIC and rhodamine and fluorescein fluorescence.
Videos
Video 1
Full 1.5 hr time-course of Dictyostelium migration through membrane pores toward a buffer control (see Figure 1A).
https://doi.org/10.7554/eLife.24627.004
Video 2
Full 1.5 hr time-course of Dictyostelium migration through membrane pores toward 500 nM folate (see Figure 1A).
https://doi.org/10.7554/eLife.24627.005Download links
A two-part list of links to download the article, or parts of the article, in various formats.
Downloads (link to download the article as PDF)
Open citations (links to open the citations from this article in various online reference manager services)
Cite this article (links to download the citations from this article in formats compatible with various reference manager tools)
Chemotactic network responses to live bacteria show independence of phagocytosis from chemoreceptor sensing
eLife 6:e24627.
https://doi.org/10.7554/eLife.24627


