A selectivity filter at the intracellular end of the acid-sensing ion channel pore
- University of Copenhagen, Denmark
- RMIT University, Australia
Figures
Figure 1 with 1 supplement
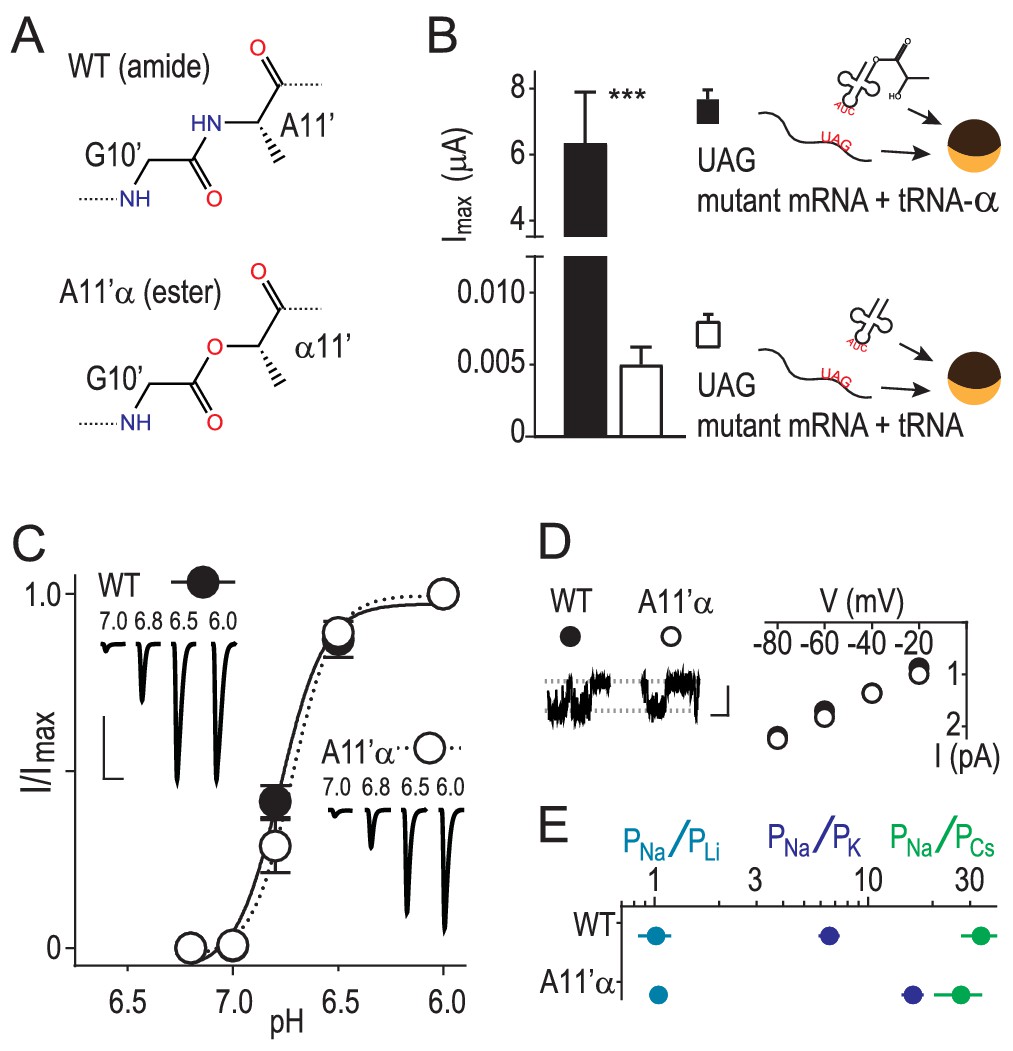
Amide-ester substitution to probe contribution of G10’ to Na+ conduction.
(A) A11’α substitution. (B) Successful incorporation of lactic acid (‘α') into position A11’, indicated by large proton-gated currents (pH 6.0) at oocytes injected with A11’UAG mRNA and tRNA-α (Mean ± SEM, n = 6) but not with A11’UAG mRNA and tRNA without α (n = 7). ***p=0.001 (Student’s t-test). (C) A11’α channels (pH50 = 6.7 ± 0.03, n = 5) respond to increasing proton concentrations much like WT channels (pH50 = 6.8 ± 0.02, n = 4; p=0.07, unpaired t-test). (D) Single channel Na+ currents (scale bars: x, 50 ms; y, 2 pA) and mean current amplitude at different voltages (± SEM, n = 5–8). (E) Relative permeability ratios at WT and A11’α channels (mean ± SEM, n = 4–9; see Figure 1—figure supplement 1.).
Figure 1—figure supplement 1
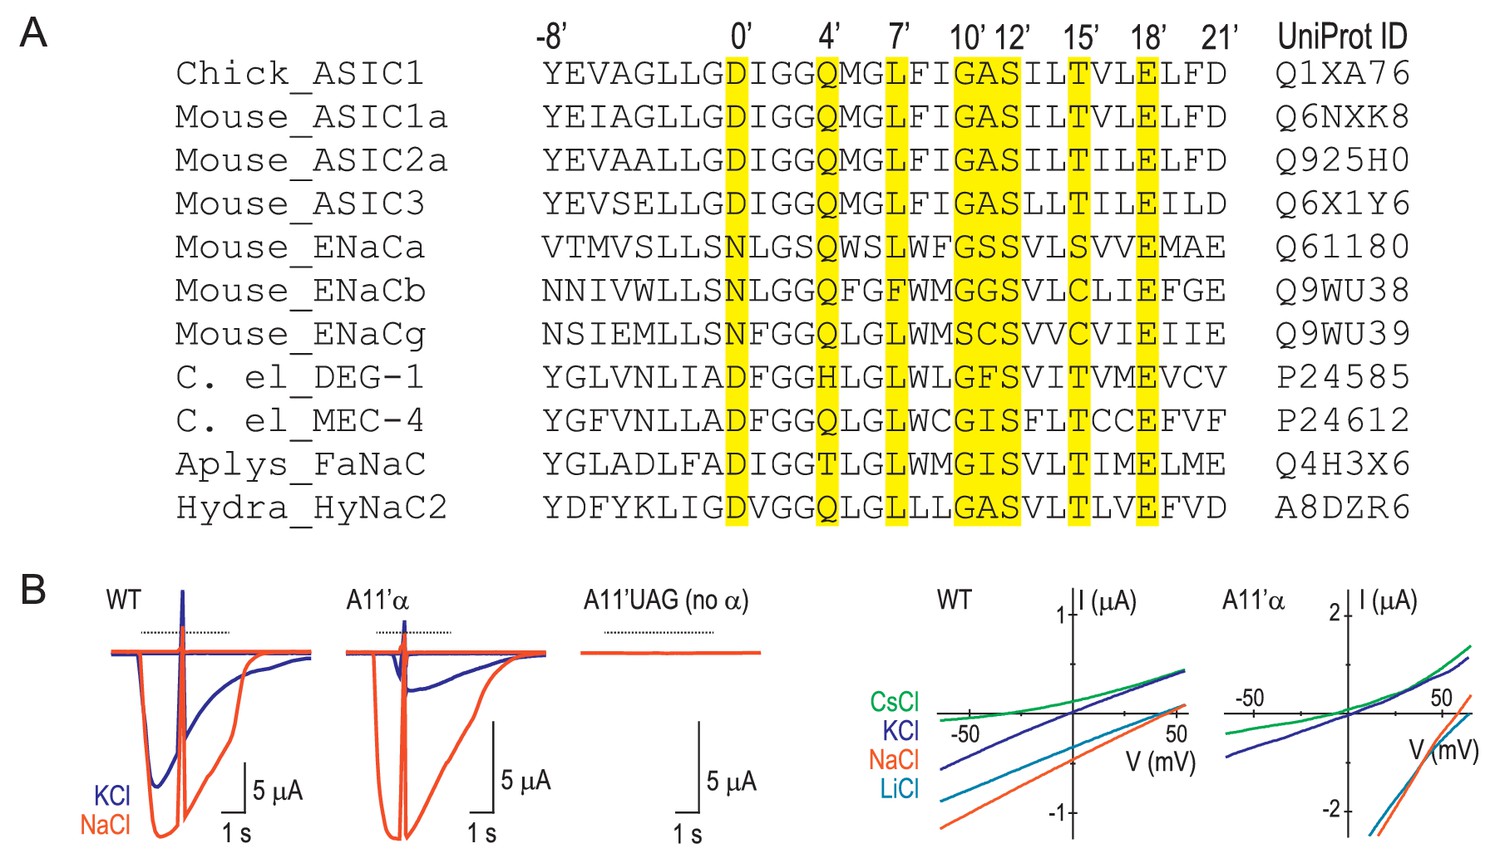
Numbering scheme for M2 residues.
(A) Referring to molecular determinants of function in the ENaC/DEG family with amino acid numbers of various channels makes comparisons confusing. E.g. it is not immediately clear that ENaC α subunit (species not reported) S589 (Waldmann et al., 1995) and rat ENaC (rENaC) α subunit S589 (Kellenberger et al., 1999a) mutations, both of which alter ion selectivity in those studies, actually refer to adjacent positions (GSS and GSS, respectively). Similarly, it is not immediately clear that A443 in mouse ASIC1a (mASIC1a) (Carattino and Della Vecchia, 2012), A444 in human ASIC1a (hASIC1a) (Yang et al., 2009) and G530 in rENaC β, (Kellenberger et al., 1999b) each of which determine ion permeability to some extent, actually occupy the equivalent position. To avoid such confusion, we have adopted a new numbering system, based on various functional data, recent structural data and the comparison of a diverse range of subunits from the family (similar to the numbering systems for pore-lining residues in Cys-loop receptors or S4 charges in voltage-gated ion channels). According to this analysis, the equivalent residues, D434 that contributes to ion permeation in hASIC1a (Yang and Palmer, 2014), D433 whose side chain is oriented into the top of the channel pore of chick ASIC1 (Baconguis et al., 2014), and D431 that contributes to Ca2+ permeability in HyNaC2 (Dürrnagel et al., 2012), are simply referred to as D0’. mASIC1a A443, hASIC1a A444 and rENaC β G530 (described above), are equivalent and now referred to as A11’, A11’ and G11’, respectively. The amino acid sequence alignment (Edgar, 2004) in (A) details the prime numbering system. Yellow highlighting indicates residues whose mutation is reported to alter channel function in at least two family members, as follows. 0’: lamprey ASIC1 D433N alters gating (Li et al., 2011a); hASIC1a D434N decreases ion conduction (Yang and Palmer, 2014); hydra HyNaC D431C decreases Ca2+ permeability (Dürrnagel et al., 2012). 4’: lamprey ASIC1 Q437C is water-accessible (Li et al., 2011b); chick ASIC1 Q437A slows desensitization (Baconguis et al., 2014). 7’: hASIC1a L440A decreases Na+/K+ selectivity (Yang et al., 2009); lamprey ASIC1 L440C is water-accessible (Li et al., 2011b); mASIC1a L439A decreases Na+/K+ selectivity (present study). 10’: rENaC β G529S decreases Na+/K+ selectivity (Kellenberger et al., 1999b); mENaC α G587C decreases Na+/K+ selectivity (Sheng et al., 2000). 11’: ENaC α S589I alters gating and Na+ conduction (species not reported [Waldmann et al., 1995]); hASIC1a A444G decreases Na+/K+ selectivity (Yang et al., 2009). 12’: C. elegans MEC-4 S455F decreases function (Hong and Driscoll, 1994); rENaC α S589C/D decreases Na+/K+ selectivity (Kellenberger et al., 1999a). 15’: C. elegans MEC-4 T458I decreases function (Waldmann et al., 1995); ENaC α S593I alters gating (species not reported (Waldmann et al., 1995); mASIC1a T447V prevents functional expression (Figure 4—figure supplement 1). 18’: C. elegans MEC-4 E461K decreases function (Hong and Driscoll, 1994); mENaC α E595C decreases Na+/K+ selectivity (Sheng et al., 2001); mASIC1a E450D/Q decreases Na+/K+ selectivity (present study). (B) Left, voltage ramps at rest and during activation of currents by pH 6.0 (dashed line) in different extracellular cations (indicated by color) at oocytes injected with WT mRNA, A11’UAG mRNA + tRNA-α, or A11’UAG mRNA + tRNA (the latter as a measure of non-specific incorporation). Right, current-voltage relationships of proton-gated current, where ramp during rest has been subtracted.
Figure 2 with 2 supplements
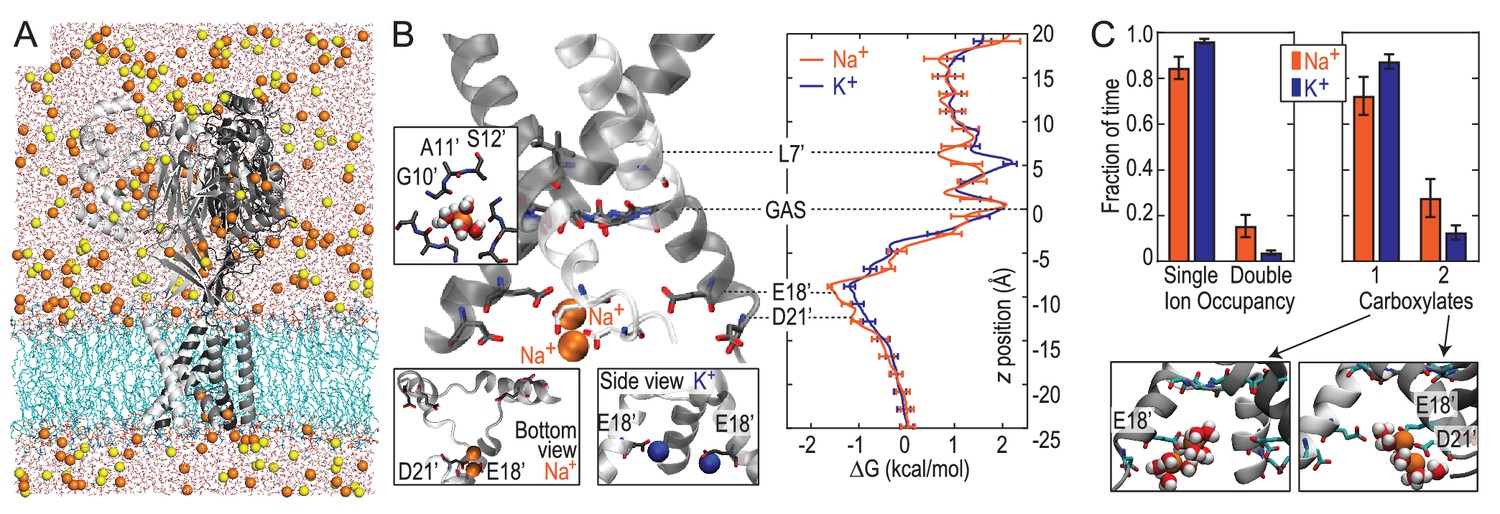
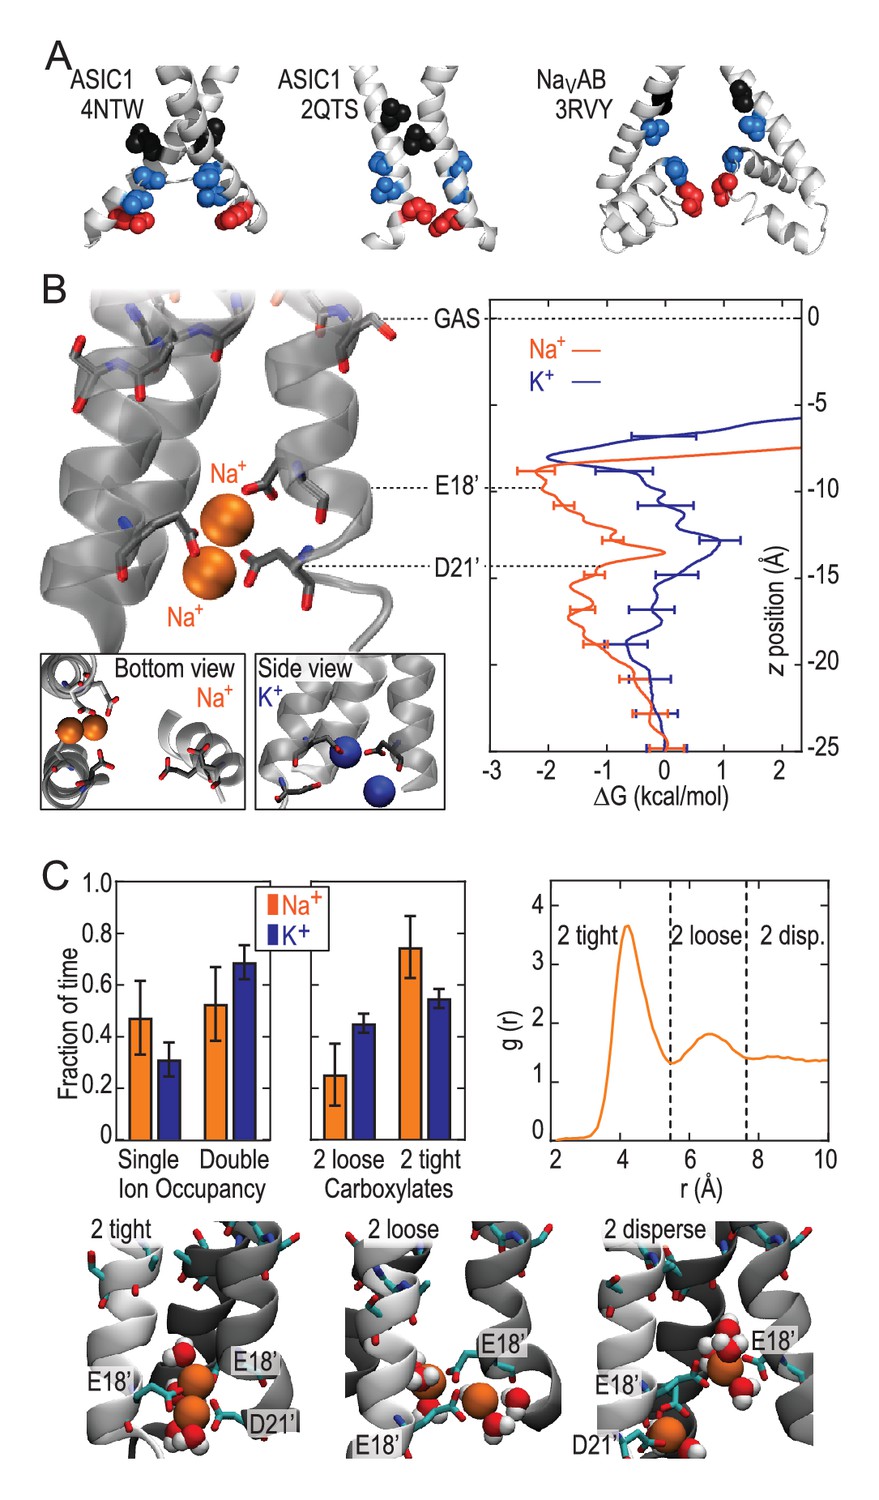
Free energy simulations with PDB:4NTW.
(A) MD simulation system for PDB:4NTW (gray) embedded in a lipid bilayer (cyan) in NaCl solution (water, red and white sticks; Na+ and Cl-, orange and yellow balls). (B) Snapshots from simulation (left) and single ion-free energy profiles (right) for Na+ or K+ permeating the chick ASIC1 pore. See Figure 2—figure supplement 1 for convergence analysis. Insets show hydrated Na+ in the GAS belt (left) and two Na+ ions or K+ ions at the level of E18’ and D21’ (lower). (C) Distribution of ion occupancies in sites formed by E18’ and D21’ in 4NTW. Single ion occupancy is favored for Na+ and K+, but double ion occupancy occurs more frequently for Na+ (left graph). For the doubly occupied site (right graph), binding to E18’ dominates (‘1 carboxylate’), but with increased probability of tight binding to both E18’ and D21’ (‘2 carboxylates’) for Na+. Insets: representative double Na+ ion complexes.
Figure 2—figure supplement 1
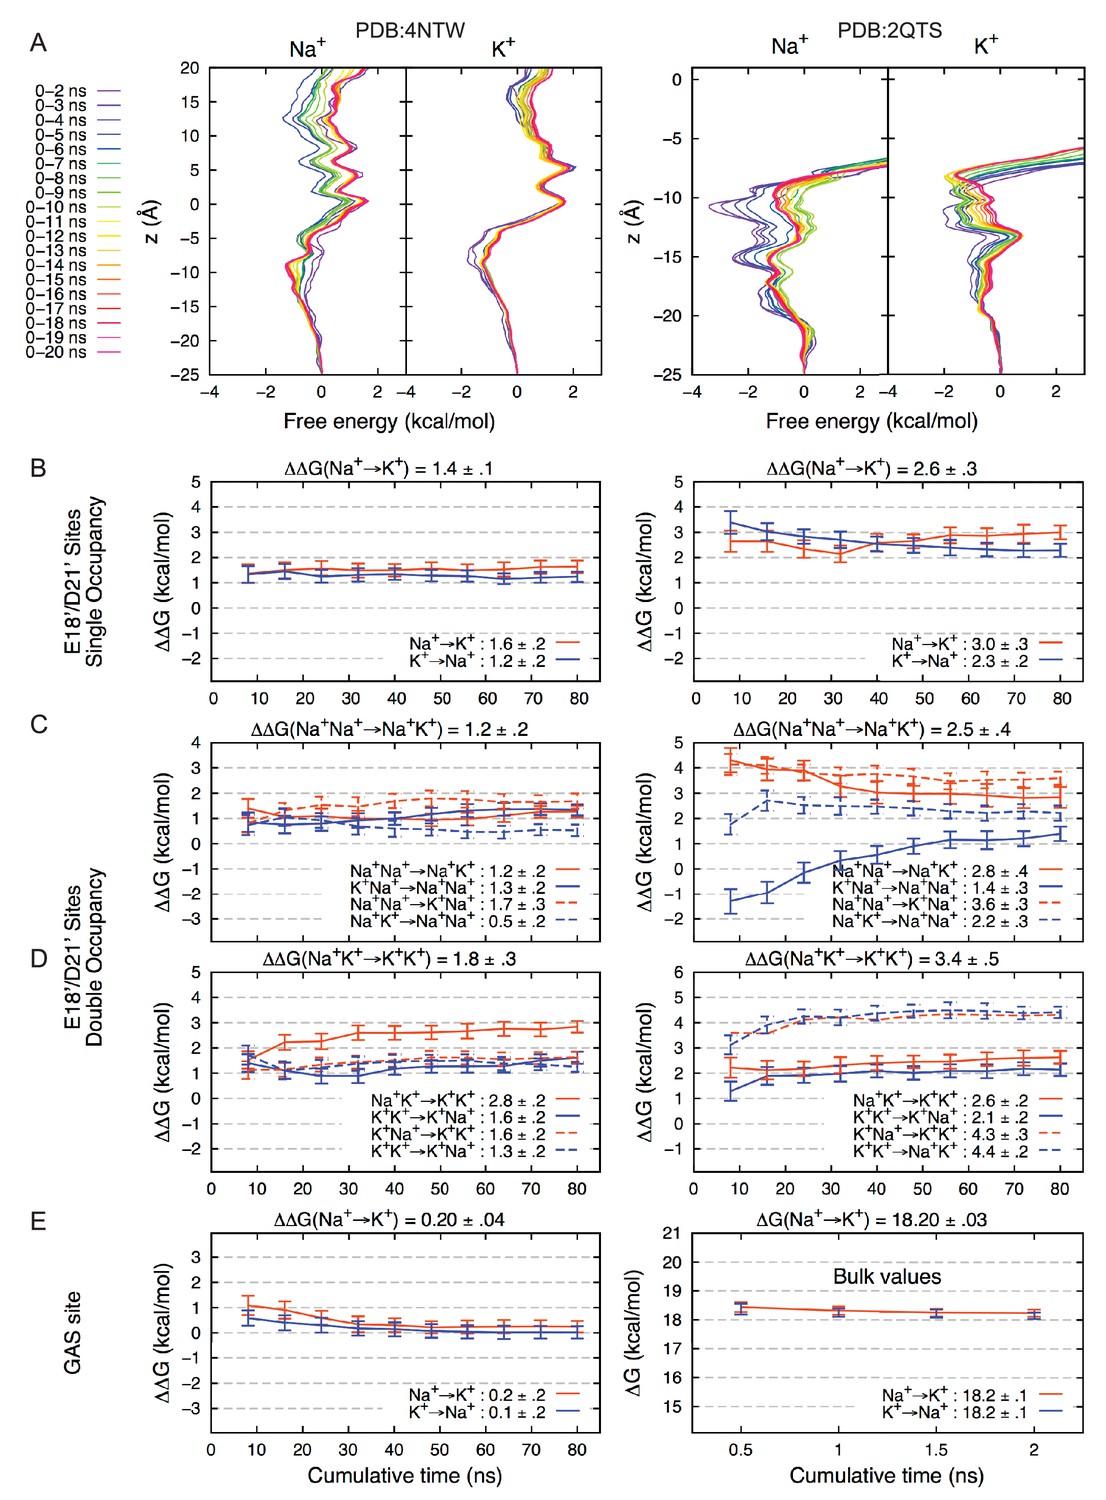
Convergence of Free Energy Calculations.
(A) Convergence of Umbrella Sampling free energy profiles for PDBs 4NTW (left graphs) and 2QTS (right graphs). Convergence to within 1 kcal/mol was achieved within 6 ns for Na+ and 3 ns for K+.(4NTW), and 6 ns for Na+ and 7 ns for K+ (2QTS). Convergence of lateral sampling of ions was observed in the channel (not shown). (B) FEP binding free energy difference △△G for Na+→K+ (with results for K+→Na+ negated) for the site formed by E18’/D21’ occupied by a single ion in 4NTW (left) and 2QTS (right). Results for transformations Na+Na+→ Na+K+ are shown in (C), while transformations Na+ K+ → K+ K+ are shown in (D). Mean values from independent transformations are shown above each panel, with values for complete transformation Na+Na+→ K+K+ being the sum of individual transformations Na+Na+→K+Na+ and Na+K+→K+K+: 3.0 ± 0.4 for 4NTW and 5.9 ± 0.6 for 4NTW. 2QTS displays higher selectivity due to increased involvement of carboxylates in the narrower pore. Results for the 4NTW GAS site (E; left), reveal near-zero preference for Na+, with bulk values on the right, in agreement with experiment (18.2 kcal/mol). (Friedman and Krishnan, 1973a).
Figure 2—figure supplement 2
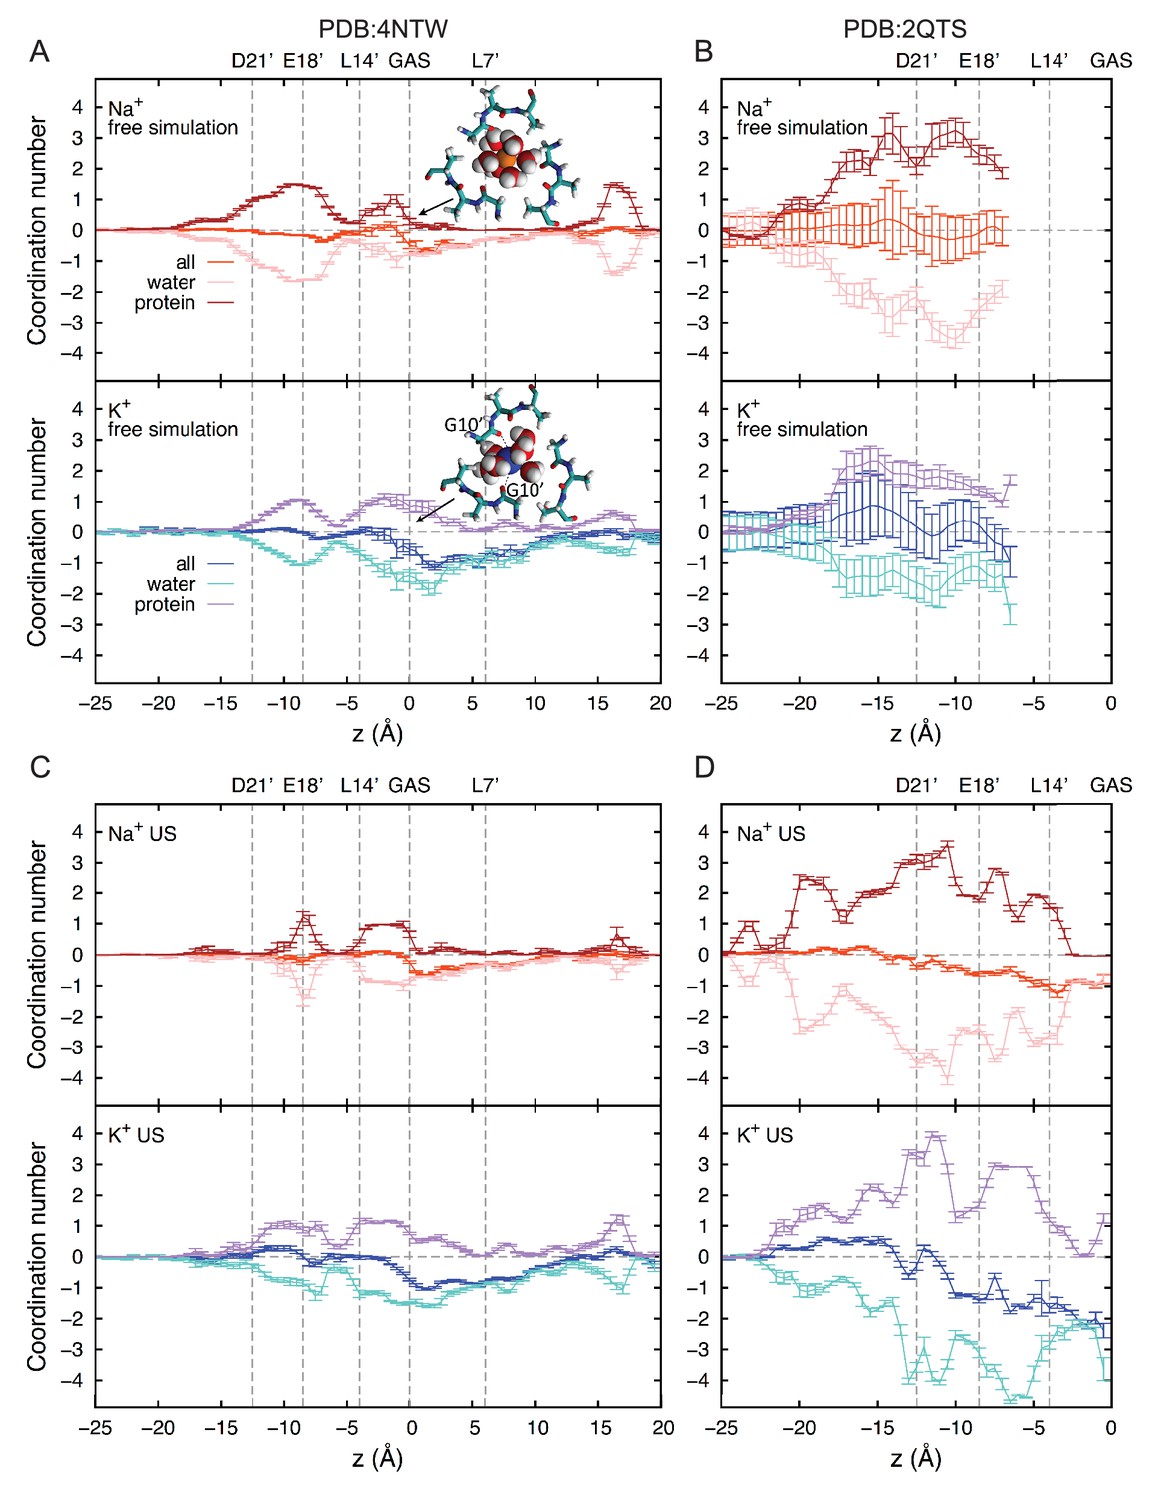
Ion coordination analysis.
First shell coordination of Na+ and K+ by oxygen atoms from water and protein (backbone and side chains) in the ASIC pore; offset relative to bulk coordination numbers for clarity (5.8 and 7.0 for Na+ and K+, respectively). Positions of key residues are indicated with gray dashed lines. Based on the positions of the first minima in the radial distribution functions of oxygen atoms, cutoffs of 3.2 and 3.6 Å were applied to Na+ and K+, respectively. (A) Free simulation of 4NTW. (B) Free simulation of 2QTS. (C) Umbrella sampling simulations for 4NTW, generally consistent with free simulations in (A). (D) Umbrella sampling simulations of 2QTS, consistent with results in (B).
Figure 3
Free energy profiles from Umbrella Sampling of PDB:2QTS.
(A) ASIC PDBs compared with voltage-gated Na+ channel NavAb (PDB:3RVY). Two opposing helices shown, with NavAb inverted for comparison. Selected leucine/isoleucine (black), serine/threonine (blue) and glutamate (red) side chains shown as spheres. (B) Snapshot of E18’ and D21’ creating multiple ion/carboxylate complex (left) and single ion free energy profiles (right) for Na+ and K+ in the lower pore of the presumed closed conformation PDB:2QTS (see Figure 2—figure supplement 1 for convergence). (C) Distribution of single and double ion occupancy in 2QTS. Double ion occupancy dominates, usually involving multiple side chains. In this case, states are defined by the radial distribution function g(r) for ion-ion distance (right), revealing: two ions in a tightly shared complex with multiple carboxylates (2 tight); a two ion complex involving neighboring carboxylates that do not share single ions (2 loose); and the remainder involving ion binding to distant groups on opposing subunits (2 disperse). Snapshots below illustrate each configuration.
Figure 4 with 2 supplements
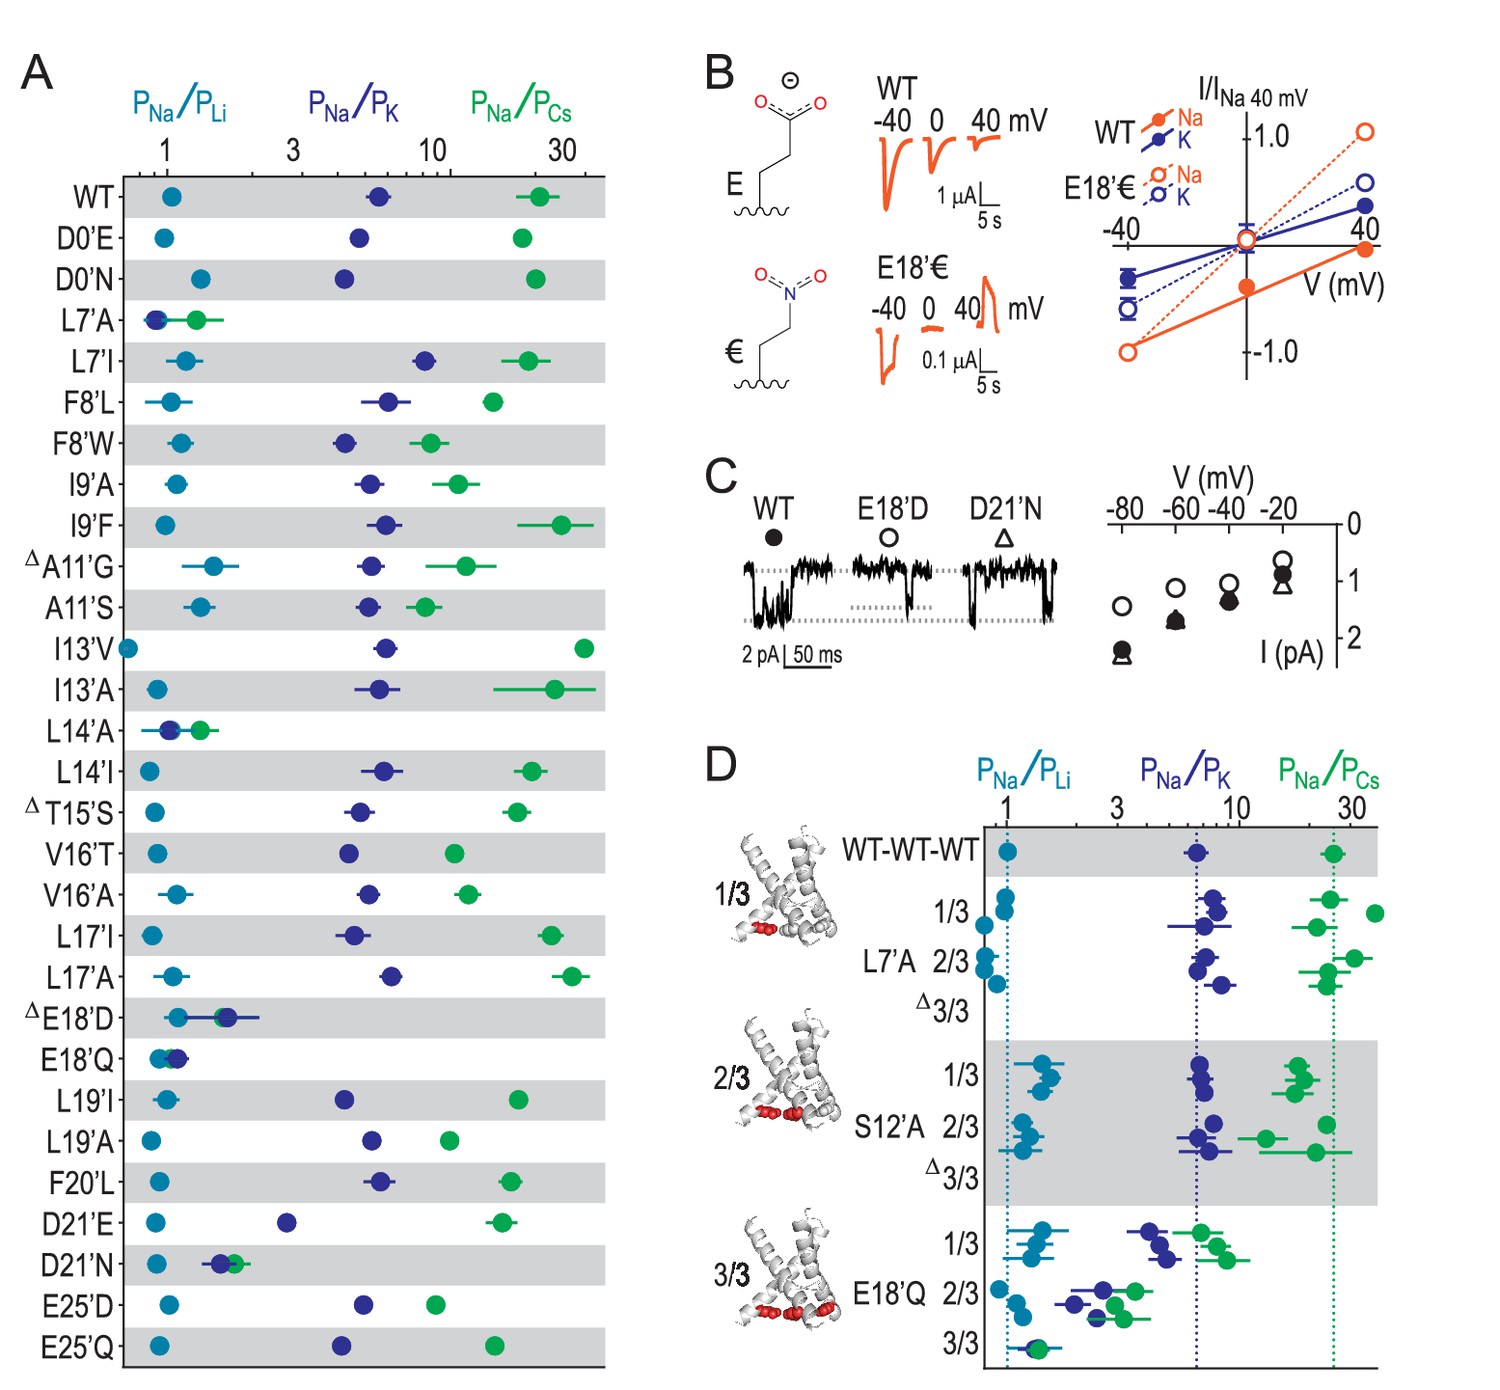
E18’ plays a direct role in selective Na+ conduction.
(A) Relative permeability ratios for WT and mutant ASIC1a channels (mean ± SEM; n = 3–6). Δ: G10’A/S, A11’V/F, S12’G/A/C/T, T15’V and E18’A channels were non-functional (see Figure 4—figure supplement 1). (B) E18’ and €18’ side chains, proton-gated currents (pH 6.0) in extracellular NaCl, and current-voltage relationship in extracellular NaCl (orange) or KCl (blue; mean ± SEM, n = 3–4). Specific € incorporation illustrated in Figure 4—figure supplement 1. (C) Example and mean (± SEM, n = 5–6) single channel Na+ currents. (D) Relative permeability ratios for concatemeric channels carrying no mutations (WT-WT-WT) or one, two or three L7´A,S12’A or E18’Q mutations (mean ± SEM, n = 3–6). Δ: Concatemeric channels containing three L7’A- and three S12’A-mutated subunits non-functional (see Figure 4—figure supplement 2).
Figure 4—figure supplement 1
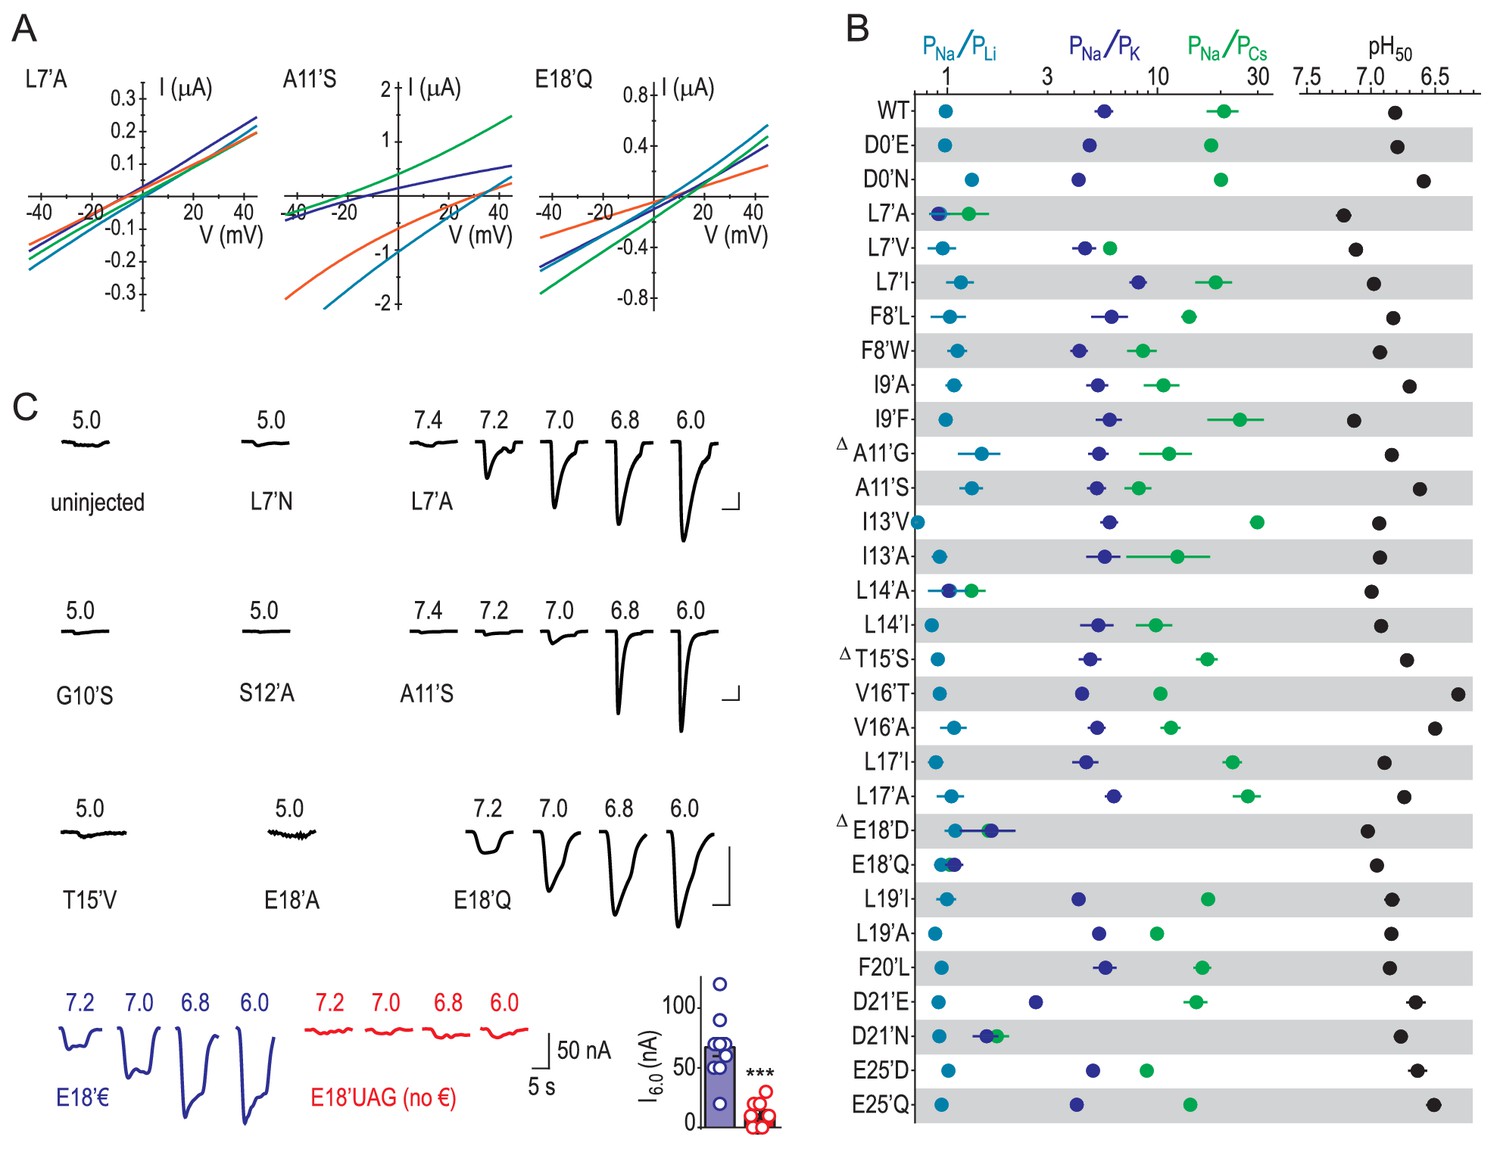
Experimental identification of determinants of ion selectivity.
(A) Example recordings of proton-gated current during voltage ramps in extracellular NaCl (orange), KCl (blue), CsCl (green) or LiCl (teal) at oocytes expressing selected mutant ASIC1a mRNA. (B) Mean (± SEM, n = 4–9) relative permeability ratios calculated after experiments depicted in (A) and half-maximal effective proton concentration values (‘pH50’) from experiments depicted in (C). Δ: At oocytes injected with G10’A/S, A11’V/F, S12’G/A/C/T, T15’V and E18’A mRNA, pH 5.0 elicited currents no greater than at uninjected oocytes, as evident in (C). (C) Example recordings of current responses to increased proton concentrations at uninjected oocytes or oocytes expressing selected ASIC1a mutants (scale bars: x, 10 s; y, 1 μA, except for E18’€ and E18’UAG (no €) as indicated). ‘E18’€” describes oocytes injected with E18’UAG mRNA + tRNA-€. ‘E18’UAG (no €)” describes oocytes injected with E18’UAG mRNA + tRNA, which allows only for non-specific incorporation of endogenous amino acids to this position and thus serves as a control for specific incorporation. Graph shows mean pH 6.0-gated current amplitude for both groups (***p<0.001, Student’s t test).
Figure 4—figure supplement 2
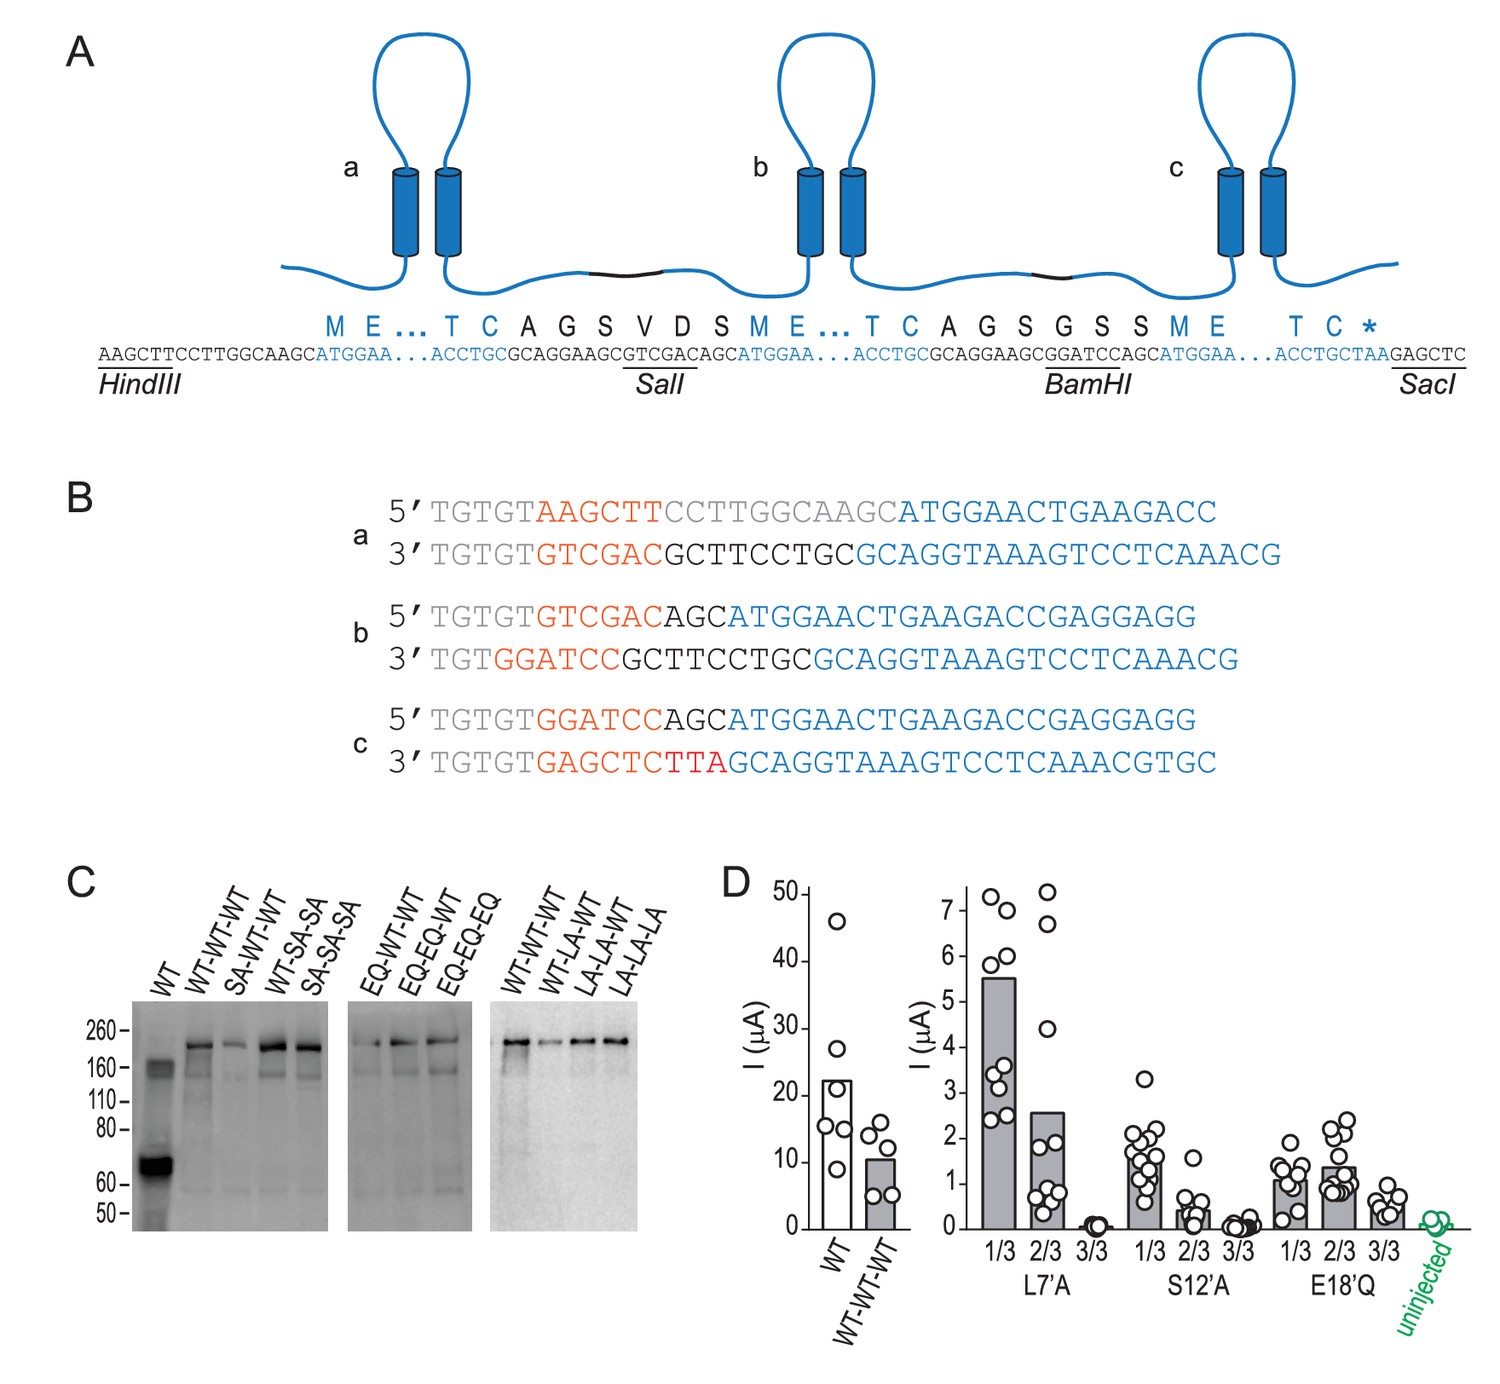
Design and biochemical validation of concatemeric ASICs.
(A) Cartoon illustrating three linked subunits, ‘a-c’ in a concatemeric channel. Lettering below shows nucleotide and protein sequence, containing: untranslated nucleotide sequence, restriction sites and peptide linkers (black); and ASIC1a sequence (blue). (B) Primer pairs used to generate fragments a-c for subsequent ligation into concatemeric constructs, including: nucleotide spacers and untranslated sequence (grey); restriction sites (orange); peptide linker (black); and ASIC1a sequence (blue). (C) Western blot, detecting ASIC1a amongst denatured total cell-surface protein from oocytes injected with indicated ASIC1a mRNAs. ‘WT’, regular ASIC1a; ‘WT-WT-WT’, concatenated wild-type subunits; ‘SA-WT-WT’, one of the three 1/3 S12’A concatemeric permutations tested (shown in Figure 4D), etc. The main band of protein from oocytes injected with regular ASIC1a mRNA is ~70 kDa, corresponding to single ASIC1a subunits. For protein from oocytes injected with concatemeric ASIC1a mRNA, the main band is ~210 kDa, corresponding to three covalently linked subunits in a concatemer. (D) Maximum current amplitude (‘I (μA)”) activated by pH 5.0 at oocytes injected with regular WT ASIC1a mRNA (‘WT’), concatemeric WT mRNA (‘WT-WT-WT’), concatemeric mutant mRNA, or nothing (‘uninjected’). Columns, mean current amplitude; circles, individual data points. Current amplitude at 3/3 L7’A-mutant and at 3/3 S12’A-mutant-injected oocytes was not discernable from uninjected oocyte.
Appendix 1—figure 1
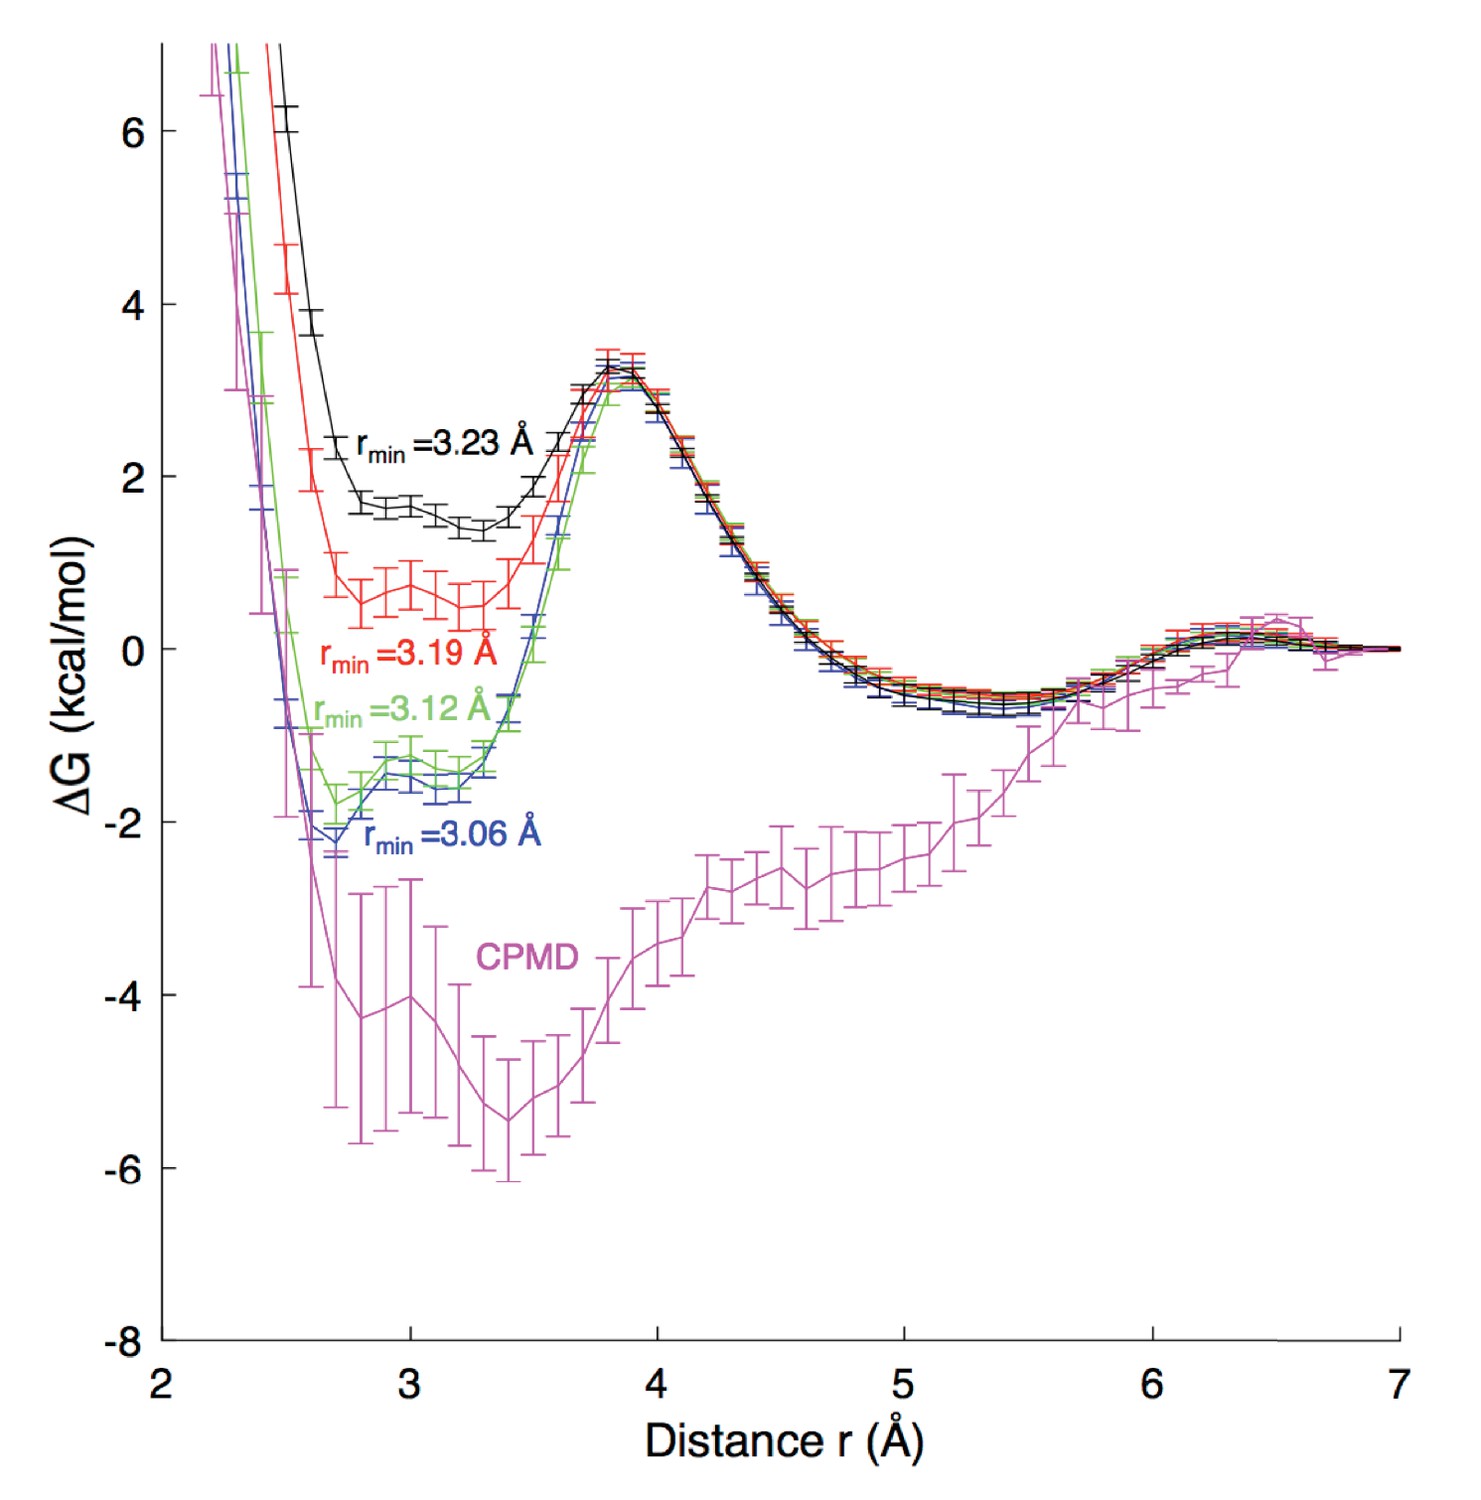
Free energy profiles for Na+ - carboxylate binding with different pair parameters, compared to CPMD quantum mechanical calculations.
Estimated dissociation constants (KD) for each MD model are: CHARMM27 (rmin = 3.06 Å) 0.6 ± 0.2 M; CHARMM27* (rmin = 3.12 Å) 0.9 ± 0.2 M, CHARMM27* NBFIX (rmin = 3.19 Å) 1.8 ± 0.2 M; and CHARMM27* NBFIX (rmin = 3.23 Å) 1.8 ± 0.3 M; to be compared with experimental values discussed in the Appendix.
Appendix 1—figure 2
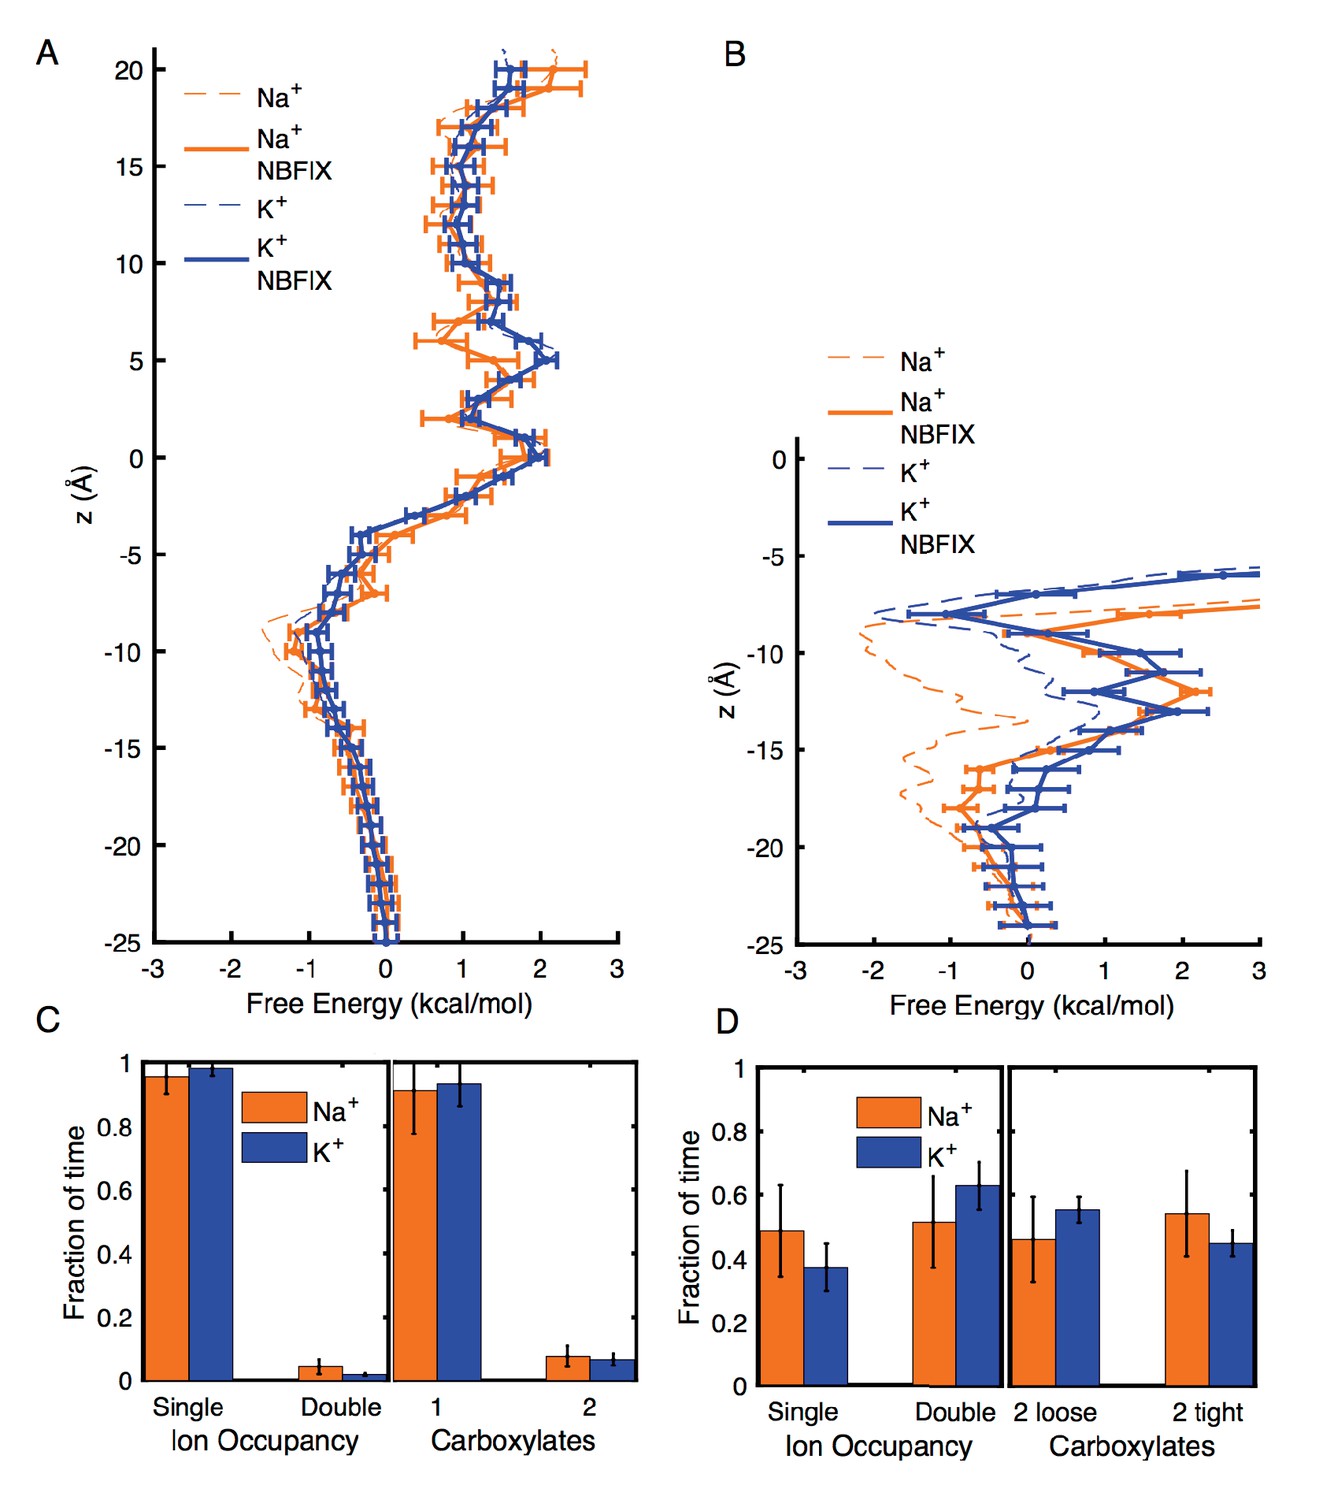
Estimates of free energy and coordination results for modified CHARMM27* NBFIX (Na+-carboxylate rmin = 3.19 Å and K+-carboxylate rmin = 3.52 Å), using post-simulation adjustment for the LJ parameter (see Appendix text).
(A) Umbrella Sampling for Na+ and K+ crossing the pore of 4NTW. A preference of ~0.5 kcal/mol for Na+ over K+ remains around E18’ and D21’ (B) Umbrella Sampling for Na+ and K+ crossing the pore of 2QTS. Na+ binding and preference of ~1 kcal/mol can be observed around D21’. Values deep in the channel (above −10 Å) are considered unreliable in this closed pore. (C) Adjusted analysis of ion occupancies for 4NTW. Double ion occupancies are reduced by these more repulsive ion parameters, but remain more common for Na+ than for K+, (D) Adjusted analysis of ion occupancies for 2QTS. Double ion occupancy is favoured both for Na+ and K+, but Na+ ions prefer tight clusters, as seen with the unmodified parameter.
Appendix 1—figure 3
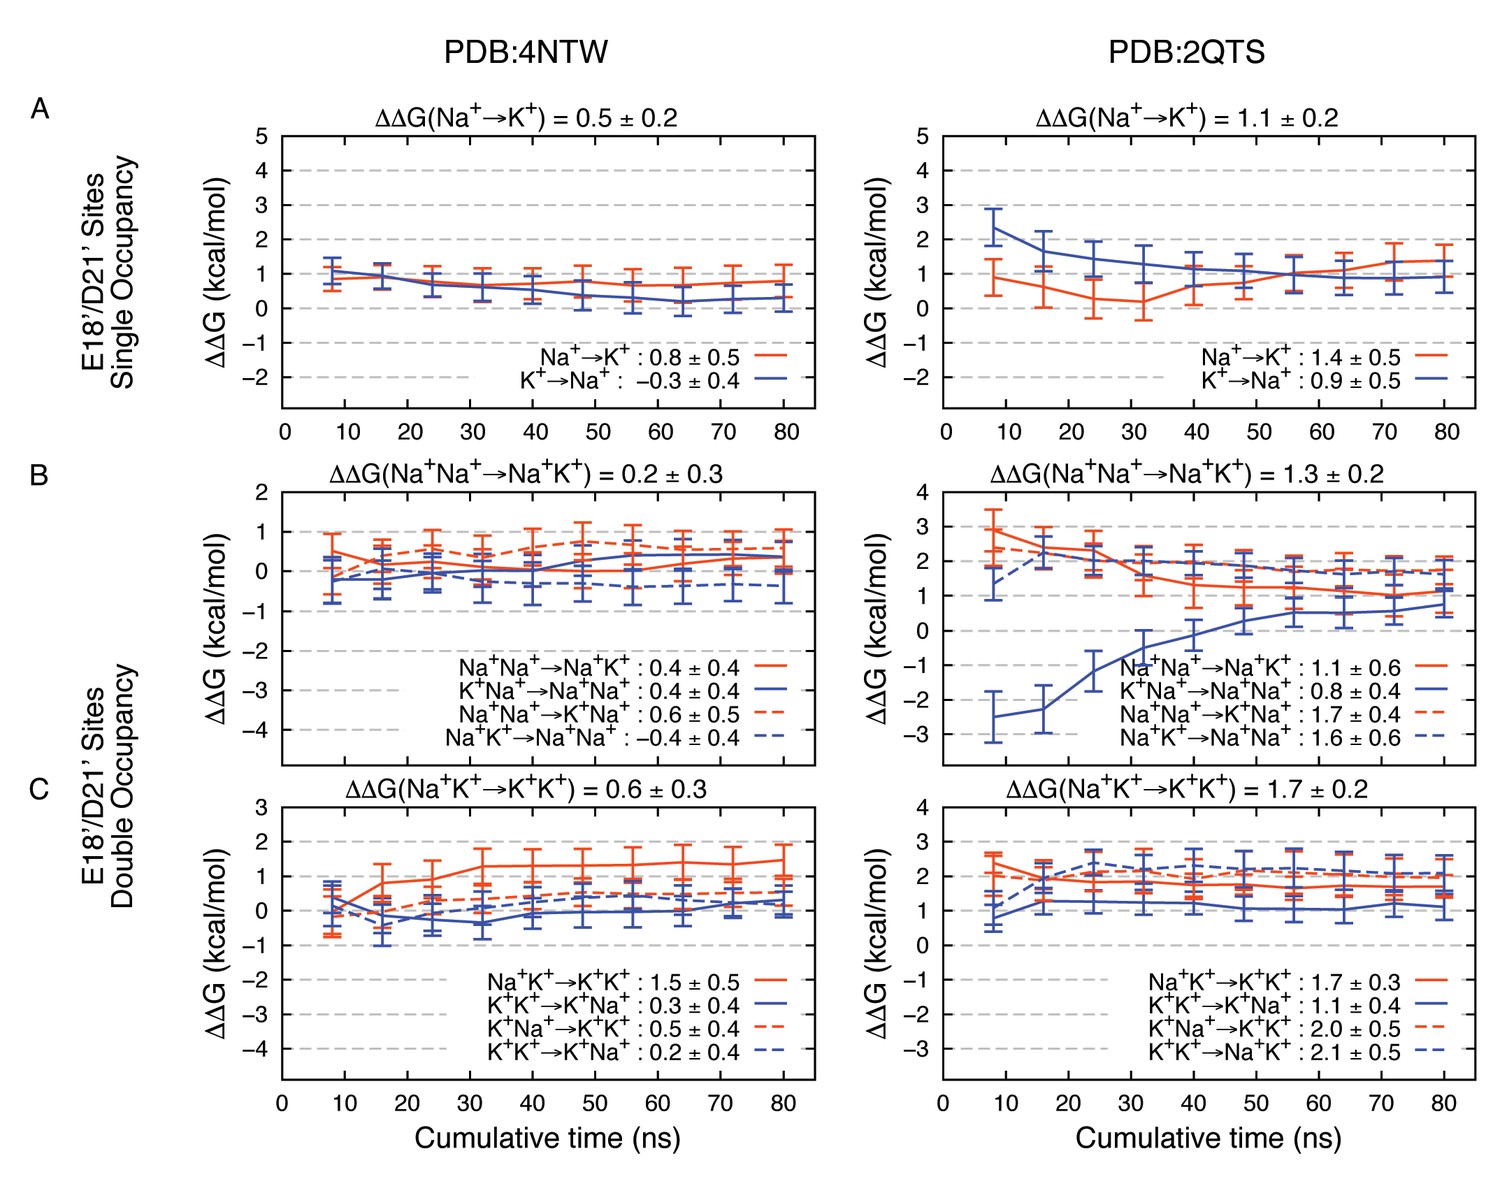
Estimated Na+→K+free energy perturbations for PDBs 4NTW (left graphs) and 2QTS (right graphs) with modified ion parameters.
Results in panels A, B and C are as in Figure 2—figure supplement 1B,C and D, respectively, but with change in ion-carboxylate parameters to that of Marinelli et al. (2014), with rmin = 3.19 Å for Na+ and rmin = 3.52 Å for K+, instead of the usual mixing rules for CHARMM27*.
Download links
A two-part list of links to download the article, or parts of the article, in various formats.
Downloads (link to download the article as PDF)
Open citations (links to open the citations from this article in various online reference manager services)
Cite this article (links to download the citations from this article in formats compatible with various reference manager tools)
A selectivity filter at the intracellular end of the acid-sensing ion channel pore
eLife 6:e24630.
https://doi.org/10.7554/eLife.24630


