Unfair competition governs the interaction of pCPI-17 with myosin phosphatase (PP1-MYPT1)
- Cornell University, United States
- Sidney Kimmel Medical College at Thomas Jefferson University, United States
Figures
Figure 1

Models for MLCP reactivation.
(A) A simplistic model in which pCPI-17 is dephosphorylated only by other phosphatases (PPU) immediately after it dissociates from MLCP. The rate-limiting step for MLCP reactivation is the dissociation, whose rate is koff. (B) A more realistic scenario in which pCPI-17 freed by dissociation can rebind to free MLCP, and in which pCPI-17 is in an equilibrium with unphosphorylated CPI-17 that depends on the relative activities of the kinases (PKC) and phosphatases (PPU) involved. The rate of MLCP inactivation must necessarily be slower than that in (A). (C) Unfair competition. pCPI-17 is removed from MLCP by dephosphorylation as well as by dissociation. Free pCPI-17 and unphosphorylated CPI-17 are in an equilibrium determined by the relative activities of the kinases (PKC) and phosphatases (MLCP and PPU) involved. When the concentration of pCPI-17 is less than or equal to the concentration of MLCP, the very low Km ensures that almost all pCPI-17 dephosphorylation is accomplished by MLCP.
Figure 2 with 1 supplement
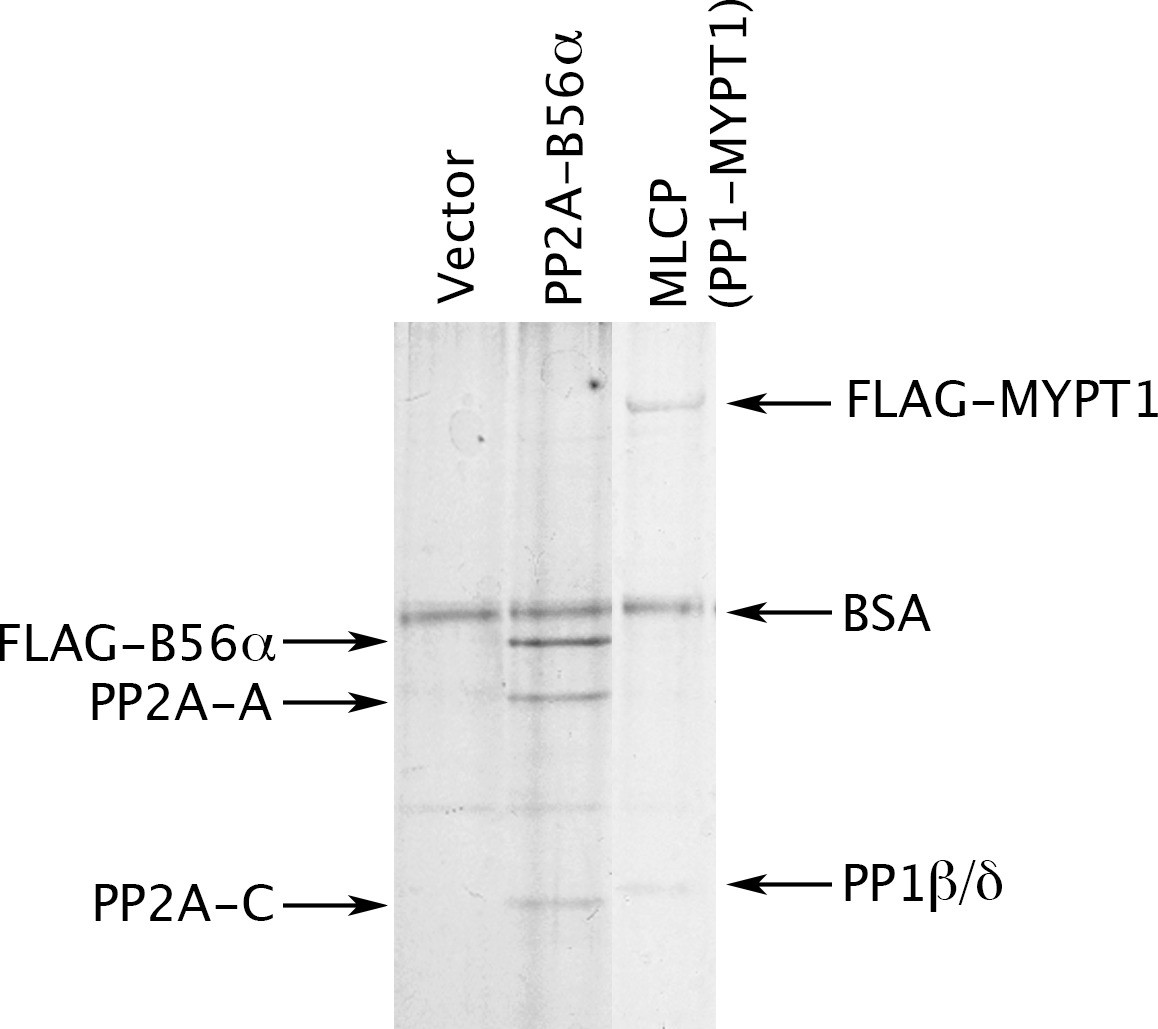
Preparation of MLCP.
HEK-293 CRL-1573 cells were transformed with empty vector, with a construct overexpressing a FLAG-tagged version of the B56α regulatory subunit of PP2A for comparison, or with a construct overexpressing FLAG-MYPT1. Phosphatase holoenzymes were then purified as previously described (Adams and Wadzinski, 2007; Williams et al., 2014) and stabilized by the addition of bovine serum albumin (BSA). The myosin phosphatase holoenzyme in the third lane has both FLAG-MYPT1 and PP1β/δ in roughly equal stoichiometry; the identity of these proteins was verified by Western blotting with anti-FLAG and with antibodies specifically directed against the α, β/δ, and γ isoforms of the PP1 catalytic subunit (data not shown).
Figure 2—figure supplement 1
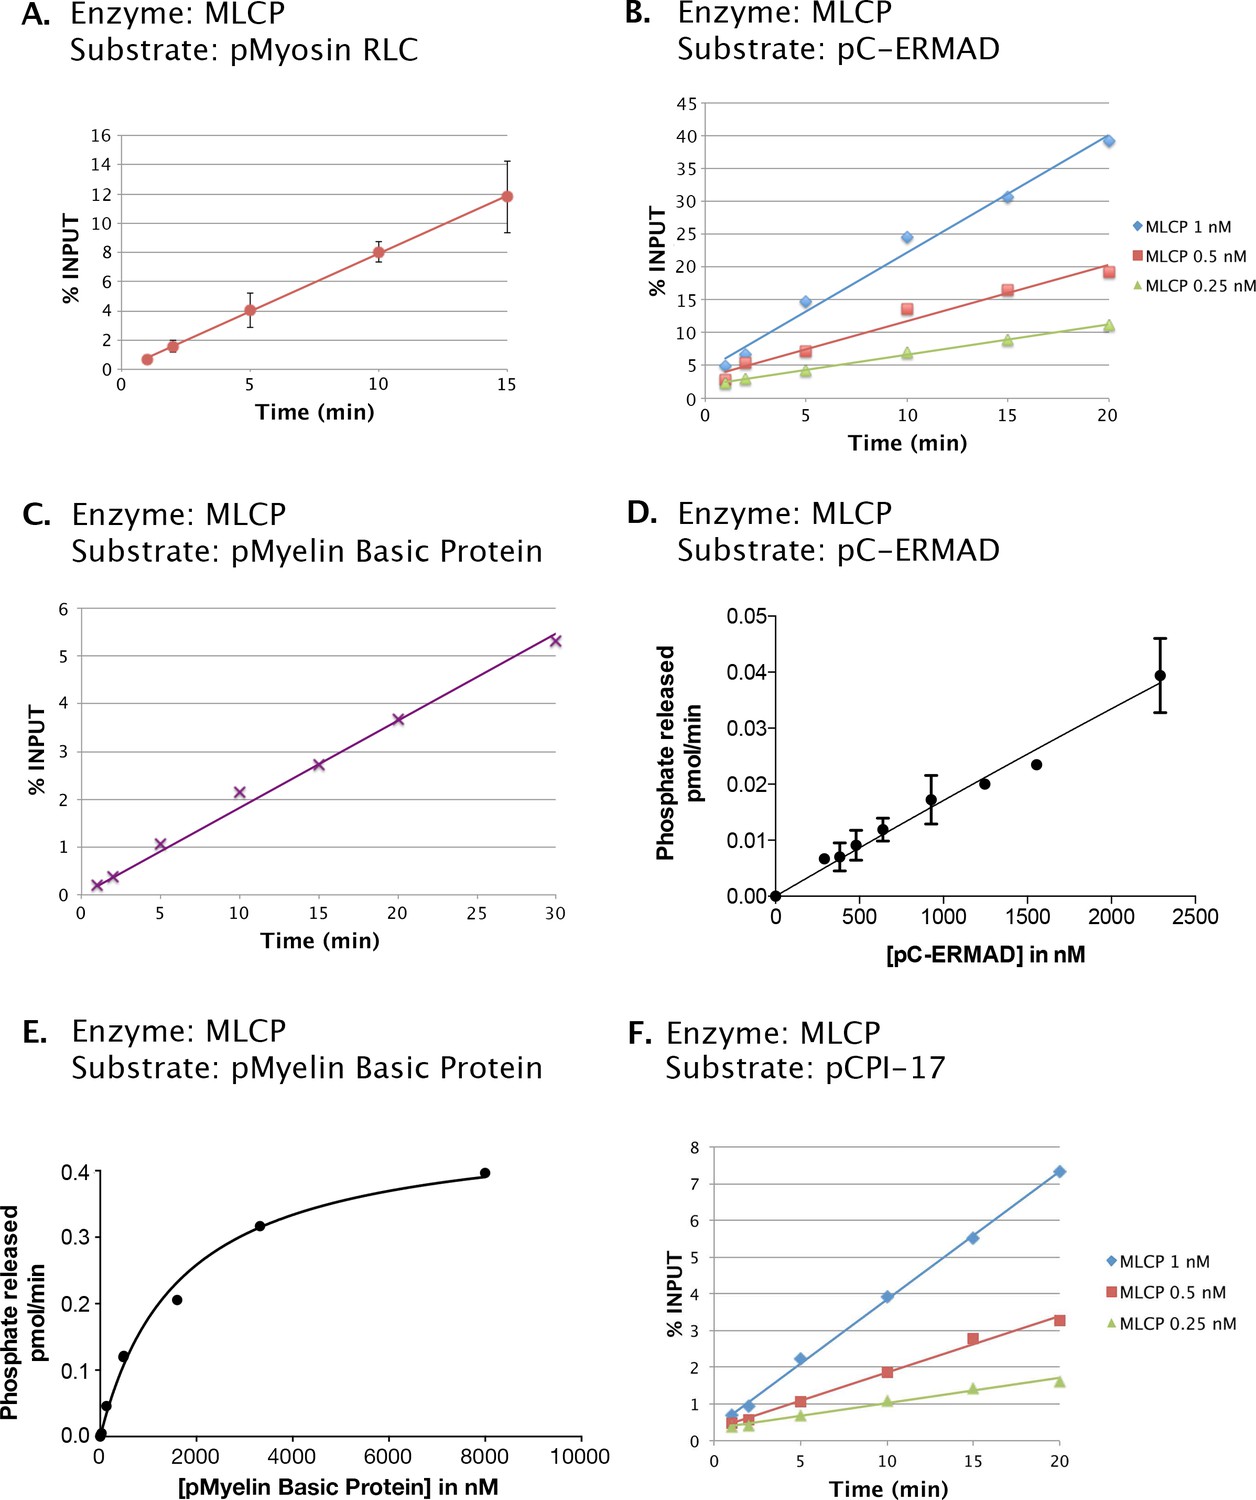
Phosphatase activities of the MLCP preparation shown in Figure 2.
Enzyme assays as described in Materials and methods were performed at 30°C with the following components in 6 μL reactions unless otherwise noted: (A) 0.5 μM myosin regulatory light chain phosphorylated by myosin kinase (pMyosin RLC) and 0.5 nM MLCP. (B) 1 μM C-ERMAD phosphorylated by LOK (pC-ERMAD) and MLCP at the concentrations shown. (C) 0.7 μM Myelin Basic Protein phosphorylated with PKA (pMyelin Basic Protein) and 0.5 nM MLCP. (D) pC-ERMAD at the amounts indicated and 0.25 nM MLCP. (E) pMyelin Basic Protein at the amounts indicated and 1.67 nM MLCP, in a volume of 30 μL. (F) 1.6 μM CPI-17 phosphorylated with PKCδ (pCPI-17) and MLCP at the concentrations shown. In (A), (C), and (D), data points represent the average and standard deviation of three trials; in (B), (E), and (F) each point corresponds to a single trial. The results of (A), (B), (C), and (F) show that all assays described in the remainder of this report were conducted in the linear range. The near linearity of the velocity versus substrate concentration curve in (D) indicates that the Km for the dephosphorylation of pC-ERMAD by MLCP must be considerably in excess of 2.5 μM, the highest concentration of pC-ERMAD achieved.
Figure 3 with 1 supplement
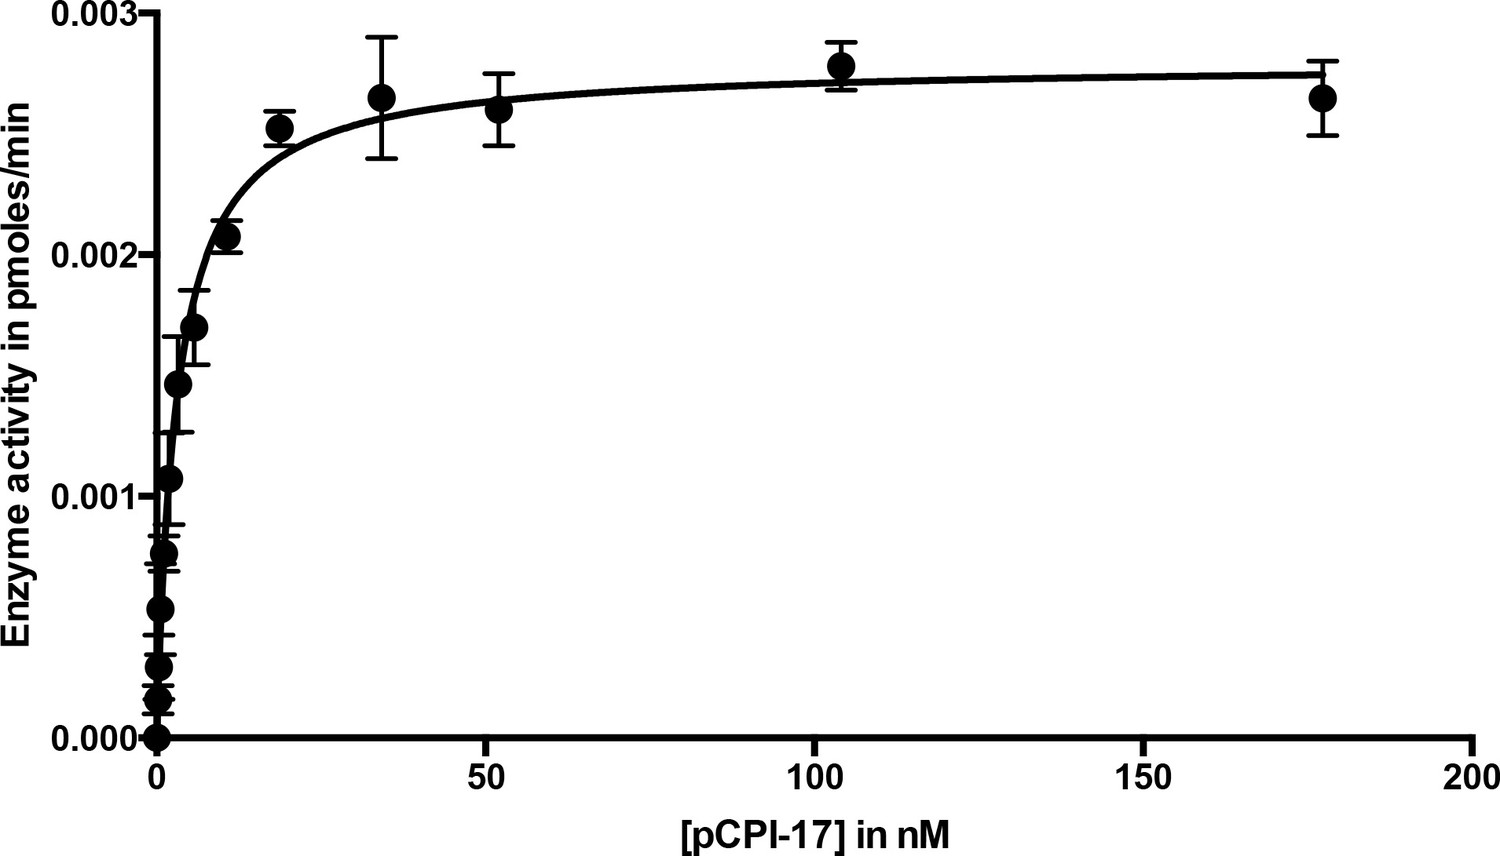
Dephosphorylation of pCPI-17 by MLCP as a function of pCPI-17 concentration.
All assays contained 0.1 nM MLCP and were performed for 3 min at 30°C in a total volume of 8 μL. The experiment was replicated in triplicate (n = 3); error bars represent standard deviations. Data were analyzed by non-linear regression to Michaelis-Menten kinetics with Prism 6 software (GraphPad Software, Inc., La Jolla, CA). For this experiment, Km = 3.03 ± 0.22 nM; kcat = 0.059 ± 0.002 s−1.
Figure 3—figure supplement 1
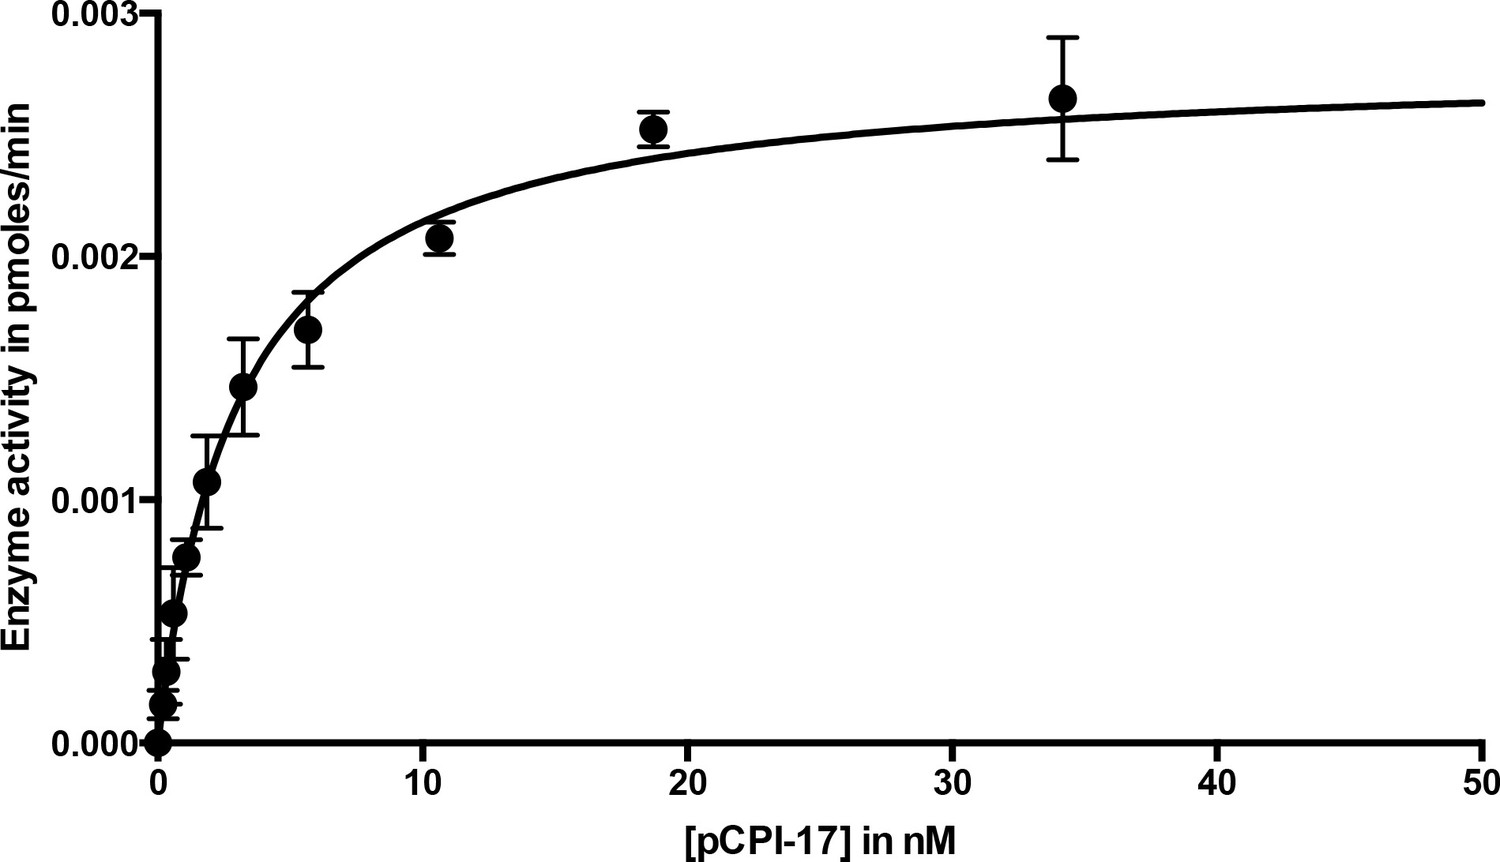
Dephosphorylation of pCPI-17 by MLCP as a function of pCPI-17 concentration.
This figure displays the same data as Figure 3, but with a different scale on the x-axis to better highlight the earliest timepoints.
Figure 4
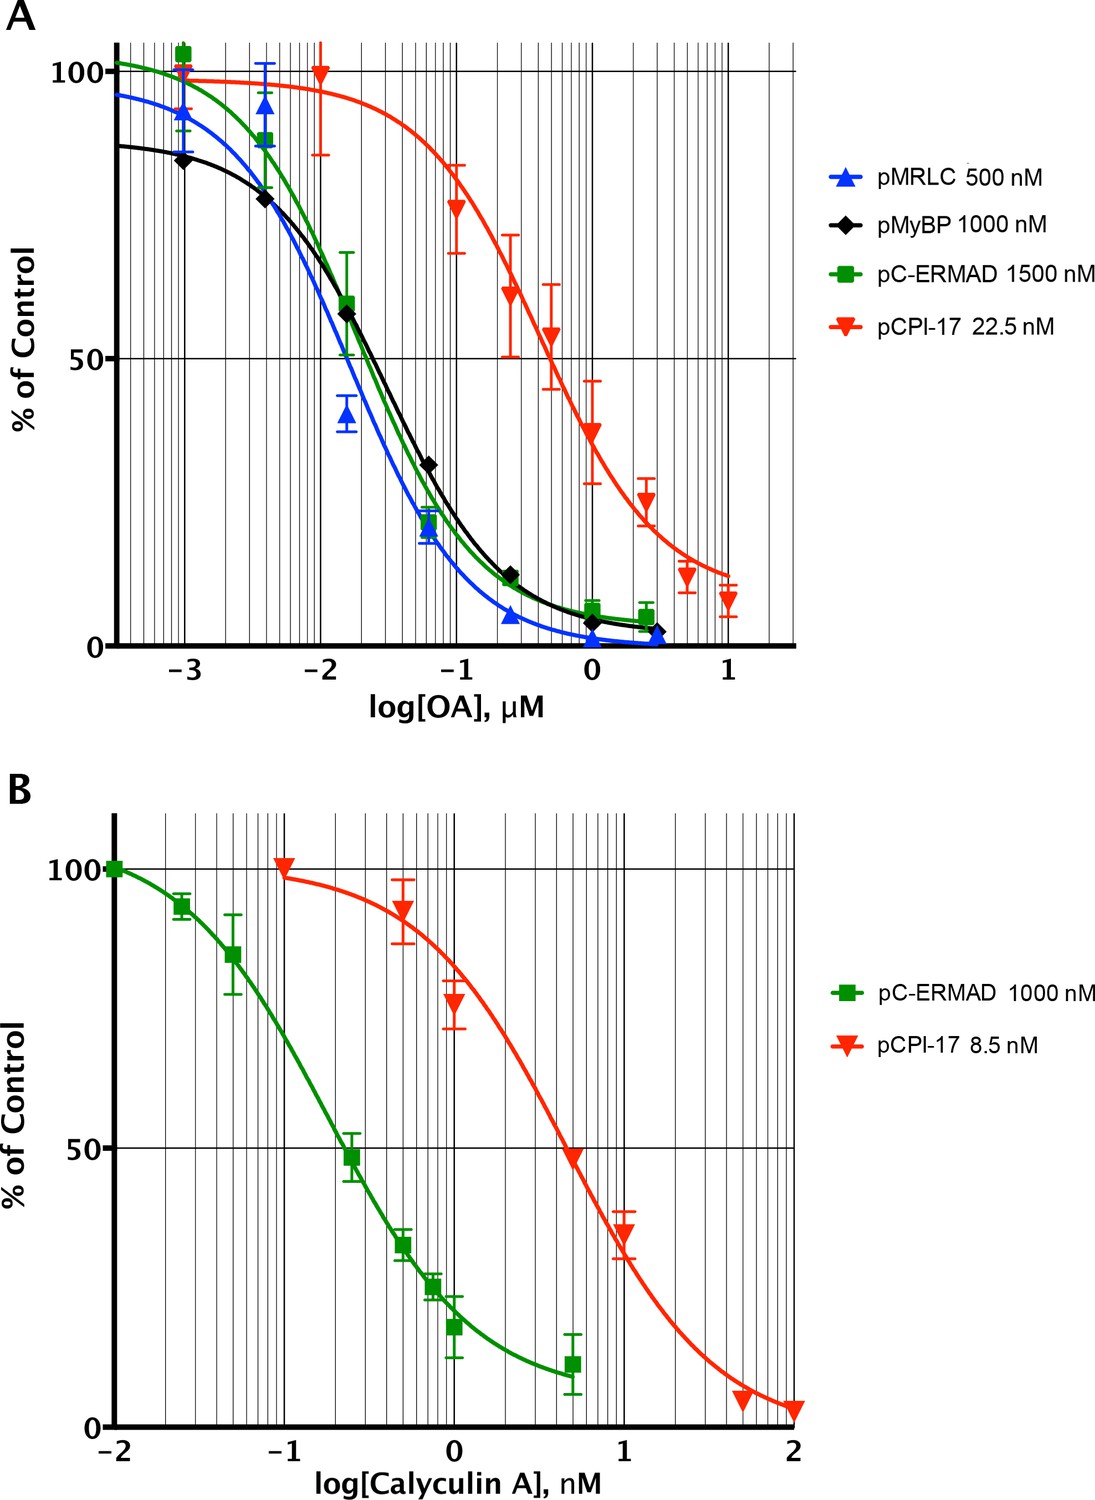
Determining the pCPI-17/MLCP Km by competitive inhibition.
(A) Inhibition of MLCP by okadaic acid (OA). Enzyme assays in the presence of increasing levels of OA were performed with the indicated substrates at the indicated concentrations; in all assays, the concentration of MLCP was 0.1 nM. Values are presented as a percentage of the average of four control reactions for each substrate without OA. For pCPI-17, each point represents the average, and error bars the standard deviation, of five trials (n = 5); for phosphorylated myosin regulatory light chain (pMRLC), n = 4; for pC-ERMAD, n = 2; for pMyelin Basic Protein (pMyBP), n = 1. Because the MLCP concentration is very low, the IC50s of the pMRLC, pMyBP, and pC-ERMAD reactions must be close to the Ki for OA, which is therefore ~20 nM. The ~10–20× larger IC50 with pCPI-17 indicates that this substrate can compete effectively with OA because its Km is smaller than the Ki. Indeed, the best-fit Km determined by nonlinear regression of this and a similar experiment using 8.75 nM pCPI-17 (n = 3; not shown) is 0.59 ± 0.05 nM (see Supplementary file 1). (B) Inhibition of MLCP by calyculin A. Enzyme assays in the presence of increasing levels of calyculin A were performed with pCPI-17 or with pC-ERMAD at the concentrations indicated; the concentration of MLCP was 0.1 nM. Values are presented as a percentage of the average of three control reactions for each substrate without OA; three replicates of each data point were assayed (n = 3), and error bars represent the standard deviations. The measured Ki of calyculin A for MLCP (from the dephosphorylation of pC-ERMAD) was 0.17 ± 0.05 nM. As with the OA experiments in part (A), the increased IC50 with pCPI-17 (~30×) reflects competition of this substrate with calyculin; the nonlinear regression best-fit is Km = 0.36 ± 0.10 nM for the pCPI-17 dephosphorylation reaction.
Figure 5
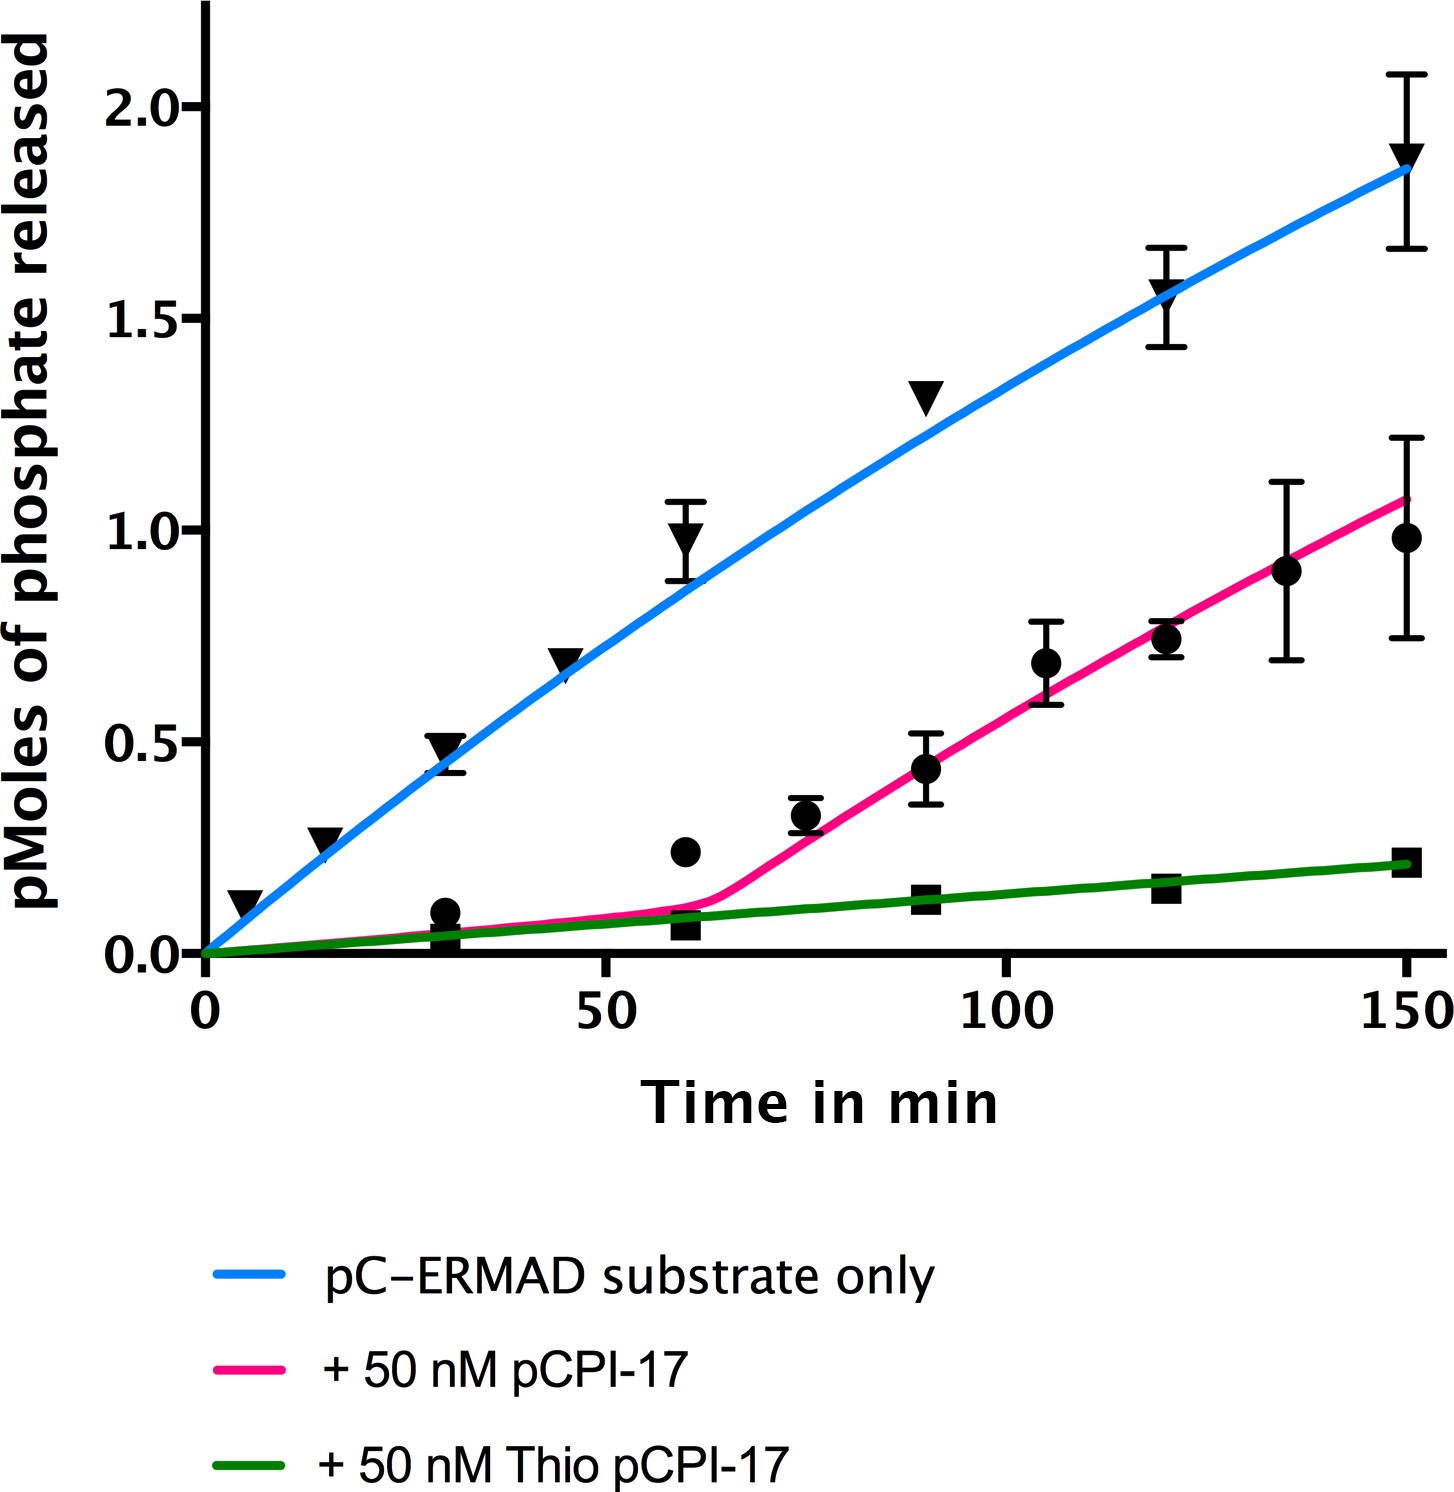
In vitro demonstration of the unfair competition mechanism for MLCP and pCPI-17.
Enzyme assays containing 0.25 nM MLCP and 1.4 μM C-ERMAD were performed at 30°C for the indicated times, either in the absence of CPI-17 (inverted triangles) or in the presence of 50 nM pCPI-17 (circles) or 50 nM thio(p)CPI-17 (squares). N = 3 for all data points; error bars represent standard errors of the mean. The data show that MLCP must first dephosphorylate pCPI-17 before it can target the C-ERMAD substrate. The blue and green lines are nonlinear regressions to the data in the absence of pCPI-17. The red line is the theoretical prediction based on the previously measured pCPI-17/MLCP kinetic constants as described in Supplementary file 1.
Figure 6

Kinetic analysis of the dephosphorylation of pCPI-17 by PP2A-B56α, a candidate PPU enzyme.
(A). Linearity of assay employing PP2A-B56α enzyme (at 0.25 nM); the concentration of pCPI-17 was 1 μM. (B) Velocity of the dephosphorylation of pCPI-17 by 0.1 nM PP2A-B56α as a function of the concentration of the pCPI-17 substrate. Reactions were performed for 1 min at 30°C in a volume of 4 μL. The data were analyzed by Prism 6 software as in Figure 4, giving Km = 4.2 ± 0.5 μM and kcat = 29 ± 2 s−1.
Figure 7 with 2 supplements
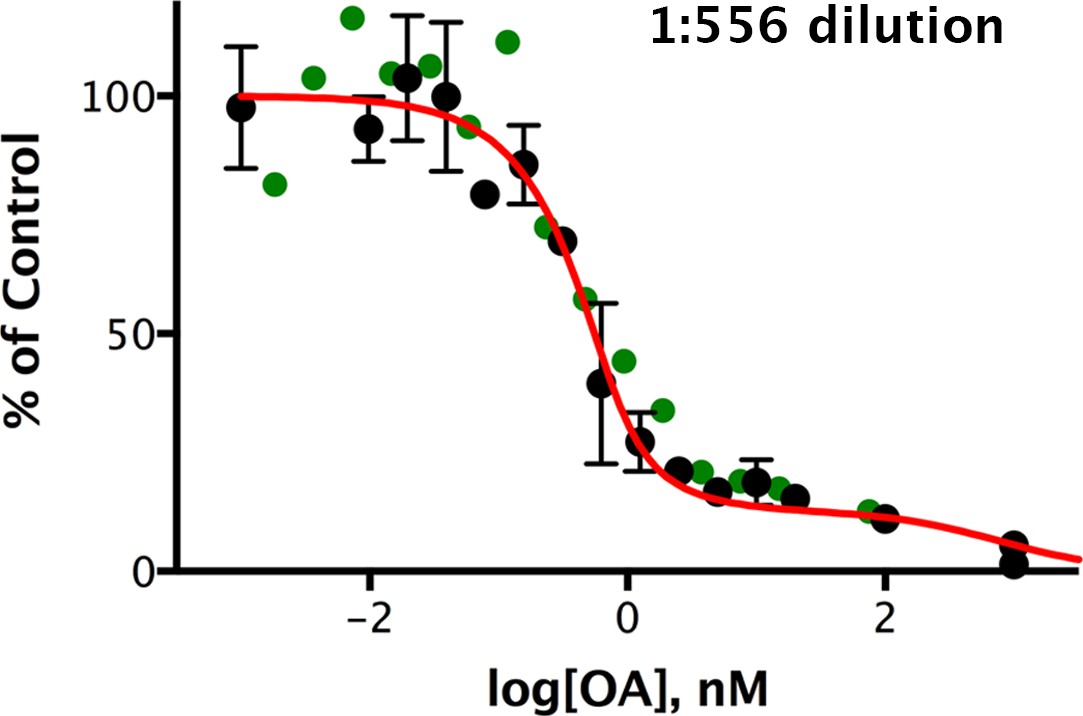
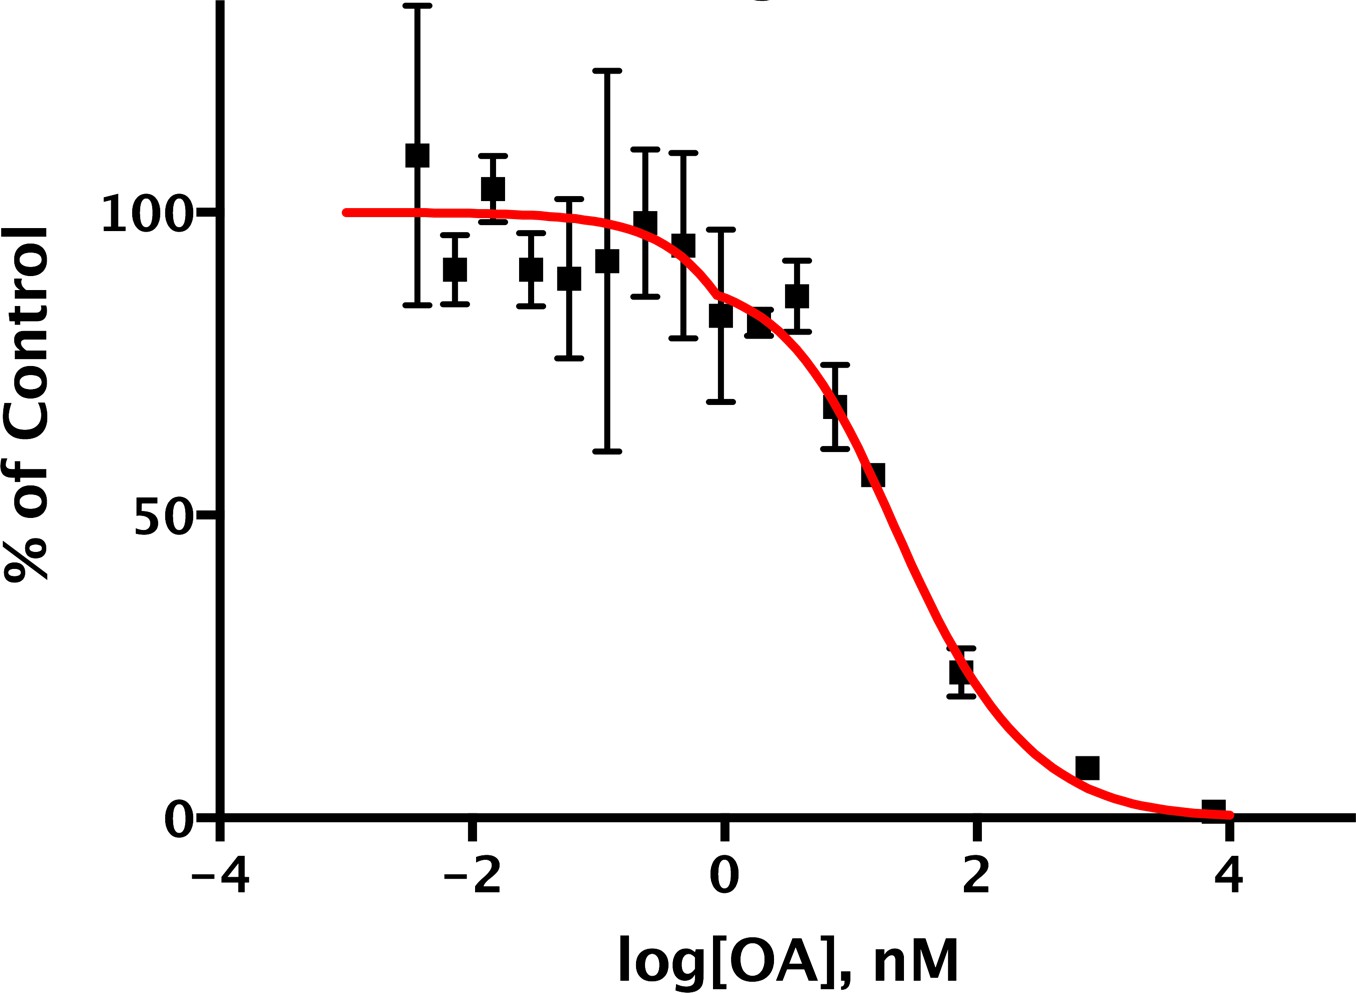
Okadaic acid inhibition of the dephosphorylation of pCPI-17 by dilute mouse uterus extracts.
Mouse uterus extracts at a dilution of 1:556 were prepared as described in Materials and methods and incubated at 30°C for 45 s with 687 nM 32P-labeled pCPI-17 plus the indicated concentrations of okadaic acid (OA). The mean phosphate released (with standard deviations; n = 3) is shown as a percentage of release in the absence of OA. Since the pCPI-17 concentration is much greater than the MLCP concentration at these dilutions, essentially all dephosphorylation is due to PP2A and other non-MLCP phosphatases (collectively called PPU).
Figure 7—figure supplement 1
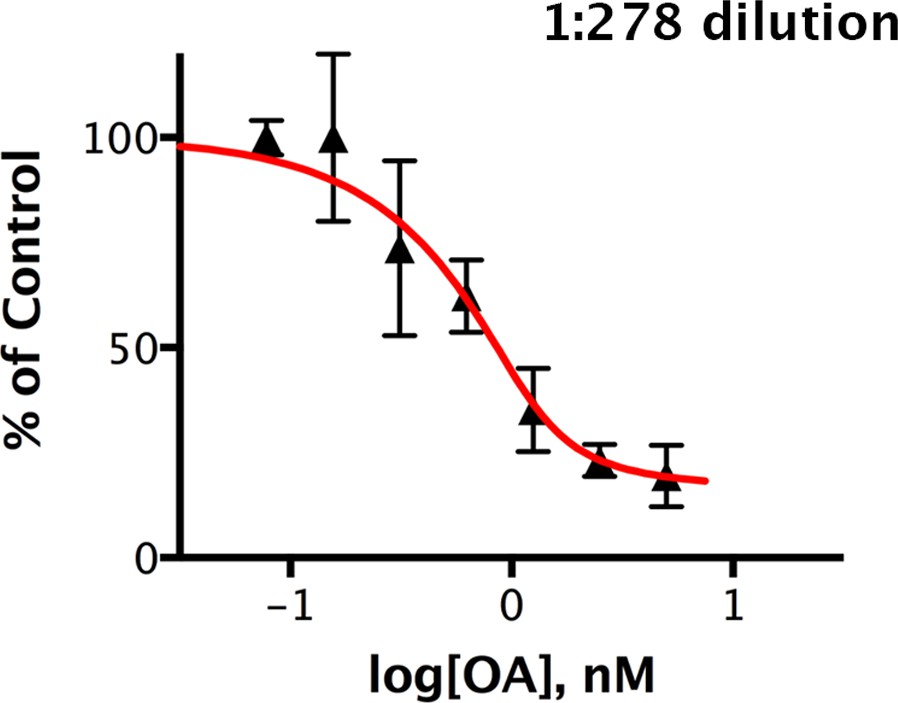
Okadaic acid inhibition of the dephosphorylation of pCPI-17 by dilute mouse uterus extracts.
This experiment is identical to that shown in Figure 7 except that the mouse uterus extracts were diluted 1:278 and incubated at 30°C for 30 s with 32P-labeled pCPI-17 plus the indicated concentrations of okadaic acid (OA). The mean phosphate released (with standard deviations; n = 3) is shown as a percentage of release in the absence of OA.
Figure 7—figure supplement 2
Kinetic analysis of the dephosphorylation of pCPI-17 by PPU.
Highly diluted uterus extract was incubated with the indicated concentrations of 32P-labeled pCPI-17 for either 30 s (30°C) or 3 min (0°C) in 4 μl reactions. Values and standard deviations are for three experiments at each temperature.
Figure 8 with 2 supplements
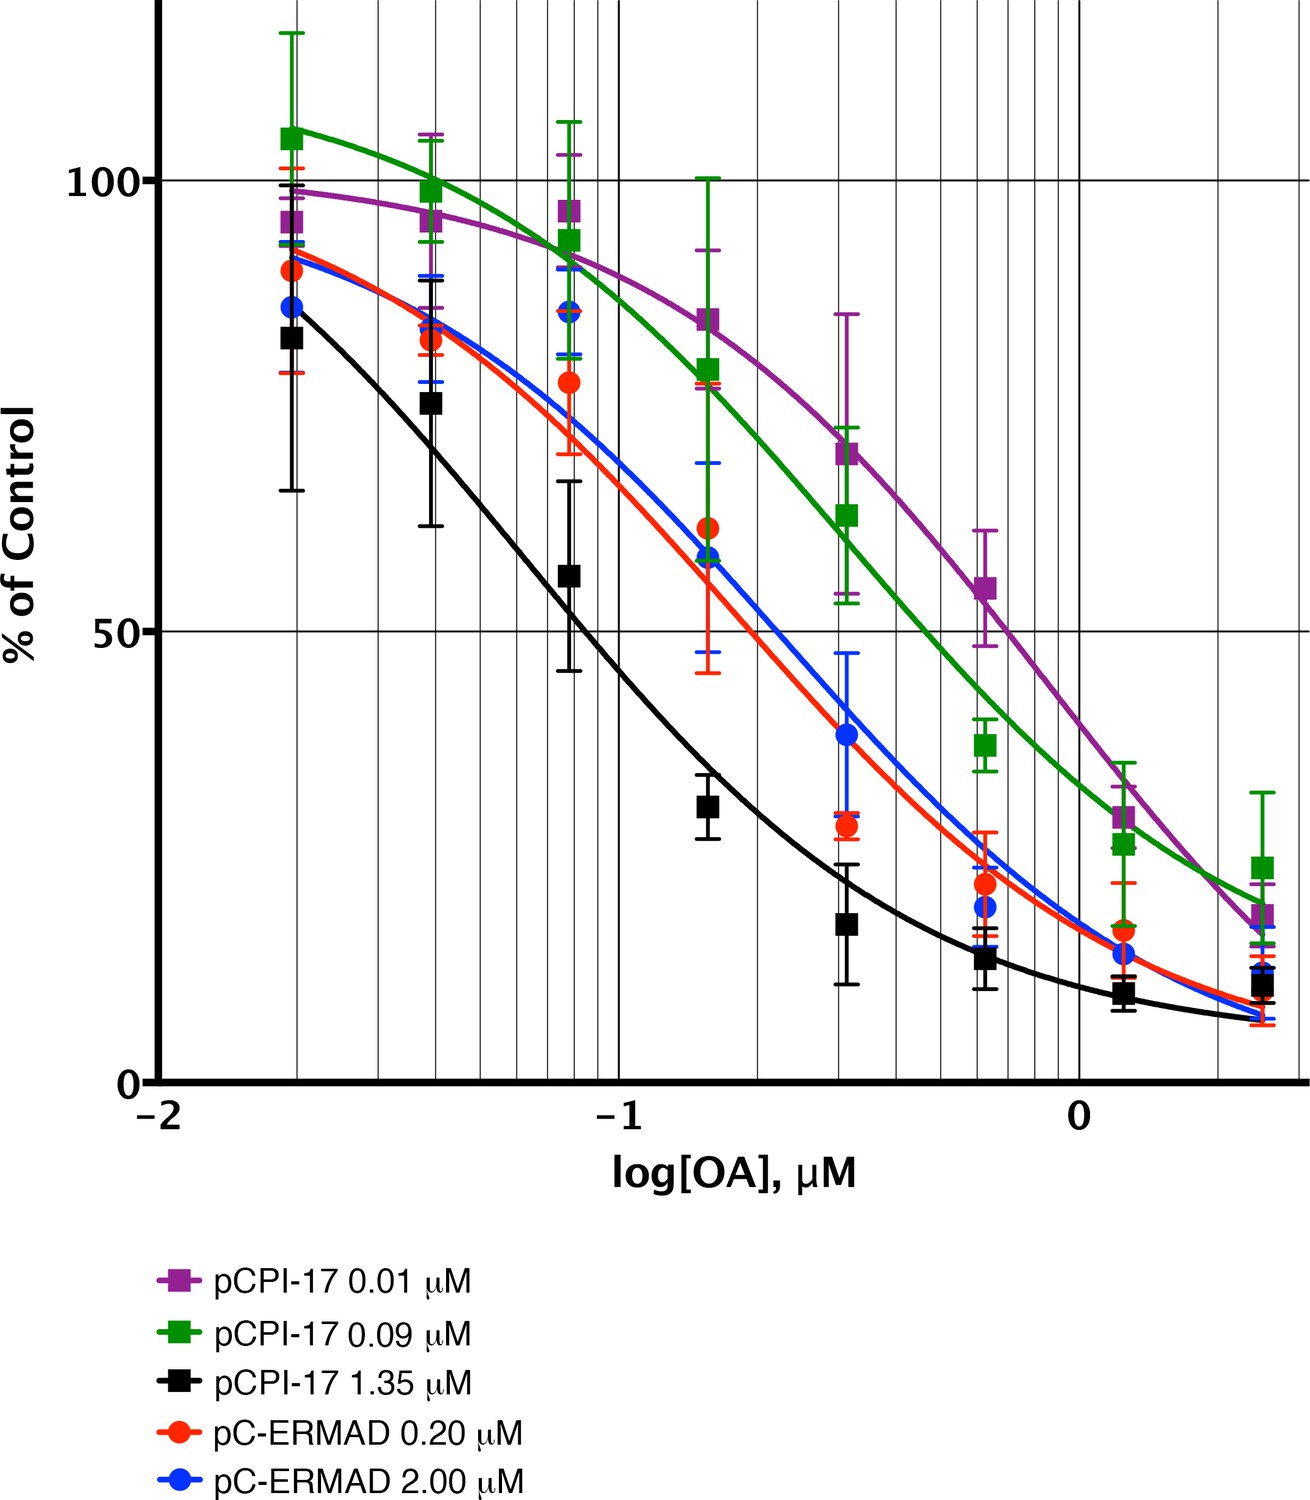
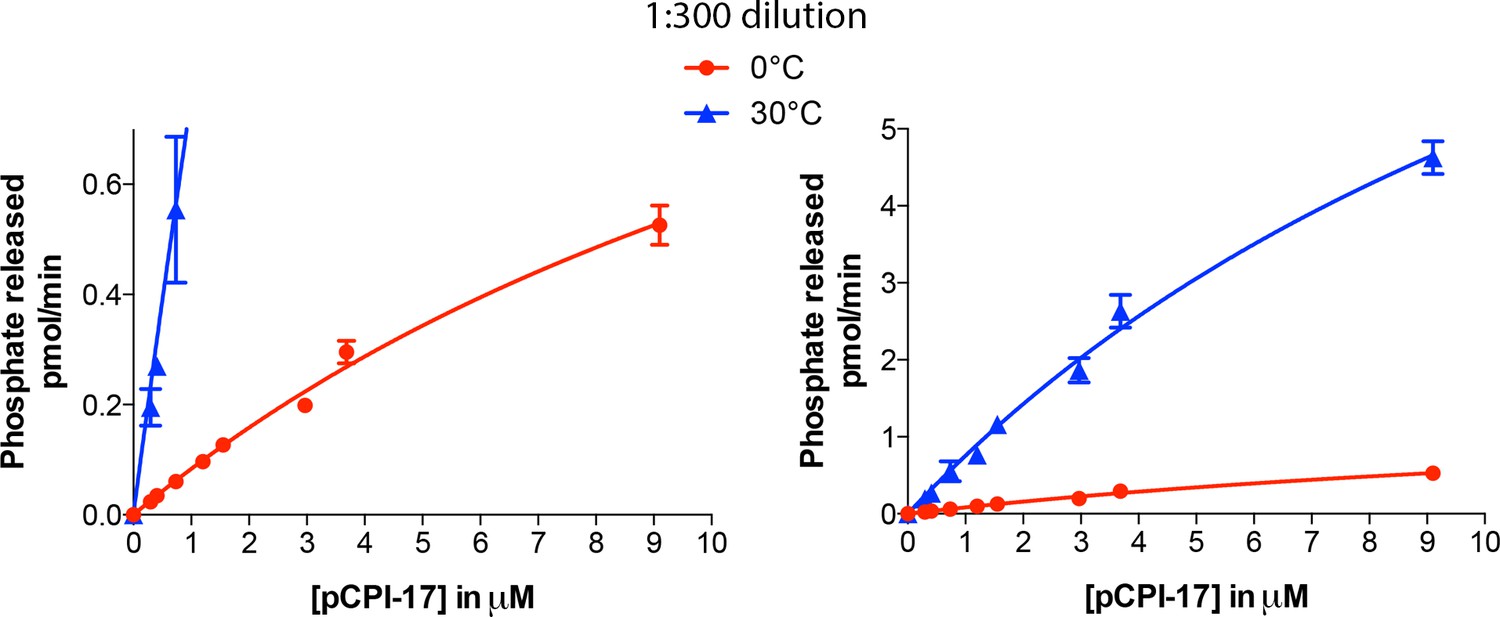
Sequestration of pCPI-17 by MLCP in concentrated mouse uterus extracts.
Undiluted mouse uterus extracts (~14 mg/ml) were assayed for phosphatase activity using 32P-labeled pCPI-17 (0°C) or pC-ERMAD (30°C) substrates at the concentrations shown with the indicated concentrations of OA. Results and standard deviations (n = 3) are given as a percentage of the average value for each substrate dilution in the absence of OA (n = 3). As described in Results and Supplementary file 1, the increase in IC50 at low pCPI-17 concentrations (i.e. 0.01 or 0.09 μM) results from sequestration of the substrate by MLCP. In contrast, the IC50 for dephosphorylation of pC-ERMAD is insensitive to its concentration because only one enzyme, MLCP, is primarily responsible and there is no sequestration.
Figure 8—figure supplement 1
Dephosphorylation of pC-ERMAD by mouse uterus extracts.
Highly diluted (1:740) mouse extracts were incubated with 1.05 μM 32P-labeled pC-ERMAD and the indicated concentrations of okadaic acid at 30°C for 4 min. Values (n = 3) are presented as a percentage of the average of the reactions without okadaic acid. The curve is the tri-phasic best-fit that deconvolves total phosphatase total activity according to the sensitivity to OA and suggests that 77%, 10%, and 13% of the activity is from PP1-containing enzymes (mostly MLCP), PP2A-like PPU, and OA-insensitive PPU, respectively (see Supplementary file 1). This conclusion is in accordance with several previous publications (Canals et al., 2012; Eto et al., 2005, 2000; Fukata et al., 1998; Kunda et al., 2012).
Figure 8—figure supplement 2
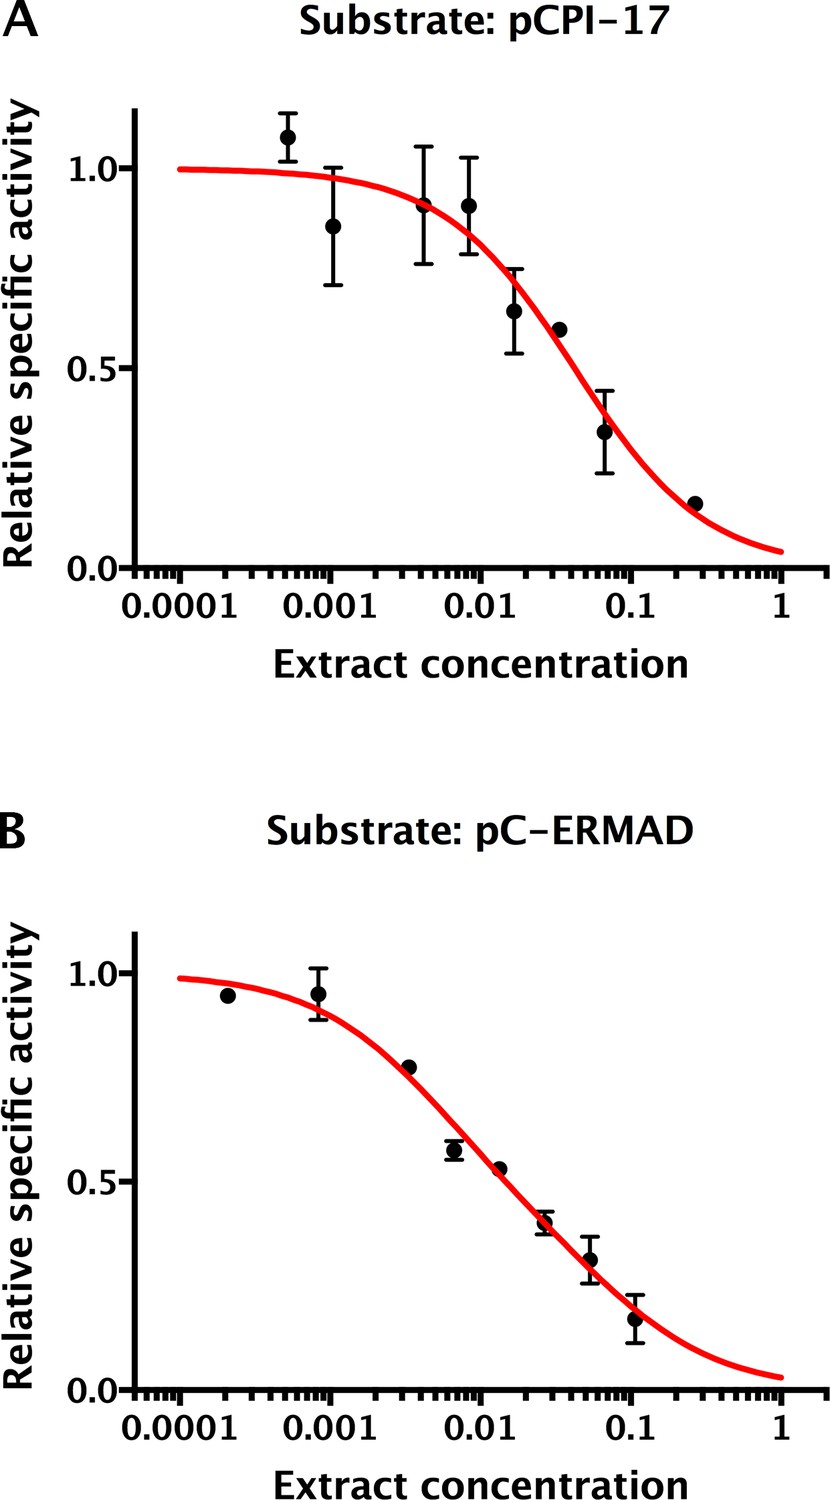
Determination of the ‘strength’ of competing phosphatase substrates and inhibitors in mouse uterus extracts.
Mouse embryo extracts were assayed through the range of indicated concentrations (1 = undiluted concentrated extract) for their ability to dephosphorylate either (A) 1.25 μM 32P-pCPI-17 or (B) 0.89 μM 32P-pC-ERMAD by measuring 32P release. Relative specific activity equals total phosphatase activity divided by extract concentration, normalized to the asymptotic value at low concentration; bars are standard deviations (n = 3). The decrease in specific activity with concentration results from competition from other cellular substrates and inhibitors. As described in Supplementary file 1, this effect can be mathematically modeled with dependence on the dimensionless quantity Σ, the sum over the concentrations divided by the Kms (or Kis) of all substrates (or inhibitors). Under these conditions, pCPI-17 and pC-ERMAD are primarily dephosphorylated by PPU and MLCP, respectively, so the data were used to determine the best-fit value of Σ for each phosphatase (Table 2; see Supplementary file 1). The adjustments determined from the results in this figure were used in computing the predicted time-courses shown in Figure 9.
Figure 9 with 1 supplement

Comparing models for aorta relaxation upon application of vasodilator.
Black points with error bars reproduce data from Figure 4 in (Kitazawa et al., 2009) describing the temporal variation in the levels of (A) CPI-17 and (C) MRLC phosphorylation following the application of the vasodilator sodium nitroprusside to rabbit aorta at t = 0. Red lines show theoretical predictions (see Supplementary file 1) under three scenarios: top, PPU alone (current model, but allowing for sequestration of pCPI-17 by MLCP); middle, MLCP alone; and bottom, MLCP and PPU (unfair competition). (B) The computed relative MLCP activity on substrates other than pCPI-17. Shaded regions (which are barely discernable in the bottom two rows) indicate the variation in the predictions over the potential range of aortic MLCP concentration.
Figure 9—figure supplement 1

Effect of ROCK thiophosphorylation on MLCP activity.
MLCP (0.5 nM) was thiophosphorylated with 2.5 nM ROCK for 90 min at 30°C, and then standard phosphatase assays were conducted with 1 μM pC-ERMAD or 100 nM pCPI-17 substrates for 20 min at 30°C. Data were calculated as a percentage of the phosphatase activity measured with the same substrate and with mock-treated MLCP (no ROCK added). Bars indicate standard errors; n = 10. The difference in the values for the two substrates is highly significant (p<0.0001 using paired or unpaired t-tests).Wiśniewski et al., 2014
Tables
Table 1
Phosphatase and substrate constants and concentrations.
| Phosphatase | Substrate/ Inhibitor | Constant | Value | Source figure or (reference) |
|---|---|---|---|---|
| pCPI-17 | ([CPI-17]+[pCPI-17])phys | 7 µM | (Kitazawa and Kitazawa, 2012; Woodsome et al., 2001) |
| Phosphatase | Substrate/ Inhibitor | Constant | Value | Source figure or (reference) |
|---|---|---|---|---|
| MLCP | [MLCP]phys | 1 µM | (Alessi et al., 1992; Shirazi et al., 1994) | |
| pCPI-17 | Km | 0.48 ± 0.03 nM | Figure 4 | |
| kcat | 0.06 ± 0.01 s−1 | Figure 2—figure supplement 1, Figures 3, 4 and 5 | ||
| OA | Ki | 20 ± 2 nM | Figure 4 | |
| calyculin A | Ki | 0.13–0.22 nM | Figure 4 |
| Phosphatase | Substrate/ Inhibitor | Constant | Value | Source figure or (reference) |
|---|---|---|---|---|
| PP2A-B56α | pCPI-17 | Km | 4.2 ± 0.5 µM | Figure 6 |
| kcat | 29 ± 2 s−1 | Figure 6 |
| Phosphatase | Substrate/ Inhibitor | Constant | Value | Source figure or (reference) |
|---|---|---|---|---|
| PPUa | [PPU]aphys | ~1.5 µM | Figure 8 | |
| pCPI-17 | Km | 15 ± 2 µM | Figure 7—figure supplement 2 | |
| kcat* | 41 ± 6 s−1 | Figure 7, Figure 7—figure supplement 1 and Figure 8 | ||
| OA | Ki | <0.5 nM | Figure 7 and Figure 7—figure supplement 1 |
| Phosphatase | Substrate/ Inhibitor | Constant | Value | Source figure or (reference) |
|---|---|---|---|---|
| PPUb | pCPI-17 | Km | ≥15 µM | Figure 7—figure supplement 2 |
| kcat [PPU]bphys/Km | ~0.7 s−1 | Figure 7 and Figure 7—figure supplement 1 | ||
| OA | Ki | ~450 nM | Figure 7 and Figure 7—figure supplement 1 |
-
All parameters are at 30°C.
-
phys: Physiological total (bound plus unbound) concentration; these values are computed using an estimated physiological total protein concentration of 170 mg/ml (Wiśniewski et al., 2014).
-
PPUa is the PP2A-like component of PPU; it contributes 85% of the pCPI-17-directed PPU phosphatase activity. PPUb is the minor OA-resistant component.
-
*Computed from kcat [PPU]a/M/Km, [PPU]a/M, and Km (see Table 2).
Table 2
Additional phosphatase constants.
| Phosphatase | Substrate | Constant | Value | Source figure or (reference) |
|---|---|---|---|---|
| MLCP | Σphys* | ~15 | Figure 8—figure supplement 2 | |
| pMyBP | Km | ~1.7 μM | Figure 2—figure supplement 1 | |
| kcat | ~0.18 s−1 | Figure 2—figure supplement 1 | ||
| pC-ERMAD | Km | >2.5 μM | Figure 2—figure supplement 1 | |
| kcat /Km | 2.6 ± 0.03 × 10⁻⁴ nM−1 s−1 | Figure 2—figure supplement 1 | ||
| pMRLC | Km | ~16 μM | (Kawano et al., 1999) |
| Phosphatase | Substrate | Constant | Value | Source figure or (reference) |
|---|---|---|---|---|
| PPU | Σphys* | ~24 | Figure 8—figure supplement 2 | |
| pCPI-17 | Km | 15 ± 2 μM | Figure 7—figure supplement 2 | |
| Km(0°C) | 14 ± 3 μM | Figure 7—figure supplement 2 |
| Phosphatase | Substrate | Constant | Value | Source figure or (reference) |
|---|---|---|---|---|
| PPUa | pCPI-17 | kcat (30°C)/kcat (0°C) | 8.3 ± 0.8 | Figure 7—figure supplement 1 |
| kcat [PPU]a/M/Km | 0.024 ± 0.001 s−1 ml mg−1 | Figure 7 and Figure 7—figure supplement 1 | ||
| [PPU]a/M | 8.9 ± 0.9 pmol/mg | Figure 8 |
| Phosphatase | Substrate | Constant | Value | Source figure or (reference) |
|---|---|---|---|---|
| PPUb | pCPI-17 | kcat [PPU]b/M/Km | 0.0045 ± 0.0002 s−1 ml mg−1 | Figure 7 and Figure 7—figure supplement 1 |
-
All parameters are at 30°C except as specified.
-
phys: Physiological total (bound plus unbound) concentration; these values are computed using an estimated physiological total protein concentration of 170 mg/ml (Wiśniewski et al., 2014).
-
M: total extract protein concentration
-
Σ: Competition factor from other substrates (see Supplementary file 1)
Additional files
-
Supplementary file 1
Theoretical methods.
- https://doi.org/10.7554/eLife.24665.020
Download links
A two-part list of links to download the article, or parts of the article, in various formats.
Downloads (link to download the article as PDF)
Open citations (links to open the citations from this article in various online reference manager services)
Cite this article (links to download the citations from this article in formats compatible with various reference manager tools)
Unfair competition governs the interaction of pCPI-17 with myosin phosphatase (PP1-MYPT1)
eLife 6:e24665.
https://doi.org/10.7554/eLife.24665


