Resolving stem and progenitor cells in the adult mouse incisor through gene co-expression analysis
- University of California, San Francisco, United States
- Brigham and Women’s Hospital, Harvard Medical School, United States
- The Jackson Laboratory, United States
Figures
Figure 1
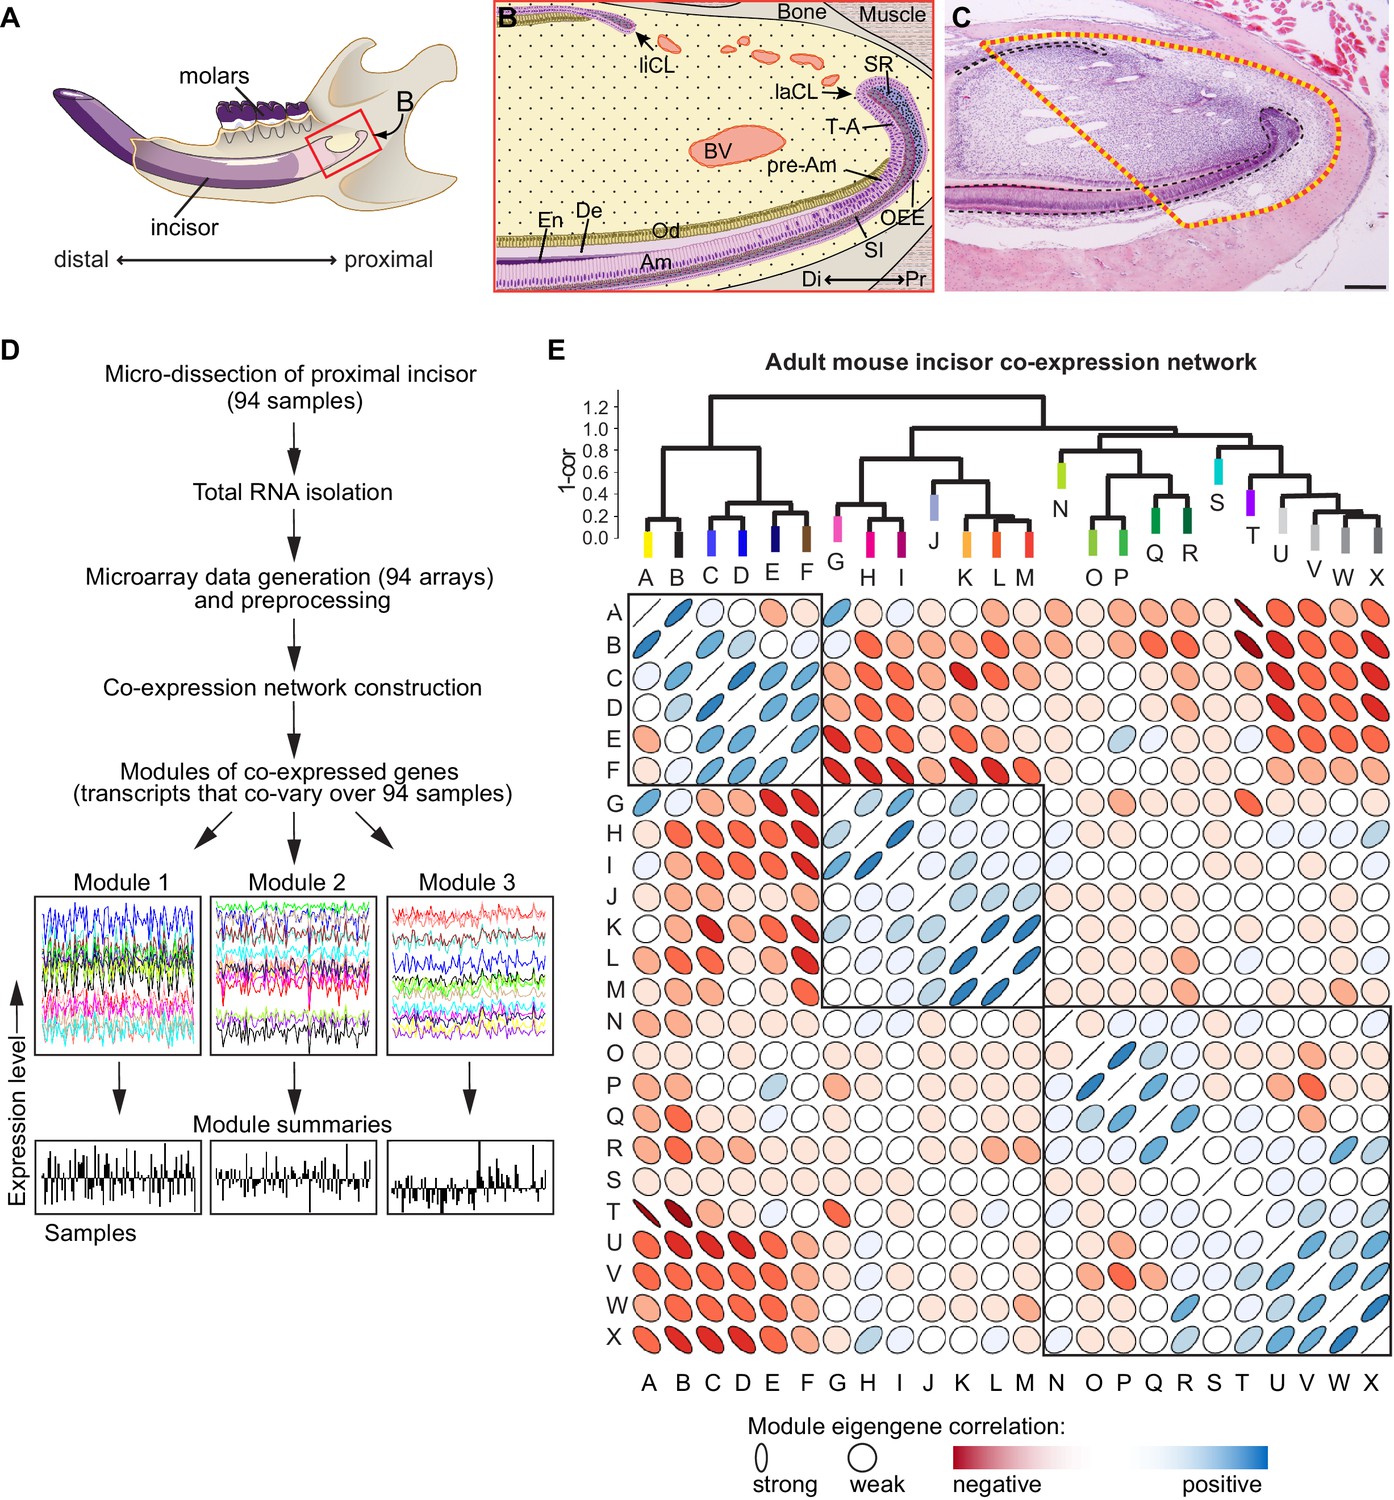
Analysis of transcriptional co-variation in adult mouse incisor reveals gene co-expression modules.
(A) Diagram depicting sagittal view of right lower jaw of a mouse. (B) Schematic of the stem cell-containing region in the proximal (Pr) mouse incisor. Stem cell pools that give rise to epithelial cell types (purple) are located in the proximal portion of the lingual and labial cervical loops (liCL, laCL). Mesenchymal cell types of the incisor (yellow), such as the dentin (De)-secreting odontoblasts (Od), are constantly replenished by progenitors located in the mesenchyme between the CLs. Blood vessels (BV) are highly abundant in this region. In the laCL, stem cells located in the outer enamel epithelium (OEE), adjacent proximal stellate reticulum (SR), and stratum intermedium (SI), give rise to highly proliferative transit-amplifying (T–A) cells which, after undergoing mitosis, differentiate along several epithelial lineages as the progeny advance to the distal (Di) tip of the incisor and differentiate into enamel (En)-secreting ameloblasts (Am). (C) Hematoxylin and eosin stained sagittal section of the mouse incisor. Dashed line indicates tissue region for which analysis was performed. Scale bar: 200 μm. (D) Workflow for incisor gene co-expression network construction. RNA samples were used to generate genome-wide microarray expression profiles for 94 intact incisor specimens, which were used as input for unsupervised gene co-expression analysis. Gene co-expression modules consist of transcripts that co-vary and therefore have highly similar expression signatures across all samples (x-axis). Examples of three co-expression modules are shown. The characteristic expression pattern of each module is summarized by its first principal component, or module eigengene (module summaries; (Horvath and Dong, 2008)). (E) Structure of the incisor co-expression network. Twenty-four gene co-expression modules were identified and hierarchically clustered based on eigengene dissimilarity (1 – cor) using average linkage. The correlation matrix of the module eigengenes is depicted below. Blue and red denote positive and negative correlations, respectively, with stronger correlations denoted by thinner ellipses (Murdoch and Chow, 1996). Three main clusters of positively correlated modules are evident from the dendrogram and correlation plot.
Figure 2 with 1 supplement
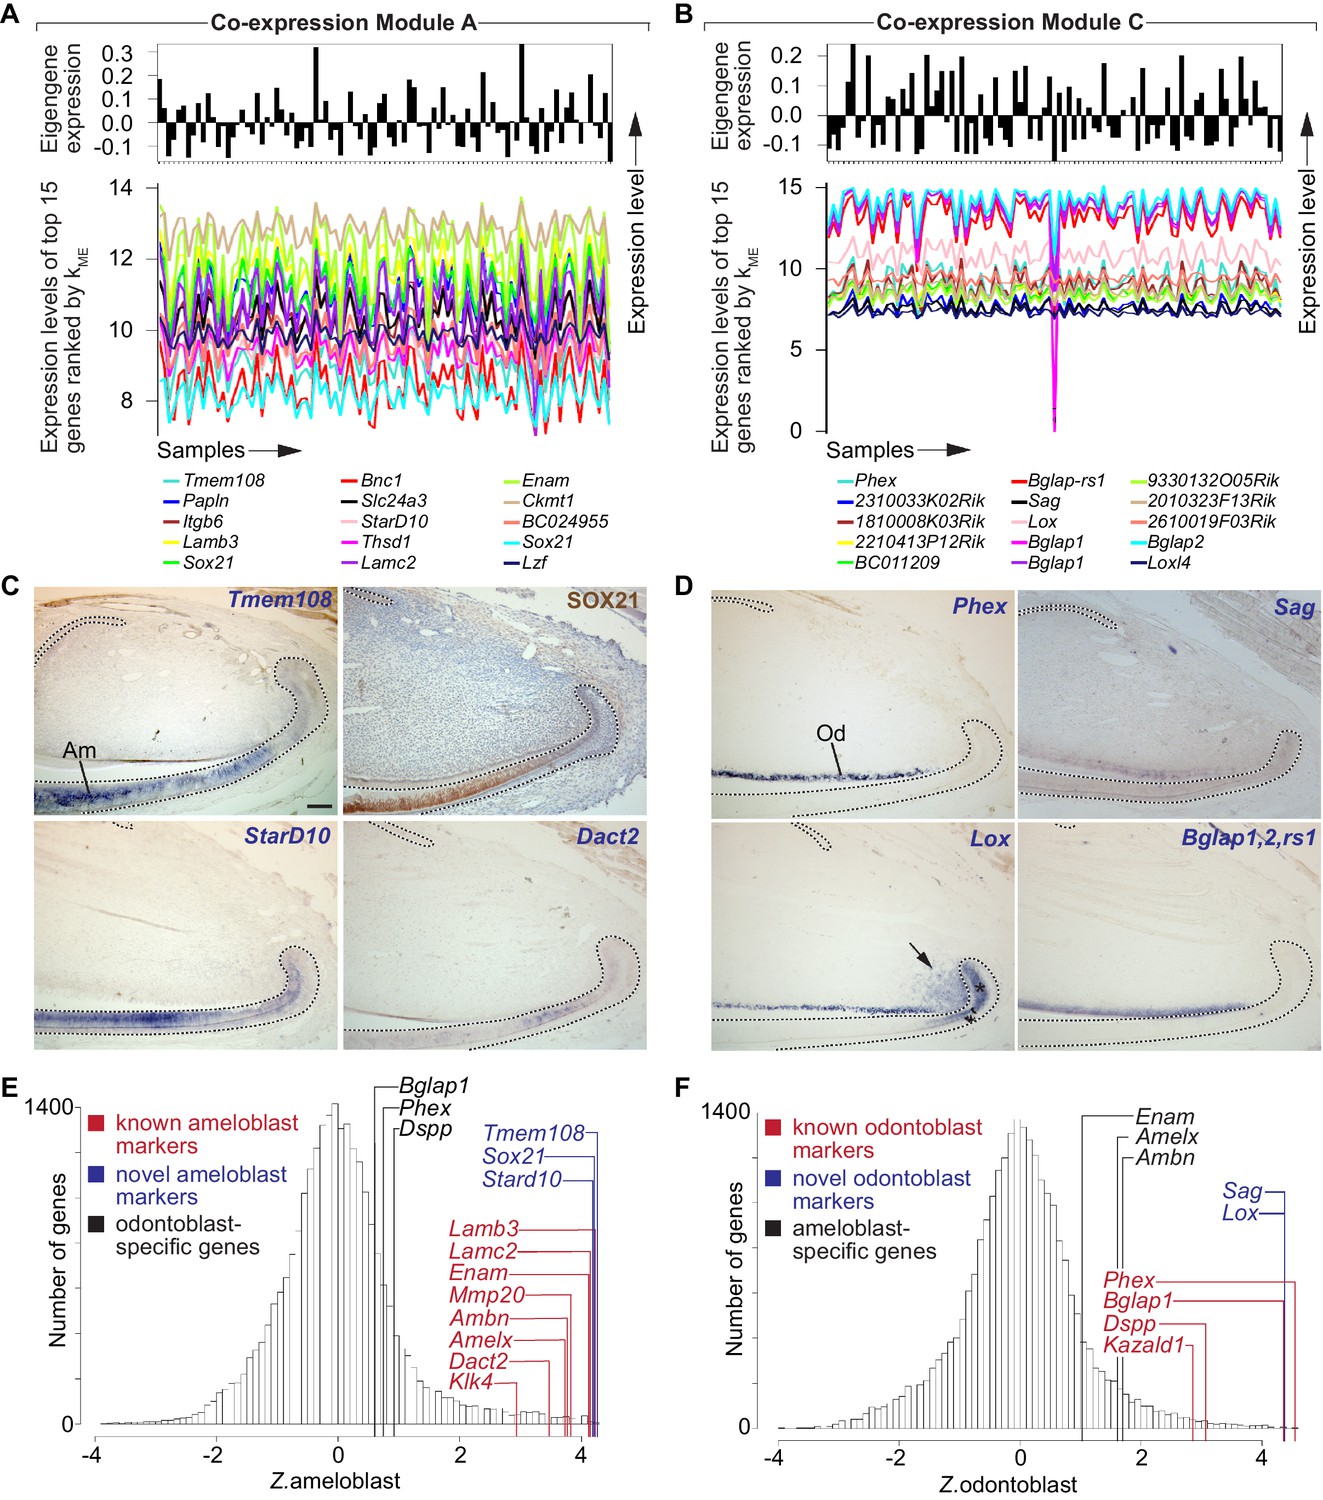
Identification of gene co-expression modules corresponding to distinct lineages of differentiated stem cell progeny.
(A,B) Snapshots of gene co-expression Modules A and C. Top: the module eigengene (first principal component) summarizes the characteristic expression pattern of genes in each module. Bottom: expression patterns of the top 15 genes ranked by kME values for each module. (C) Immunohistochemistry (top-right panel) and in situ hybridization (remaining panels) confirms ameloblast-specific expression for genes in Module A. (D) In situ hybridization confirms expression in odontoblasts for genes in Module C. Arrow and asterisk denote additional expression domain of Lox in mesenchymal and epithelial T-A region, respectively. (E,F) Genome-wide distribution of predicted ameloblast (E) and odontoblast (F) expression specificity. Dashed lines in (C,D) delimit ectodermal epithelium. Am, ameloblasts; Od, odontoblasts. Scale bar: 100 μm.
Figure 2—figure supplement 1
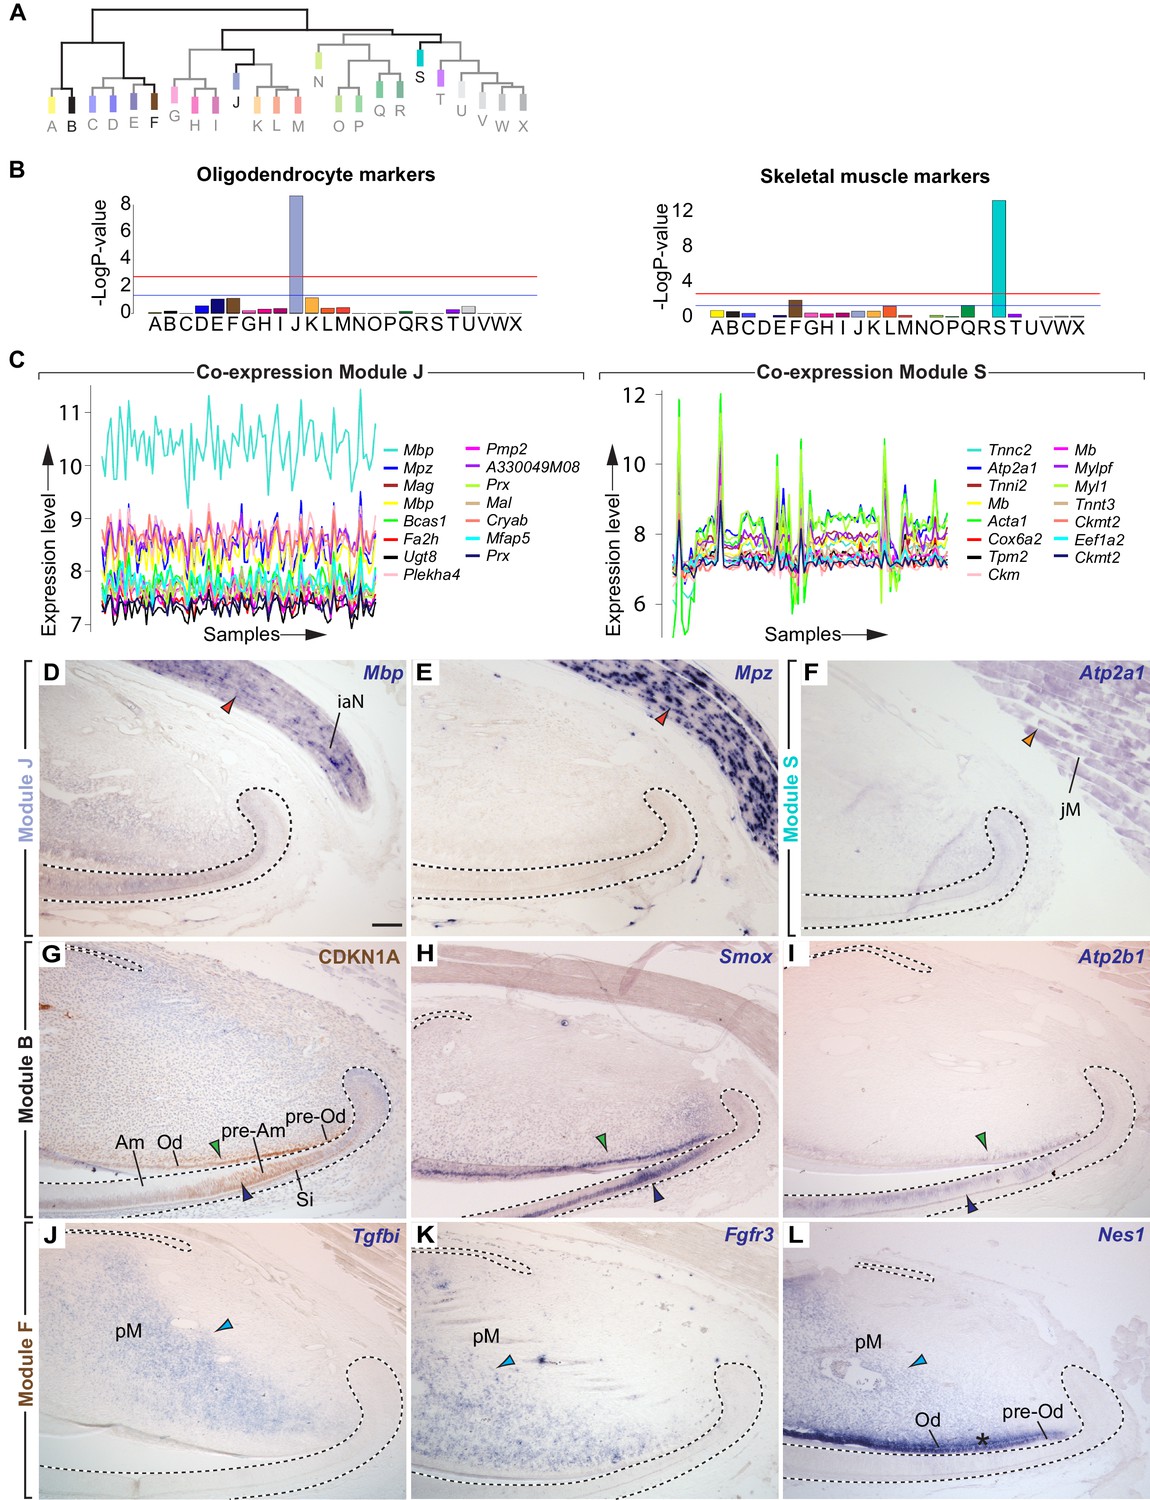
Identification of additional modules corresponding to differentiated and differentiating cell types.
(A) Incisor gene co-expression network dendrogram. Modules featured in this figure are highlighted. (B) Enrichment analysis shows significant overlap of Module J with a gene set consisting of oligodendrocyte markers (Cahoy et al., 2008) (left panel). Genes in Module S significantly overlap with a gene set consisting of skeletal muscle markers (http://www.stat.stanford.edu/~tibs/GSA/tissues.gmt, right panel). Blue line, p=0.05; red line, p=2.1×10⁻³ (Bonferroni correction). (C) Expression patterns of genes with the highest kME values for Module J (left) and Module S (right). (D–F) In situ hybridization reveals Schwann cell-specific (red arrowheads) and skeletal muscle-specific (orange arrowhead) expression of genes contributing to Modules J and S, respectively. (G–I) Antibody staining (G) and in situ hybridization (H, I) shows genes contributing to Module B are co-expressed in epithelium-forming cells of the ameloblasts (purple arrowhead) and odontoblast (green arrowhead) lineage that have left the cell cycle. (J–L) Modules J-L contain genes that are primarily transcribed in the distal pulp mesenchyme (blue arrowheads). Asterisk in L denotes additional expression in pre-Od and Od. Am, ameloblasts; iaN, inferior alveolar nerve; jM, jaw muscle; Od, odontoblasts; pM, pulp mesenchyme; pre-Am, pre-ameloblasts; pre-Od, pre-odontoblasts; Si, stratum intermedium. Dashed lines delimit ectodermal epithelium. Scale bar: 100 µm.
Figure 3 with 2 supplements
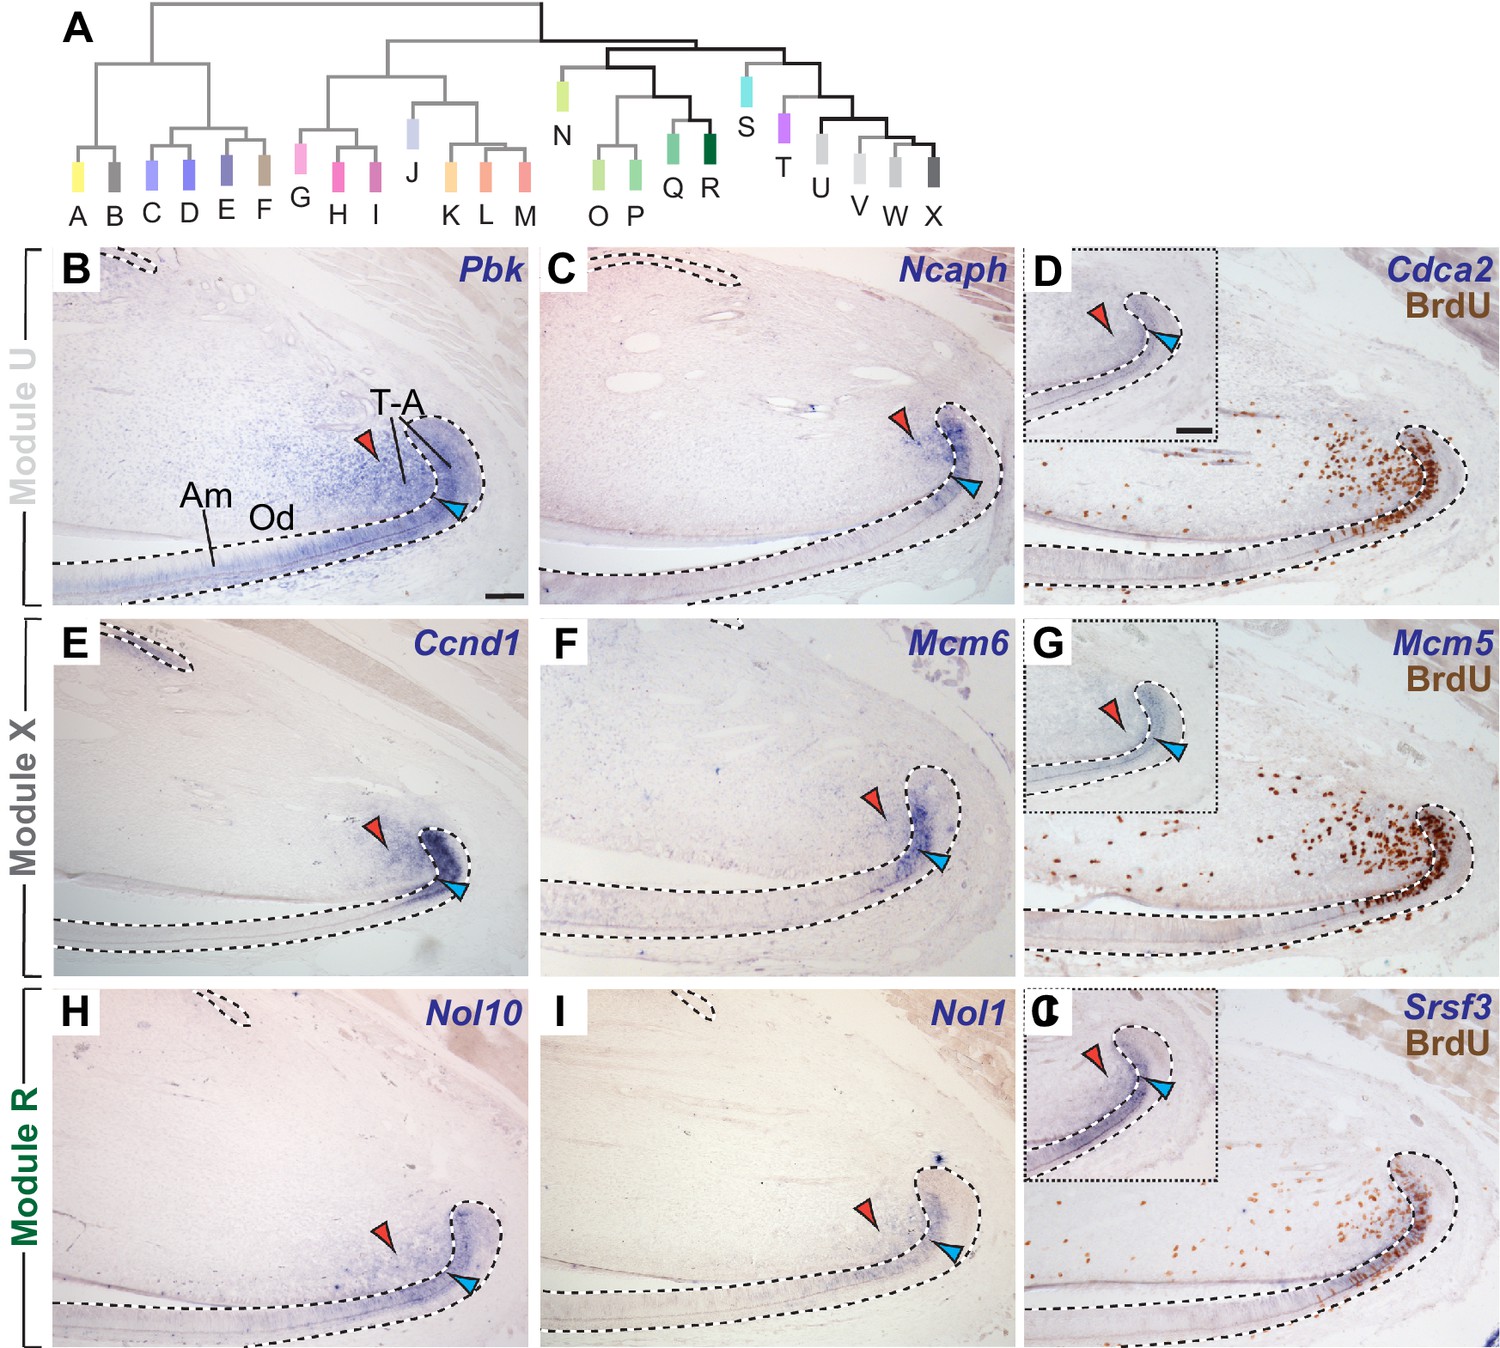
The incisor gene co-expression network contains several modules of genes co-expressed in transit-amplifying (T–A) cells.
(A) Highly ranked genes contributing to modules clustered in the right-hand portion of the dendrogram are expressed in regions with actively proliferating epithelial and mesenchymal T-A cells. (B–D) mRNA expression of genes highly ranked in module U is detected in T-A cells in the incisor epithelium (blue arrowhead) and mesenchyme (red arrowhead). (E–G) In situ hybridization for highly ranked genes contributing to Module X. (H–J) Transcription of genes in Module R is restricted to T-A cells. In situ hybridization and antibody staining against BrdU (D,G,J) confirm expression of Cdca2, Mcm5 and Srsf3 in proliferating cells. Insets show mRNA expression prior to detection of BrdU on same tissue section. Dashed lines delimit ectodermal epithelium. Am, ameloblasts; Od, odontoblasts, T-A, transit-amplifying cells. Scale bars: 100 μm, C-J as in B; insets in G, J as inset in D.
Figure 3—figure supplement 1
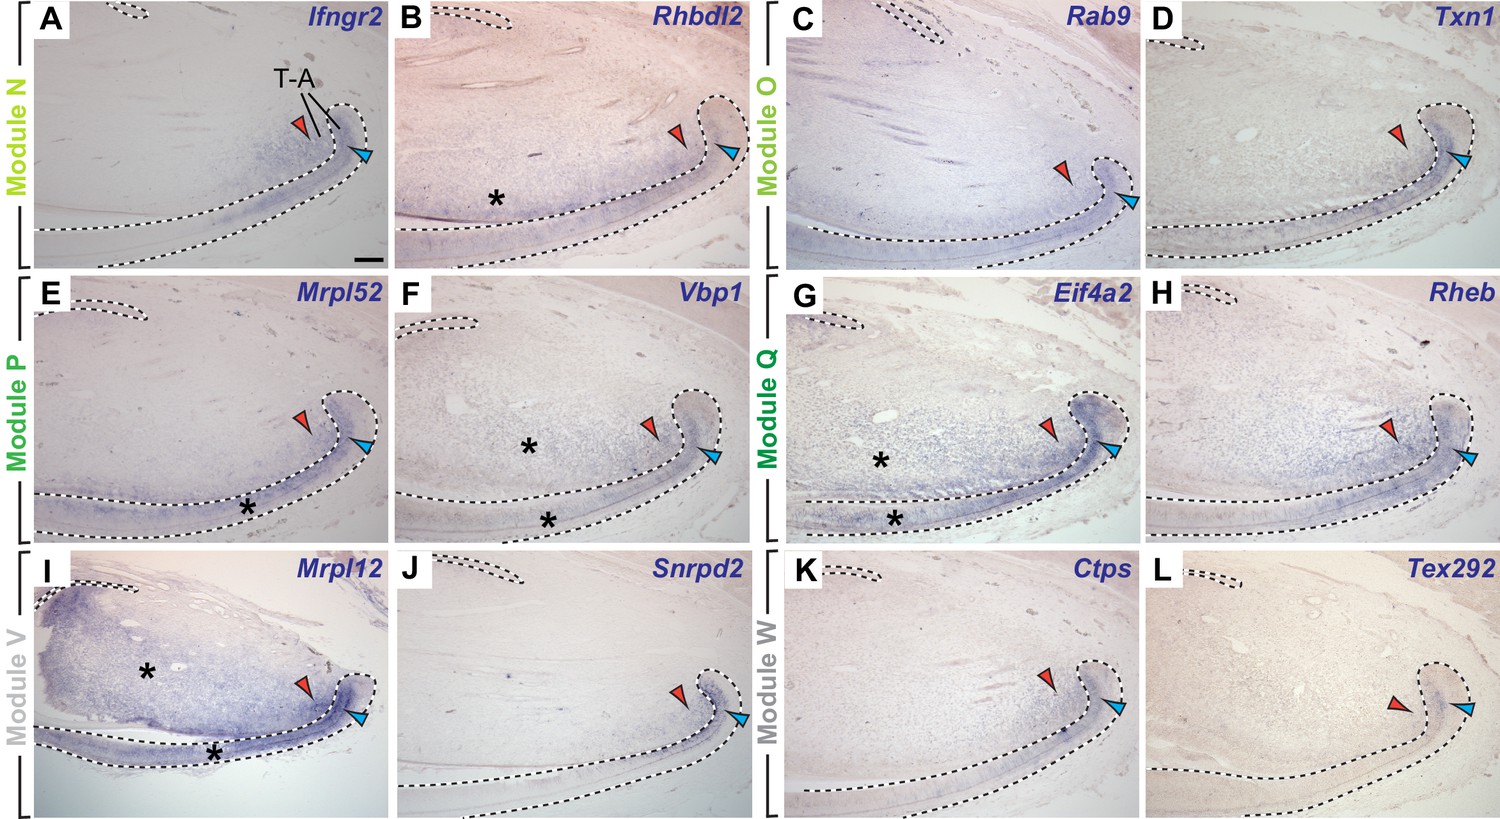
Identification of co-expression modules enriched for transit-amplifying (T–A) cell-specific genes.
(A–L) In situ hybridization detecting expression of highly ranked genes contributing to modules clustered in the right branch of the incisor gene co-expression network dendrogram in the epithelium (blue arrowhead) and mesenchyme (red arrowhead) of the incisor T-A cell region. Dashed lines delimit incisor epithelium. Scale bars: 100 µm, B-L, as in A.
Figure 3—figure supplement 2
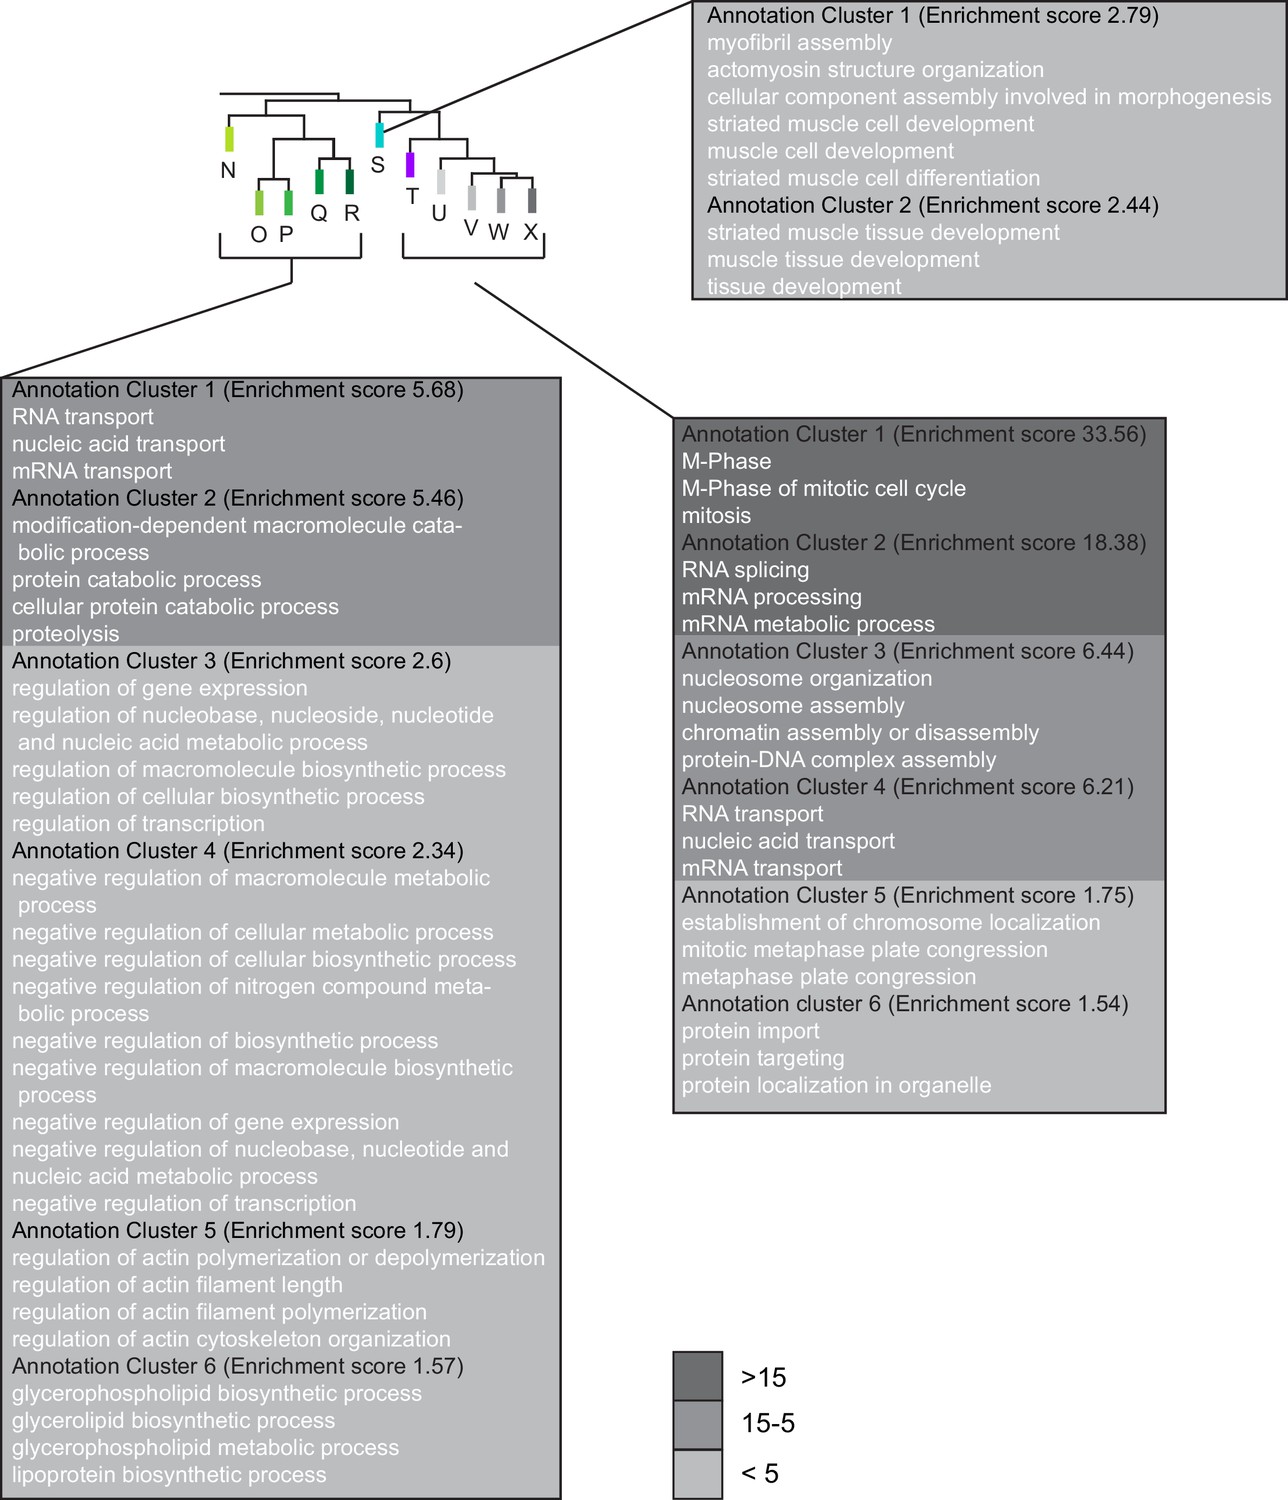
Functional annotation of enriched Gene Ontology (GO) terms for Module clusters N-R, T-X and Module S.
Enriched GO terms (level 5) were identified and clustered using the DAVID Bioinformatics resources. Annotation clusters with EASE scores > 1.3 are shown.
Figure 4 with 3 supplements
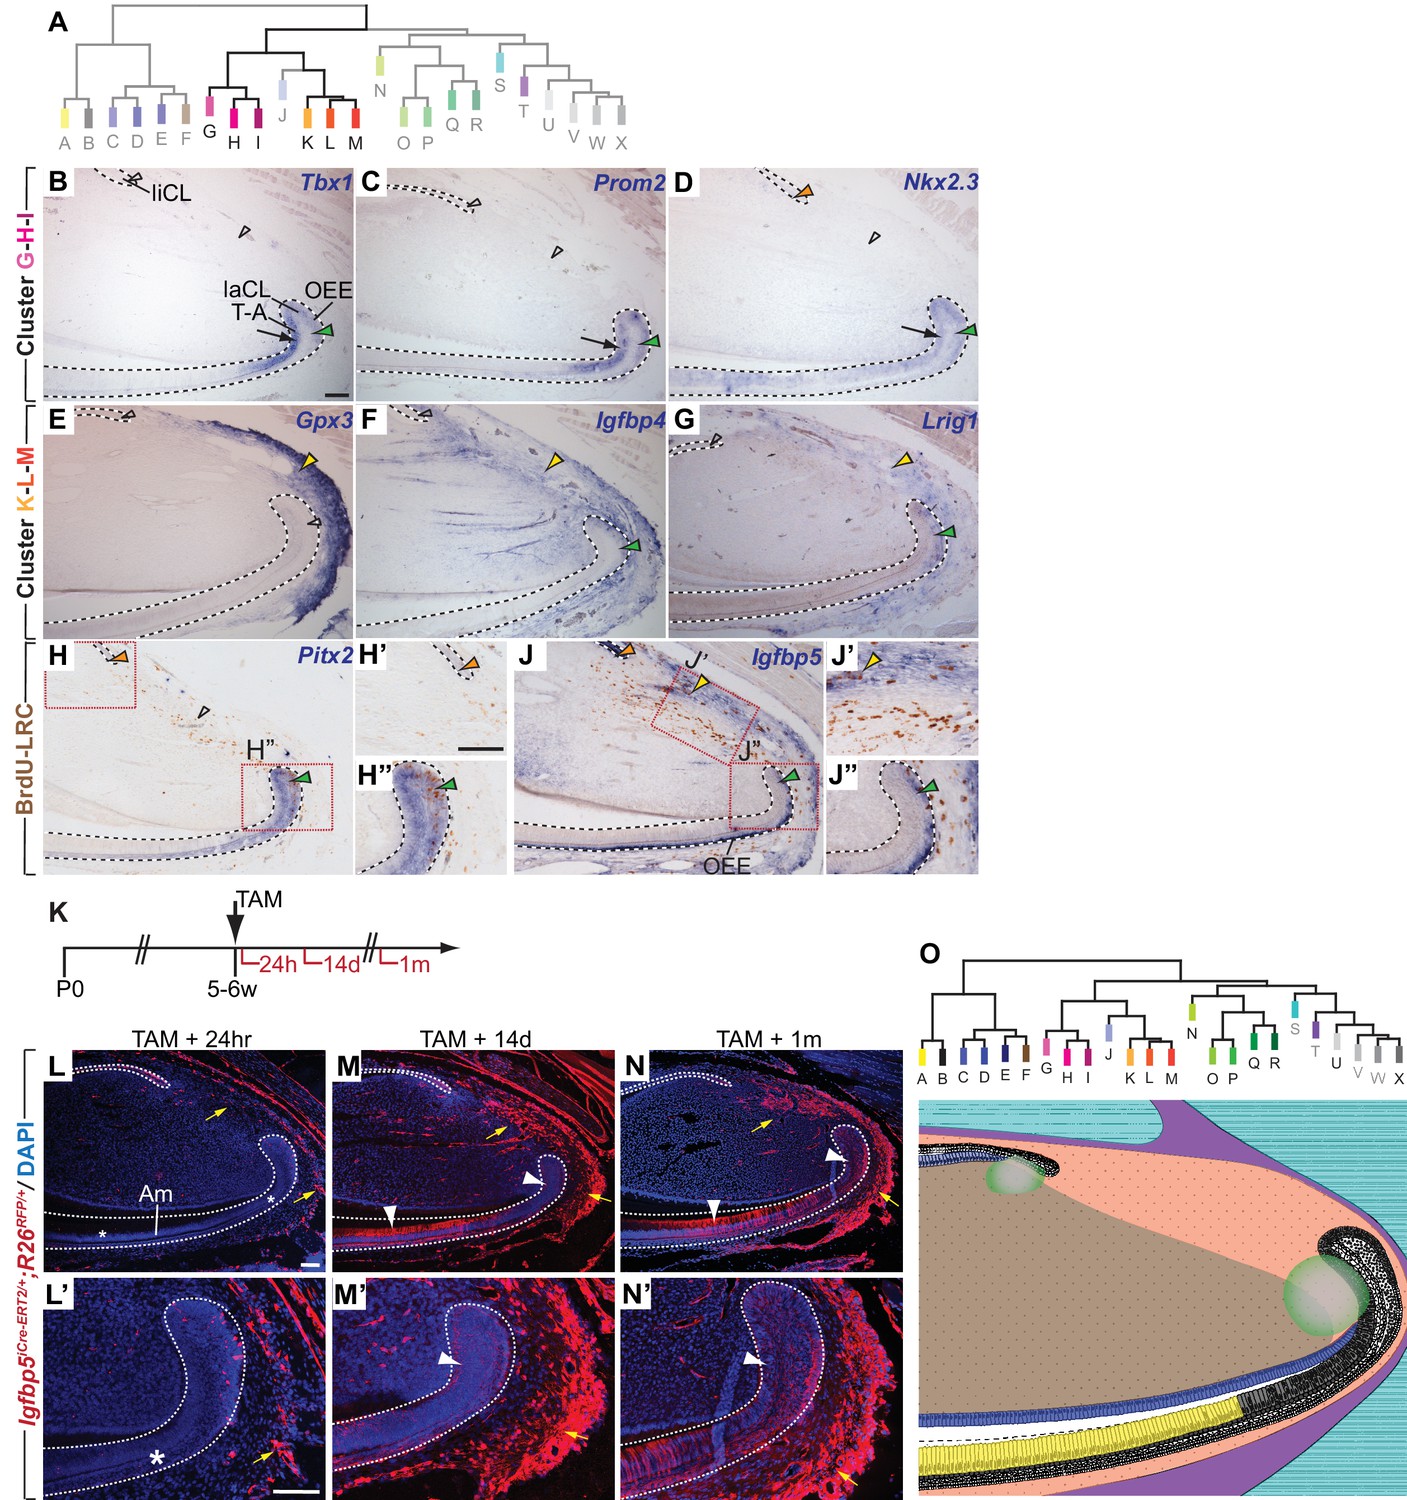
Module clusters G-H-I and K-L-M are enriched for candidate epithelial and mesenchymal stem cell markers.
(A) Dendrogram depicting incisor gene co-expression network with modules featured in panels B-J highlighted. (B–D) mRNA expression of genes with high module memberships for modules G, H and I is restricted to the ectodermal epithelium and includes the proximal epithelium of the labial cervical loop (laCL; green arrowheads) and the epithelial T-A region (black arrows). Expression in the lingual cervical loop (liCL) was detected for Nkx2.3 (orange arrowhead) but not in case of Tbx1 and Prom2 (open arrowheads) (E–G) Genes contributing to modules K-L-M are predominantly expressed in the proximal incisor mesenchyme (yellow arrowheads). A number of genes affiliated with this cluster show additional transcriptional activity in the proximal laCL (green arrowheads). (H–H”) In situ hybridization and antibody staining against BrdU in samples with BrdU-label-retaining cells (LRCs) detects expression of Pitx2, which contributes to the G-H-I module cluster, in LRCs in the laCL and in the liCL. (J–J”) Igfbp5 is expressed by cells in the liCL, the outer enamel epithelium (OEE), including BrdU-LRCs in the laCL (green arrowhead in J, J”), and a subset of mesenchymal LRCs located close to the periphery of the organ (yellow arrowheads in J and J’). (K) Dosing scheme for in vivo lineage analysis of cells expressing Igfbp5. (L–N’) Lineage tracing of Igfbp5-positive cells 24 hr (L, L’), 14 days (M, M’), and 1 month (N, N’) post Tamoxifen treatment. Asterisks indicate the absence of labeled epithelial cells. White arrowheads highlight labeled progeny in the T-A region or amongst differentiated ameloblasts (Am). In the periodontal tissue, labeled cells increase in number over time (yellow arrows). (O) Summary of the domains of expression of the modules and module clusters mapped onto a schematic view of the incisor growth region. Color code matches the dendrogram; overlapping modules are represented using corresponding color shading. Module clusters C-D-E, G-H-I, K-L-M, and U-V-W-X are represented by the central hue used for that branch of the dendrogram. Dashed lines delimit ectodermal epithelium. T-A, transit-amplifying cells. Scale bars: 100 μm, C-H and J as in B; H”, J’, J” as in H’; M, N as in L; M’, N’ as in L’.
Figure 4—figure supplement 1
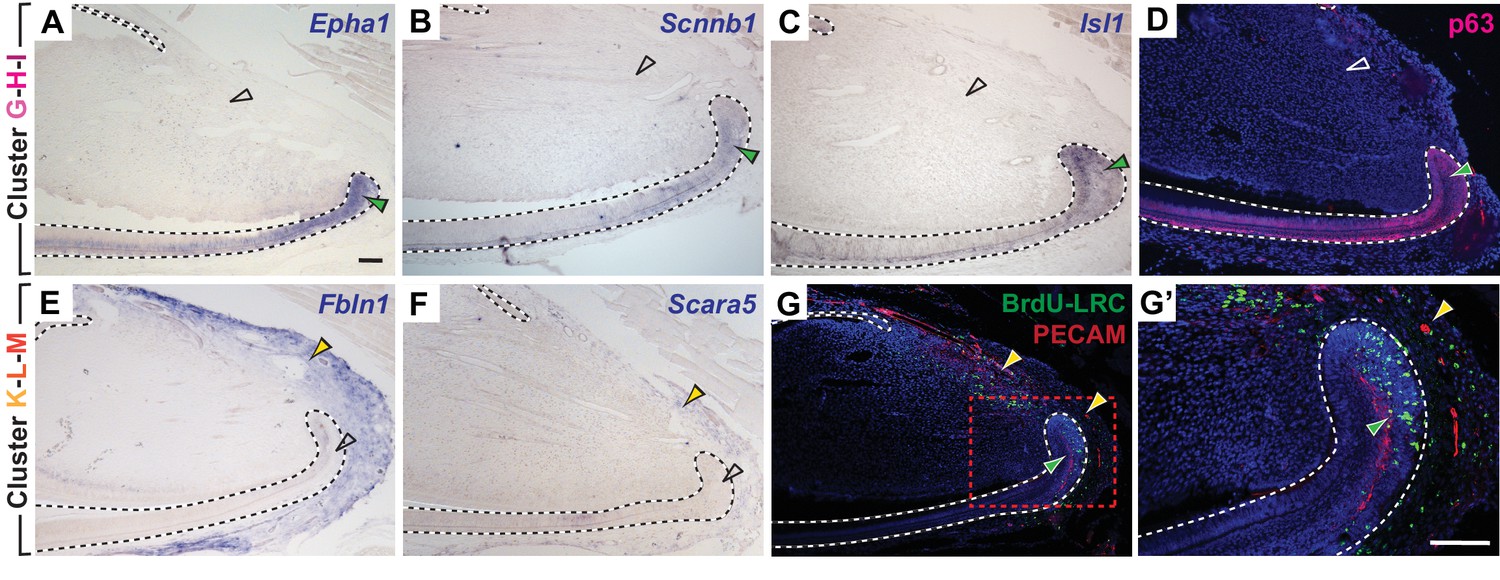
Identification of co-expression modules enriched for stem cell-specific genes.
(A–D) mRNA (A–C) and protein expression (D) of genes contributing to Module cluster G-H-I. (E–G’) In situ hybridization (E,F) and double immunofluorescence staining demonstrates expression of markers in Module cluster K-L-M in the label-retaining cell containing regions of the mouse incisor. Dashed lines delimit incisor epithelium. Scale bars: 100 µm, B-G, as in A.
Figure 4—figure supplement 2
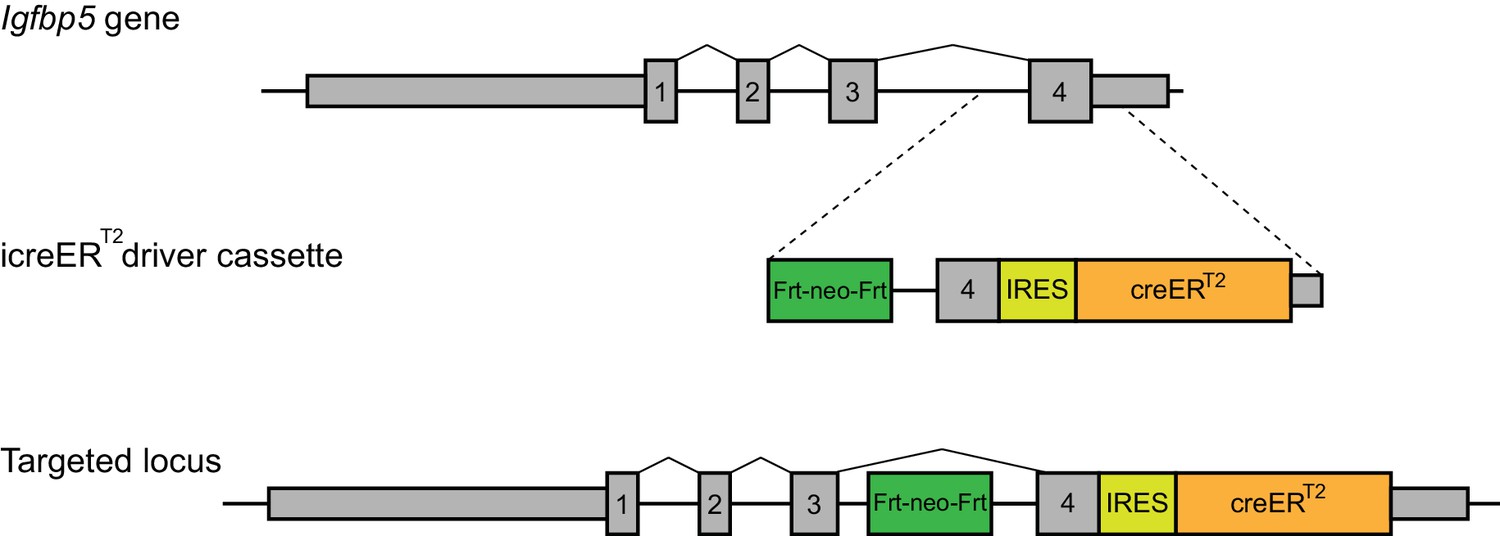
Targeting strategy for generation of Tamoxifen-inducible Igfbp5iCreER-T2 mouse line.
(A) Genomic organization of the Igfbp5 locus prior to targeting. (B) Vector for targeted insertion using CRISPR/Cas9 technology. (C) Igfbp5 locus after targeting. CreERT2, Cre recombinase-estrogen receptor T2; Frt, flippase recognition target sites; IRES, internal ribosome entry site; Neo, neomycin phosphotransferase.
Figure 4—figure supplement 3
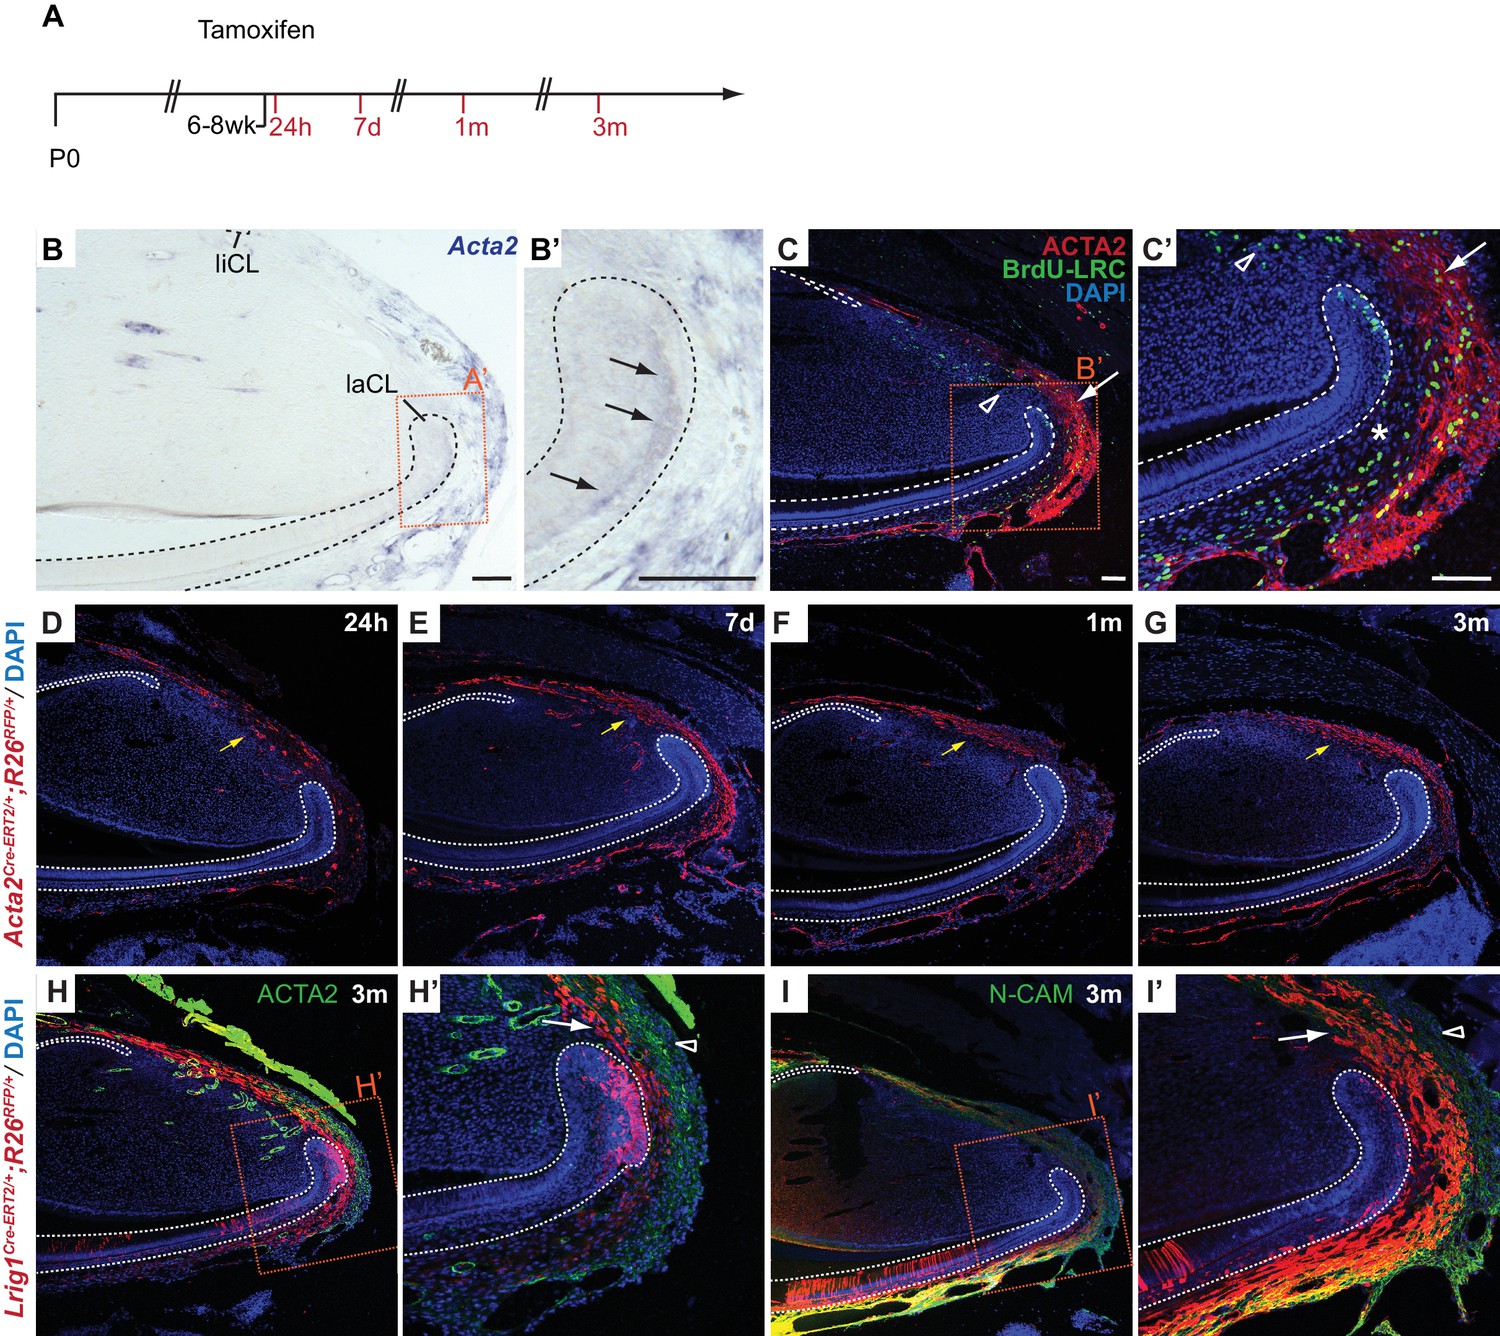
Acta2-positive and Lrig1-expressing stem cells supply overlapping yet distinct regions in the incisor periodontal compartment.
(A) Experimental plan for in vivo lineage tracing. (B, B’) In situ hybridization for Acta2. Black arrows point to expression in the labial cervical loop epithelium. (C, C’) Double immunofluorescence staining with an antibody against ACTA2 and an antibody detecting BrdU label retaining cells (LRCs). ACTA2 expression is present in LRCs in the periodontal tissue adjacent to the alveolar bone (white arrow) but absent from periodontal cells directly bordering the labial cervical loop (laCL, asterisk in B’) and the distal-most LRCs located between the cervical loops (open arrowhead). (D–G) Lineage tracing of Acta2-expressing cells 24 hr (D), 7 days (E), 1 month (F), and 3 months (G) after induction of Cre expression demonstrates Acta2-positive cells continue to contribute labeled progeny to the periodontal region (yellow arrows). (H–I’) Co-localization of progeny of Lrig1-positive cells and periodontal tissue-specific genes. Immunofluorescent detection of ACTA2 (H, H’) and N-CAM (I, I’) and RFP, 3 months after Tamoxifen treatment. Dashed lines delimit incisor epithelium. liCL, lingual cervical loop. Scale bars: 100 µm. D-G, H, I as in C, H’, I’ as in C’.
Figure 5 with 1 supplement
Lrig1 marks stem cell pools in the epithelium and mesenchyme of the mouse incisor.
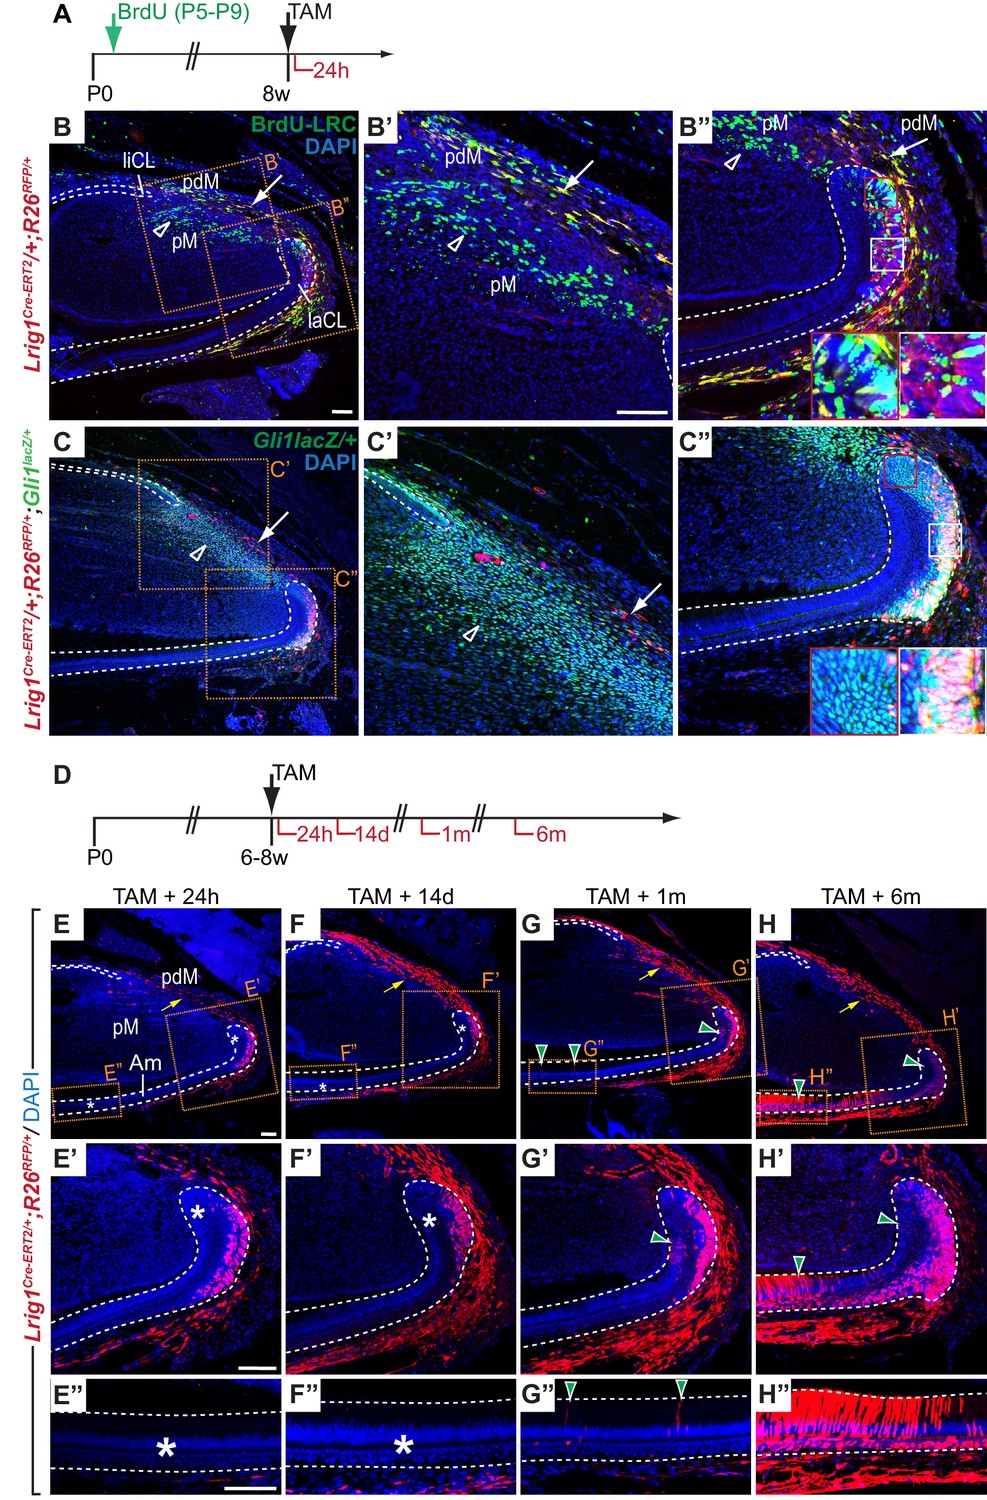
(A) Experimental design for testing Lrig1 expression by label-retaining cells (LRCs). BrdU was administered repeatedly to newborn Lrig1Cre-ERT2/+;R26RFP/+ mice (green arrows), followed by an injection-free period. Cre-mediated recombination of RFP was induced in Lrig1-expressing cells 24 hr prior to sacrifice (black arrows). (B–B”) A section of the incisor of an adult Lrig1Cre-ERT2/+; R26RFP/+ mouse stained with DAPI (blue), anti-RFP (red) and anti-BrdU (green), 24 hr after administration of Tamoxifen. Lrig1 is expressed by LRCs in the lower part of the labial cervical loop (laCL, white box in B” but not by LRCs in the upper laCL (red box in B”). Lrig1 expression in the proximal mesenchyme divides the mesenchymal BrdU-LRC population into Lrig1-negative (green, open arrowhead), pulp mesenchyme (pM)-specific and Lrig1-positive (yellow, white arrow), periodontal mesenchyme-specific subdomains. (C–C”) Lrig1-positive cells are found in incisor regions marked by Gli1lacZ-expression. Mesenchymal RFP-positive cells are rare in number when compared to Gli1lacZ-positive cells (arrow in C, C’) and absent from Gli1lacZ-expressing mesenchymal cells distal to the laCL and liCL (open arrowheads). Lrig1-positive cells in the laCL express Gli1lacZ (white box). RFP expression is absent from a population of Gli1lacZ-positive cells in the apical portion of the laCL adjacent to T-A cells (red box). (D) Dosing scheme for in vivo lineage tracing of Lrig1-positive cells. (E–H”) Lineage tracing of Lrig1-expressing cells 24 hr (E, E’, E”), 14 days (F, F’, F”), 1 month (G, G’, G”) and 6 months (H, H’, H”) after Tamoxifen induction. Asterisks indicate the absence of labeled epithelial cells. Green arrowheads denote newly formed labeled progeny in the T-A region or amongst differentiated ameloblasts (Am). Yellow arrows denote increase of labeled cells in the periodontal tissue over time. liCL, lingual cervical loop. Dashed lines delimit epithelium. Scale bars: 100 μm, C as in B; B”, C’, C” as in B’; F, G, H as in E; F’, G’, H’ as in E’; F”, G”, H” as in E”.
Figure 5—figure supplement 1
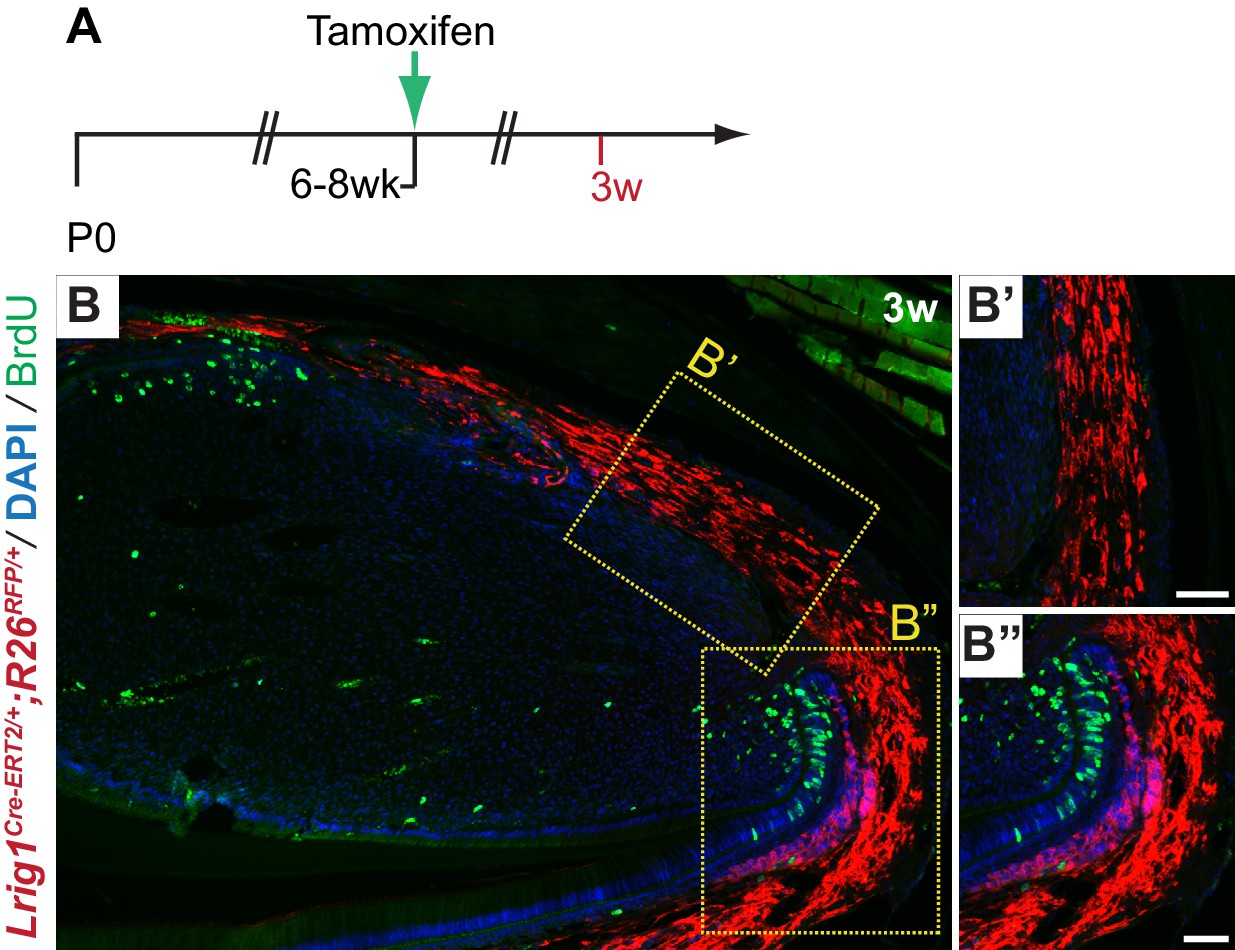
Periodontal tissue remain quiescent throughout Lrig1 lineage tracing.
(A) Experimental plan for in vivo lineage tracing. (B–B”) Detection of BrdU-positive cells in the Lrig1+/CreER;R26R+/RFP lineage tracing animals. No BrdU-positive cells were detected in the periodontal compartment (B’) in contrast to the adjacent laCL (B”).
Additional files
-
Supplementary file 1
Affiliation strengths (kME values) for all microarray probes with respect to all co-expression modules.
The table summarizes probe ID (Probe_ID), HGNC gene symbol (Gene), reference sequence ID (RefSeq_ID), average detection P-value for a probe over all samples (AvgDetPval), number of samples for which the detection P-value for a probe was nominally significant (p<0.05 – CountDetPval), indication of whether the probe is a seed gene for the module (Modseed), mean (log2) expression of the probe across all samples (MeanExpr), percentile rank of the probe’s mean (log2) expression level among all probes (MeanExprPercentile), module assignment based on expanded module definitions (positive correlation to module eigengene at < Bonferonni-corrected P-value [8.11e-08]- TopModPosBC_8.11e-08), module assignment based on expanded module definitions (positive correlation to module eigengene at <FDR-corrected P-value [0.012] – TopModPostFDR_0.012), and for each of the modules, correlation of the probe’s expression pattern across all incisor samples the eigengene (A-X.kME), and corresponding P-value for kME (A-X-pval). That information is provided for the 25,697 probes of the Unique Illumina HT12-v4 microarray used.
- https://doi.org/10.7554/eLife.24712.015
-
Supplementary file 2
Module association of factors expressed in the periodontal tissue compartment.
Microarray Probe ID information is listed for genes with previously demonstrated periodontal tissue-specific expression. For each detected transcript co-expression module association as derived from the kME table and a ranking score for specificity within the associated module are given. In case of representation by multiple microarray probes and assignment to more than one module ranking scores are listed for all modules. Factors associated with module cluster K-L-M are highlighted (orange). (a) Expression also in dental pulp. (b) Expression also in odontoblasts. (c) Probe on array detects Col4a2. (d) Probe on array detects Inta11. (e) Transcript detected only in 9/94 samples (average deection p-value: 0.304738). (f) Expression also in ameloblasts.
- https://doi.org/10.7554/eLife.24712.016
-
Supplementary file 3
Table of DIG-labeled probe information.
For each gene, the forward and reverse primer sequences are available, along with probe size and Reference Sequence.
- https://doi.org/10.7554/eLife.24712.017
-
Supplementary file 4
List of the primary and secondary antibodies used.
This table provides the list of primary and secondary antibodies used for immunofluorescent staining analysis, with their catalog number and working dilution.
- https://doi.org/10.7554/eLife.24712.018
Download links
A two-part list of links to download the article, or parts of the article, in various formats.
Downloads (link to download the article as PDF)
Open citations (links to open the citations from this article in various online reference manager services)
Cite this article (links to download the citations from this article in formats compatible with various reference manager tools)
Resolving stem and progenitor cells in the adult mouse incisor through gene co-expression analysis
eLife 6:e24712.
https://doi.org/10.7554/eLife.24712


