A synthetic planar cell polarity system reveals localized feedback on Fat4-Ds1 complexes
- Tel Aviv University, Israel
- Rice University, United States
Figures
Figure 1 with 1 supplement
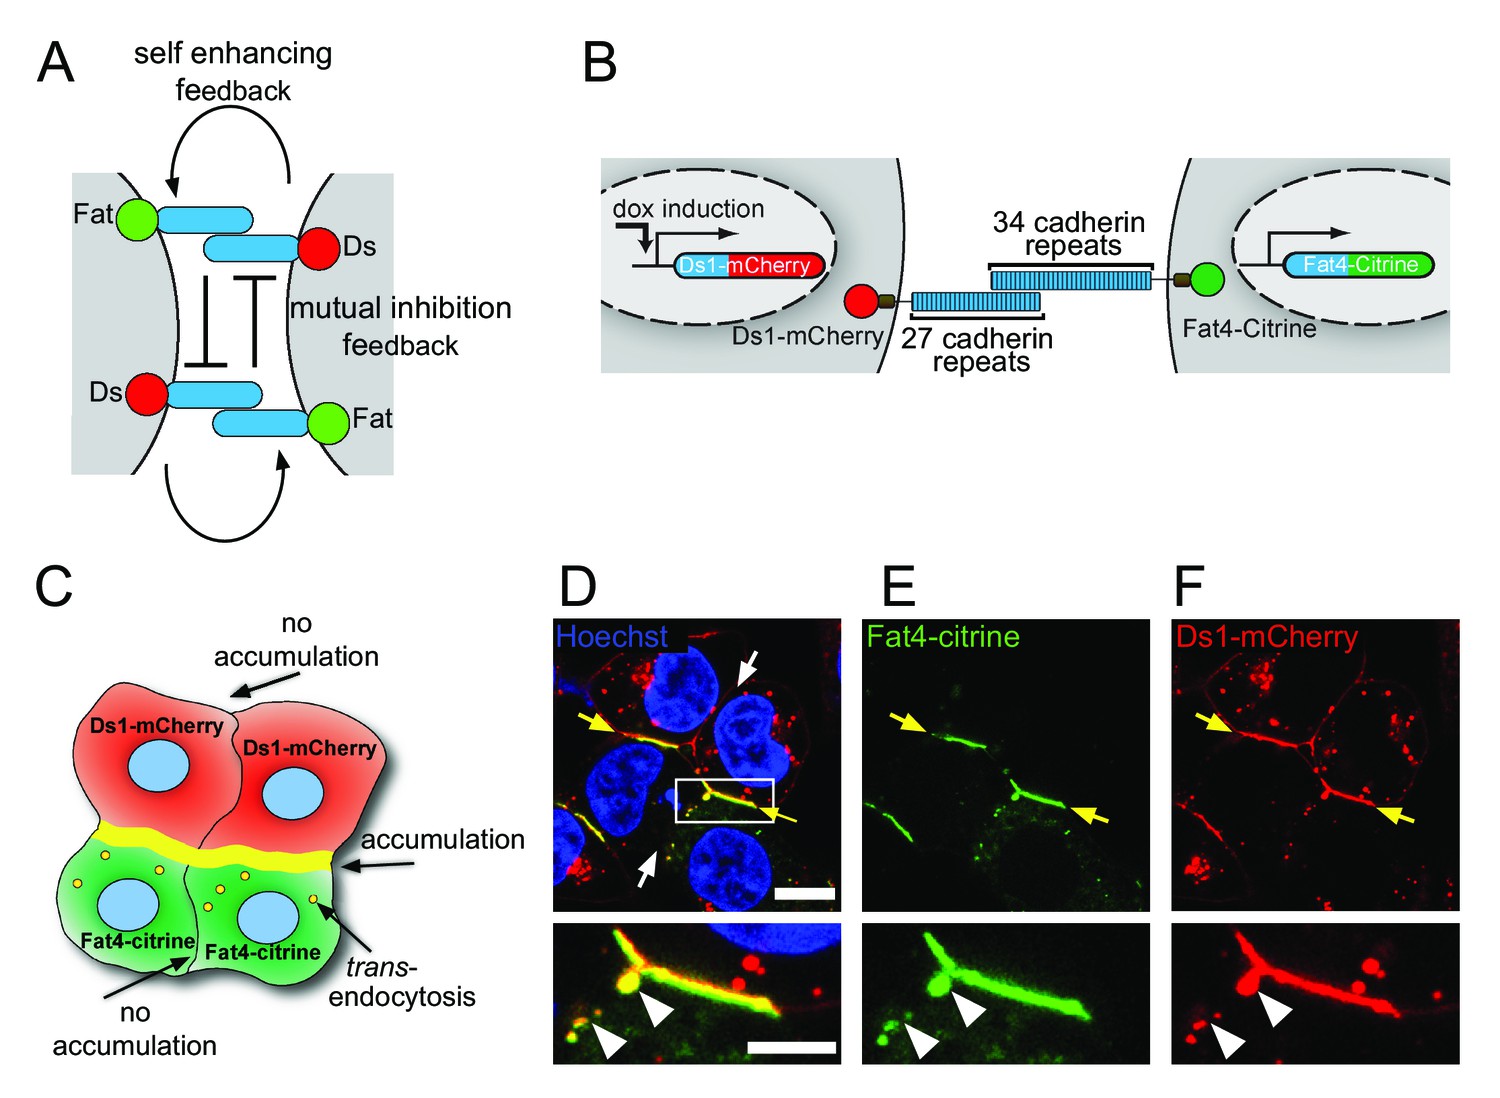
Fat4-Citrine and Ds1-mCherry accumulate on heterotypic boundaries.
(A) Schematic of the localized feedback hypothesis. (B) Schematic illustration of the stable cell lines and fusion constructs of Fat4-citrine and inducible Ds1-mCherry. (C) Schematic illustration of the cell-cell boundaries formed in a co-culture assay of Fat4-citrine (green) and Ds1-mCherry (red) cells. Yellow boundary represents accumulation at heterotypic boundaries. Yellow vesicles represent trans-endocytosis of Ds1-mCherry into Fat4-citrine expressing cells. (D–F) A co-culture of HEK-Fat4-citrine cells (green) and HEK-Ds1-mCherry cells (red). Strong accumulation is observed on heterotypic boundaries (yellow arrows). No accumulation is observed on homotypic boundaries (white arrows). Zoom in on the accumulation area (white box in D) demonstrates that Ds1-mCherry trans-endocytoses (white triangles) into Fat4-citrine expressing cell (but not vice-versa). Nuclei are stained with Hoechst (blue). Scale bar - 20 µm. Supplementary figure (Figure 1—figure supplement 1) shows Western blot analysis, monoculture images from Fat4-citrine and Ds1-mCherry cell lines and boundary accumulation in co-culture between MCF7-Fat4-citrine and MCF7-Ds1-mCherry cells.
Figure 1—figure supplement 1
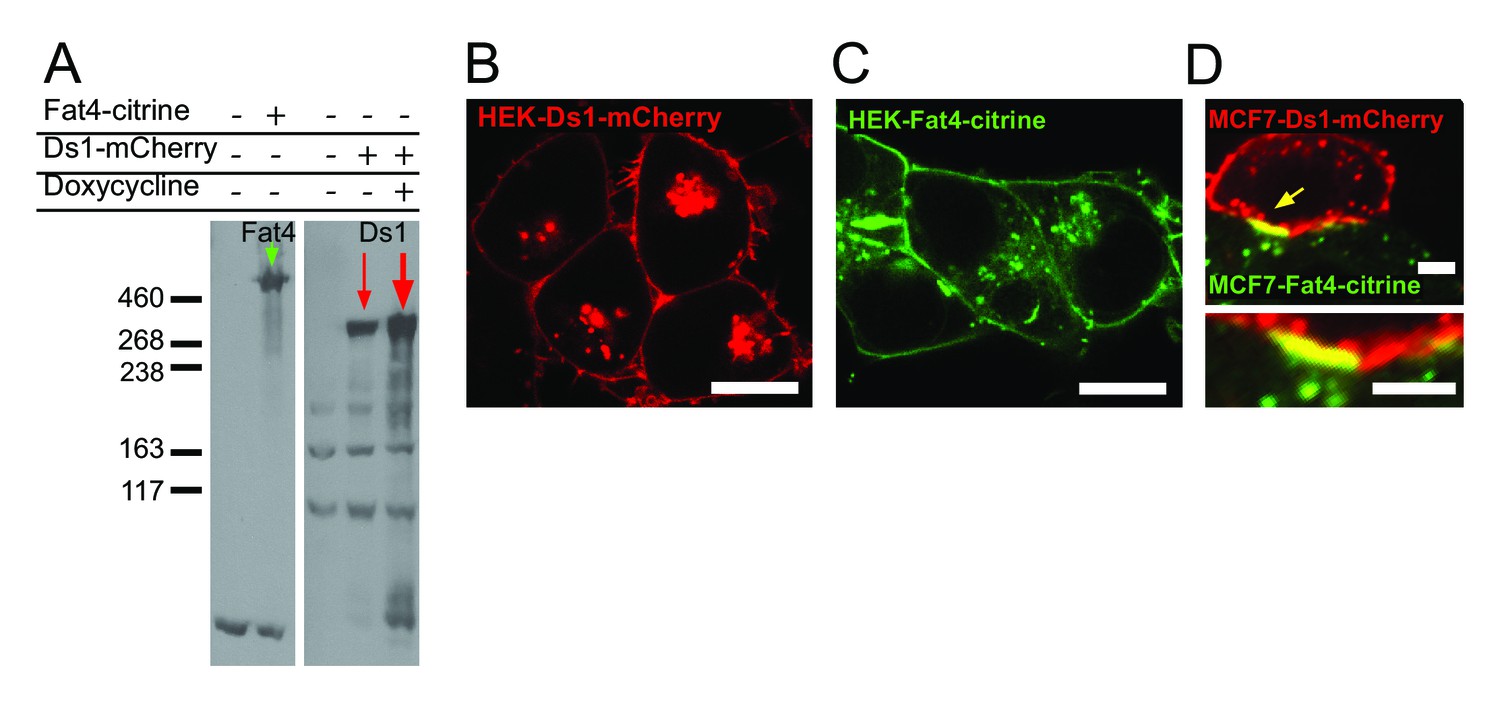
Fat4-citrine and Ds1-mCherry accumulate on heterotypic boundaries, but not on homotypic boundaries.
(A) Cell lysates from stable cell lines of HEK-Fat4-citrine and HEK-Ds1-mCherry were analyzed by Western blotting using anti-GFP and anti-mCherry antibodies. The high molecular bands are observed at the expected ~500 kDa for Fat4-citrine and ~320 kDa for Ds1-mCherry. (B–C) An image of monocultures of cells expressing Ds1-mCherry (B) and Fat4-citrine (C). No accumulation is observed at homotypic boundaries in monocultures. Scale bar −10 μm. (D) A co-culture of MCF7-Fat4-citrine cells (green) and MCF7-Ds1-mCherry cells (red). Heterotypic boundary exhibits accumulation (yellow arrow). Scale bar - 10 μm.
Figure 2 with 2 supplements
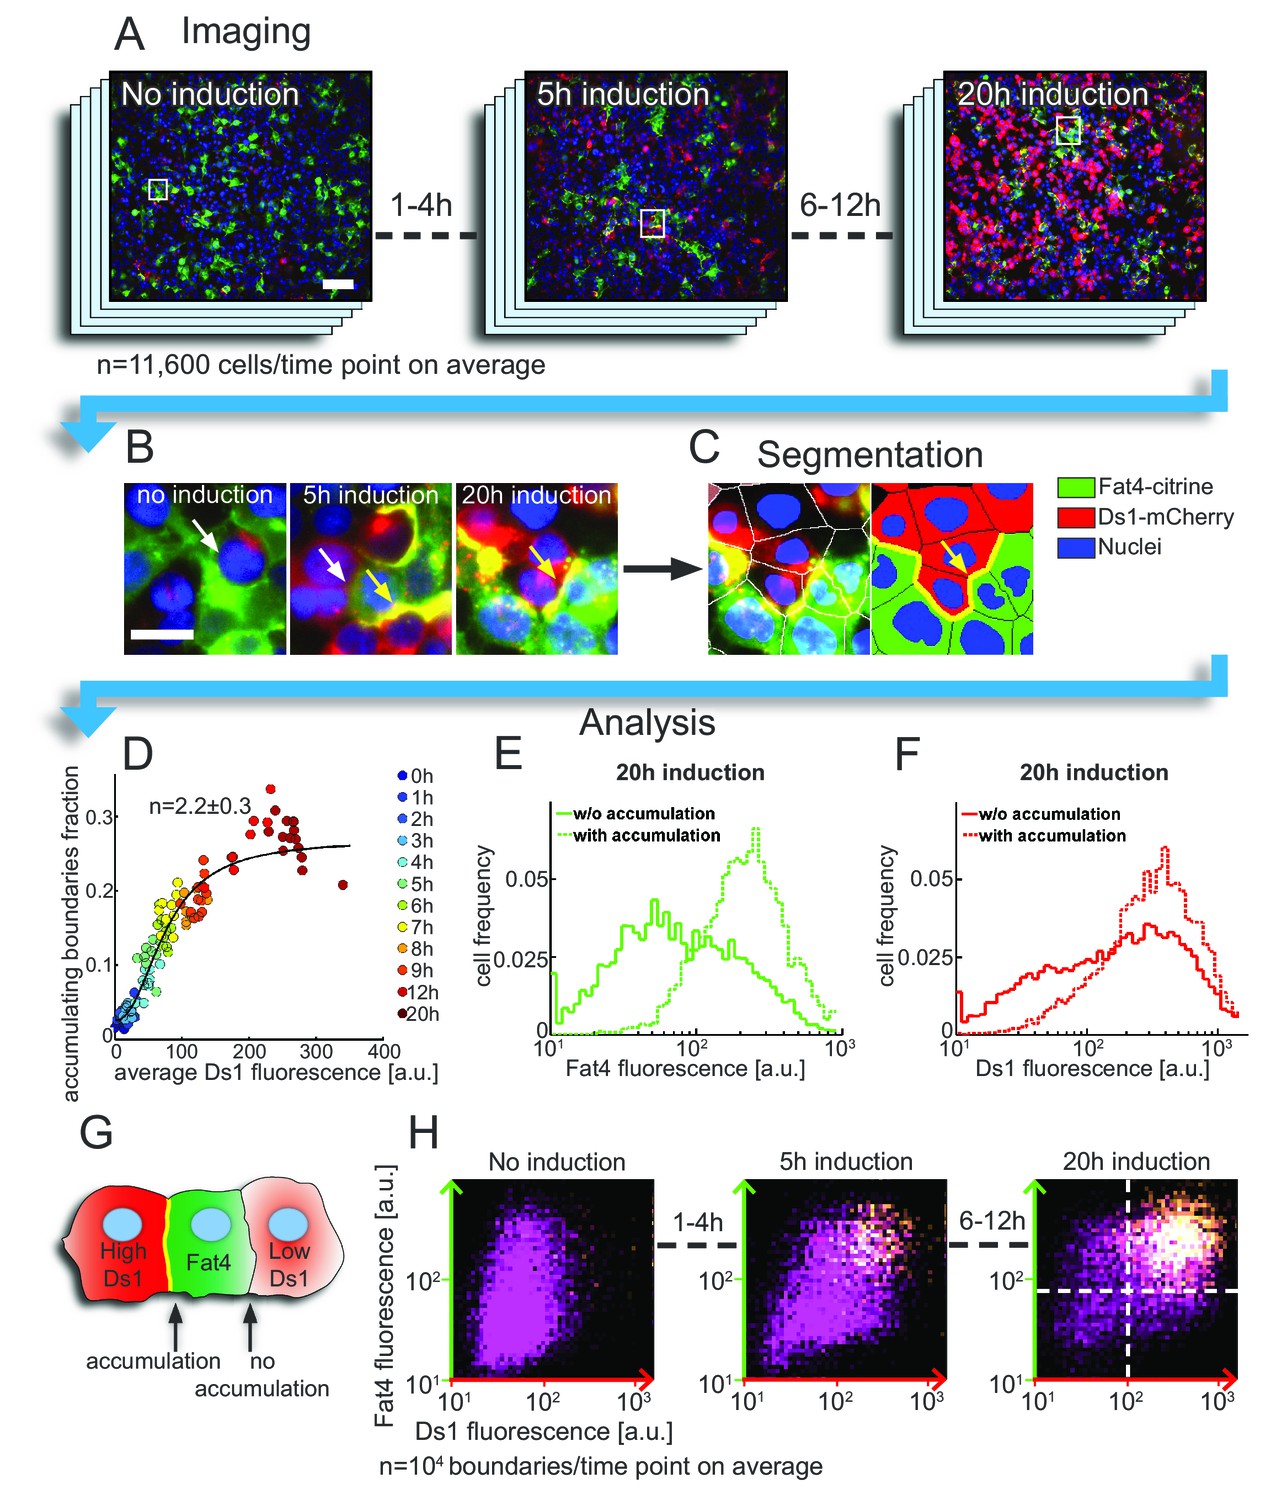
Accumulation on the boundary between cells requires threshold levels of Fat4-citrine and Ds1-mCherry.
(A–C) The analysis pipeline for Fat4-Ds1 boundary accumulation. (A) Snapshots of HEK-Fat4-citrine (green) and HEK-Ds1-mCherry (red) co culture, at different Ds1 induction times. Nuclei are stained with Hoechst (blue). Higher Ds1-mCherry (red) levels are observed for longer induction times. Scale bar −100 µm. (B) Zoom in on the areas marked with rectangles in (A) show both accumulating (yellow arrows) and non accumulating (white arrows) boundaries. Scale bar – 20 µm. (C) Segmentation of the 20 hr induction time point (right image in (B)). Left image shows overlay of the cell segmentation while right image shows the segmentation label for cell type and boundary accumulation (green – Fat4, red – Ds1, yellow – accumulating boundary, blue – nuclei). (D) Plot showing the increase in the fraction of accumulating boundaries with Ds1-mCherry levels. Different colors represent different doxycycline induction times. Hill function fit (solid line) gives a Hill coefficient of , showing nonlinear increase. The error on n represents 95% confidence interval of the fit. (E–F) Probability distribution functions (pdf) of the total (cytoplasm +boundary) Fat4-citrine levels (E) and Ds1-mCherry levels (F) in cells exhibiting accumulation on heterotypic boundaries (dashed lines) and in cells not exhibiting accumulation on heterotypic boundaries (solid lines). Pdf's shown are for the case of 20 hr doxycycline induction time. (G) Schematic of the defined 'accumulating' and 'non-accumulating' boundaries. (H) Two dimensional distributions of the expression levels of Fat4-citrine and Ds1-mCherry in cells flanking each boundary after 0, 5 and 20 hr induction with doxycycline. The brightness in the distribution corresponds to the frequency with which given levels of Ds1-mCherry (x-axis) and Fat4-citrine (y-axis) flank Fat4-Ds1 boundaries (see schematic in G). Both axes are on a logarithmic scale. The clear separation between ‘accumulating boundaries’ (yellow) and ‘non-accumulating boundaries’ (purple) indicates the threshold concentrations of Ds1 and Fat4 (dashed lines) above which a boundary is formed. Supplementary figure 1 (Figure 2—figure supplement 1) shows the average Ds1-mCherry expression, fraction of accumulation, and the distributions of accumulating and non-accumulating boundaries at all induction times. Supplementary figure 2 (Figure 2—figure supplement 2) shows the results of a duplicate experiment but with slightly different Ds1 induction rates.
-
Figure 2—source data 1
A source data used to produce Figure 2, Figure 2—figure supplement 1 and Figure 2—figure supplement 2.
The excel file contain two tabs corresponding to the two experimental sets. The rows include: IDs_xh are the Ds values for every cell in a batch, IFat_xh are the Fat values for every cell in a batch, IFatDsAccumulating_xh are the Fat and Ds values of cell that have accumulation boundaries, and IFatDsNonAccumulating_xh are Fat and Ds values for cells that share a Fat-Ds interface without accumulation.
- https://doi.org/10.7554/eLife.24820.007
Figure 2—figure supplement 1
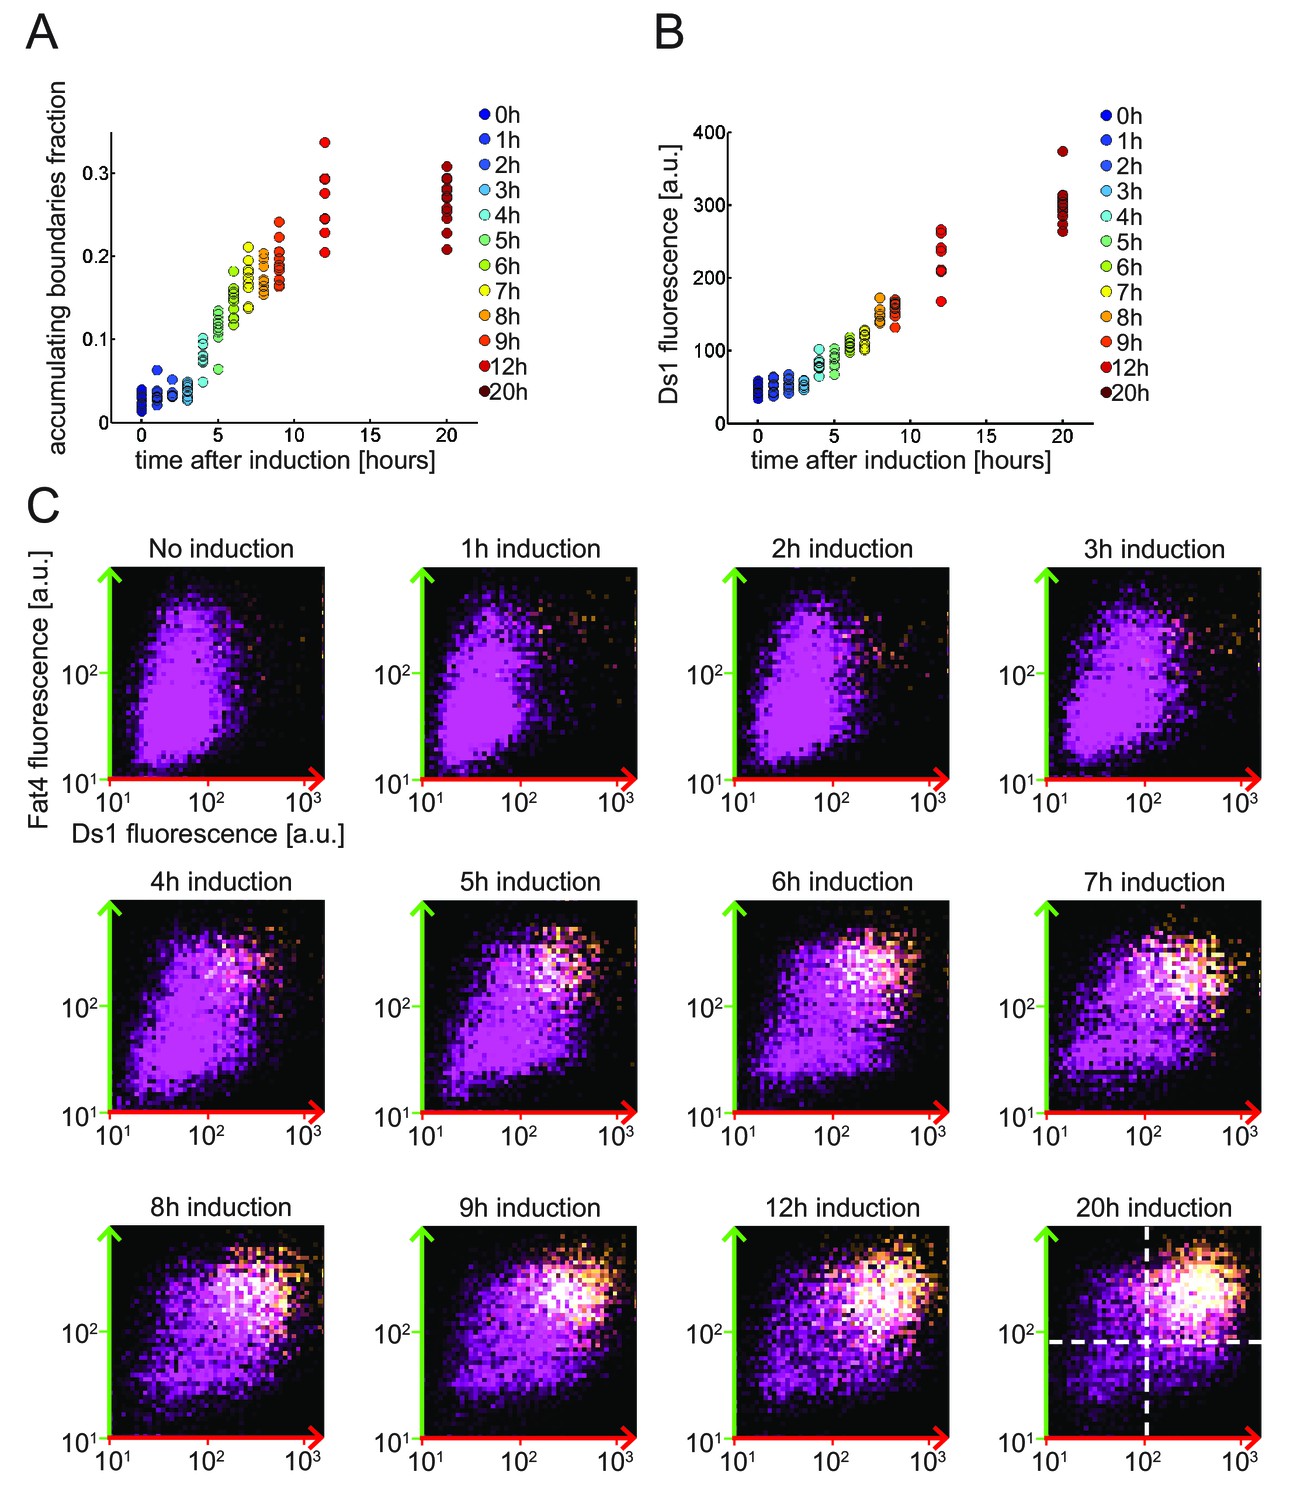
Accumulation on the boundary requires high levels of both Fat4 and Ds1.
(A–B) The fraction of cells with accumulation at their boundaries (A) and the average Ds1-mCherry level in each image (B) increase as a function of induction time. Each dot represent the value obtained from one image. (C) Two dimensional distributions of the expression levels of Fat4-citrine and Ds1-mCherry in cells flanking each boundary. The plots demonstrate the distributions at different induction times as described in Figure 2. The brightness in the distribution corresponds to the frequency with which given levels of Ds1-mCherry (x-axis) and Fat4-citrine (y-axis) flank Fat4-Ds1 boundaries, with yellow for 'accumulating boundaries' and purple for 'non-accumulating boundaries'. Both axes are on a logarithmic scale.
Figure 2—figure supplement 2
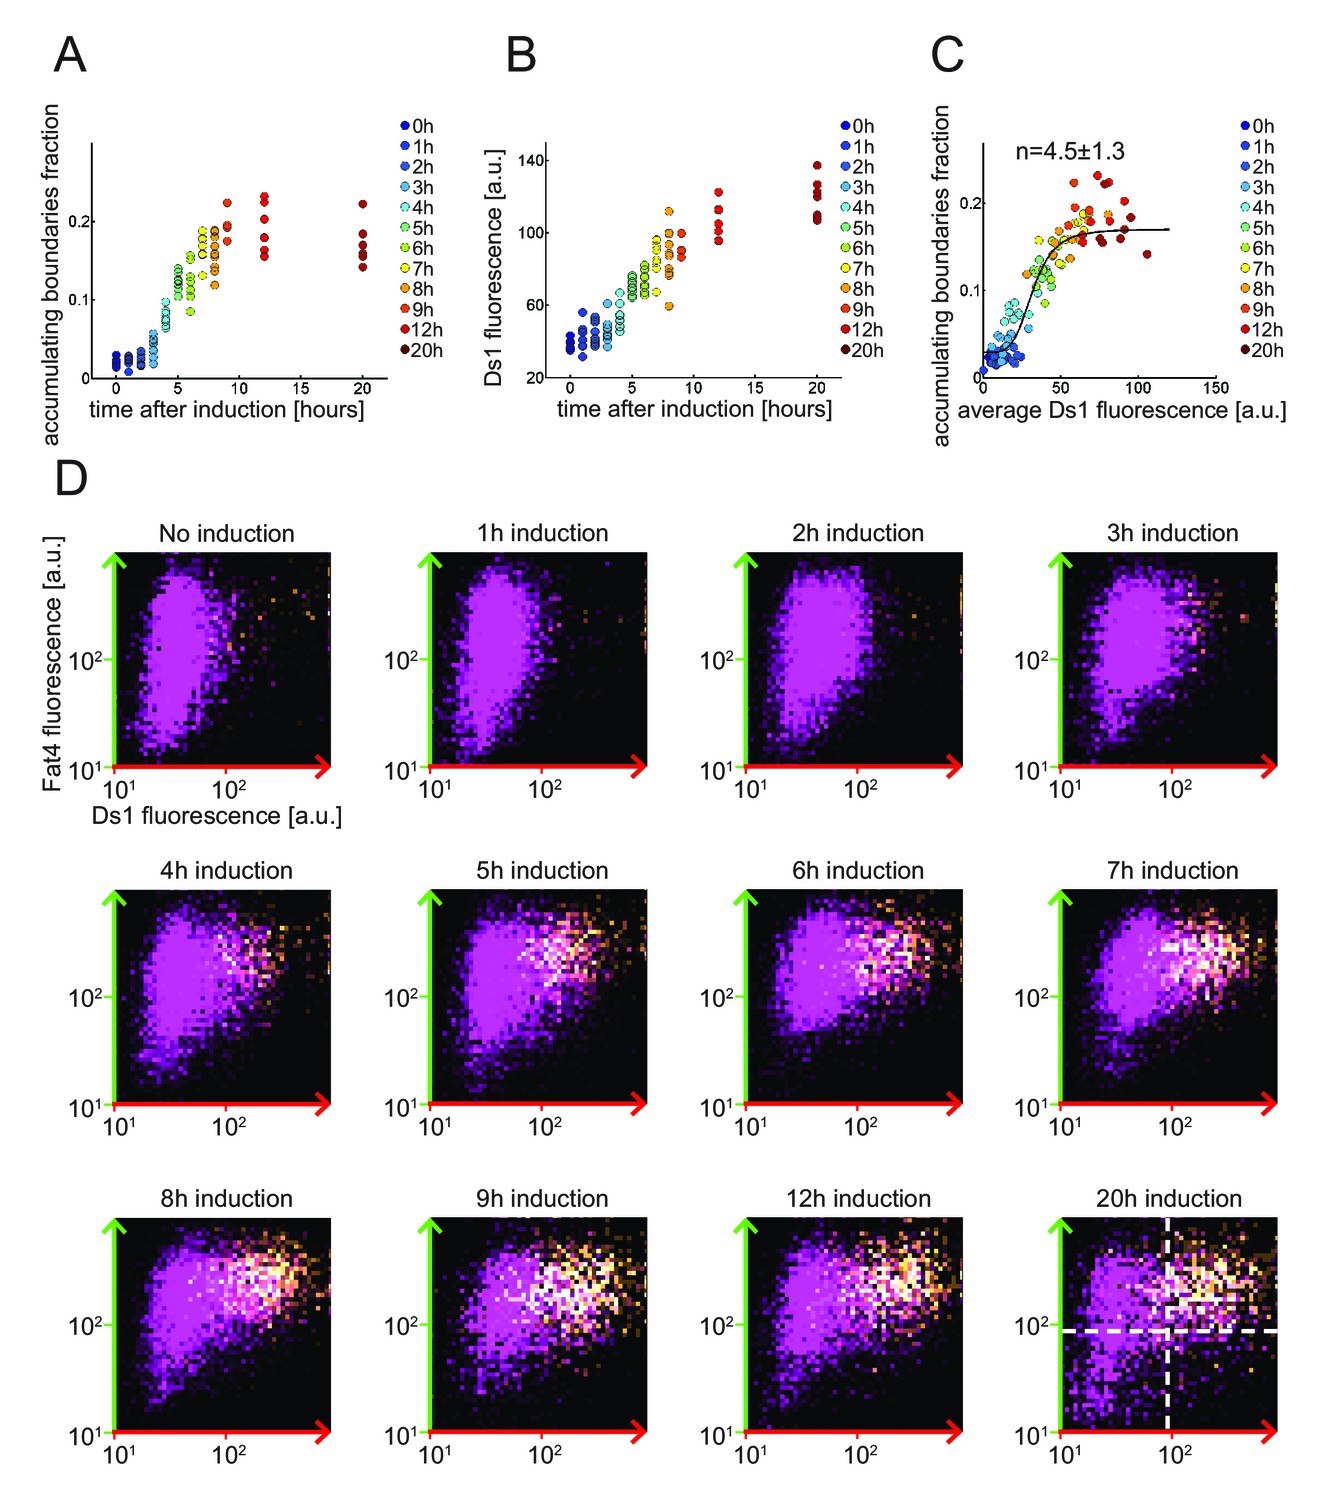
Accumulation on the boundary requires high levels of both Fat4 and Ds1.
Analysis of a second experiment similar to the one shown in Figure 2 and figure 2—figure supplement 1. In this experiment Ds1 induction levels were lower. (A-B) The fraction of cells with accumulation at their boundaries (A) and the average Ds1-mCherry level in each image (B) increase as a function of induction time. Each dot represent the value obtained from one image. (C) Plot showing the increase in the fraction of accumulating boundaries with Ds1-mCherry levels. Different colors represent different doxycycline induction times. Hill function fit (solid line) gives a Hill coefficient of n = 4.5 ± 1.3, showing nonlinear increase. The error on n represents 95% confidence interval of the fit. (D) Two dimensional distributions of the expression levels of Fat4-citrine and Ds1-mCherry in cells flanking each boundary. The plots demonstrate the distributions at different induction times as described in Figure 2. The brightness in the distribution correspond to the frequency with which given levels of Ds1-mCherry (x-axis) and Fat4-citrine (y-axis) flank Fat4-Ds1 boundaries, with yellow for 'accumulating boundaries' and purple for 'non-accumulating boundaries'. Both axes are on a logarithmic scale.
Figure 3 with 2 supplements
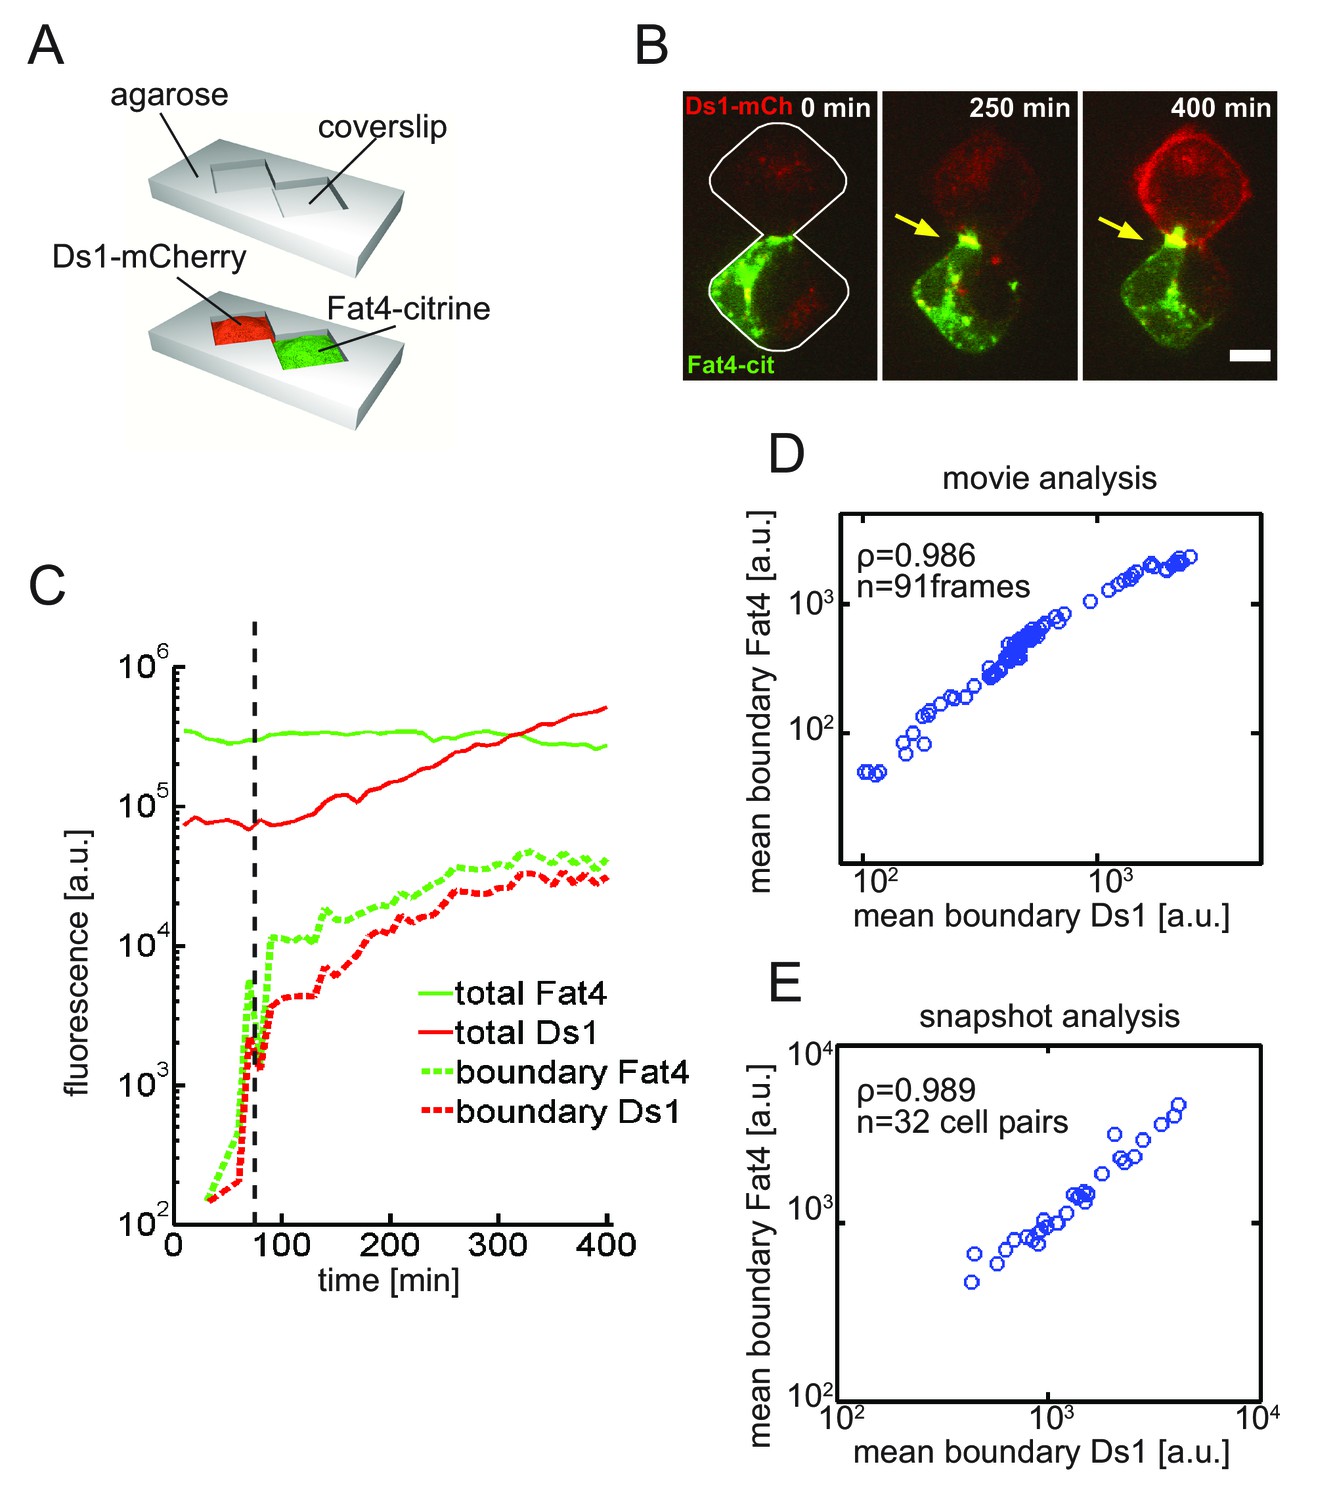
Live imaging of Fat4-Ds1 accumulation dynamics reveals threshold response to Ds1 levels at the single cell.
(A) Schematic of the two-cell assay. In this assay two cells are restricted to a bowtie-shaped microwell allowing imaging of accumulation dynamics over time. (B) A filmstrip showing a movie in the two-cell assay with HEK-Fat4-citrine cell (green) co-cultured with a HEK-Ds1-mCherry cell (red) (see Video 1). Imaging started after the addition of the 100 ng/ml doxycycline. Each image in the filmstrip is a sum of 8 z-slices encompassing the total width of the cells. As Ds1 levels increases, both proteins co-localize and accumulate at the cell boundary (yellow arrow). Scale bar - 10 μm. (C) Quantitative analysis of accumulation dynamics. The levels of total cellular Fat4-citrine (green solid line), total cellular Ds1-mCherry (red solid line), boundary Ds1-mCherry (red dashed line), and boundary Fat4-citrine (green dashed line) are plotted as a function of post-induction time. The fluorescence of both proteins exhibit a threshold response (black dashed line). (D–E) Mean boundary levels of Fat4-citrine and Ds1-mcherry are proportional to each other. Analysis of the single cell movie (D) and snapshots (E) shows that Fat4 and Ds1 fluorescence at the accumulating boundary are proportional to each other. ρ and n, correspond to the Pearson correlation coefficient and the number of frames, respectively. Supplementary figure 1 (Figure 3—figure supplement 1) shows accumulation dynamics of free co-culture experiments and the non-linear accumulation of all movies shown here. Supplementary figure 2 (Figure 3—figure supplement 2) shows the distribution and dynamics of membrane Ds1 vs. total Ds1 in the cell.
Figure 3—figure supplement 1
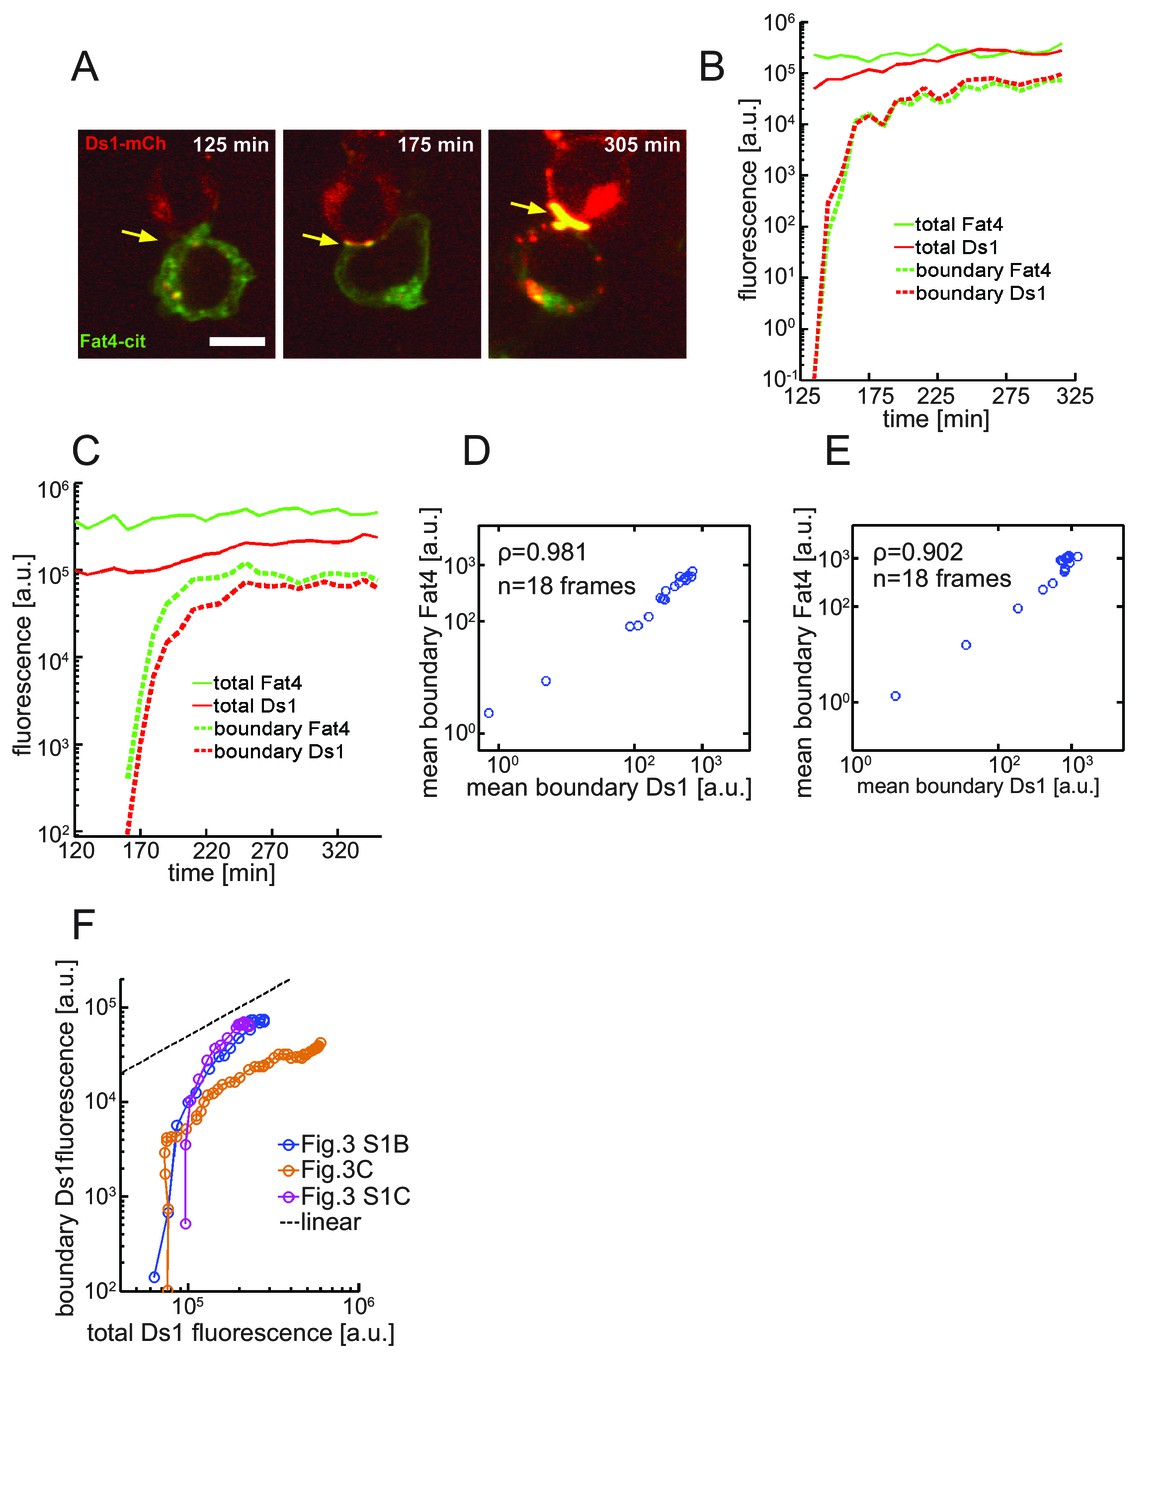
Live imaging of Fat4-Ds1 accumulation dynamics in free co-culture reveals threshold response to Ds1 levels.
(A) A filmstrip showing a movie from a free co-culture (i.e. not in a two cell assay) with Hek-Fat4-Citrine cell (green) co-cultured with a Hek-Ds1-mCherry cell (red). Imaging started two-hours after the addition of 100 ng/ml doxycycline. Each image in the filmstrip is a sum of 13 z-stacks encompassing the total width of the cells. As Ds1 levels increase, both proteins co-localize and accumulate at the cell boundary (yellow arrow). Scale bar - 10 μm. (B–C) Quantitative analysis of accumulation dynamics in two free co-culture movies. Here (B) is the analysis of the movie shown in (A) and (C) is the analysis of an additional free co-culture movie (not shown). The levels of total cellular Fat4-Citrine (green solid line), total cellular Ds1-mCherry (red solid line), boundary Ds1-mCherry (red dashed line), and boundary Fat4-citrine (green dashed line) are plotted as a function of post-induction time. Scale bar - 10 μm. (D–E) Analysis of the single cell movies in (B–C) shows that Fat4 and Ds1 fluorescence at the accumulating boundary are proportional to each other. (F) A log-log plot of Ds1 levels on the accumulating boundaries as a function of total Ds1 levels in the cell. The three plots correspond to the data shown in Figure 3C (orange), Figure 3—figure supplement 1B (blue), and Figure 3—figure supplement 1C (purple). Slopes higher than 1 (black dashed line) indicate non-linear accumulation of Fat4-Ds1 complexes as a function of Ds1 in the cell.
Figure 3—figure supplement 2
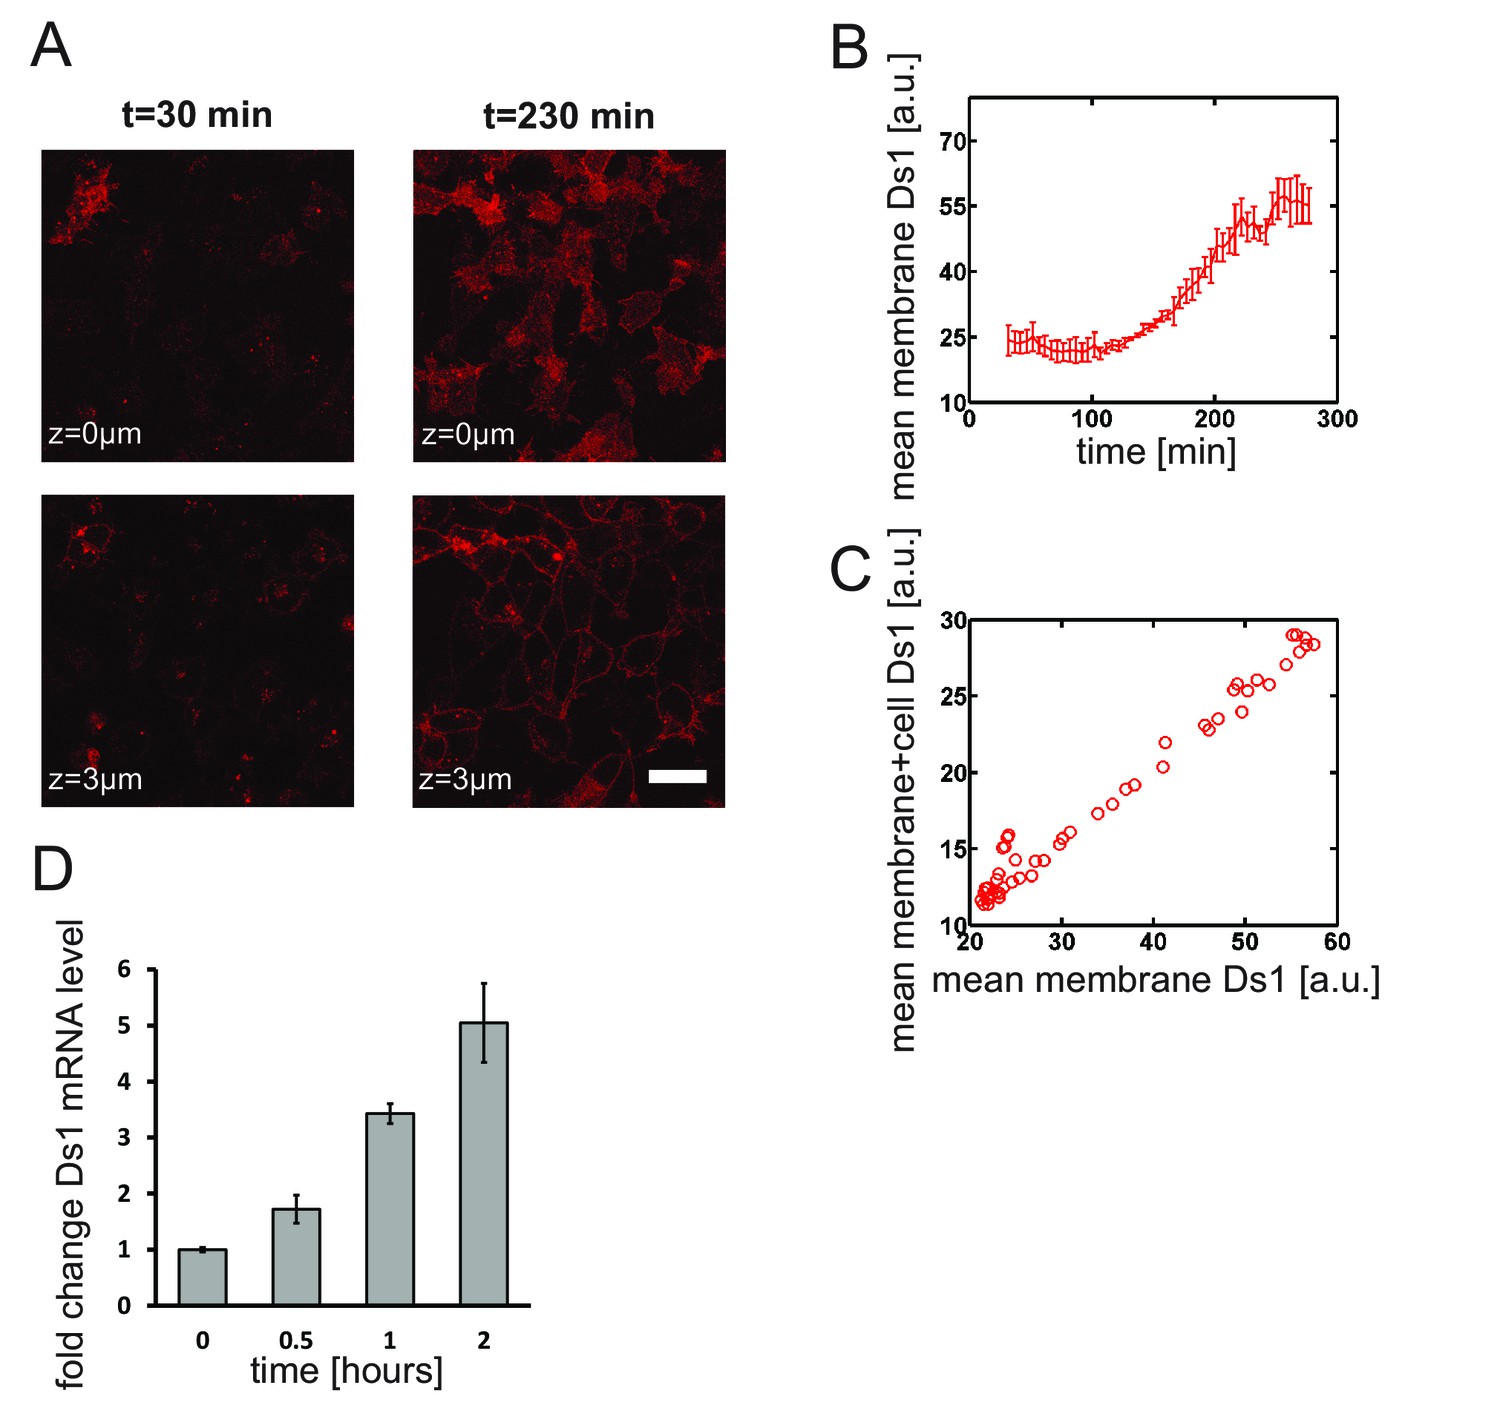
The membrane fraction of Ds1 mCherry is large and proportional to the total Ds1-mCherry in the cell.
(A) Snapshot from a confocal time-lapse movie tracking dynamics and localization Ds1-mCherry levels in Hek-Ds1-mCherry cells. Ds1-mCherry was imaged at 7 z-planes. 1 μm apart, every 5 min, starting 32 min after doxycycline induction. Ds1-mCherry is localized both to the cell membrane (z = 0 μm plane) and to intracellular vesicles (see intracellular spots inside the cells at z = 3 μm plane). Scale bar - 10 μm. (B) The mean Ds1-mCherry level at the z = 0 μm plane, corresponding to the membrane fluorescence, as a function of time. Fluorescence of Ds1-mCherry levels starts increasing about 100 min after doxycycline induction. The data shown is an average of four movies and the error bar represent the standard error of the mean. This delay is probably due to finite maturation time of Ds1-mCherry. (C) The mean membrane Ds1-mCherry level (measures at z = 0 μm) is proportional to the mean total Ds1 mCherry levels (mean over all z-planes). (D) Fold change in Ds1 mRNA levels measured by qPCR show that the expression increases linearly in the first 2 hr showing that the delay in fluorescence levels observed in (B) is not due to delay in expression. Ds1 mRNA levels in each sample were normalized to GAPDH mRNA. Fold change is measure with respect to the mRNA levels with no doxycycline induction (t = 0). The values shown are the average of three independent repeats and the error bars represent the standard error of the mean.
Figure 4 with 1 supplement
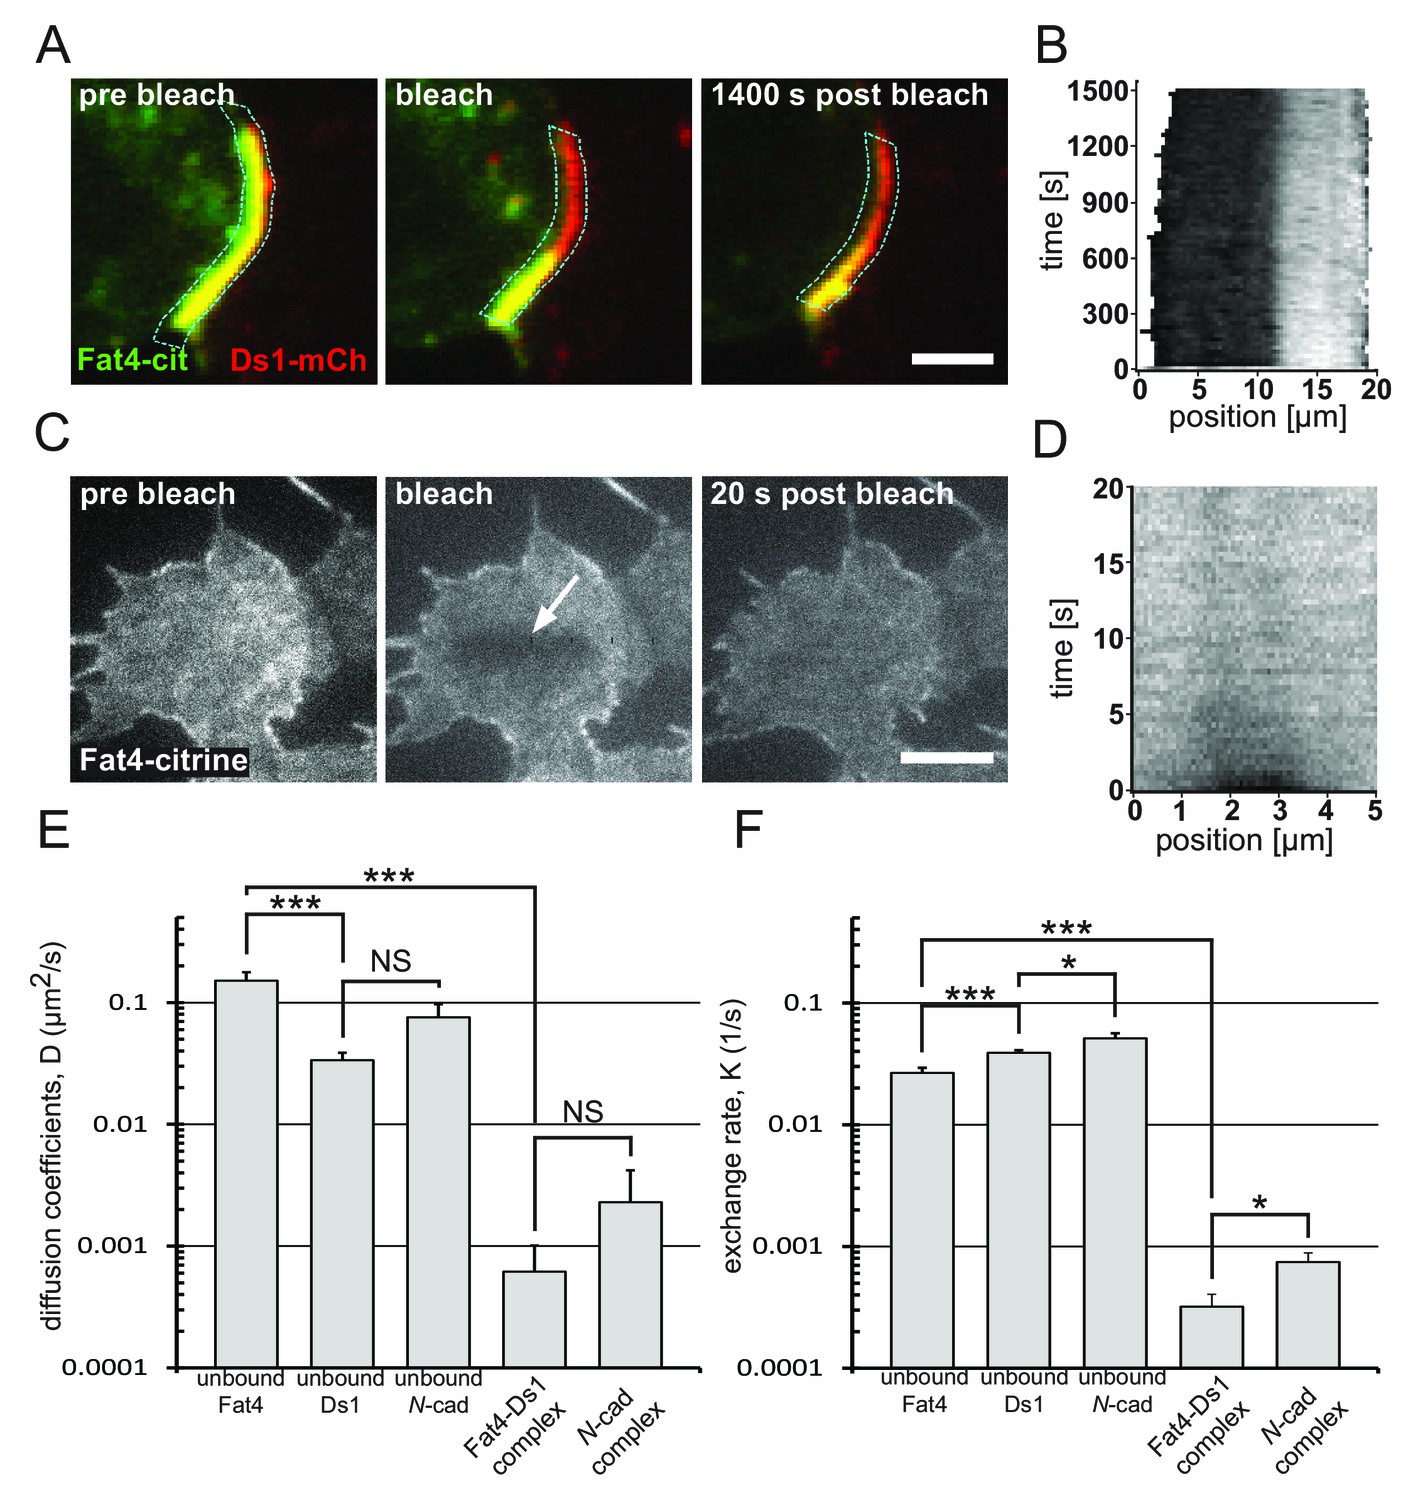
Bound Fat4-Ds1 complexes on the boundary are more stable than unbound Fat4 and Ds1.
(A) A filmstrip showing a fluorescence recovery after photobleaching (FRAP) experiment on a boundary exhibiting accumulation (yellow) of Fat4-citrine (green) and Ds1-mCherry (red). (see Video 2) (B) A kymograph showing the fluorescence recovery profile along the boundary outlined in blue in (A). The fluorescence level (gray scale) is shown as a function of the position along the boundary (x-axis), and the time after photobleaching (y-axis). (C) A filmstrip from FRAP-TIRF experiment on a cell that express Fat4-citrine (see Video 3). Arrow indicates the bleached area. (D) A kymograph showing the fluorescence recovery profile in the bleached area in (C). Almost full recovery of the bleached area is obtained after 20 s. Scale bars - 5 μm. (E–F) Distributions of Diffusion coefficients (E) and exchange rates (F) obtained from analysis of FRAP experiments as those shown in (A–D). * and *** correspond to p-value<0.05 and p-value<0.001, respectively, as estimated by t-test. The number of experiments for each sample are: unbound Fat4 n = 29, unbound Ds1 n = 36, unbound N-cadherin n = 21, Fat4-Ds1 complex n = 10, N-cadherin complex n = 11. Error bars correspond to SEM. Supplementary figure (Figure 4—figure supplement 1) shows the analysis for unbound Ds1-mcherry, unbound N-cadherin-GFP, and the bound N-cadherin complex.
Figure 4—figure supplement 1
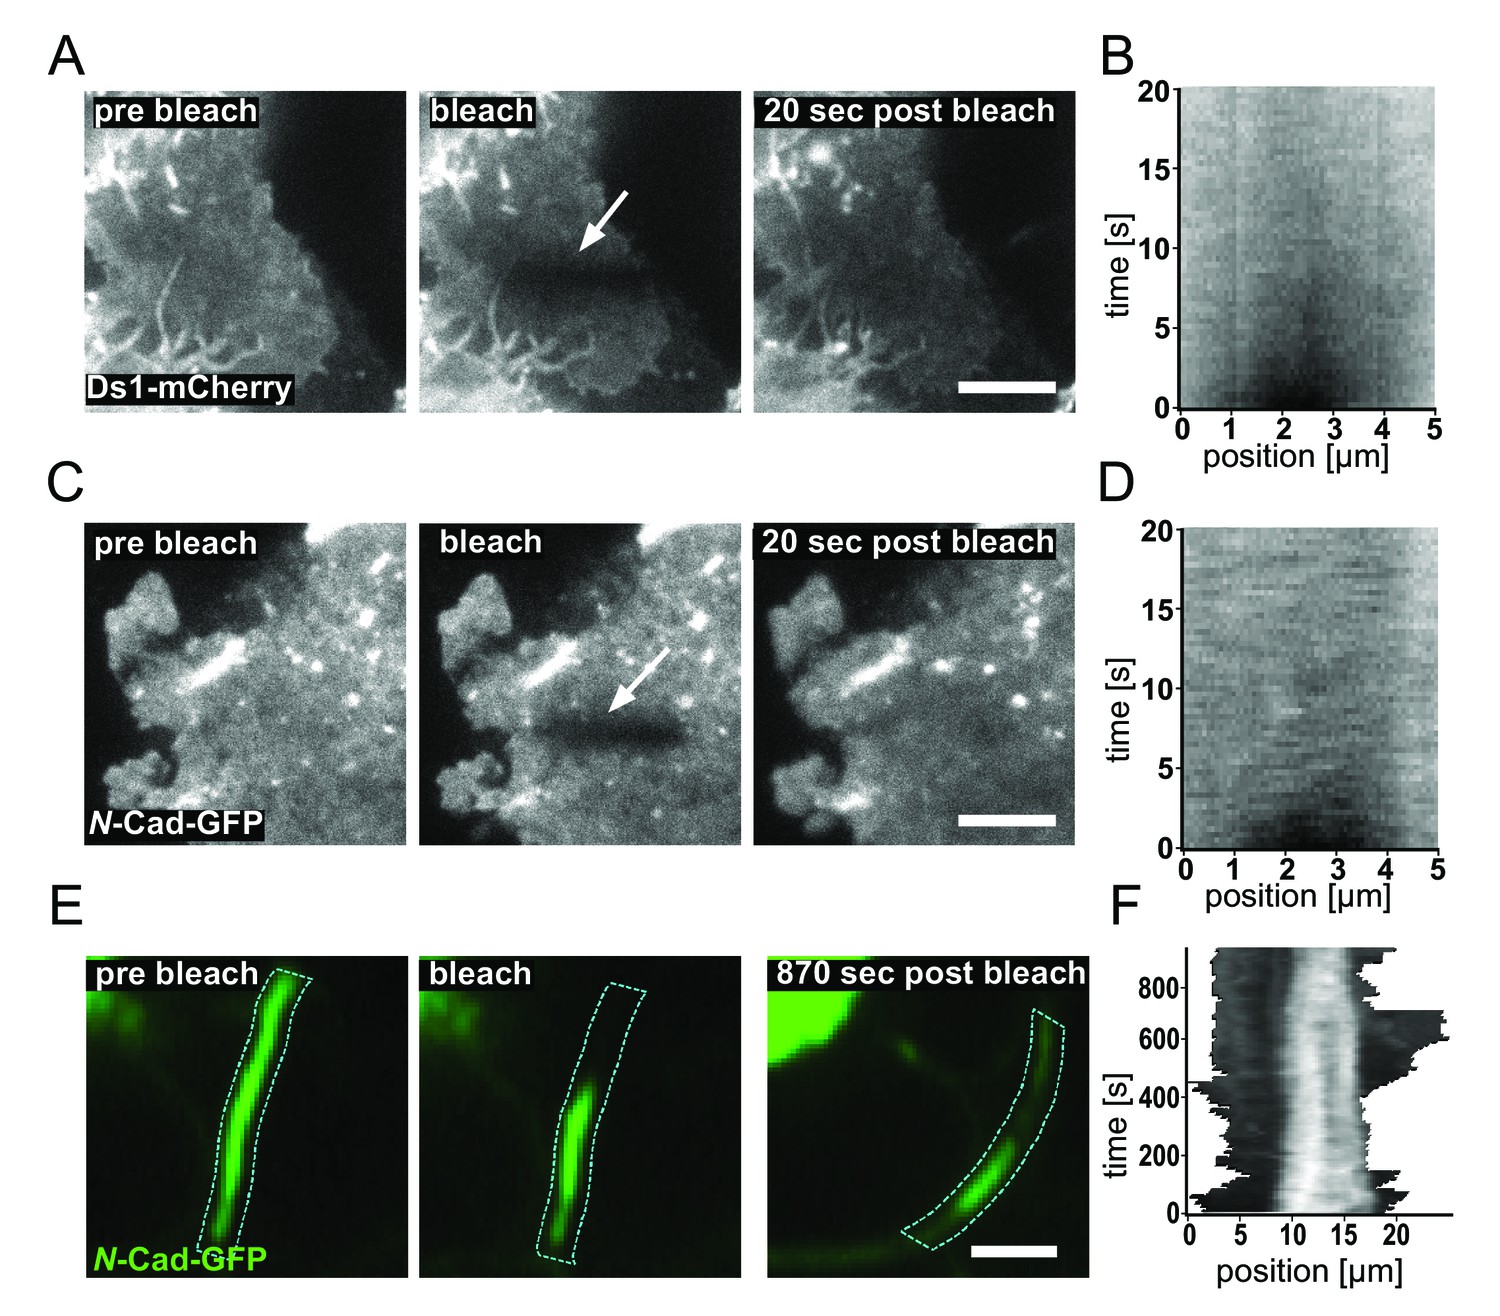
Unbound Ds1-mCherry and N-cadherin-GFP exhibit fast membrane dynamics.
(A–D) Filmstrips and analysis of FRAP-TIRF experiments on Hek293 cells express Ds1-mCherry (A–B) and N-cadherin-GFP (C–D). Scale bar - 5 μm. For the N-cadherin experiments, Ds1-mCherry cells were transiently transfected with N-cadherin-GFP constructs. Frapped region is indicated by arrows. (B,D) Kymographs showing the fluorescence recovery profile in (A) and (C), respectively. The fluorescence level (gray scale) is shown as a function of the position along the bleached area (y-axis), and the time after photobleaching (x-axis). (E) A filmstrip showing a FRAP experiment on a boundary exhibiting accumulation of N-cadherin-GFP. The experiment was performed in a similar way to the FRAP experiments with Fat4-citrine and Ds1-mCherry accumulating boundaries (Figure 4A). (F) A kymograph showing the recovery profile in (E).
Figure 5 with 1 supplement

Fat4-citrine and Ds1-mCherry fluorescence at the boundary between cells are shifted by 100–200 nm.
(A) A high resolution image of a boundary exhibiting a ‘rainbow’ feature (composed of three stripes green, yellow and red; white arrow) indicating a shift between red and green fluorescence. Scale bar - 5 μm. (B) An illustration of the observed ‘rainbow’ feature. (C) A straightened version of the boundary shown in A (top). Fluorescence profiles (bottom) of Fat4-citrine (green) and Ds1-mCherry (red) along lines perpendicular to the boundary. Mean gap size for this boundary is as indicated (D) Probability distribution function of the distance between the peaks in the fluorescence profiles. Mean gap width for 61 boundaries as indicated. Supplementary figure (Figure 5—figure supplement 1) shows control experiments in MCF7 cells, super resolution STED images, and rainbows after correction of chromatic aberrations.
Figure 5—figure supplement 1
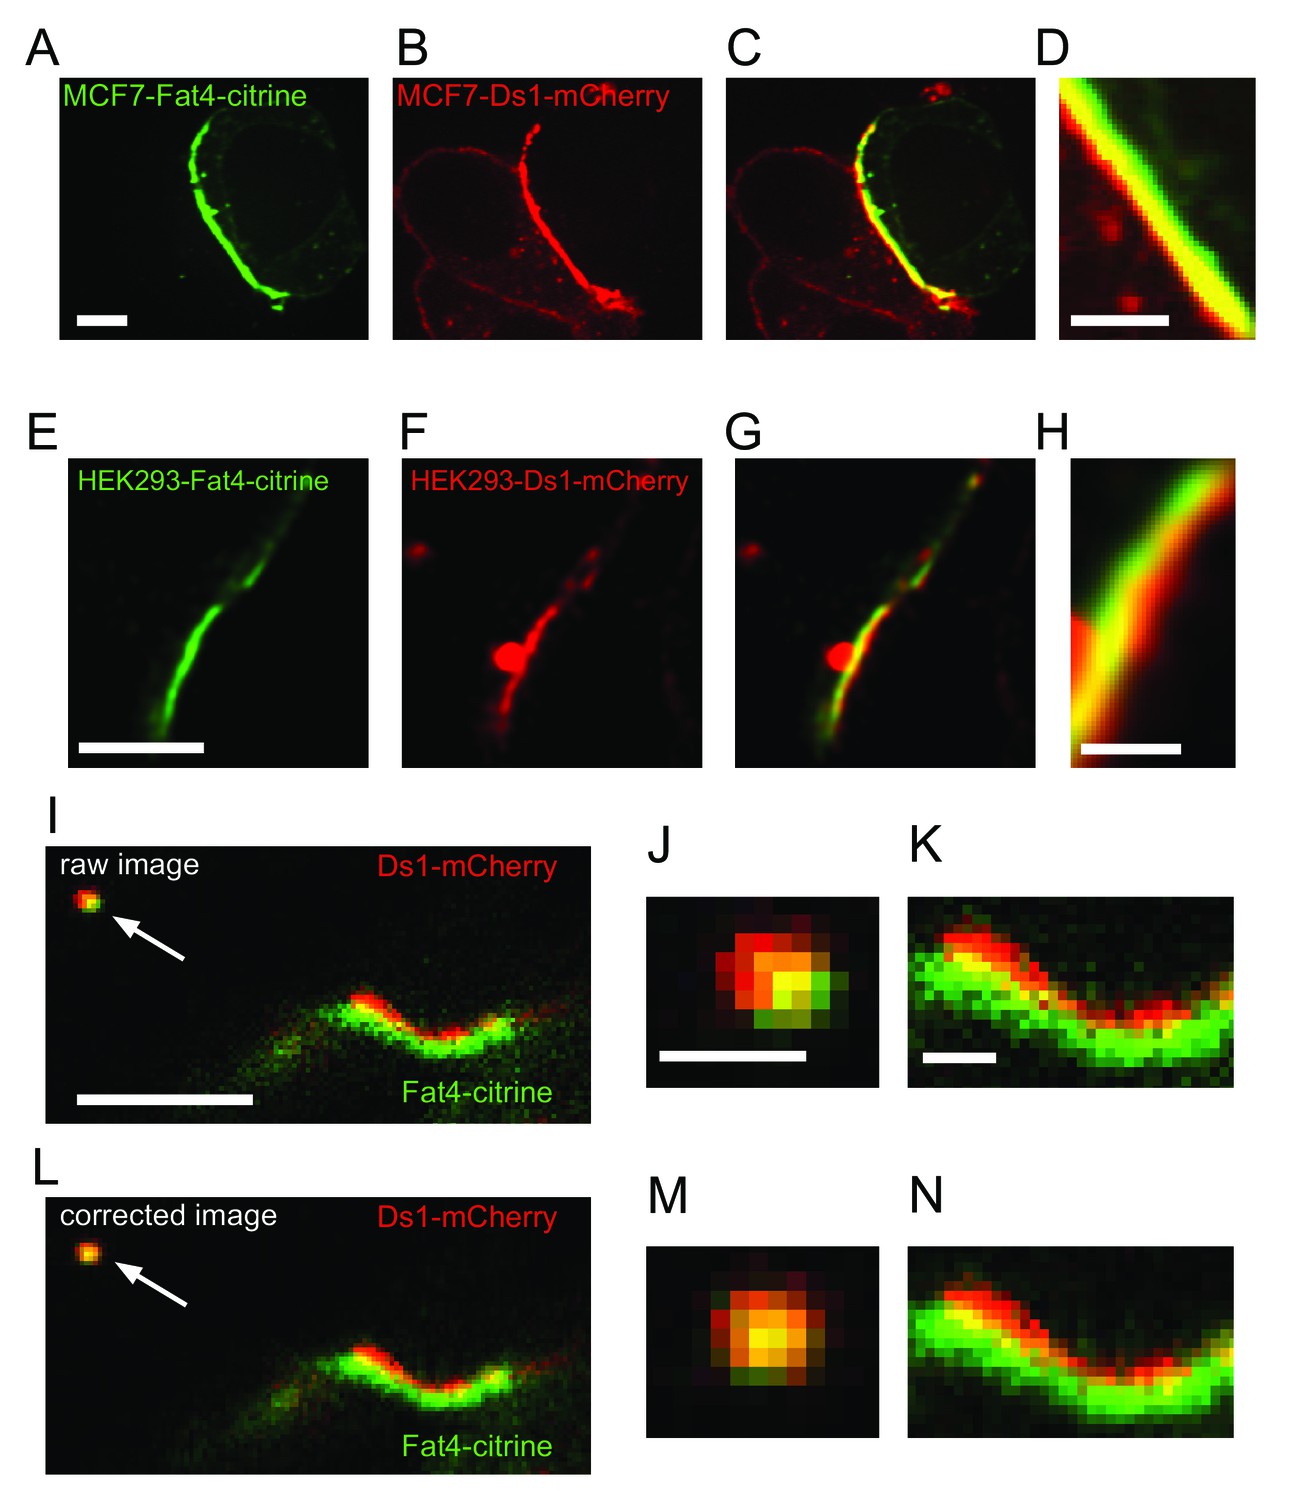
The rainbow feature is observed in other cell types and with super resolution microscopy.
(A–C) A rainbow feature observed in a confocal image of a co-culture of Fat4-citrine and Ds1-mCherry in MCF7 cells. Scale bar - 10 μm. (D) A zoom in on the boundary in (C). Scale bar - 2 μm. (E–G) A super-resolution image of the rainbow feature in a stimulated emission depletion (STED) microscope (Here, the co-culture is the same as Figure 5A). Scale bar - 2 μm. (H) A zoom in on the boundary in (G). Scale bar - 0.5 μm. (I–N) High resolution confocal images of a rainbow next to a 100 nm tetraspeck bead (marked by an arrow). (I) A raw image of the boundary without any correction. Scale bar - 2.5 μm. (J) A zoom in on the bead in (I). (K) A zoom in on the boundary in (I). Scale bar - 0.5 μm. (L) The image in (I) after correction of chromatic aberration. The correction of chromatic aberration was performed by applying global conformal transformation over the whole image (not shown) that minimizes the distances between the centers of the beads in the two channels. While the correction eliminates the shift between the two channels on the bead (M), the rainbow feature in the boundary is maintained (L,N).
Figure 6 with 1 supplement
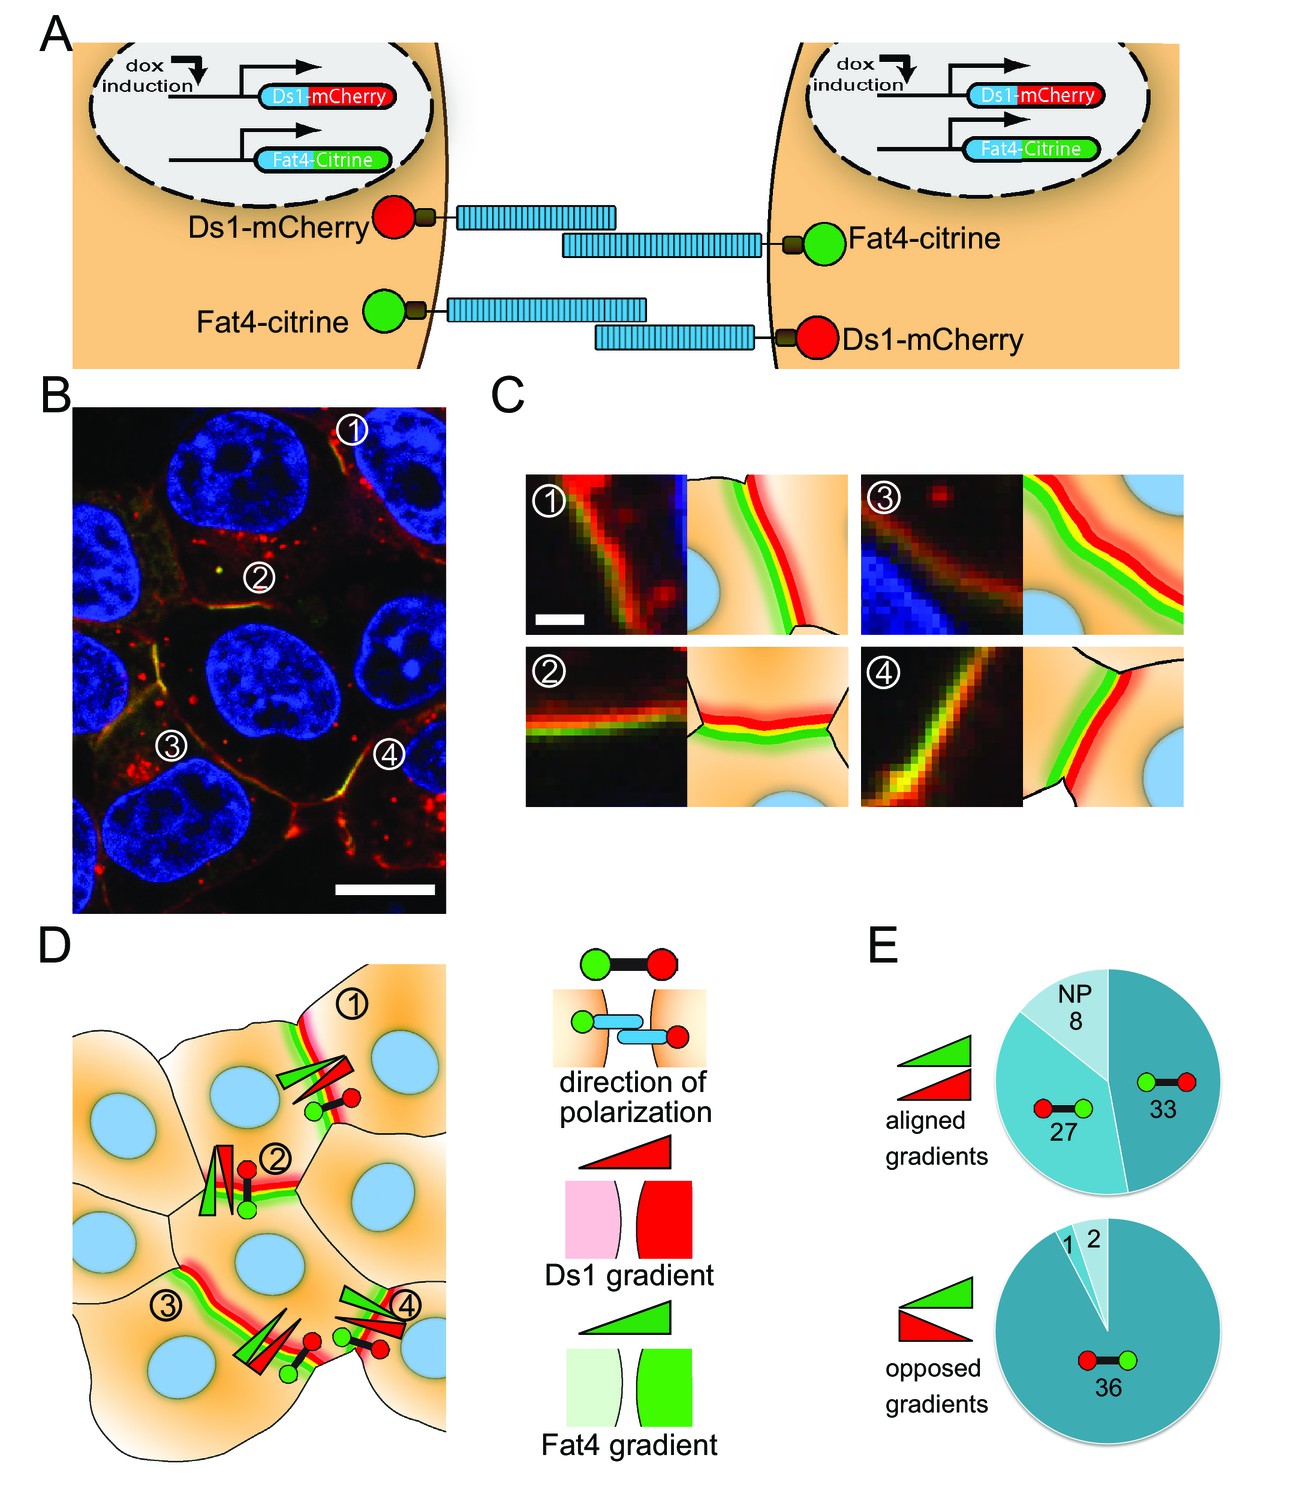
Fat4-citrine and Ds1-mCherry polarize in cells expressing both proteins.
(A) Schematic illustration of the stable cell lines expressing both Fat4-citrine and inducible Ds1-mCherry in the same cell. (B) An image of HEK293 cells expressing both Fat4-citrine and Ds1-mCherry. A rainbow feature (composed of three stripes green, yellow and red) is evident at the boundary between the cells. Scale bar - 10 μm. (C) Zoom in on the boundaries in (B) marked by the numbers 1–4. Each boundary is presented next to its schematic illustration. Scale bar - 1 μm (D) An illustration of all the cells and boundaries shown in (B). The red-green barbells indicate the direction of polarity as determined by analysis of the rainbow. In this notation, the red and green circles marks the 'red side' and the 'green side' of the rainbow, respectively (see schematic of the notation on the right panel). The red and green triangles represent the directions of the cytoplasmic Ds1 and Fat4 gradients between the two cells flanking the boundary, respectively (cytoplasmic levels where measured in the area adjacent to the boundary – see Materials and methods). (E) Pie charts showing how the direction of polarization (red-green barbell) aligns with either the Fat4 expression gradient (green triangle), or the Ds1 expression gradient (red triangle), or both, in the 107 analyzed boundaries. In the boundaries where the Fat4 and Ds1 gradients are opposed (bottom pie chart) the polarity almost always (36 out of 39) aligns in a direction compatible with both gradients. In the boundaries where the Fat4 and Ds1 gradients are aligned (top chart), the polarity cannot be compatible with both gradients. In these cases, it aligns with the Fat4 gradient in about half of the boundaries (27 out of 68), and with the Ds1 gradient in the other half (33 out of 68). NP – Non-polarized boundaries (no clear rainbow observed). Supplementary figure (Figure 6—figure supplement 1) shows that the polarization aligns with the expression gradient that existed prior to boundary accumulation.
Figure 6—figure supplement 1
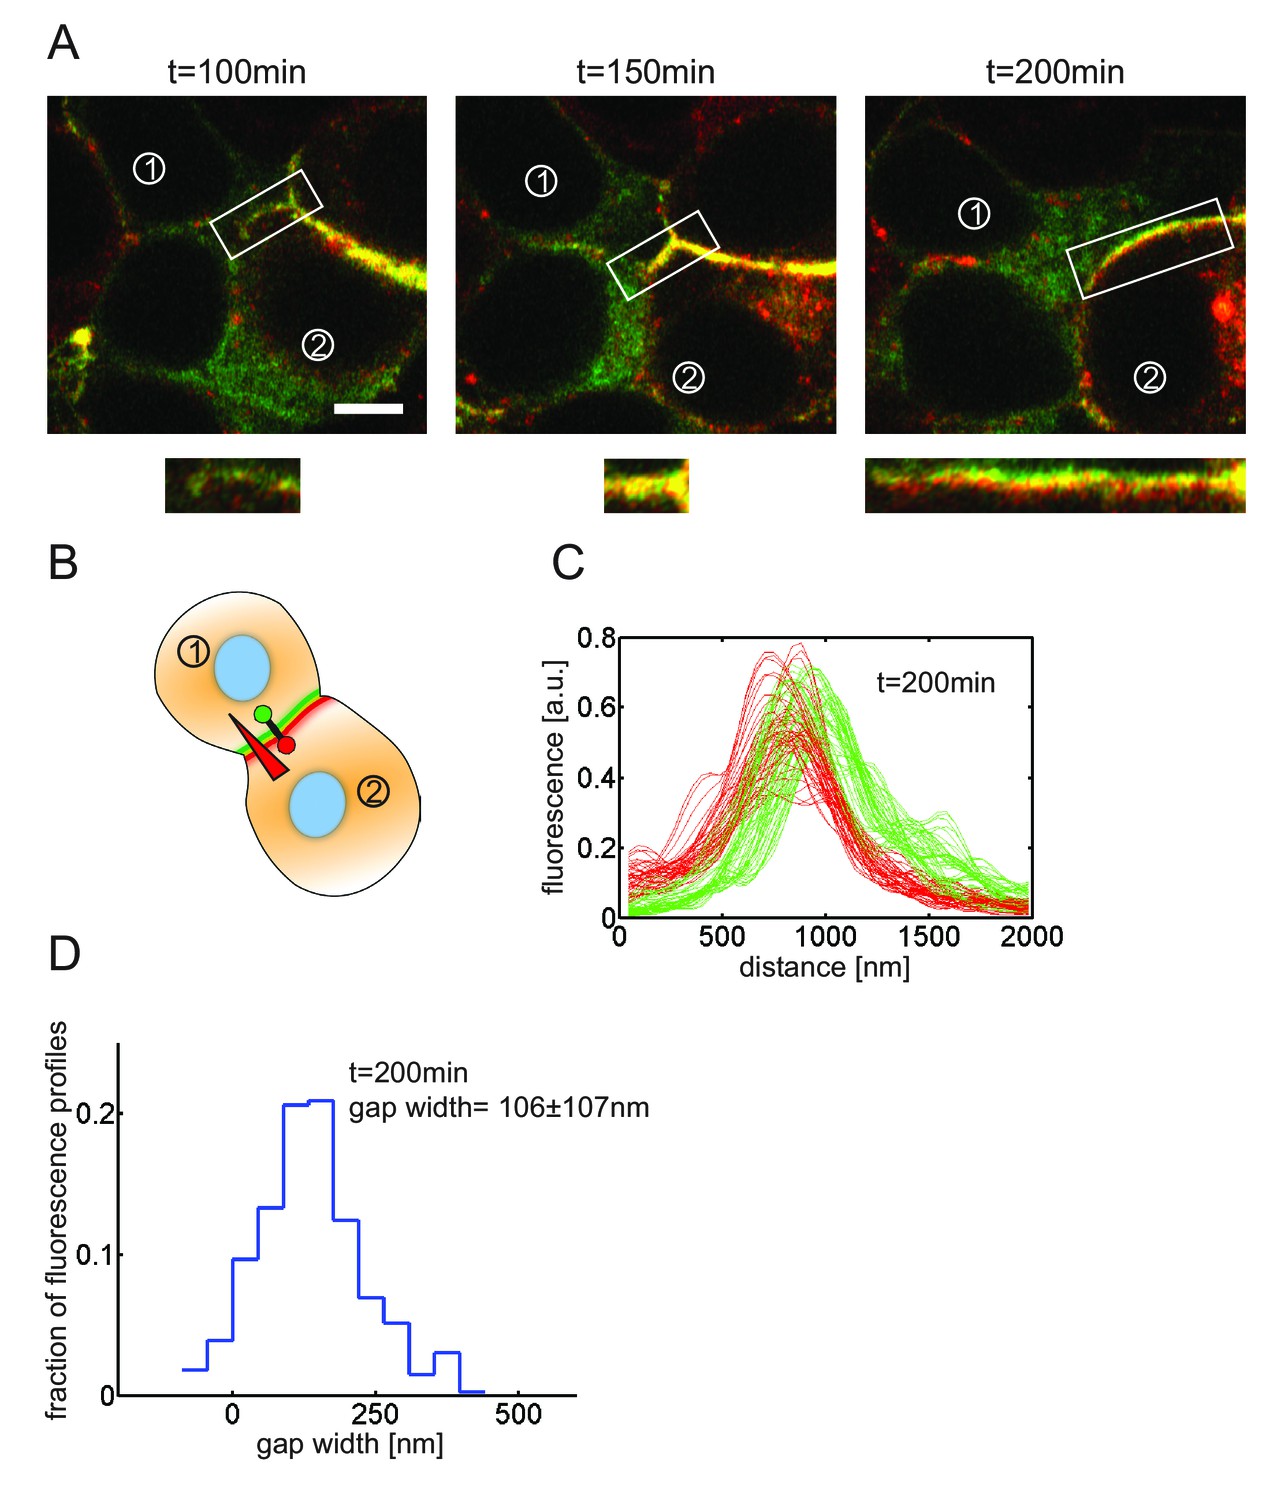
Polarization aligns with the expression gradient that existed prior to boundary accumulation.
(A) A filmstrip from a movie of HEK293 cells expressing both Fat4-citrine and Ds1-mCherry showing the emergence of accumulation in a boundary (white rectangle). Bottom strips – straightened versions of the boundaries in the filmstrip. Scale bar - 5 µm (B) A schematic showing the direction of the expression gradient of Ds1 in (A) at t = 200 min. The level of Fat4 is almost equal between the two cells flanking the boundary. (C) Fluorescence profiles of Fat4-citrine (green) and Ds1-mCherry (red) along lines perpendicular to the boundary at t = 200 min. (D) A histogram showing the distribution of the gap widths observed in the fluorescence profiles in (C). Mean gap size for this boundary is as indicated.
Videos
Video 1
A timelapse movie showing the dynamics of Fat4-Ds1 accumulation in a single cell pair.
Movie used to generate filmstrip in Figure 3B.
Video 2
A timelapse FRAP movie showing the dynamics of bound Fat4 in Fat4-Ds1 complex on the accumulating boundary.
Movie used to generate filmstrip in Figure 4A.
Video 3
A timelapse FRAP-TIRF movie showing the dynamics of the unbound Fat4 on the basal membrane of the Fat4 expressing cell.
Movie used to generate filmstrip in Figure 4C. Github repository - All analysis code can be found at Loza, 2017.
Additional files
-
Transparent reporting form
- https://doi.org/10.7554/eLife.24820.020
Download links
A two-part list of links to download the article, or parts of the article, in various formats.
Downloads (link to download the article as PDF)
Open citations (links to open the citations from this article in various online reference manager services)
Cite this article (links to download the citations from this article in formats compatible with various reference manager tools)
A synthetic planar cell polarity system reveals localized feedback on Fat4-Ds1 complexes
eLife 6:e24820.
https://doi.org/10.7554/eLife.24820


