Presynaptic morphology and vesicular composition determine vesicle dynamics in mouse central synapses
- Okinawa Institute of Science and Technology Graduate University, Japan
Figures
Figure 1 with 3 supplements

Autoregressive motion analysis reveals high and broad range of SV mobilites in cultured giant terminals.
(A) Confocal z-stack imaging of a giant presynaptic terminal expressing cytosolic GFP- (Green) and Q655-Syt2 (Red)-labeled vesicles; corresponding volume rendering of GFP terminal and SV detection (see Video 1). (B) The number of labeled SVs detected in whole presynaptic terminal. (C) Live confocal imaging and SV tracking with the autoregressive motion (Red) or Brownian motion (Blue) algorithm (see Video 2). (D) Scatter plot of SV trajectory lengths and maximum speeds superimposed with individual trajectory traces, color-coded as in (C). (E) Comparison of SV displacements and diffusion coefficients for Q655-Syt2- (n = 12 terminals), Q585-Syt2- (n = 12) or C5E-Syt2- (n = 12) labeled vesicles, Q655-Syt2-labeled vesicles after chemical fixation (n = 12) and 40 nm beads (n = 12 ROI). Two-tailed unpaired t-test (*p<0.05; ns, not significant).
-
Figure 1—source data 1
Data and statistics for Figure 1E.
- https://doi.org/10.7554/eLife.24845.004
-
Figure 1—source data 2
Data and statistics for Figure 1—figure supplement 1B.
- https://doi.org/10.7554/eLife.24845.005
-
Figure 1—source data 3
Data and statistics for Figure 1—figure supplement 2D.
- https://doi.org/10.7554/eLife.24845.006
-
Figure 1—source data 4
Data and statistics for Figure 1—figure supplement 3D.
- https://doi.org/10.7554/eLife.24845.007
Figure 1—figure supplement 1

Q655-Syt2 labels SV more efficiently than Q655 alone.
(A) Volume rendering of GFP terminal and SV detection in calyceal terminals loaded with Q655 only or Q655-Syt2 after 16 hr. (B) Comparison of the number of SVs detected in calyceal terminals loaded with Q655 alone (Black, n = 5 terminals), Q655-Syt2 (Red, n = 5) or C5E-Syt2 (Magenta, n = 5) after overnight incubation. Two-tailed unpaired t-test (*p<0.05). (C) Fluorescence intensity distribution in 150 nm confocal spots for 40 nm FITC-beads (Green), SVs loaded with Q655-Syt2 (Red) or with C5E-Syt2 (Magenta).
Figure 1—figure supplement 2
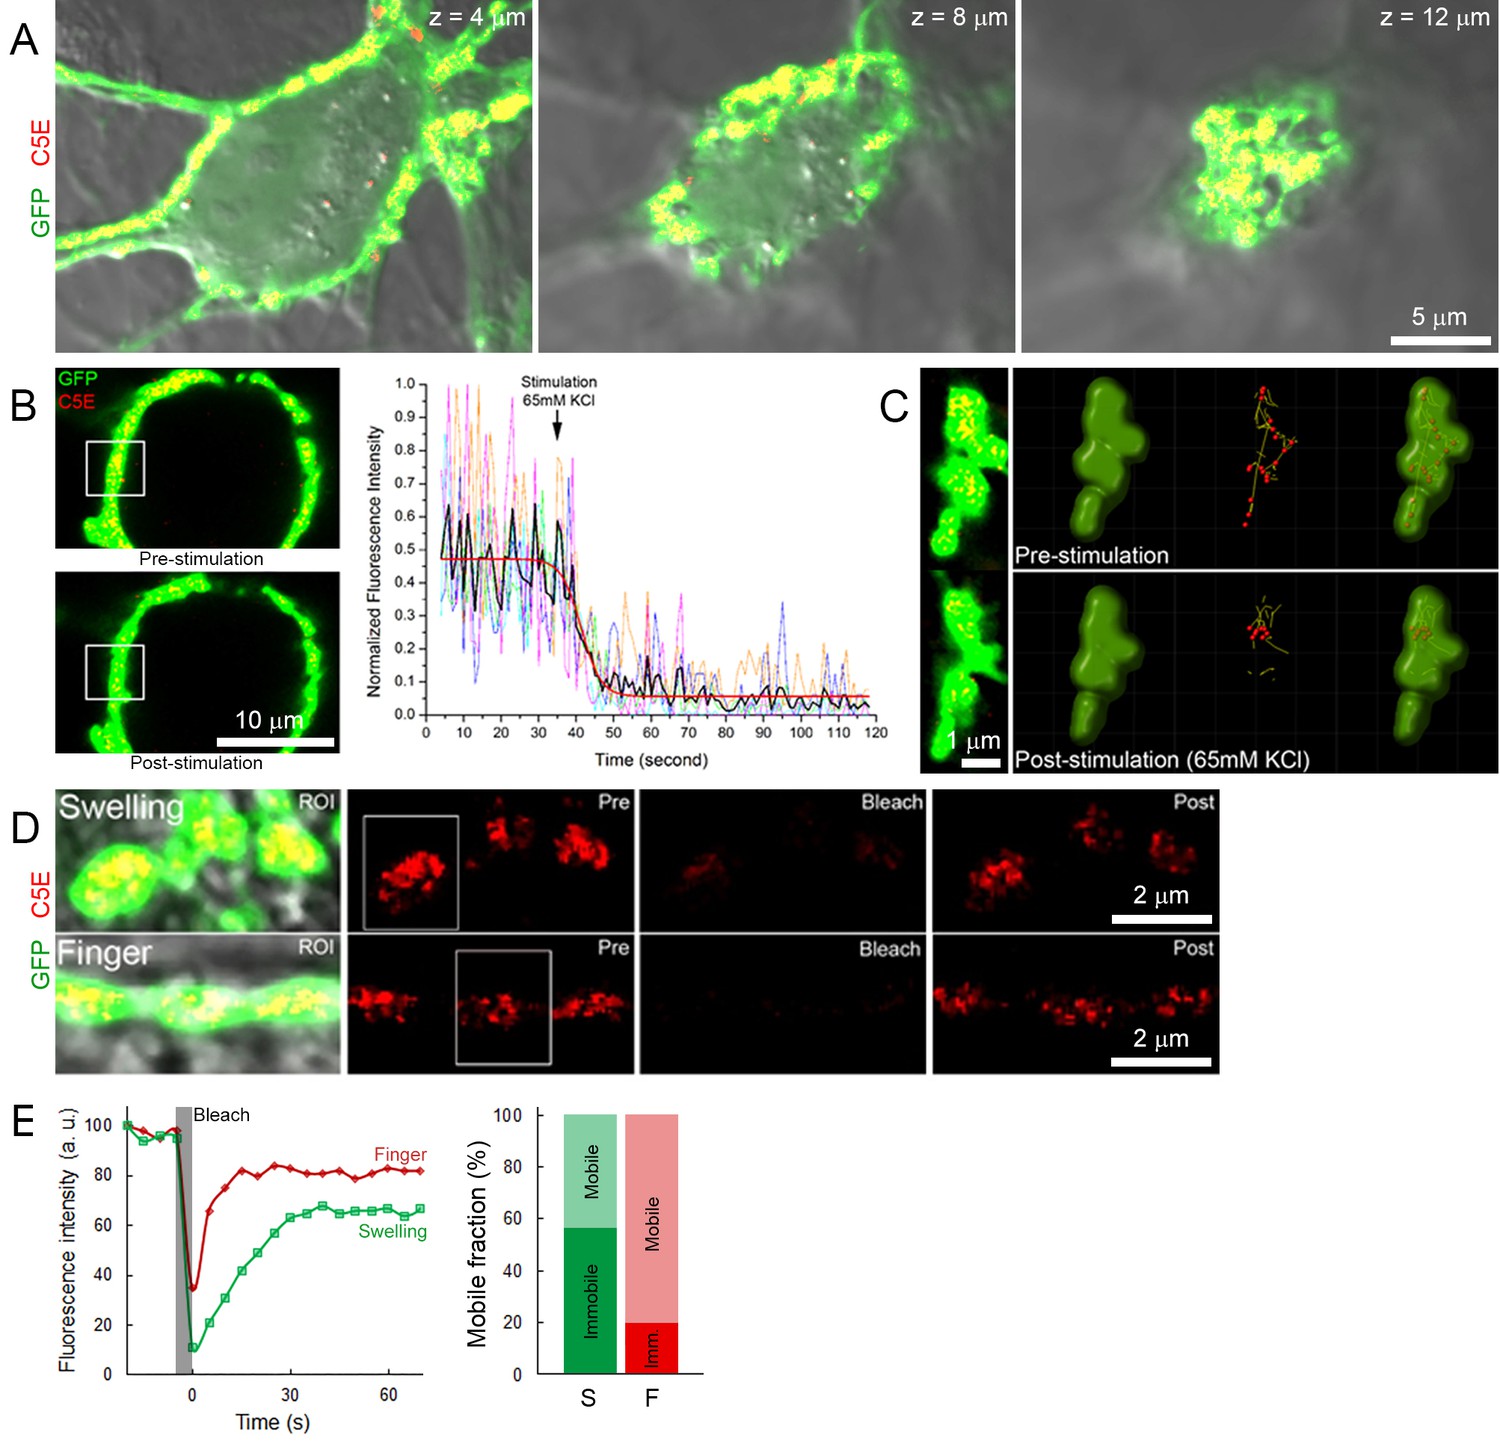
Labeling and tracking of SVs with C5E-Syt2.
(A) Confocal z-stack imaging of a giant presynaptic terminal expressing cytosolic GFP (Green) and C5E-Syt2 (Red)-labeled vesicles. (B) Visualization and quantification of exocytosis induced by bath application of 65 mM KCl. Upper left panel: confocal image before KCl application, lower left panel: confocal image after KCl application. Right panel: Measurement of C5E fluorescence intensity from ROI (white box on left panels) of five different terminals. Black trace: average of 5 traces (color coded), Red trace: Boltzman fitting. (C) Tracking of SVs in interconnected swellings before (upper panels) and after application of 65 mM KCl (lower panels). (D) Fluorescence recovery after photobleaching in swellings (upper panels) or finger-like structures (lower panels). (E) FRAP analysis showing fluorescence intensity recovery profile (ROI ~1.5 µm, white boxes) and estimation of the mobile and immobile fraction of SVs in swellings (Green) and finger-like structures (Red).
Figure 1—figure supplement 3
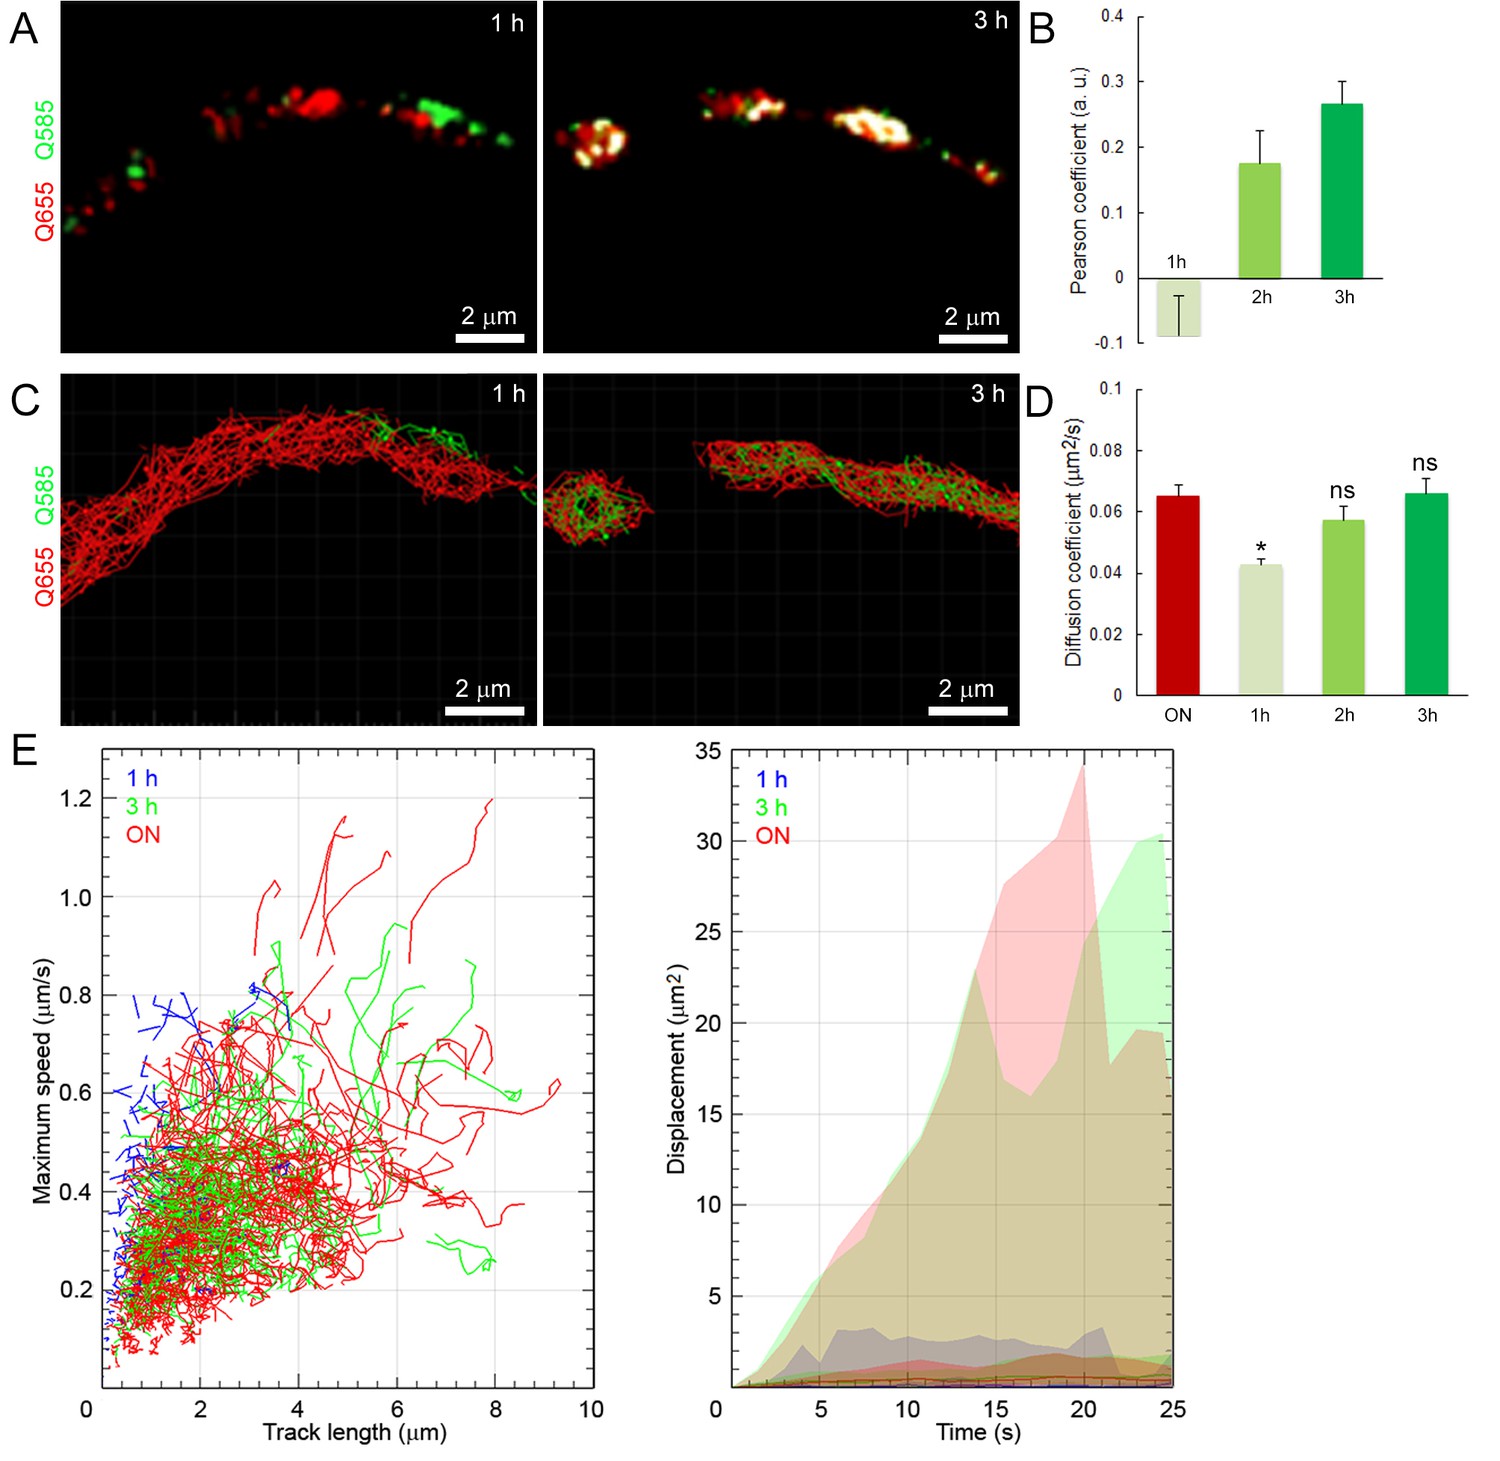
Newly retrieved SVs have lower mobilities and restricted distributions in giant terminals.
(A) Confocal images showing the co-localization of SVs labeled overnight with Q655-Syt2 (Red) and for 1 hr or 3 hr with Q585-Syt2 (Green), co-localization (white). (B) Comparison of the Pearson co-localization coefficient of Q655- and Q585-labeled vesicles after 1, 2, or 3 hr post-endocytosis. (C) Tracking of Q655- (Red) and Q585- (Green) labeled vesicles after 1 or 3 hr from terminals shown in (A). (D) Diffusion coefficient of Q655- and Q585-labeled vesicles after 1 (n = 3 terminals), 2 (n = 3), or 3 hr (n = 3) post-endocytosis. Two-tailed unpaired t-test (*p<0.05; ns, not significant). (E) Dynamic properties and displacement analysis of Q655- (Red) and Q585-labeled vesicles after 1 hr (Blue) or 3 hr (Green) post-endocytosis.
Figure 2 with 3 supplements
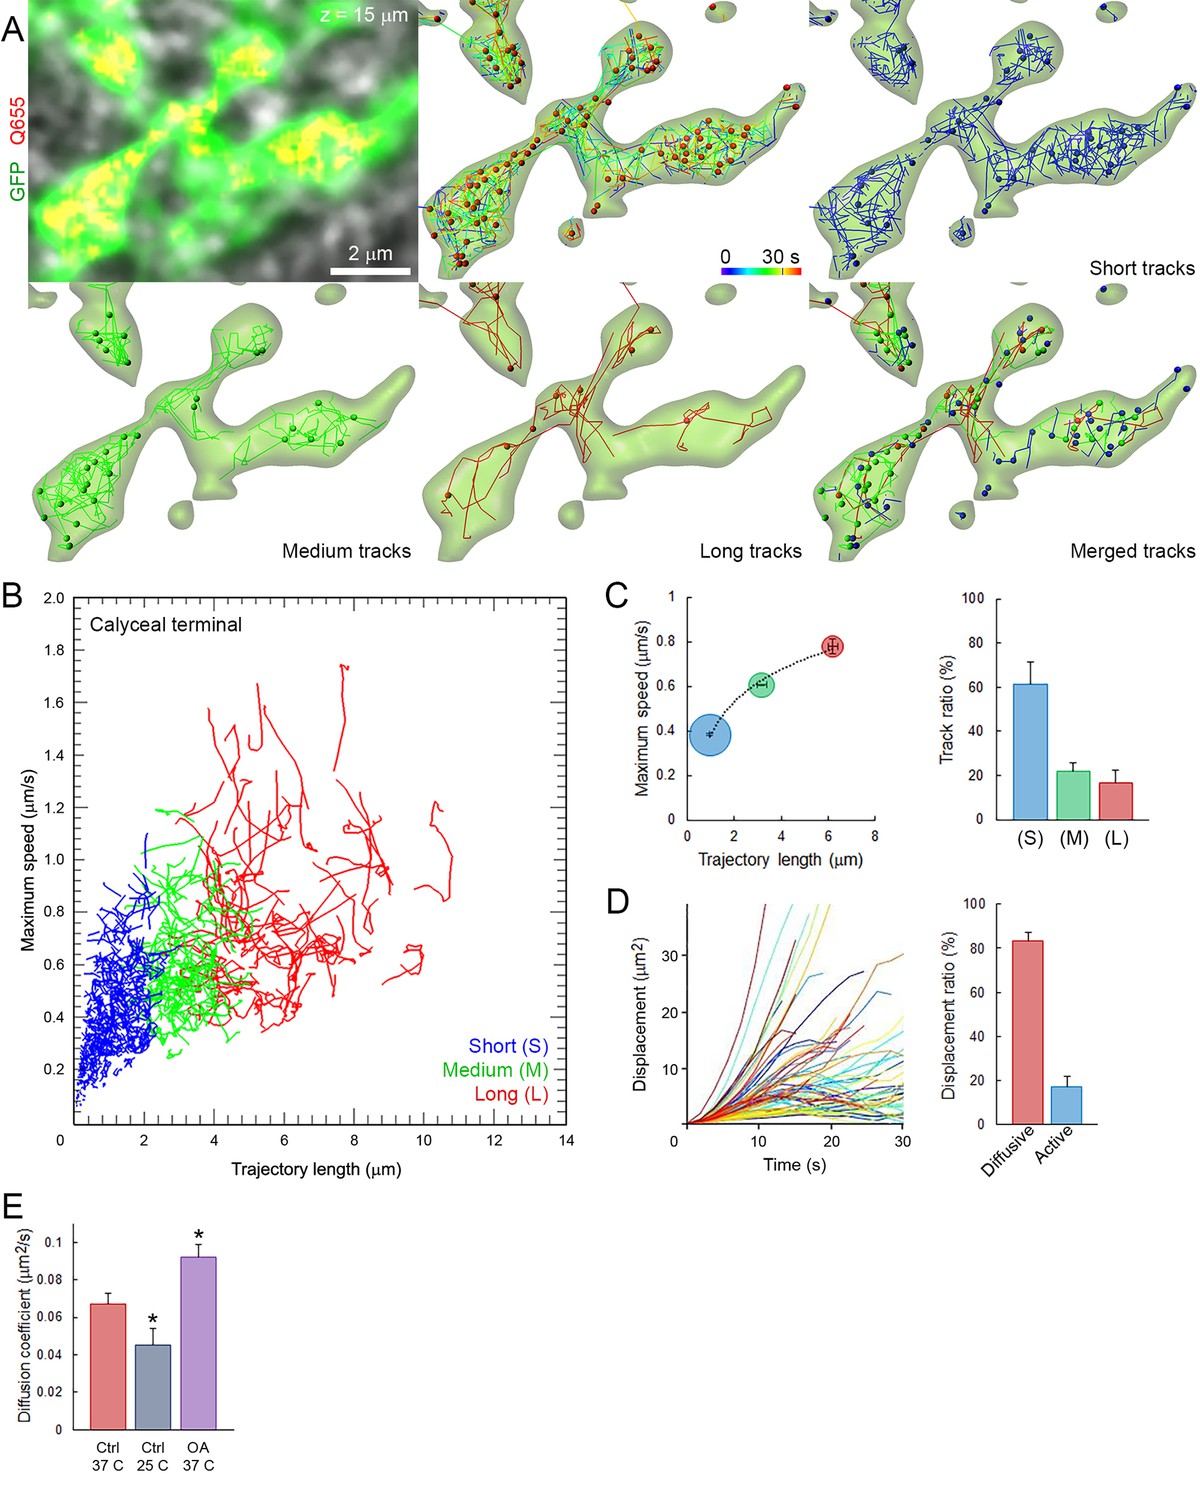
Fast and heterogeneous SV movements occur at giant calyceal synapses.
(A) Live confocal imaging of a giant calyceal terminal expressing cytosolic GFP- and Q655-Syt2-labeled vesicles, with SV tracking, color-coded over time, or sorted according to trajectory lengths (Blue <2 µm, Green 2–4 µm and Red >4 µm, see Video 3). (B) Scatter plot of SV trajectory lengths and maximum speeds superimposed with individual trajectory traces (see Video 4), color-coded as in (A). (C) Classification and quantification of SV movements in three groups based on their maximum speed and trajectory length (n = 6175 trajectories). (D) Displacement curves and displacement modalities (Red: diffusive motion, Blue: active motion) of identified traces (n = 6175 trajectories). (E) Diffusion coefficient of SVs at 37o C (n = 12 terminals) or 25°C (n = 4); or in the presence of 2.5 µM OA at 37°C (n = 9). Two-tailed unpaired t-test (*p<0.05).
-
Figure 2—source data 1
Data and statistics for Figure 2E.
- https://doi.org/10.7554/eLife.24845.014
-
Figure 2—source data 2
Data and statistics for Figure 2—figure supplement 2E and H.
- https://doi.org/10.7554/eLife.24845.015
-
Figure 2—source data 3
Data and statistics for Figure 2—figure supplement 3B.
- https://doi.org/10.7554/eLife.24845.016
Figure 2—figure supplement 1
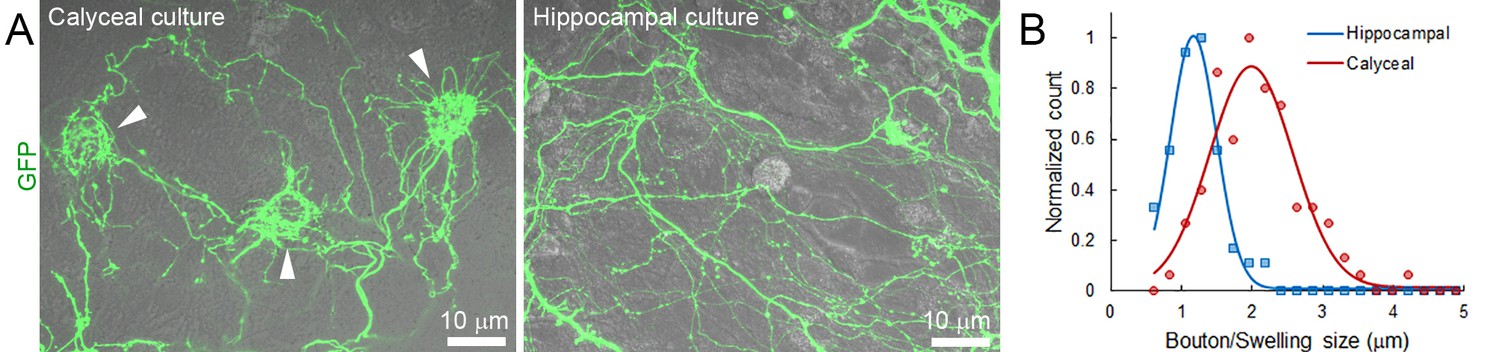
Comparison of calyceal and hippocampal cultures.
(A) Maximum intensity projection image of confocal z-stack showing giant calyceal terminals (arrowheads) over-expressing cytosolic GFP after 18 days in culture (left panel) and hippocampal neurons over-expressing cytosolic GFP after 15 days in culture (right panel). (B) Comparison of the size distribution of calyceal swellings (Red) and hippocampal boutons (Blue).
Figure 2—figure supplement 2

Mobility and displacement modality of SVs in giant calyceal terminals.
(A) Live confocal imaging of a calyceal terminal expressing cytosolic GFP and Q655-Syt2-labeled vesicles, and individual SV tracking sorted according to trajectory lengths (Blue <2 µm, Green 2–4 µm and Red >4 µm). (B) Speed variation profiles during short (Blue), medium (Green) or long (Red) trajectories. (C) Displacement modalities. Representative displacement curves showing different modes of movements. Each representative curve for diffusive motion and active motion (facilitated and impeded) was calculated and plotted from an average of 12 different curves extracted from displacement plots similar to Figure 2D. (D) Confocal imaging of a giant calyceal terminal expressing cytosolic GFP and Q655-Syt2-labeled vesicles. White circles and black lines represent swelling and finger areas, respectively. (E) Comparison of the diffusion coefficient of SVs in swellings or fingers in various conditions (Control, 30 µM nocodazole, 2.5 µM OA, 65 mM KCl, 500 mM sucrose or 1 Hz electrical stimulation, n = 6 terminals for each condition). (F) 3D tracking of SVs labeled with Q655-Syt2 in an individual swelling. Left panel: SV trajectories (time color-coded), right panel: Displacement vectors of SV trajectories. (G) Schematic diagram showing the proportion of SVs with displacement vectors going toward the synaptic cleft (Green), away from the synaptic cleft (Red), or moving laterally (Blue) in an individual calyceal swelling. (H) Comparison of SV mobilities between 2D and 3D tracking. Trajectory length analysis (Left panel) and diffusion coefficient (Right panel) in single 2D confocal section (Blue, n = 3) and 3D confocal z-stack (Red, n = 3). Two-tailed unpaired t-test (*p<0.05; ns, not significant).
Figure 2—figure supplement 3
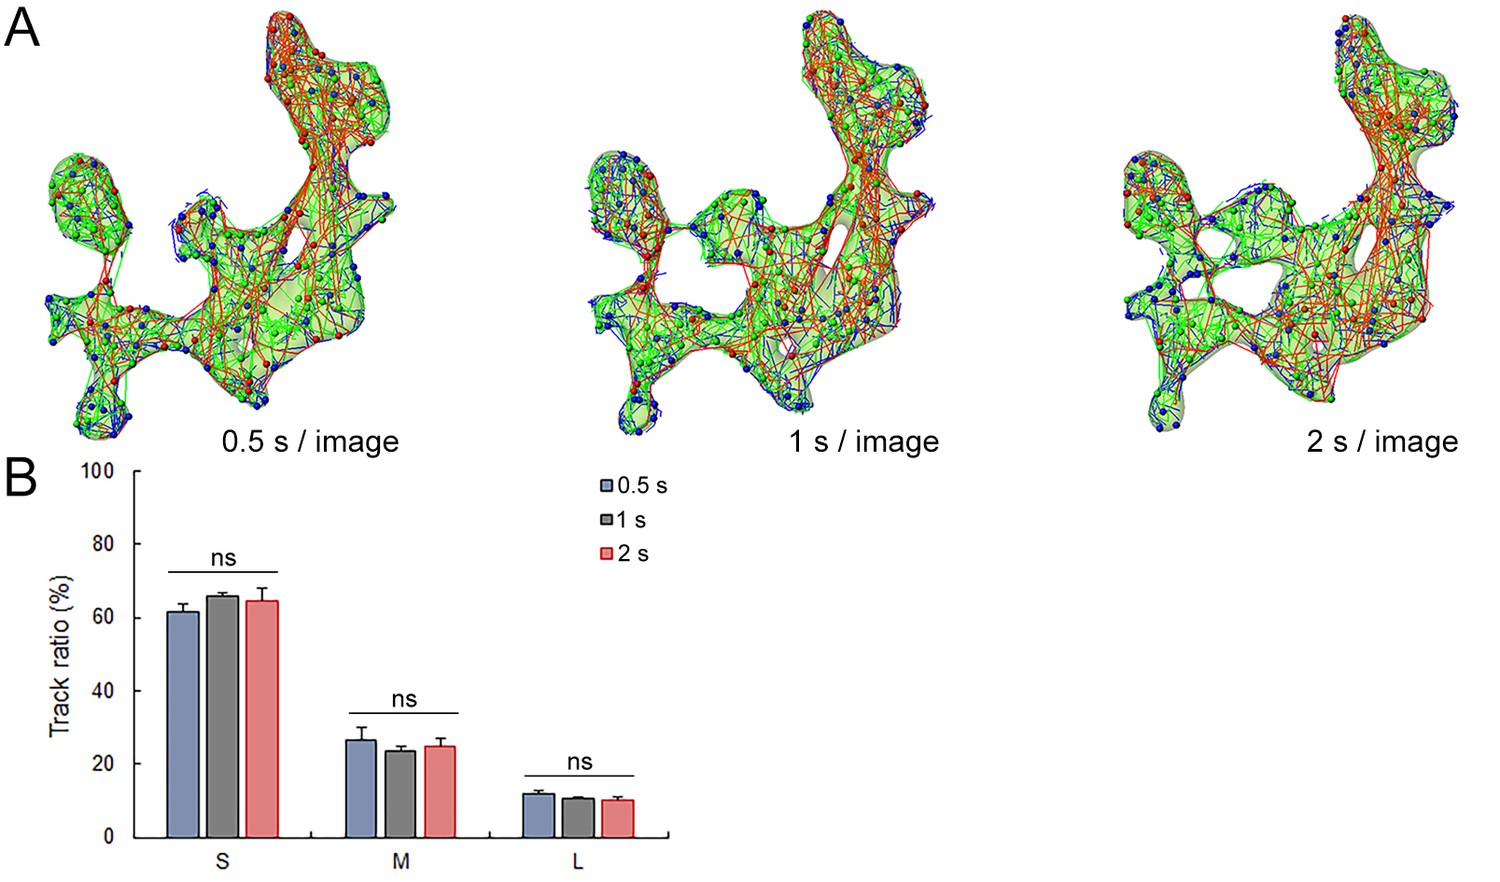
Data acquisition rate does not affect SV tracking.
(A) Syt2-C5E-loaded SV tracking sorted according to trajectory lengths (Blue <2 µm, Green 2–4 µm and Red >4 µm) at three different image acquisition speed (0.5 s, 1 s and 2 s per image). Trajectory length analysis in single 2D confocal section 0.5 s per image (Blue, n = 3), 1 s per image (Black, n = 3) and 2 s per image (Red, n = 3). Two-tailed unpaired t-test for comparison between two groups and two-way ANOVA for multi groups comparison (ns, not significant).
Figure 3
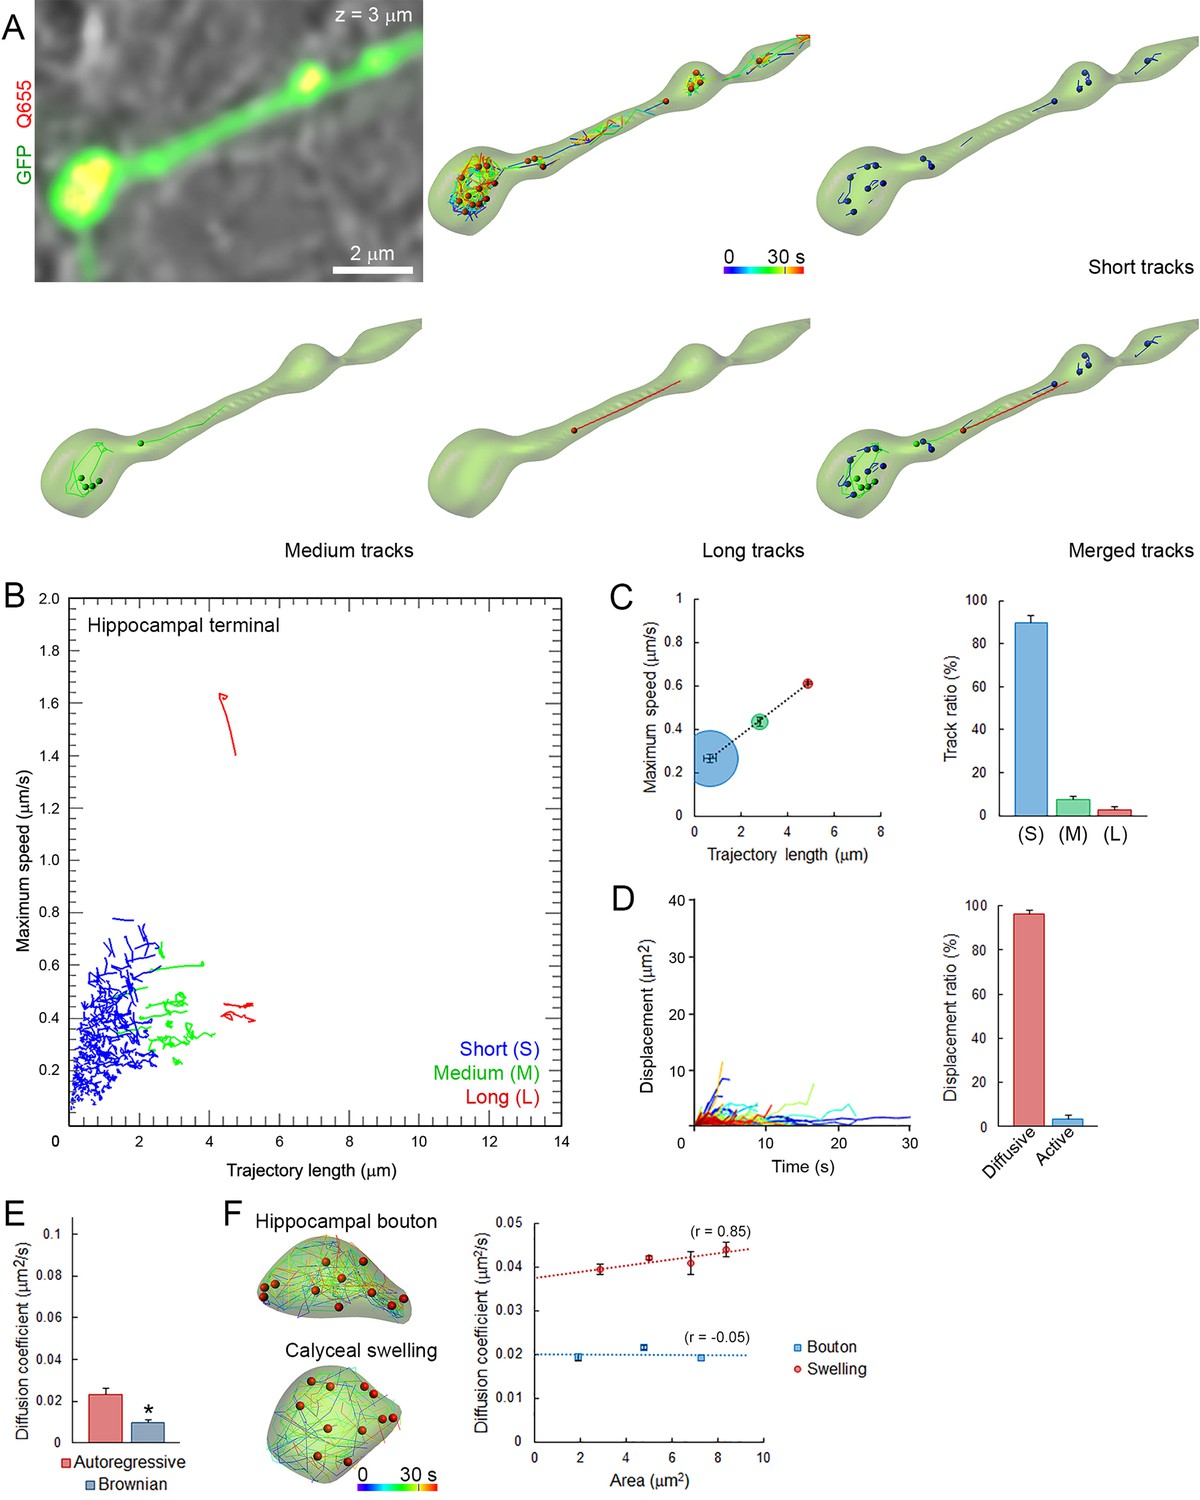
Small and homogeneous SV movements occur at small conventional synapses.
(A) Live confocal imaging of a hippocampal bouton expressing cytosolic GFP- and Q655-Syt2-labeled vesicles, with SV tracking color-coded over time, or sorted according to trajectory lengths (Blue <2 µm, Green 2–4 µm and Red >4 µm). (B) Scatter plot of SV trajectory lengths and maximum speeds superimposed with individual trajectory traces, color-coded as in (A). (C) Classification and quantification of SV movements in three groups based on their maximum speed and trajectory length (n = 2958 trajectories). (D) Displacement curves and displacement modalities (Red: diffusive motion, Blue: active motion) of identified traces (n = 2958). (E) Diffusion coefficients of SVs in hippocampal terminals calculated from autoregressive (Red) or Brownian (Blue) analysis (n = 9 terminals). Two-tailed unpaired t-test (*p<0.05). (F) Comparison of SV mobility in hippocampal boutons (n = 9) or calyceal swellings (n = 9).
-
Figure 3—source data 1
Data and statistics for Figure 3E.
- https://doi.org/10.7554/eLife.24845.023
Figure 4 with 1 supplement
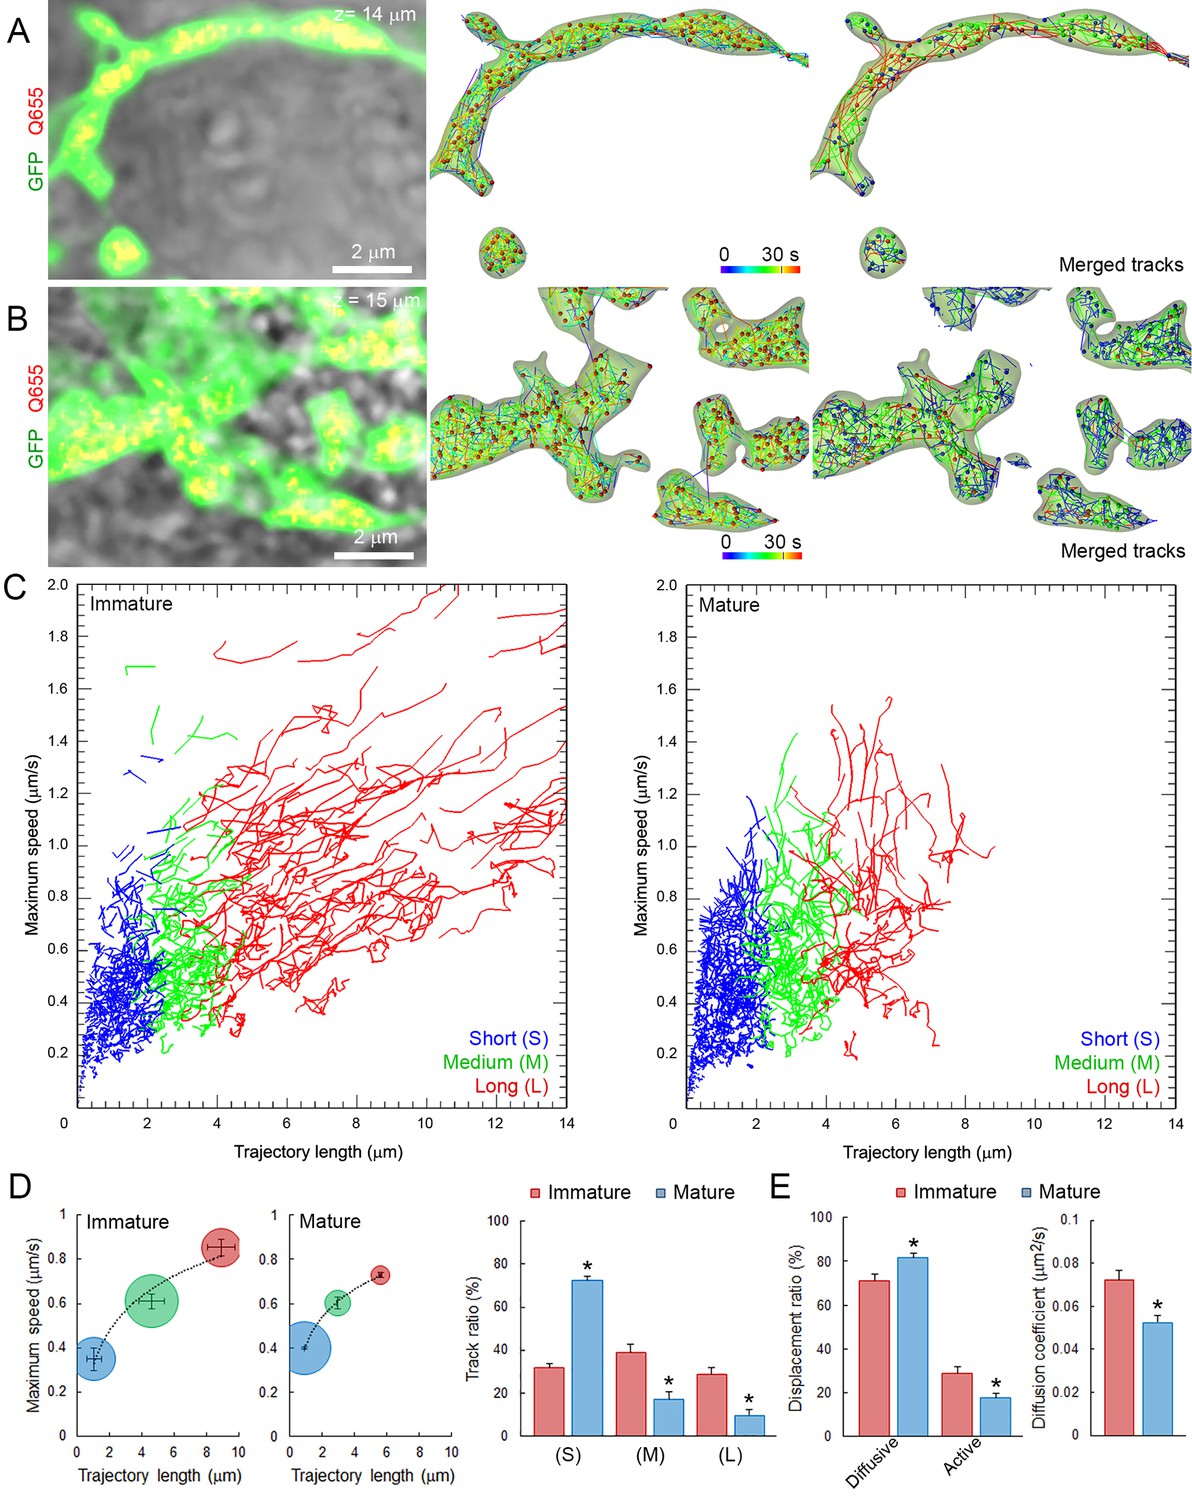
SV mobility decreases after morphological maturation of giant terminals.
(A) Live confocal imaging of a giant immature terminal expressing cytosolic GFP and Q655-Syt2-labeled vesicles, with SV tracking color-coded over time, or sorted according to trajectory length (Blue <2 µm, Green 2–4 µm and red >4 µm). (B) Confocal imaging of a giant mature terminal as described in (A). (C) Scatter plot of SV trajectory lengths and maximum speeds superimposed with individual trajectory traces from immature (left panel) or mature (right panel) calyceal terminals, color-coded as in (A). (D) Classification and quantification of SV movements in three groups based on their maximum speeds and trajectory lengths in immature (Red, n = 9 terminals) and mature (Blue, n = 9) terminals. (E) Displacement modalities and diffusion coefficients of SVs in immature (Red, n = 9) and mature (Blue, n = 9) terminals. Two-tailed unpaired t-test (*p<0.05).
-
Figure 4—source data 1
Data and statistics for Figure 4D and E.
- https://doi.org/10.7554/eLife.24845.025
-
Figure 4—source data 2
Data and statistics for Figure 4—figure supplement 1D.
- https://doi.org/10.7554/eLife.24845.026
Figure 4—figure supplement 1
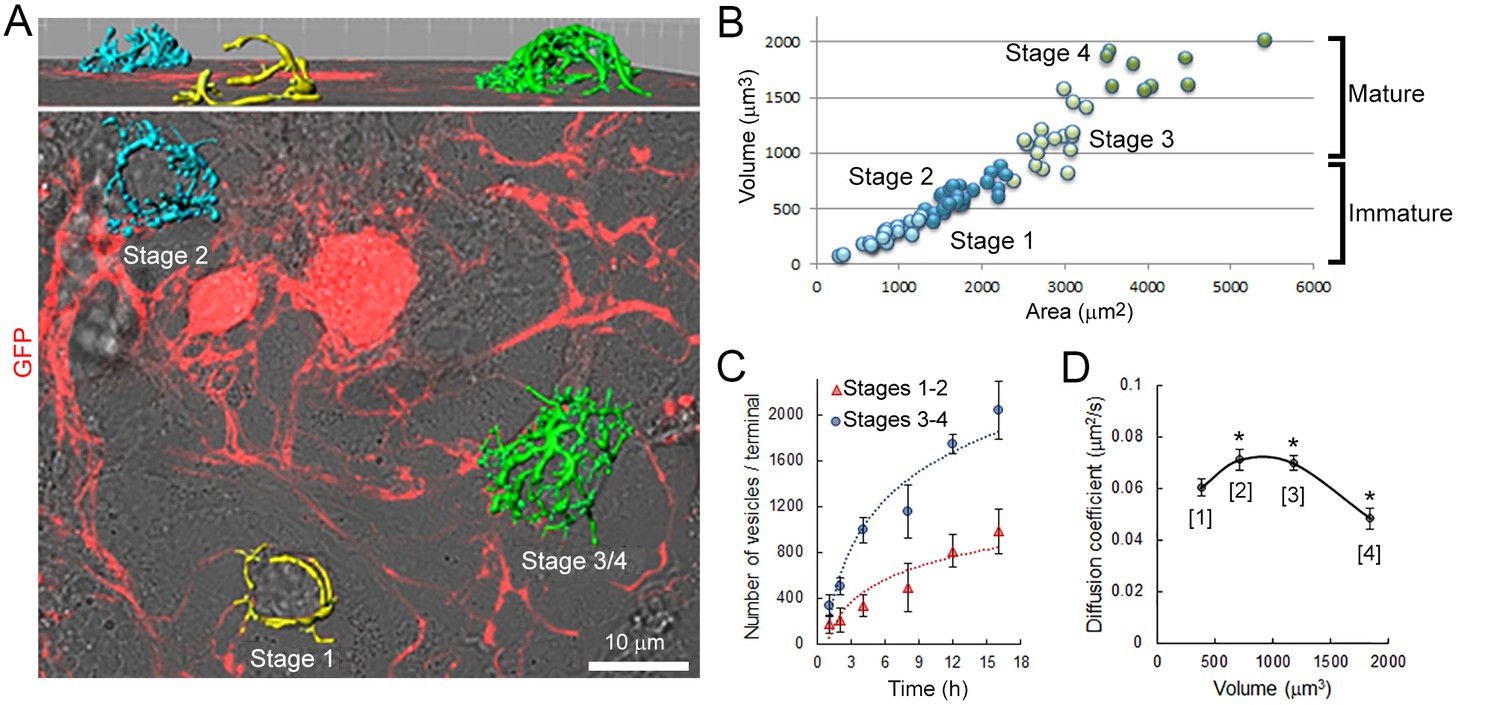
Morphological maturation of giant terminals involves a developmental switch in SV mobility.
(A) Confocal image showing GFP-over-expressing presynaptic neurons overlaid with 3D rendering of giant terminals from different stages of maturation (stages 1–2: immature terminals; Stages 3–4: mature terminals). (B) Cluster analysis of giant terminals in culture based on their volume and surface area (Blue: Stages 1–2, immature terminals; Green: Stages 3–4, mature terminals). (C) Number of labeled vesicles in immature (Red: Stages 1–2) and mature (Blue: Stages 3–4) terminals. (D) Variation of the diffusion coefficient of SVs according to terminal volume during morphological maturation (n = 5 for each developmental stage). Two-tailed unpaired t-test for comparison between two groups and two-way ANOVA for multi groups comparison (*p<0.05).
Figure 5 with 1 supplement

Vesicular glutamate transporter isoforms regulate SV dynamic properties.
(A) Confocal z-stack imaging of giant presynaptic terminal expressing Venus-VGLUT1 (Green). (B) Confocal z-stack imaging of giant presynaptic terminal expressing Venus-VGLUT2 (Green). (C) Quantification of the fluorescence intensity of Venus-VGLUT1 (Red, n = 6 terminals) and Venus-VGLUT2 (Blue, n = 6) in giant calyceal terminals after 21 days in culture. (D) Upper panels: Live confocal imaging of a calyceal terminal expressing Venus-VGLUT1, and SV tracking sorted according to trajectory lengths (Blue <2 µm, Green 2–4 µm and red >4 µm). Lower panels: Live confocal imaging of a calyceal terminal expressing Venus-VGLUT2, and SV tracking sorted according to trajectory lengths (Blue <2 µm, Green 2–4 µm and red >4 µm). (E) Scatter plot of SV trajectory lengths and maximum speeds superimposed with individual trajectory traces in Venus-VGLUT1 (Red) or Venus-VGLUT2 (Blue) overexpressing terminals. (F) Dynamic properties of SVs expressing Venus-VGLUT1 or Venus-VGLUT2. (G) Displacement modalities and diffusion coefficients of Venus-VGLUT1 expressing vesicles (Red, n = 6) and Venus-VGLUT2 expressing vesicles (Blue, n = 6). Two-tailed unpaired t-test (*p<0.05; ns, not significant).
-
Figure 5—source data 1
Data and statistics for Figure 5C, F and G.
- https://doi.org/10.7554/eLife.24845.029
Figure 5—figure supplement 1
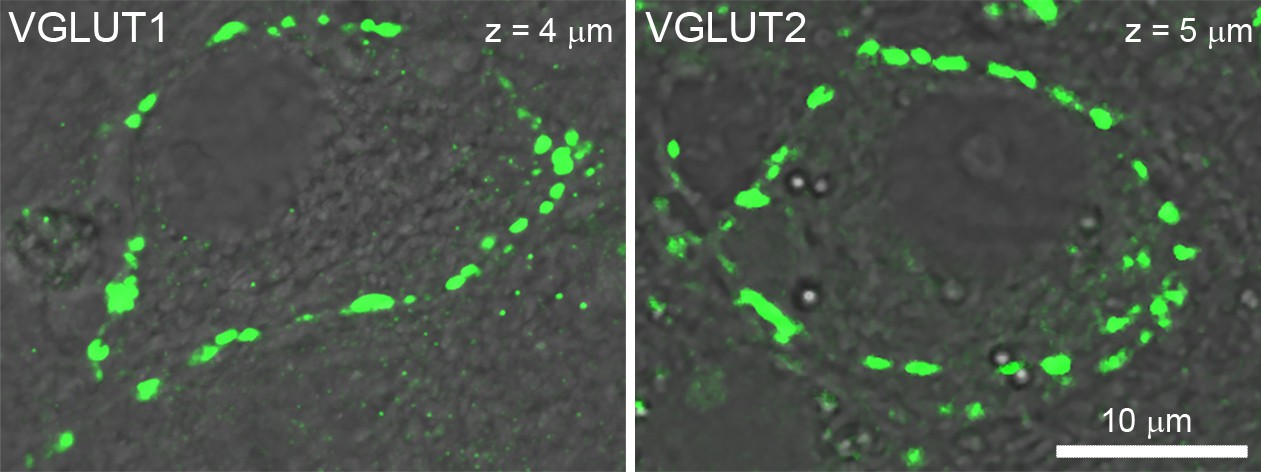
Localization of endogenous vesicular glutamate transporter isoforms in cultured giant calyceal terminals.
Confocal imaging of calyceal terminals labeled with antibodies against VGLUT1 or VGLUT2.
Figure 6 with 2 supplements
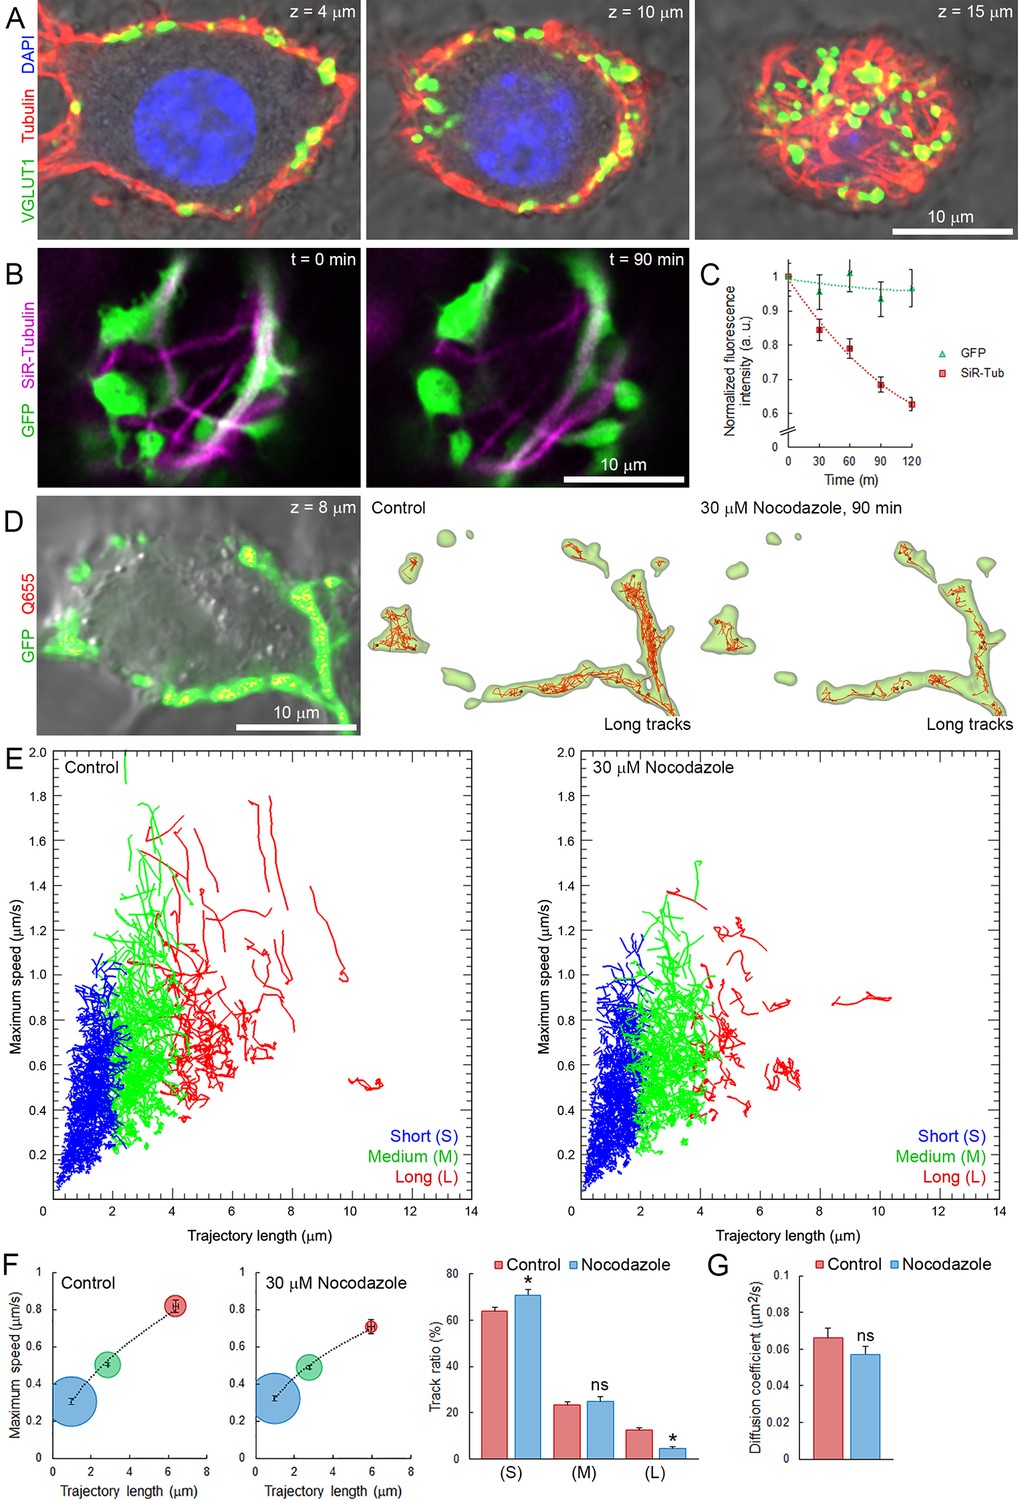
Presynaptic MT network regulates long and rapid directional SV movements.
(A) Confocal z-stack imaging of a calyceal terminal labelled with antibodies against de-tyrosinated α-tubulin (Red), VGLUT1 (Green) and DAPI (Blue). (B) Live confocal imaging of a calyceal terminal over-expressing GFP and labeled with SiR-Tubulin before and after treatment with 30 µM Nocodazole. (C) Quantification of GFP- and SiR-Tubulin fluorescence intensity during nocodazole treatment. (D) Live confocal imaging of a calyceal terminal expressing cytosolic GFP and Q655-Syt2 labeled vesicles, and SV tracking (long tracks displayed only). (E) Scatter plot of SV trajectory lengths and maximum speeds superimposed with individual trajectory traces in control (left panel) or nocodazole-treated terminals (right panel), color-coded (Blue <2 µm, Green 2–4 µm and red >4 µm). (F) Classification and quantification of SV movements in three groups based on their maximum speeds and trajectory lengths in control (Red, n = 8 terminals) and nocodazole-treated (Blue, n = 8) terminals. (G) Diffusion coefficient of SVs in control (Red, n = 8) and nocodazole-treated (Blue, n = 8) terminals. Two-tailed unpaired t-test (*p<0.05; ns, not significant).
-
Figure 6—source data 1
Data and statistics for Figure 6F and G.
- https://doi.org/10.7554/eLife.24845.032
Figure 6—figure supplement 1
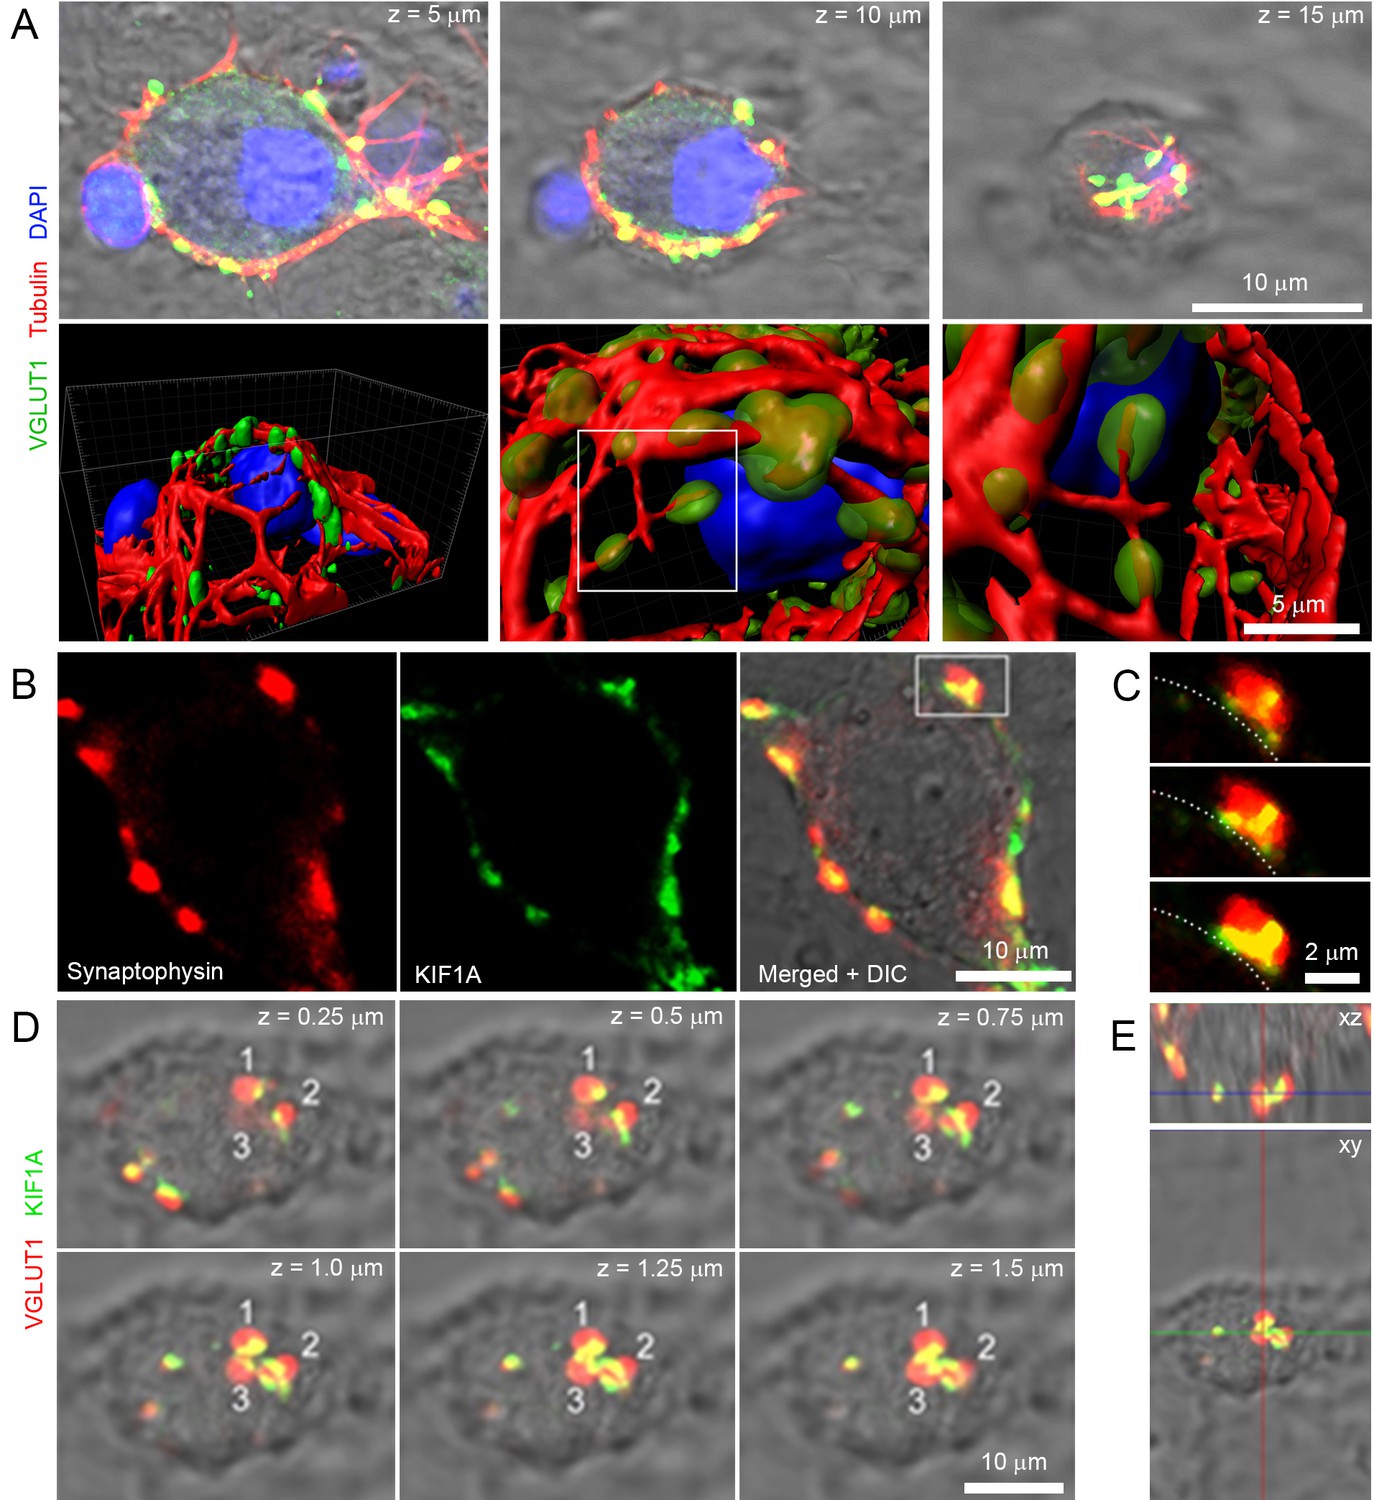
Microtubules and kinesins localize in giant calyceal terminals.
(A) Upper panels: confocal z-stack imaging of giant terminals in culture for 18 days and labeled with antibodies against de-tyrosinated α-tubulin (Red), VGLUT1 (Green) and DAPI (Blue). Lower panels: 3D rendering of images shown above. (B) Confocal images of a giant terminal labeled with antibodies against synaptophysin (Red) and KIF1A (Green). (C) Expanded view of the presynaptic swelling delimited in (B) in three consecutive z-stacks; dotted line represents the putative position of the synaptic cleft relative to the swelling. (D) Confocal z-stack imaging of a giant terminal labeled with antibodies against VGLUT1 (Red) and KIF1A (Green). (E) Orthogonal view of the terminal shown in (D).
Figure 6—figure supplement 2
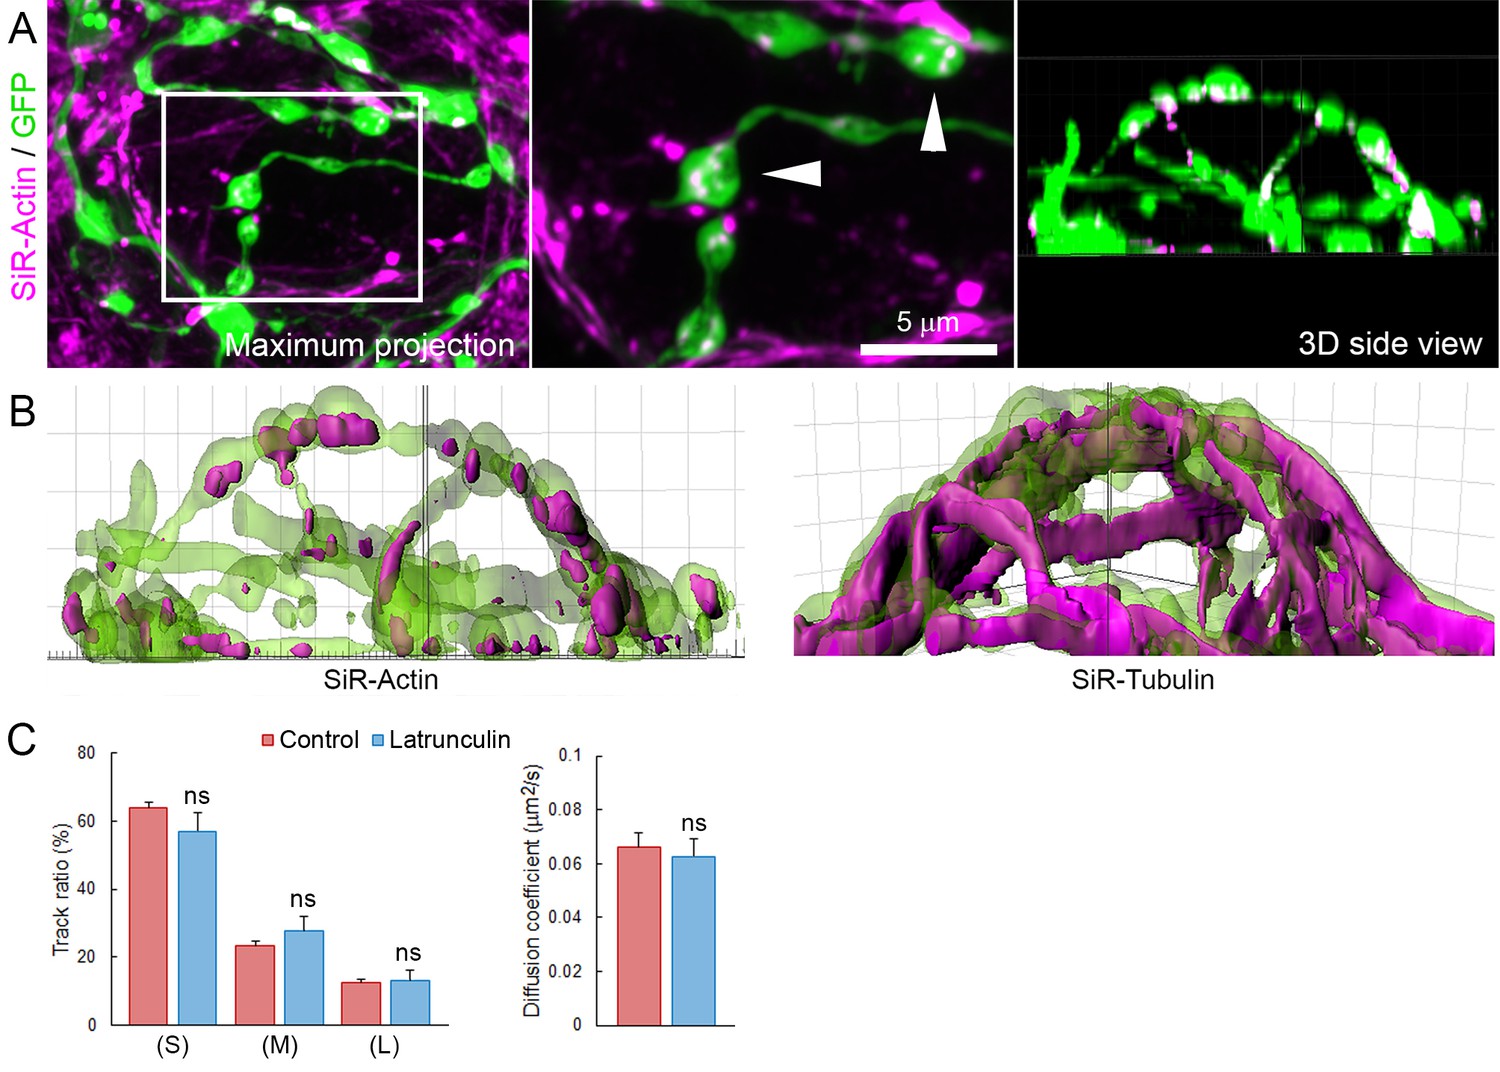
Actin network localizes in presynaptic swellings.
(A) Live confocal imaging of SiR-Actin in giant cultured terminals over-expressing cytosolic GFP. (B) Volume rendering of SiR-Actin and SiR-Tubulin in GFP-overexpressing giant terminals. (C) Proportion SV trajectories and diffusion coefficient in control (Red, n = 8) and 10 µM latrunculin-A-treated (Blue, n = 4) terminals. Two-tailed unpaired t-test (ns, not significant).
Figure 7 with 1 supplement
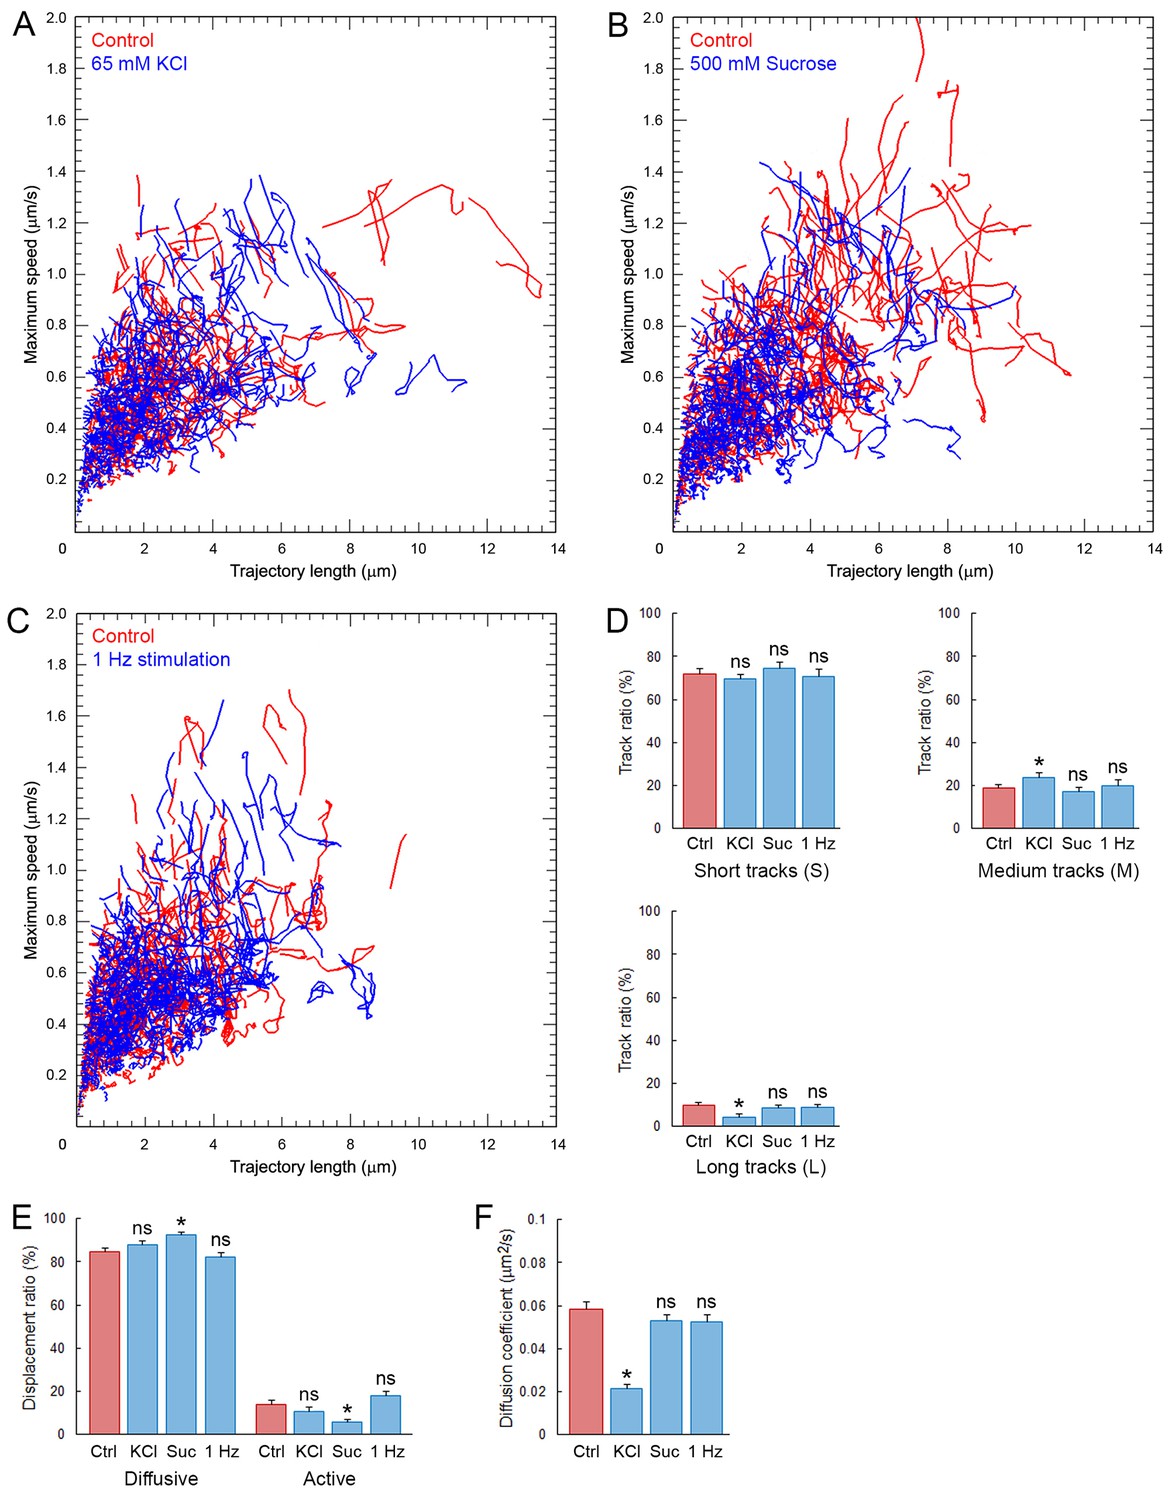
Synaptic stimulation does not increase SV mobility.
Analysis of C5E-Syt2-labeled SVs in giant calyceal terminals. (A) KCl stimulation: Scatter plot of SV trajectory lengths and maximum speeds superimposed with individual trajectory traces in control terminals (Red) or terminals incubated with 65 mM KCl (Blue). (B) Sucrose stimulation: Scatter plot of SV trajectory lengths and maximum speeds superimposed with individual trajectory traces in control terminals (Red) or terminals incubated with 500 mM sucrose (Blue). (C) Electrical simulation: Scatter plot of SV trajectory lengths and maximum speeds superimposed with individual trajectory traces in control terminals (Red) or terminals during 1 Hz electrical field stimulation for 30 s (Blue). (D) Trajectory length analysis in control (Red) and KCl-treated terminals, sucrose-treated terminals, or 1 Hz-stimulated (Blue) terminals. (E) Displacement modality analysis in control (Red) and KCl-treated terminals, sucrose-treated terminals, or 1 Hz-stimulated (Blue) terminals. (F) Diffusion coefficient analysis in control (Red) and KCl-treated terminals, sucrose-treated terminals, or 1 Hz-stimulated (Blue) terminals. (KCl treatment: n = 6; sucrose treatment: n = 6; 1 Hz stimulation: n = 6 in D, (E and F). Two-tailed unpaired t-test (*p<0.05; ns, not significant).
-
Figure 7—source data 1
Data and statistics for Figure 7D, E and F.
- https://doi.org/10.7554/eLife.24845.036
-
Figure 7—source data 2
Data and statistics for Figure 7—figure supplement 1C.
- https://doi.org/10.7554/eLife.24845.037
Figure 7—figure supplement 1
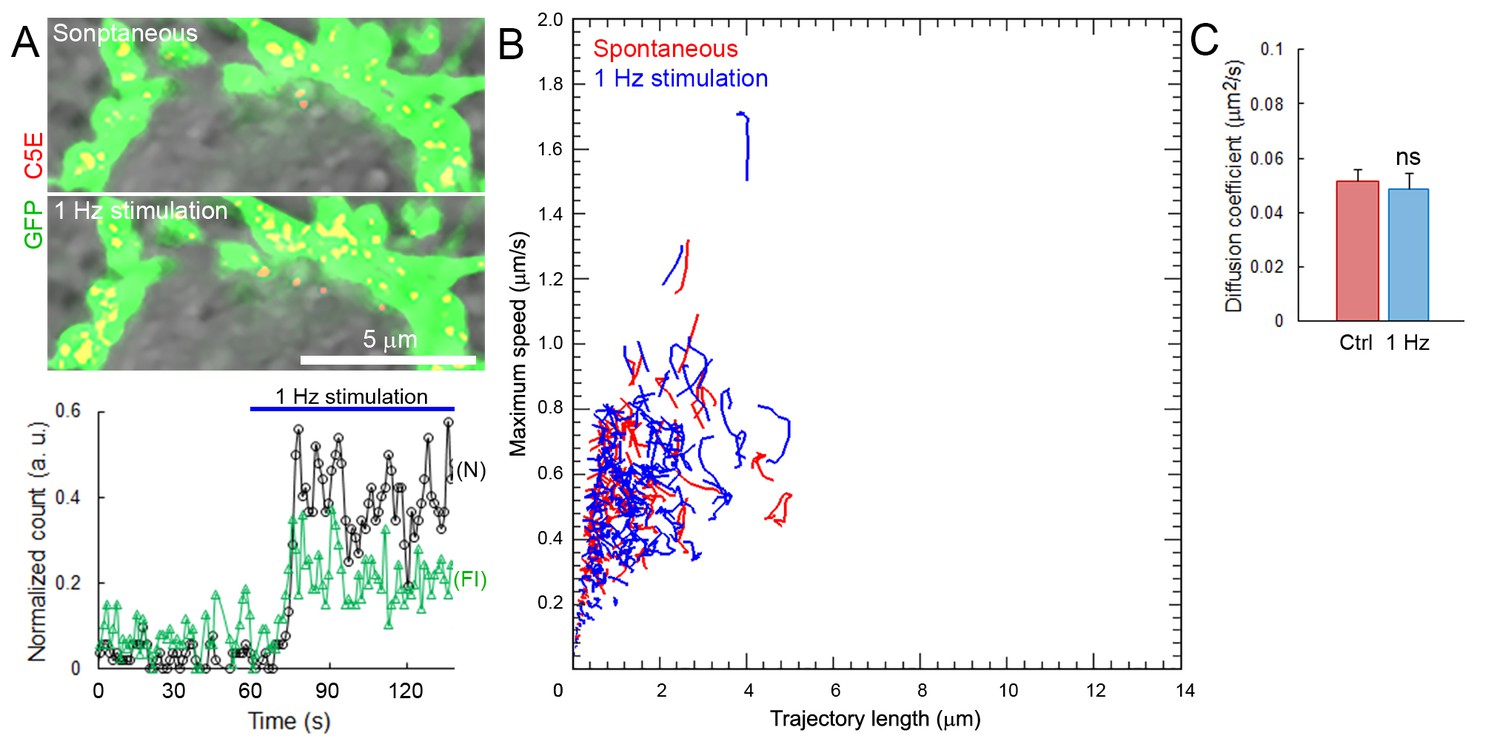
SV mobility does not change after spontaneous or stimulated uptake.
(A) Upper panels: confocal images of C5E-Syt2 labeled vesicles loaded during spontaneous activity for 1 hr or during train of 1 Hz electrical stimulation. Lower panel: Number (N) and fluorescence intensity (FI) of C5E-Syt2-labeled vesicles loaded spontaneously or during 1 Hz stimulation (Blue bar). (B) Scatter plot of SV trajectory lengths and maximum speeds superimposed with individual trajectory traces during spontaneous (Red) or stimulated activity (Blue). (C) Diffusion coefficients of C5E-Syt2-labeled vesicles loaded during spontaneous (Red, n = 3 terminals) or stimulated (Blue, n = 3) activity. Two-tailed unpaired t-test (ns, not significant).
Figure 8

Electrical stimulation does not affect SV mobility within or outside of active zone.
(A) Live confocal imaging of surface GluR1/2-Cy3 and Syt2-C5E-loaded SVs in GFP over-expressing giant calyceal terminal. (B) SV tracking color-coded according to trajectory length (Blue < 2 µm, Green 2–4 µm and red >4 µm) and within (Cyan) AZs (Magenta). (C) Quantification of the number of SV trajectories inside or outside of AZs in control (Black, n = 3 terminals) and during electrical stimulation at 1 Hz for 30 s (Red, n = 3). (D) Comparison of diffusion coefficient of SVs inside and outside of AZs between control (Black, n = 6 terminals) and electrical stimulation at 1 Hz (Red, n = 6). Two-tailed unpaired t-test (*p<0.05; ns, not significant). Rich media files.
-
Figure 8—source data 1
Data and statistics for Figure 8C and D.
- https://doi.org/10.7554/eLife.24845.040
Videos
Video 1
Volume rendering of GFP-expressing giant calyceal terminal and spot detection of Q655-Syt2-labeled SVs (color-coded according to their z position).
https://doi.org/10.7554/eLife.24845.011
Video 2
Tracking of Q655-Syt2-labeled SVs using autoregressive (Red) or Brownian (Blue) motion algorithm.
https://doi.org/10.7554/eLife.24845.012
Video 3
Tracking of Q655-Syt2-labeled SVs color-coded according to SV trajectory lengths (Blue: short, Green: intermediate and Red: long trajectories).
https://doi.org/10.7554/eLife.24845.020
Video 4
Scatter plot of SV trajectory lengths and maximum speeds during 30 s time-series.
https://doi.org/10.7554/eLife.24845.021Download links
A two-part list of links to download the article, or parts of the article, in various formats.
Downloads (link to download the article as PDF)
Open citations (links to open the citations from this article in various online reference manager services)
Cite this article (links to download the citations from this article in formats compatible with various reference manager tools)
Presynaptic morphology and vesicular composition determine vesicle dynamics in mouse central synapses
eLife 6:e24845.
https://doi.org/10.7554/eLife.24845


