Reciprocal regulation of ARPP-16 by PKA and MAST3 kinases provides a cAMP-regulated switch in protein phosphatase 2A inhibition
- Yale University School of Medicine, United States
- The Babraham Institute, United Kingdom
- Yale University School Medicine, United states
- The Rockefeller University, United States
Figures
Figure 1 with 1 supplement
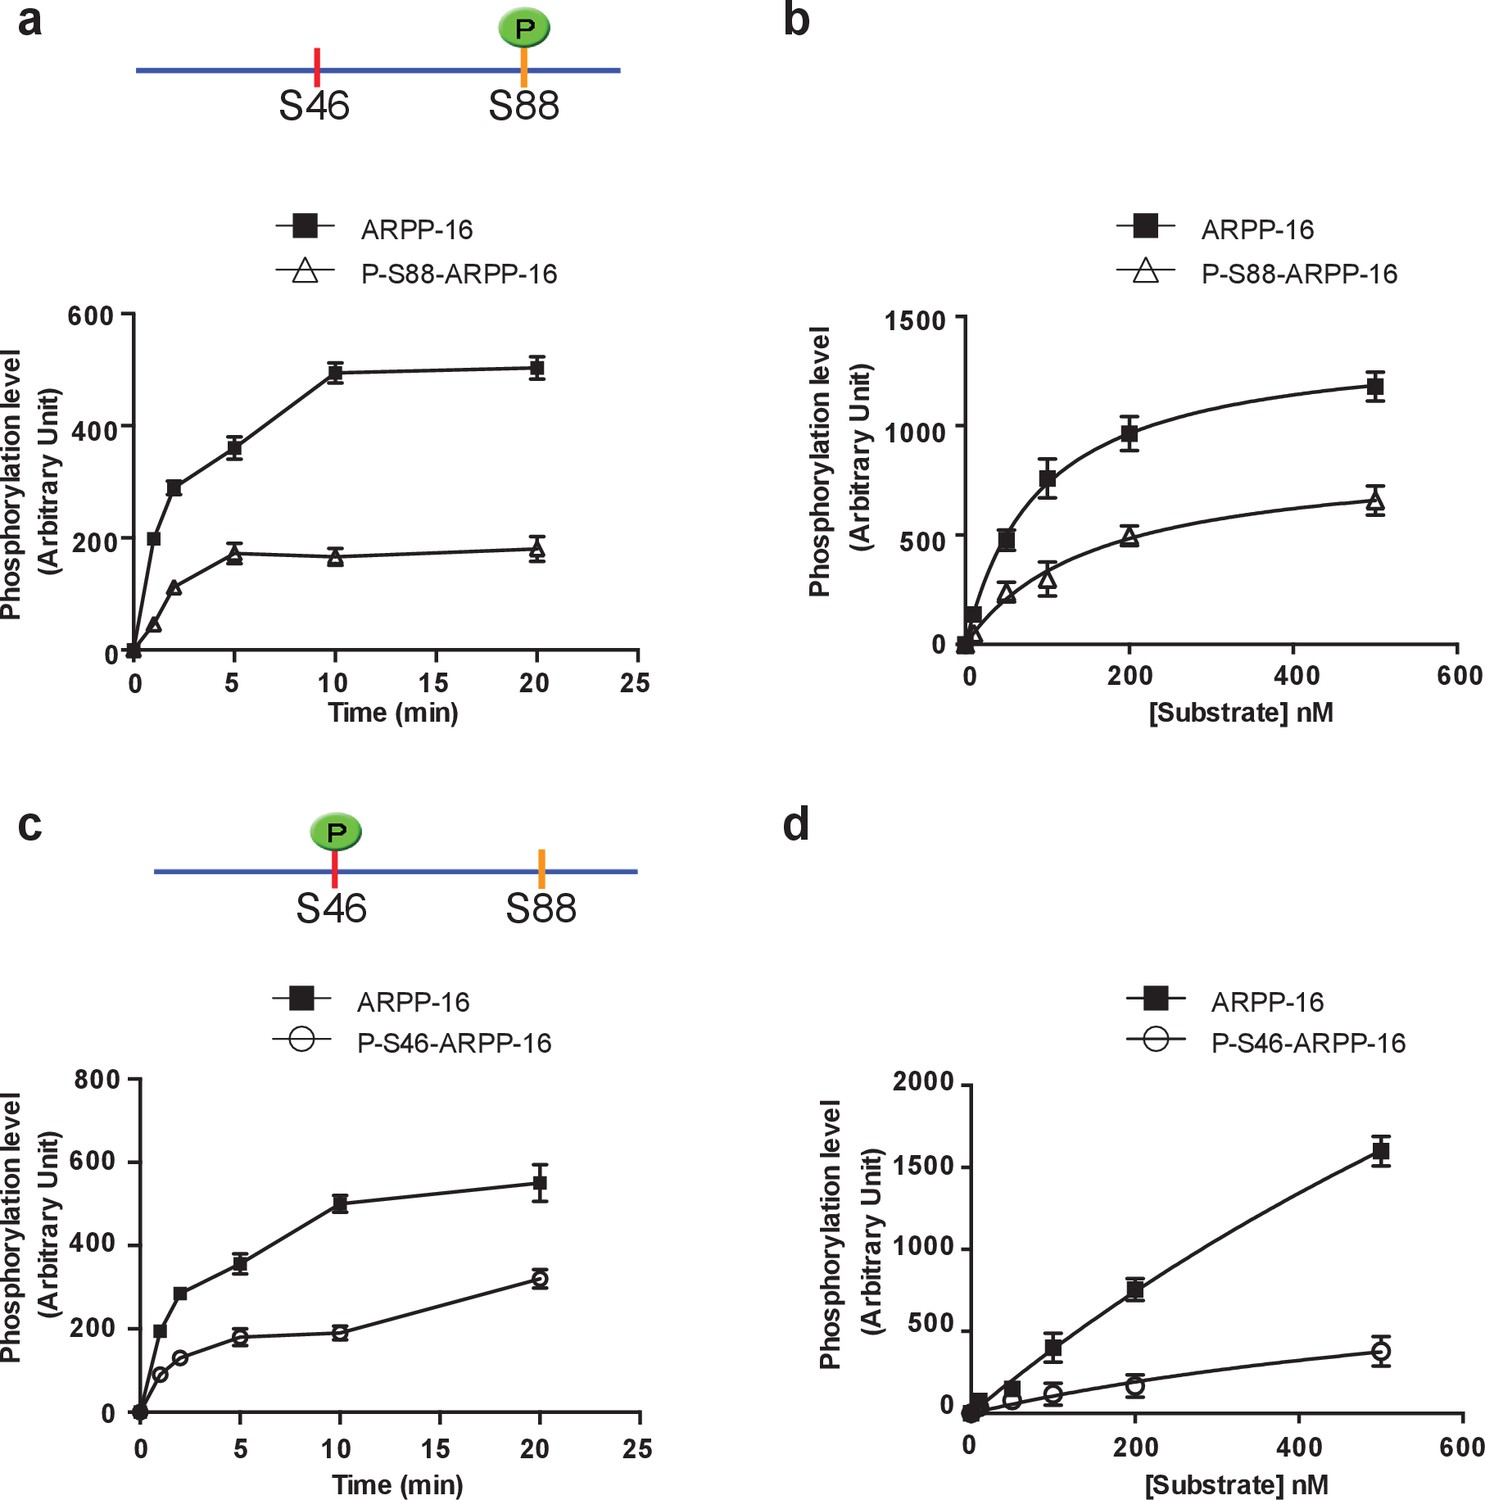
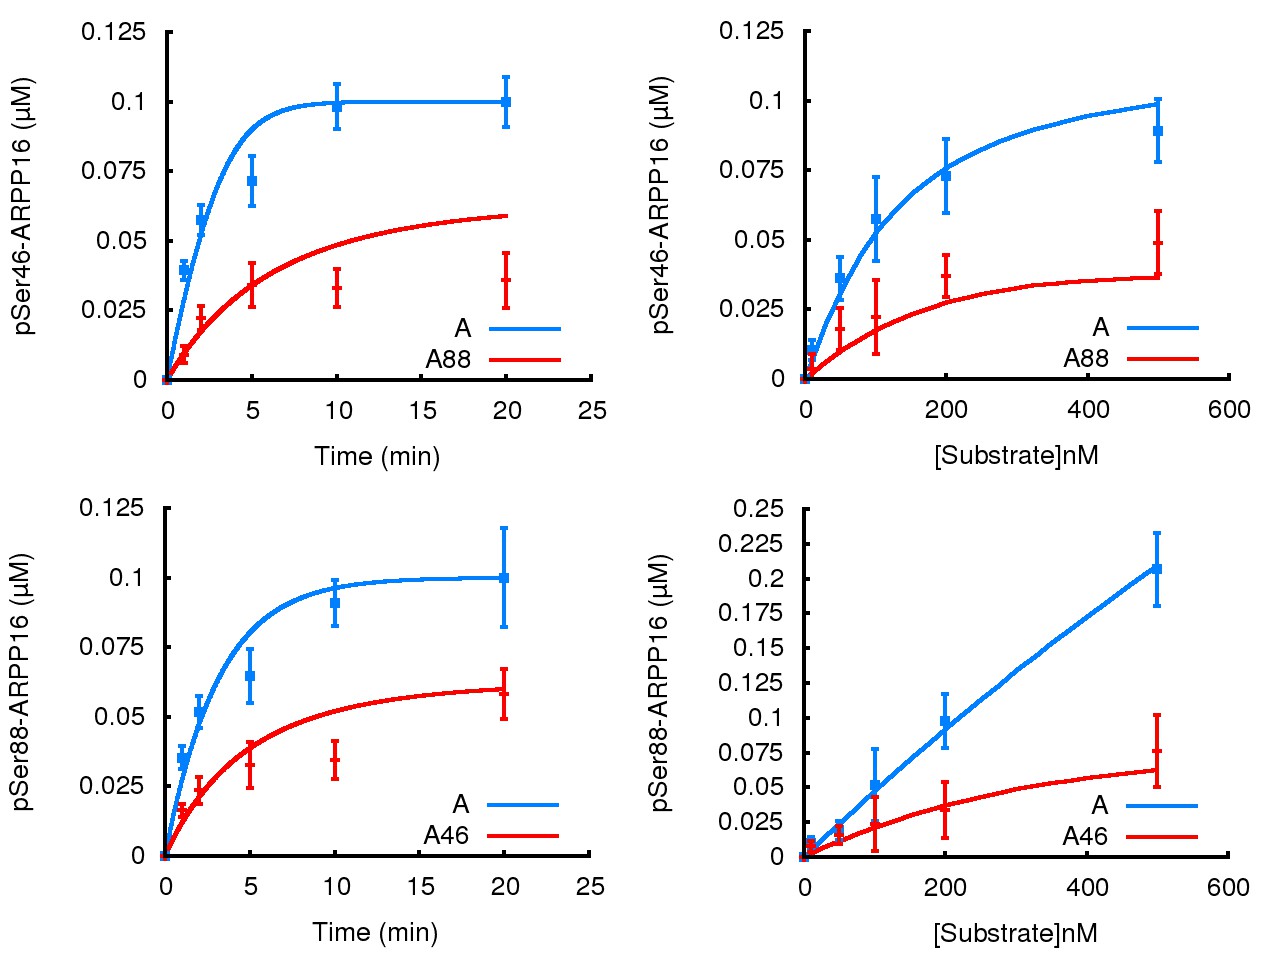
PKA-mediated Ser88 phosphorylation attenuates the ability of MAST3 to phosphorylate S46-ARPP-16, and MAST3-mediated phosphorylation of Ser46 attenuates the ability of PKA to phosphorylate S88-ARPP-16.
(a) Recombinant purified ARPP-16 or P-S88-ARPP-16 (100 nM) were incubated with ATP-γ-32P and MAST3 (overexpressed in HEK293T cells and immunoprecipitated), for various times; proteins were separated by SDS-PAGE and phosphorylation of Ser46 was measured by autoradiography. The resulting values for phosphorylation are expressed in arbitrary densitometric units (a.u.) as mean ± SE of five independent experiments. (b) Assays were carried out as in a. but with increasing concentrations (10–500 nM) of ARPP-16 or P-S88-ARPP-16 for 2 min. Kinetic parameters, determined from double-reciprocal plots, of the data are indicated in Table 1. (c) Recombinant purified ARPP-16 or P-S46-ARPP-16 were incubated with ATP-γ-32P and PKA for various times; proteins were analyzed as described in panel a. The resulting values for phosphorylation are expressed in arbitrary densitometric units (a.u.) as mean ± SE of five independent experiments. (d) Assays were carried out as in c. with increasing concentrations (10–500 nM) of ARPP-16 or P-S46-ARPP-16. Kinetic parameters, determined from double-reciprocal plots, of the data are presented in Table 1.
Figure 1—figure supplement 1
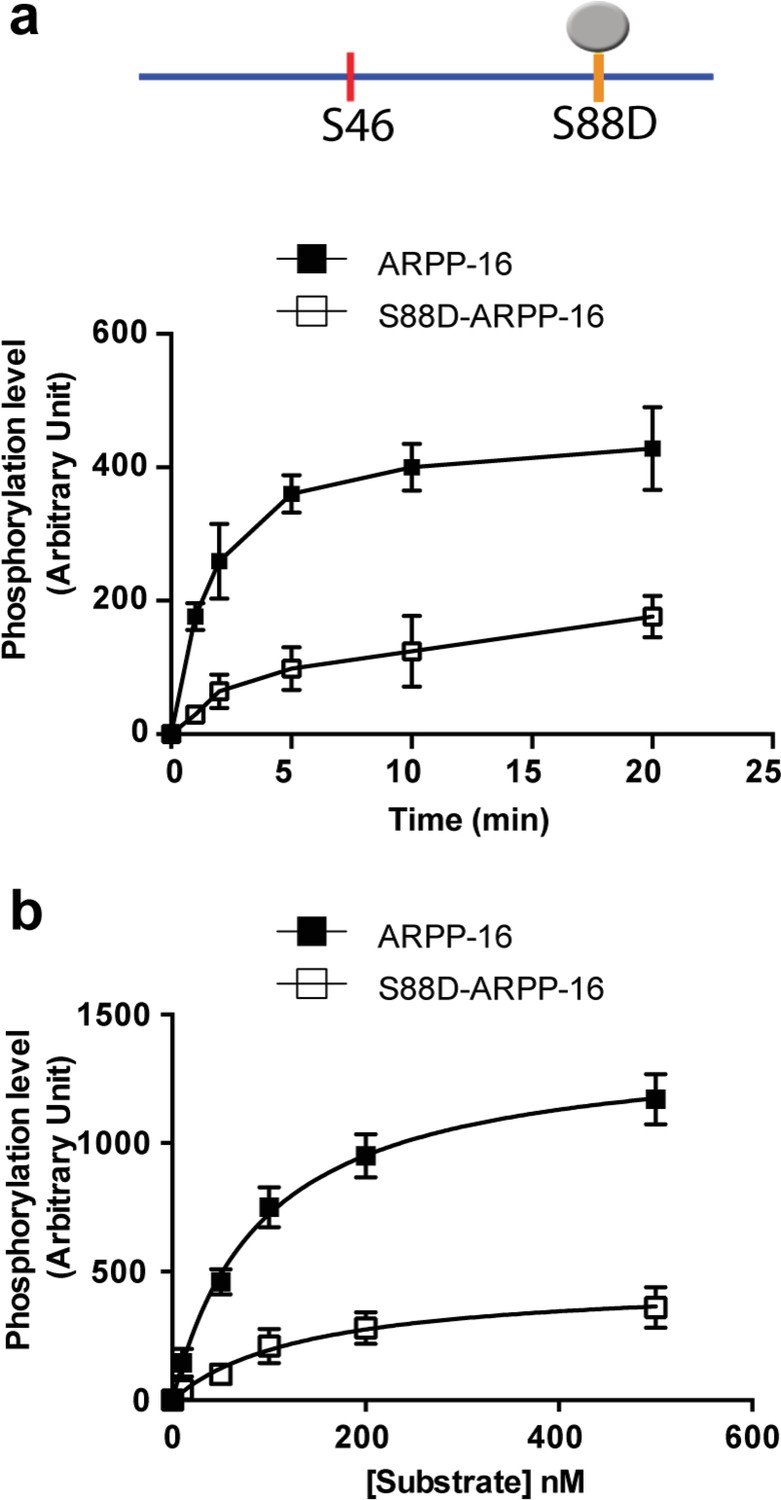
A phospho-mimetic mutation of S88-ARPP-16 attenuates the ability of MAST3 to phosphorylate S46-ARPP-16.
(a) Recombinant purified ARPP-16 or the phosphomimetic S88A-ARPP-16 (100 nM) were incubated with ATP-γ-32P and MAST3 for various times; the proteins were separated by SDS-PAGE and phosphorylation of Ser46 was measured by autoradiography. The resulting values for phosphorylation at Ser46 site are expressed in arbitrary densitometric units (a.u.) as mean ± SE of three independent experiments. (b) Assays were carried out as in a. with increasing concentrations (10–500 nM) of ARPP-16 or of the phosphomimetic S88A-ARPP-16 for 2 min. Kinetic parameters, determined from double-reciprocal plots, of the data are presented in Table 1.
Figure 2 with 1 supplement
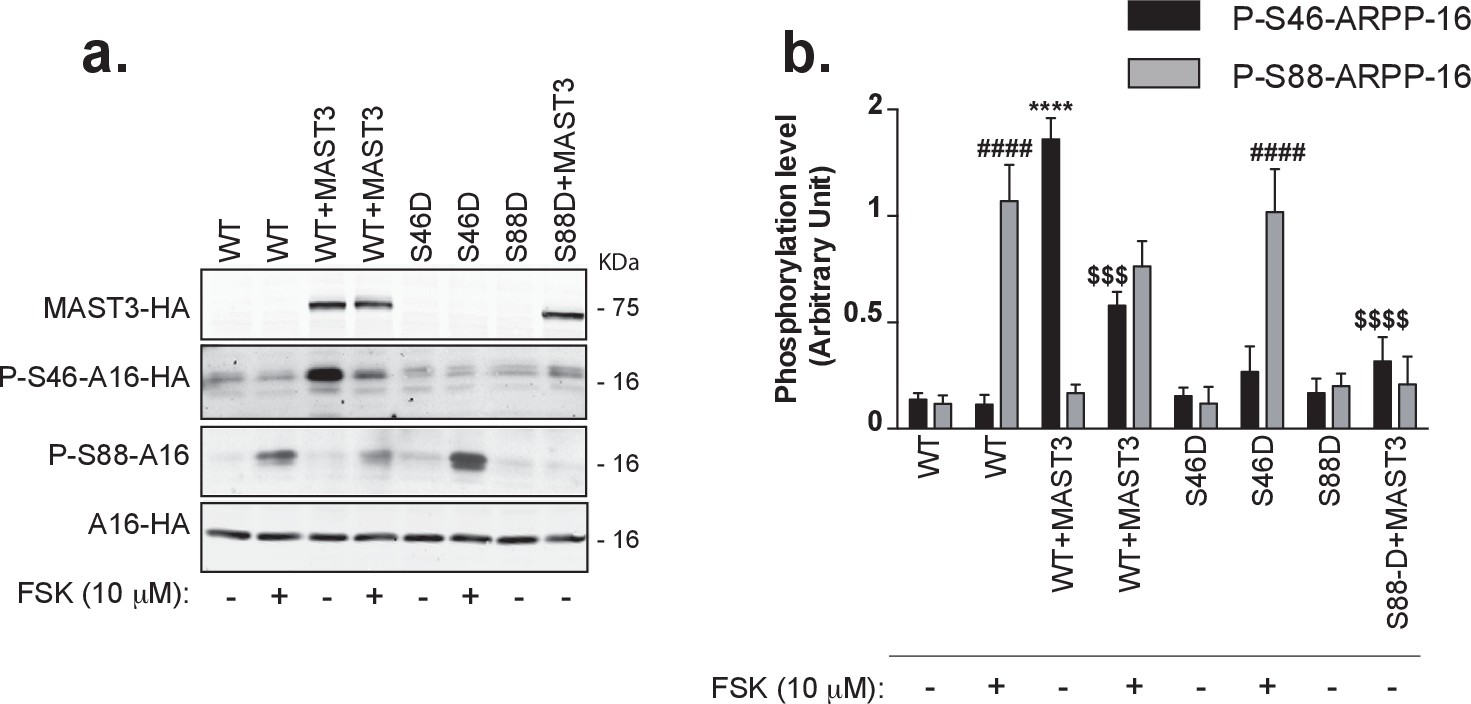
cAMP signaling increases phosphorylation of Ser88 and decreases phosphorylation of Ser46 in HEK293T cells.
(a) ARPP-16-HA (WT) or the phosphomutants S46D-ARPP-16 or S88D-ARPP-16 were expressed in HEK293T cells alone or in the presence of MAST3-HA kinase. Cells were incubated without or with 10 μM forskolin (FSK) for 30 min. Levels of phosphorylation for Ser46 and Ser88 were measured by immunoblotting with phospho-specific antibodies on SDS-PAGE-resolved cell lysates. Phospho-site signals were normalized for total ARPP-16-HA expression assayed by immunoblotting using anti-HA antibody (A16–HA). For P-S88-ARPP-16 the signal for total ARPP-16-HA was quantified from a separate blot of the same samples. (b) Graph of summary data shows phosphorylation at the different sites expressed in arbitrary densitometric units (a.u.) as mean ± SE of six independent experiments, and analyzed using a one-way ANOVA, multiple comparison test (post-hoc test Tukey). For P-S46-ARPP-16: ****p<0.001, ARPP-16/MAST3 vs ARPP-16 ctrl; $$$ p<0.005, ARPP-16/MAST3 vs ARPP-16/MAST3/FSK; $$$$p<0.001 ARPP-16/MAST3 vs ARPP-16-S88D/MAST3. For P-S88-ARPP-16: ####p<0.001, ARPP-16/FSK vs ARPP-16 ctrl; ####p<0.001, S46D-ARPP-16/FSK vs ARPP-16 ctrl.
Figure 2—figure supplement 1

Regulation of ARPP-16 phosphorylation by the D1 receptor agonist, SKF-81297, in striatal slices.
Striatal slices were treated with forskolin (10 μM) (panel a and b), SKF-81297 (panel c and d) or DMSO (as control, panel a, b, c and d) for 15 min. Phosphorylation of ARPP-16 at Ser46 and Ser88 (and GluA1 at Ser845, DARPP-32 at Thr34, assayed as controls) were determined by immunoblotting using phosphorylation state-specific antibodies. Quantitation of phosphorylation was calculated for GluA1-Ser845, DARPP-32-Thr34, ARPP-16-Ser46 and ARPP-16-Ser88 and normalized to total GluA1, DARPP-32, or ARPP-16, respectively. Total proteins were also normalized to GAPDH (panel b. and d.). Graphs represent means ± SEM for 6–8 experiments compared with control slices; **p=0.0011, ***p=0.0006, ****p<0.0001; unpaired T test.
Figure 3 with 7 supplements
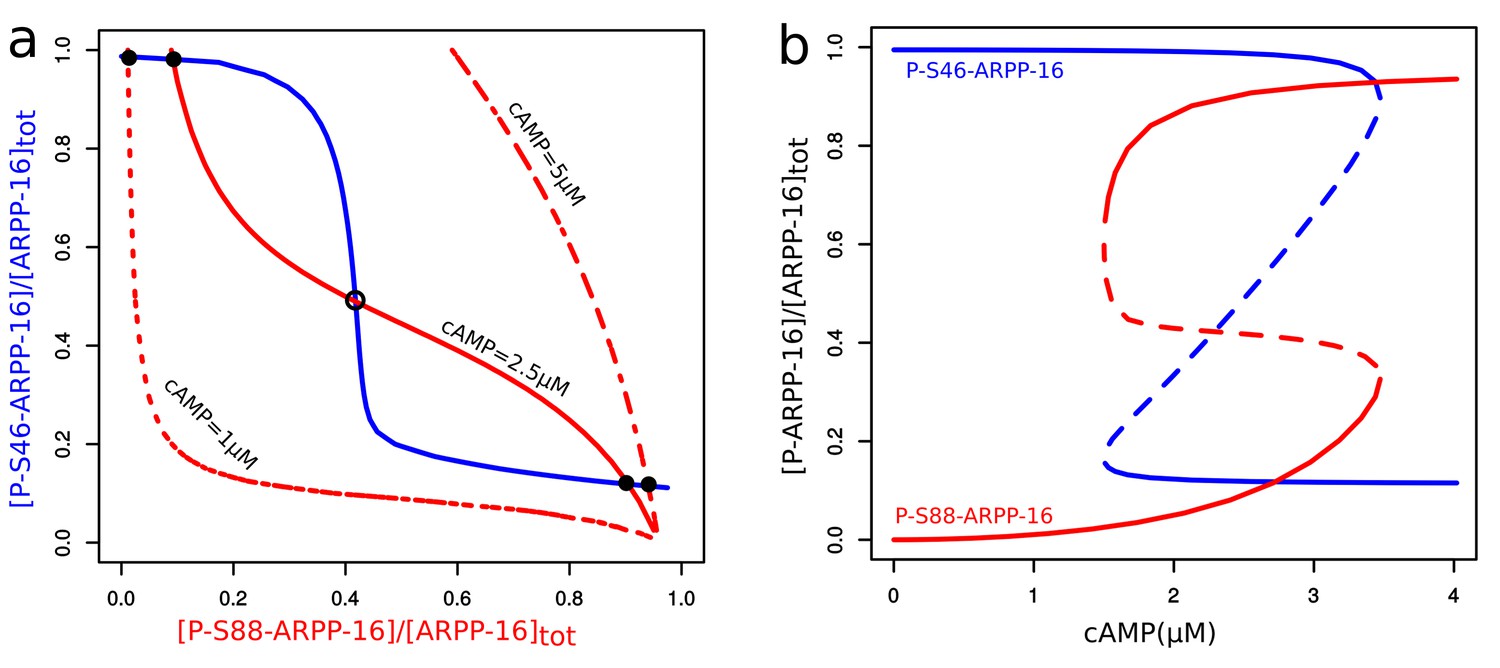
Mathematical modeling shows bistability derived from the reciprocal interactions of ARPP-16 phosphorylation sites.
(a) Nullclines of P-S46-ARPP-16 and P-S88-ARPP-16. The steady states of P-S46-ARPP-16 (blue) and P-S88-ARPP-16 (red) are plotted as functions of the concentrations of each other. The intersections of the red and blue curve define the steady states of the system at different cAMP concentrations. Filled circles represent stable steady states, whereas the empty circle indicates an unstable state. (b) Antagonism between P-S46-ARPP-16 and P-S88-ARPP-16 creates a switch-like cAMP response. The figure shows bifurcation diagrams of P-S46-ARPP-16 (blue) and P-S88-ARPP-16 (red) plotted as functions of cAMP concentration. Solid lines show stable steady state solutions whereas dashed lines indicate unstable state values.
Figure 3—figure supplement 1
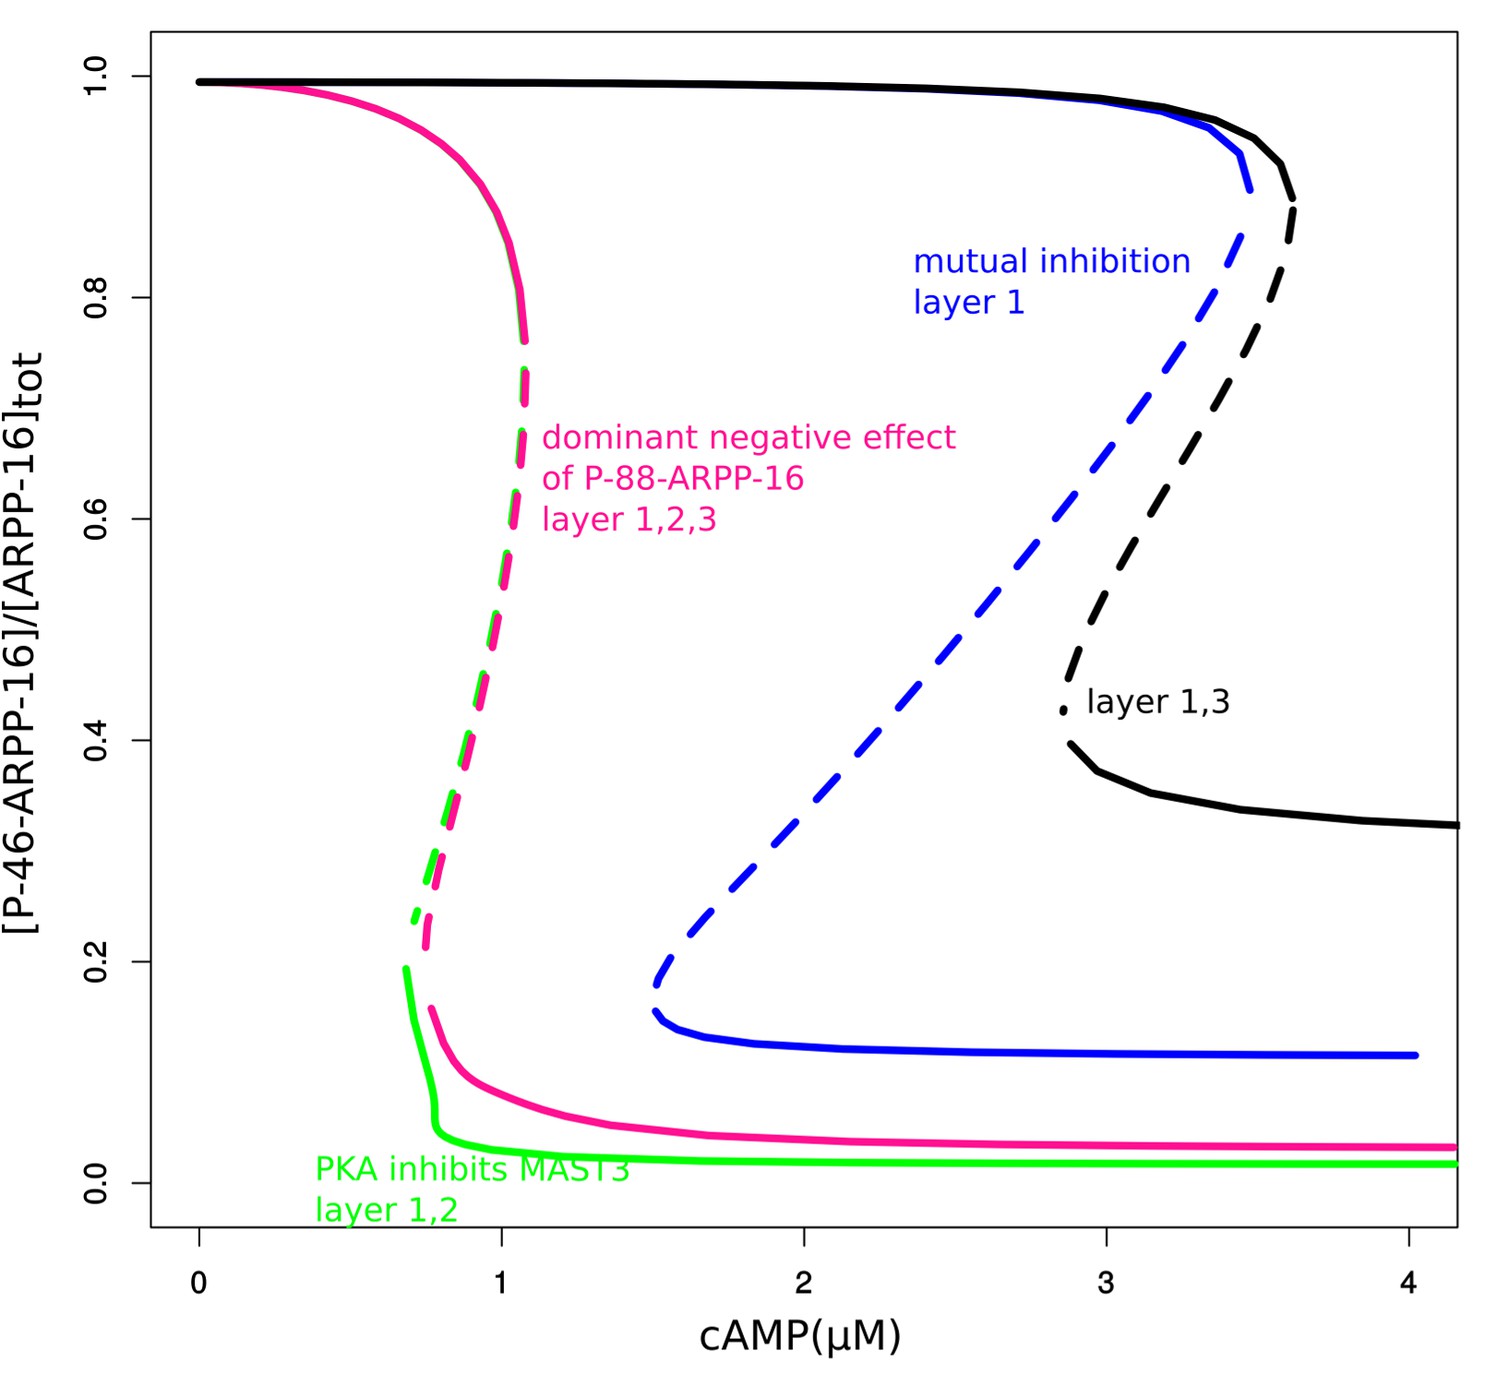
Bifurcation diagrams of P-S46-ARPP-16 under mutual inhibition (blue, layer 1), PKA inhibition of MAST3 (green, this effect is in addition to previous effect, layers 1 + 2), P-S88-ARPP-16 dominant negative effect on P-S46-ARPP-16 inhibiting PP2A (pink, this effect is in addition to previous effects, layers 1 + 2 + 3), and mutual inhibition with P-S88-ARPP-16 dominant negative effect (black, layers 1 + 3).
https://doi.org/10.7554/eLife.24998.008
Figure 3—figure supplement 2
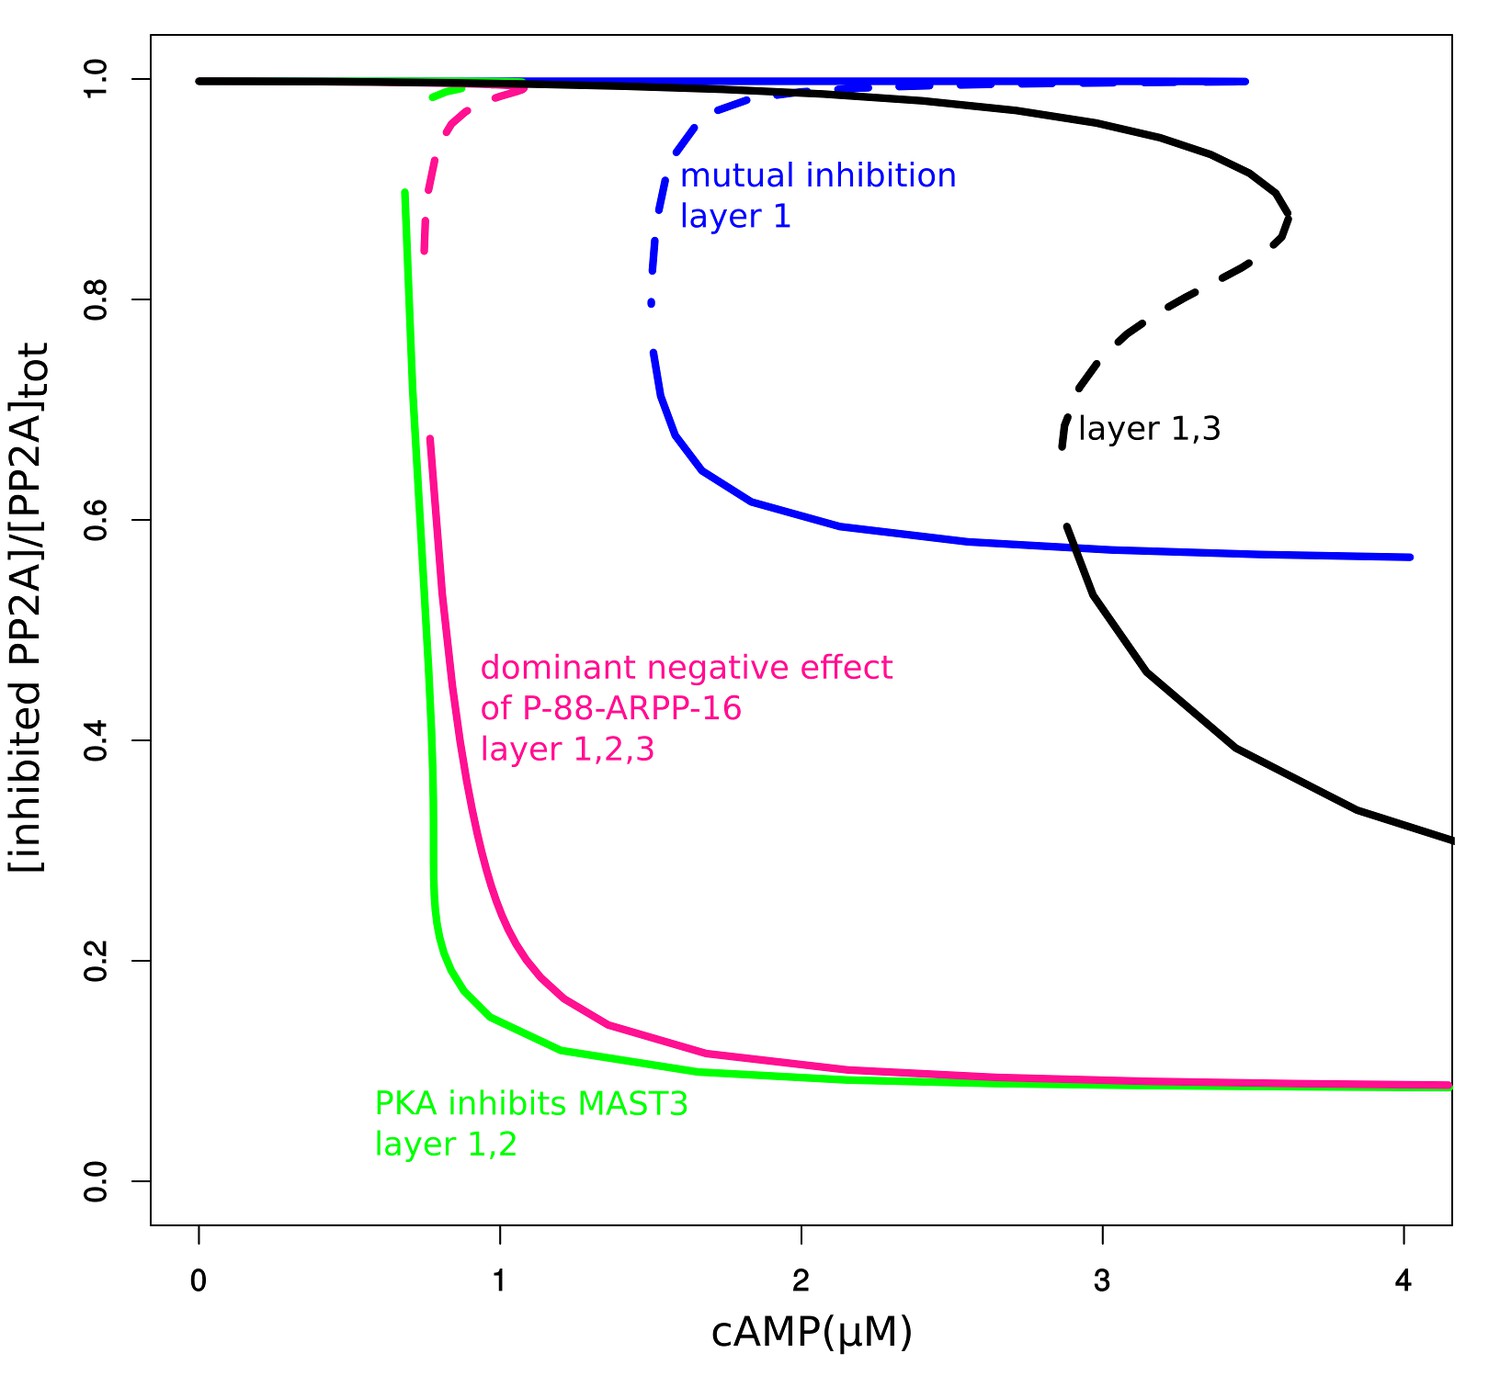
Bifurcation diagrams of inhibited PP2A under three different layers of regulation described in Figure 3—figure supplement 1.
https://doi.org/10.7554/eLife.24998.009
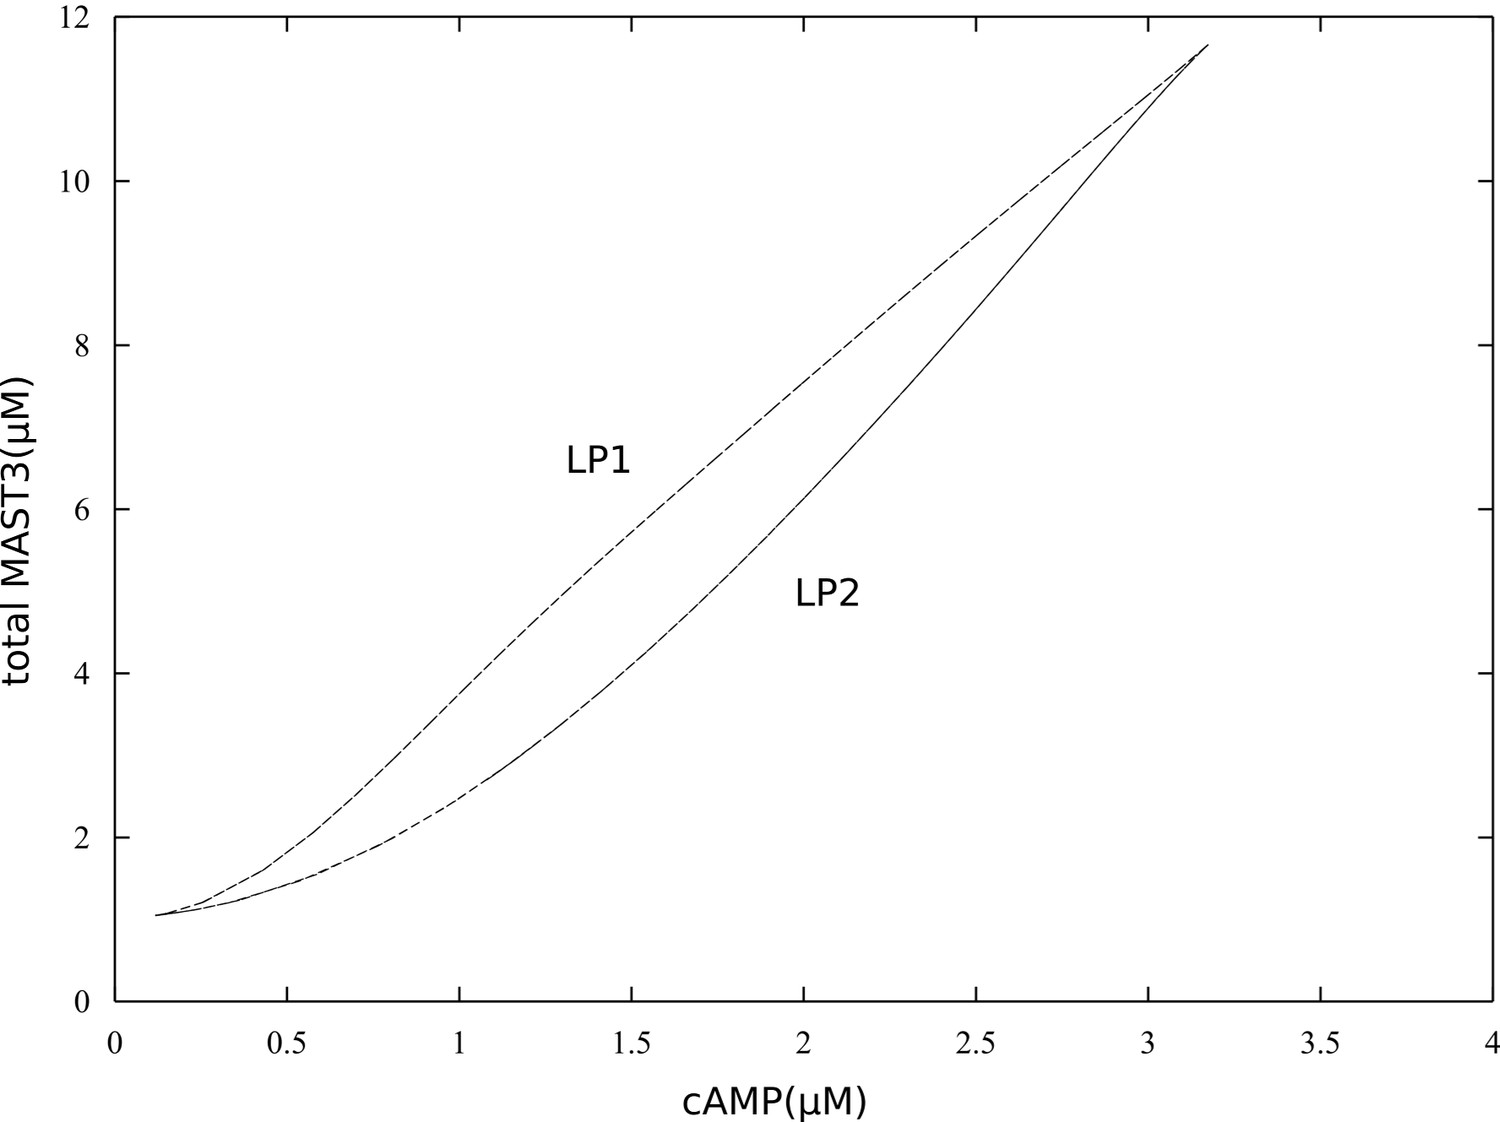
Figure 3—figure supplement 3

Bifurcation diagrams of P-S46-ARPP-16 under different total MAST3 concentrations.
Thin black dashed lines show an example range of cAMP concentrations required for bistability. LP: limit points.
Figure 3—figure supplement 4

Bifurcation diagram of P-S46-ARPP-16, in terms of total MAST3 concentration changes at a fixed cAMP concentration (1.5 µM).
https://doi.org/10.7554/eLife.24998.011
Figure 3—figure supplement 5
Double-parameter bifurcation diagram (cAMP and MAST3tot) showing how total concentration of MAST3 affects the two cAMP thresholds (LP: limit points shown in Figure 3—figure supplement 3); and how cAMP concentration affects the two MASTtot thresholds.
https://doi.org/10.7554/eLife.24998.012
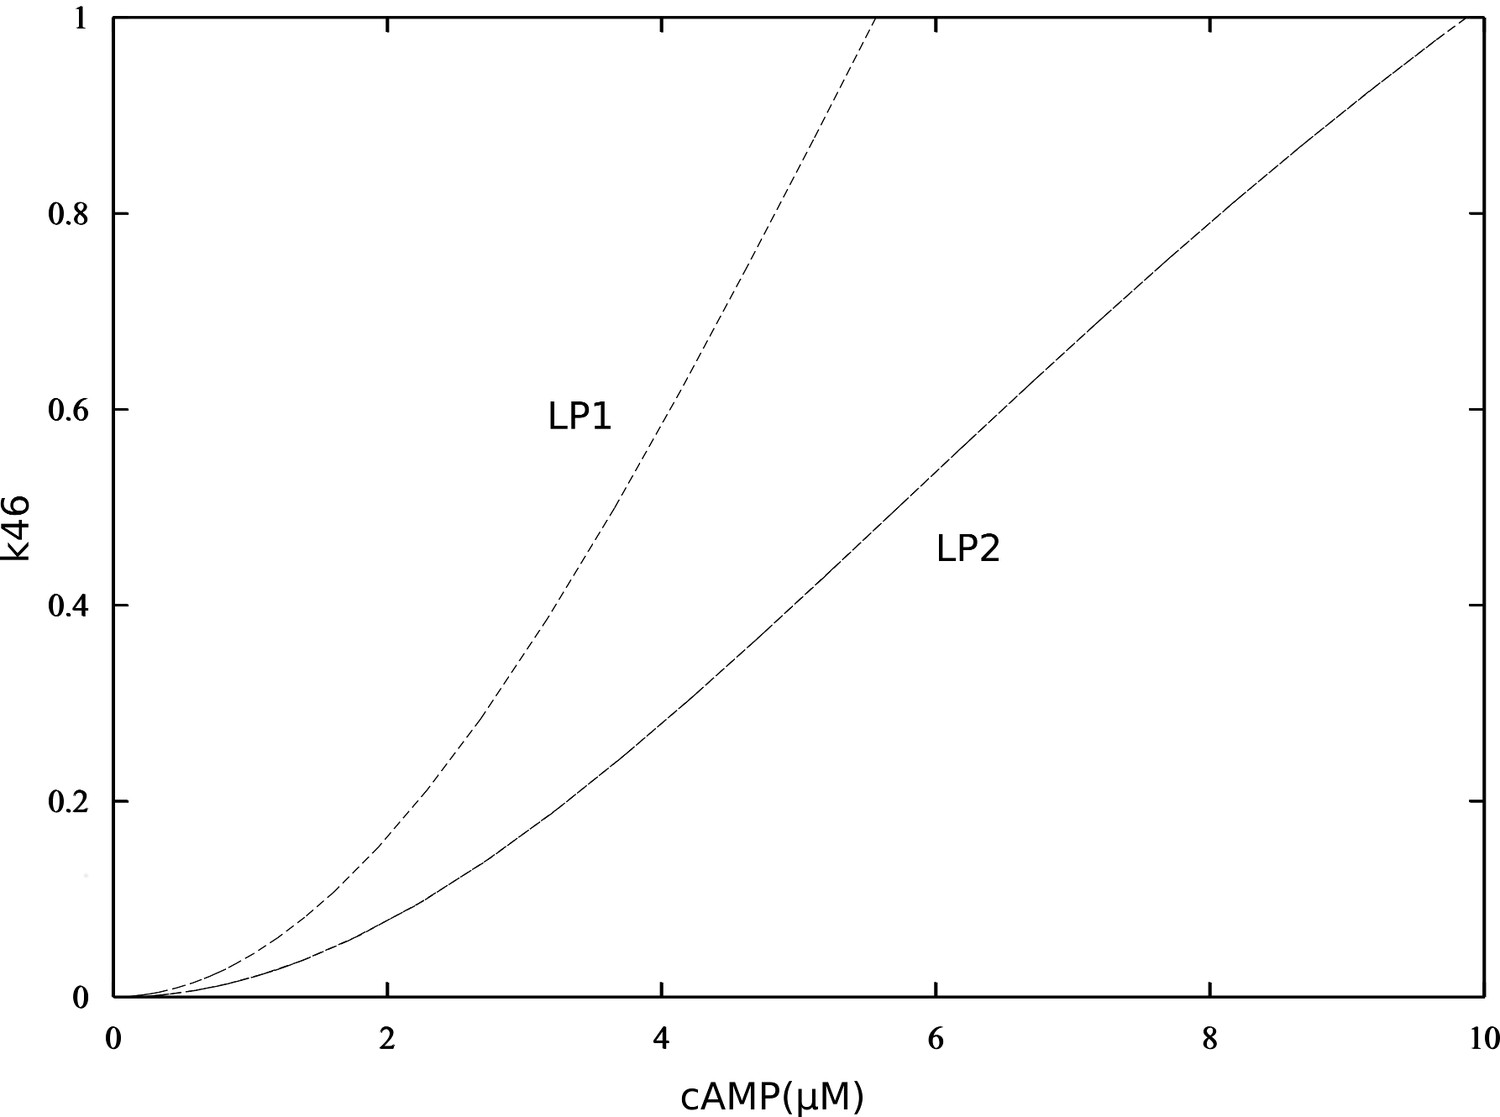
Figure 3—figure supplement 6

Bifurcation diagrams of P-S46-ARPP-16, with increasing P-S46-ARPP-16 inhibitory effect on Ser88 phosphorylation (k46).
Thin black dash lines show an example range of cAMP concentrations required for bistability. LP: limit points.
Figure 3—figure supplement 7
Double-parameter bifurcation diagram (cAMP and k46) showing how inhibitory effect of P-S46-ARPP-16 affects the two cAMP thresholds.
(LP: limit points corresponding to Figure 3—figure supplement 6).
Figure 4
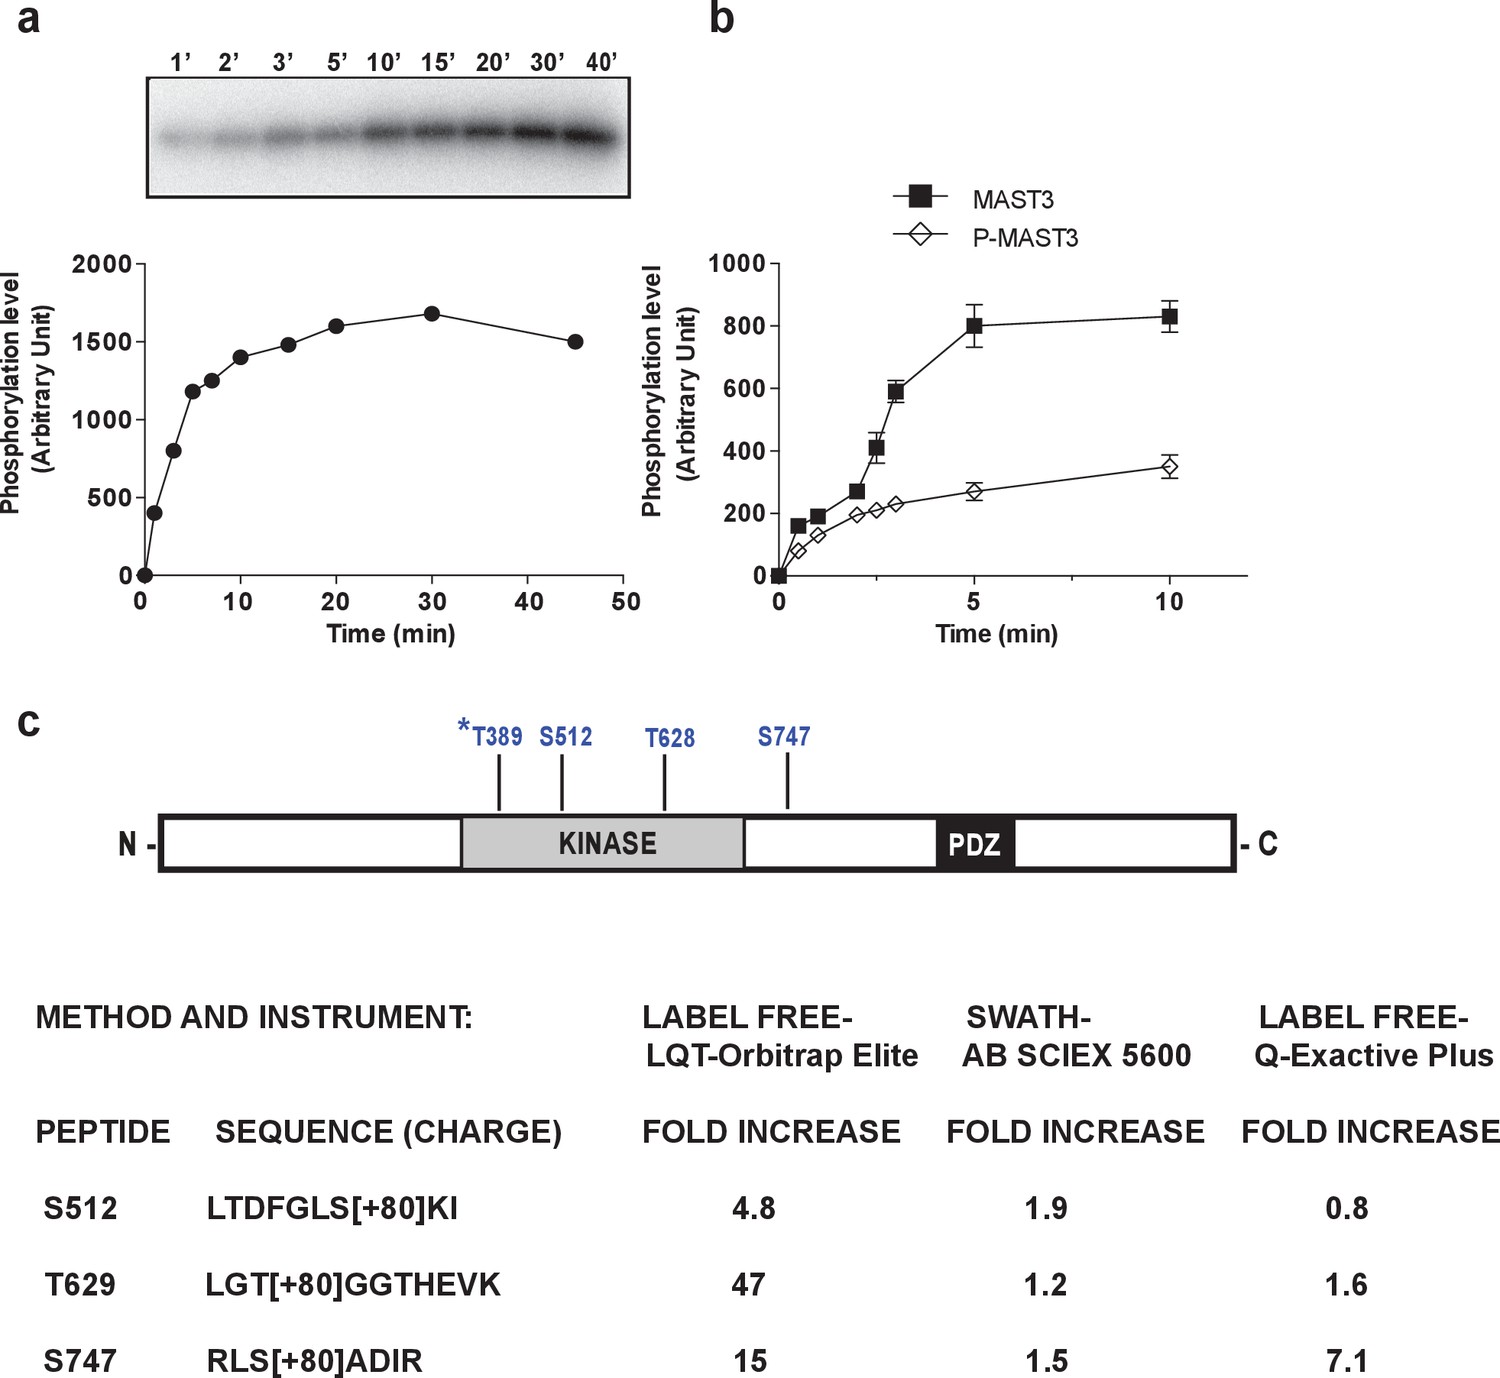
MAST3 phosphorylation by PKA in vitro inhibits MAST3 kinase activity; summary scheme of mass spectrometry results showing phosphorylation sites in MAST3.
(a) MAST3-HA kinase (overexpressed in HEK293T cells and immunoprecipitated), was incubated with ATP-γ-32P and PKA for various times; proteins were separated by SDS-PAGE and phosphorylation of MAST3-HA was measured by autoradiography (upper panel). Summary data (lower panel) are expressed in arbitrary densitometric units (a.u.) as mean ± SE of five independent experiments. (b) MAST3-HA was pre-incubated without (MAST3) or with PKA (P-MAST3) and ATP for 30 min. Recombinant purified ARPP-16 (100 nM) was incubated with P-MAST3 or MAST3 in the presence of ATP-γ-32P, for various times; proteins were analyzed as described in panel a. The resulting values for phosphorylation are expressed in arbitrary densitometric units (a.u.) as mean ± SE of three independent experiments. (c) The domain structure of MAST3 is illustrated. The position of the four phosphorylation sites studied are indicated. MAST3-HA was overexpressed in HEK293T cells and incubated in the absence or presence of 10 μM forskolin (FSK) for 30 min. MAST3-HA was isolated by immunoprecipitation and the samples analyzed by LC-MS/MS. The fold-change increase in phosphorylation of S512, T628 and S747 was assessed by different proteomic methods, namely LABEL FREE or SWATH, on different mass spectrometers. Data are presented as –fold change in peptide phosphorylation in response to forskolin compared to control. *T389: Phosphorylation of T389 was identified but not quantitated.
Figure 5
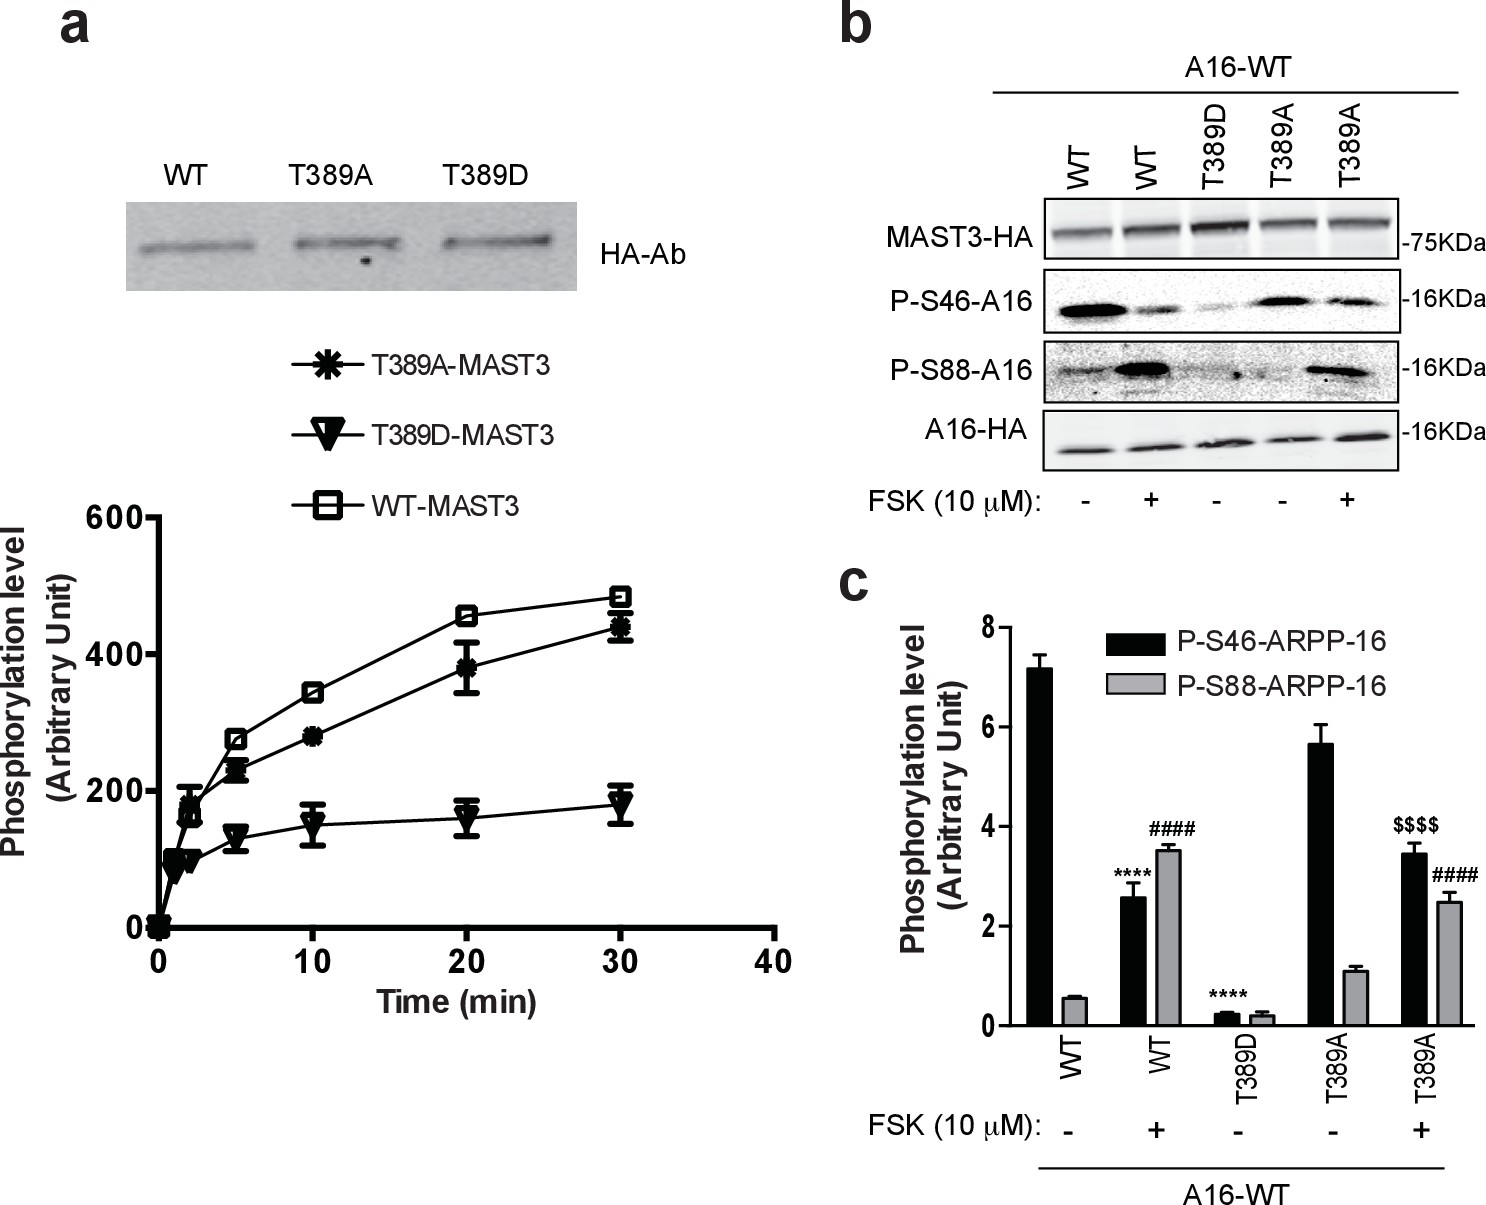
Phosphorylation at Thr389 by PKA inhibits MAST3 activity.
(a) WT MAST3-HA and the unphosphorylable T389A-MAST3-HA or the phosphomimetic T389D-MAST3-HA were expressed in HEK293T cells and isolated by immunoprecipitation. Upper panel shows immunoblotting of WT and mutant MAST-HA proteins. T389A-MAST3 was pre-incubated for 20 min with PKA prior to the assay with ARPP-16. All MAST3 proteins were then incubated with ARPP-16 in the presence of ATP-γ-32P for different times. The proteins were resolved by SDS-PAGE and phosphorylation of Ser46 was measured by autoradiography. The results are expressed in arbitrary densitometric units (a.u.) as mean ± SE of three independent experiments. (b) ARPP-16-HA was expressed in HEK293T cells alone or with WT MAST3-HA and the phospho-mutants T389D orT389A-MAST3-HA. Cells were treated without or with 10 μM forskolin (FSK) for 30 min. Phosphorylation at Ser46 or Ser88 ARPP-16 were measured by immunoblotting with phospho-specific antibodies. Phospho-site signals were normalized for total ARPP-16-HA expression and then to MAST3-HA proteins, each measured by immunoblotting. (c) Graph of summary data shows quantification of phosphorylation on P-S46- and P-S88-ARPP-16 sites expressed in arbitrary densitometric units (a.u.) as mean ± SE of three independent experiments. A one-way ANOVA, multiple comparison test (post-hoc test Tukey) was used for data analysis. P-S46-ARPP-16: ****p<0.001 ARPP-16/MAST3 vs ARPP-16/MAST3/FSK; ****p<0.001, ARPP-16/MAST3 vs ARPP-16/MAST3-T389D; $$$$ p<0.001, ARPP-16/MAST3-T389A vs ARPP-16/MAST3-T389A/FSK. P-S88-ARPP-16: ####p<0.001, ARPP-16/MAST3 vs ARPP-16/MAST3/FSK, ####p<0.001, ARPP-16/MAST3 vs ARPP-16/MAST3-T389A/FSK. The effect of FSK on MAST3 activity was significantly greater than that of the effect of FSK on T389A-MAST3A, two-tailed T test p=0.0146 (not shown).
Figure 6
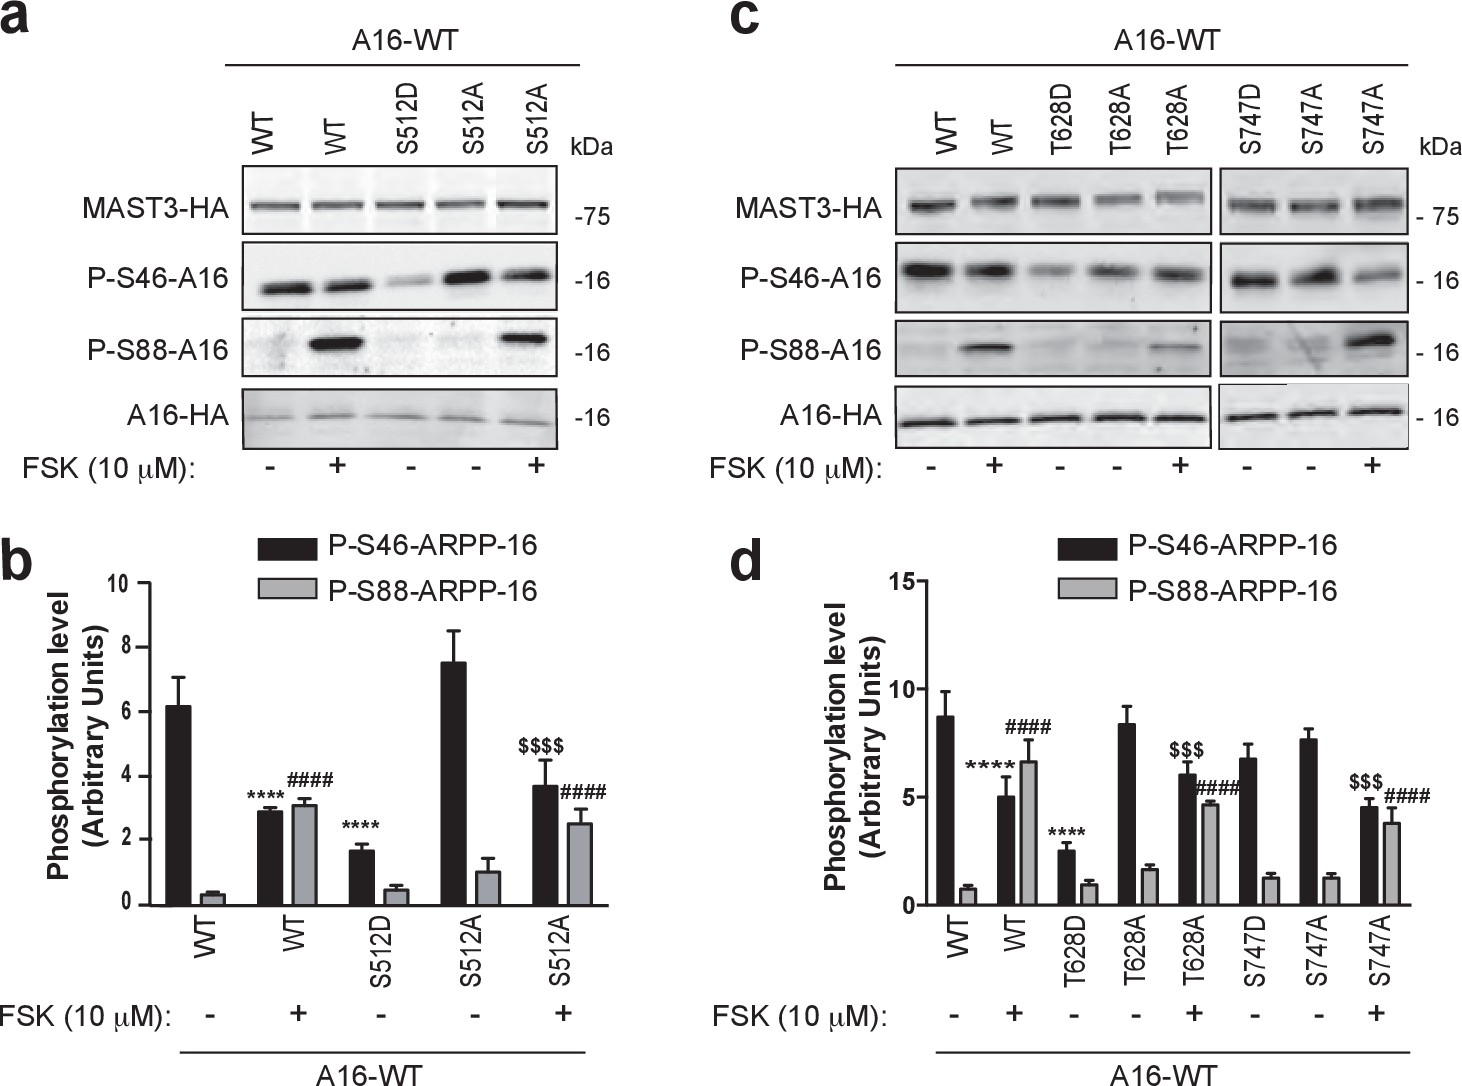
Phosphorylation of S512 and T628 but not S747 regulate MAST3 activity.
ARPP-16-HA was expressed in HEK293T cells with WT MAST3-HA or the mutants S512D- or S512A-MAST3-HA, T628D- or T628A-MAST3-HA, or S747D- or S747A-MAST3-HA. Cells were incubated without or with 10 μM forskolin (FSK) for 30 min. (a and c) Phosphorylation at Ser46 and Ser88 were measured by immunoblotting. Phospho-site signals were normalized for total ARPP-HA and then to MAST3-HA proteins. (b and d) Graphs of summary data show phosphorylation on the different sites expressed in arbitrary densitometric units (a.u.) as mean ± SE of four (S512) or five independent experiments (T628, S747), one-way ANOVA, multiple comparison test (post-hoc test Tukey). Panel b: P-S46-ARPP-16: ****p<0.001, ARPP-16/MAST3 vs ARPP-16/MAST3/FSK, ****p<0.001, ARPP-16/MAST3 vs ARPP-16/MAST3-S512D; $$$$p<0.001, ARPP-16/MAST3-S512A vs ARPP-16/MAST3-S512A/FSK. Panel b: P-S88-ARPP-16: ####p<0.001, ARPP-16/MAST3 vs ARPP-16/MAST3/FSK, ####p<0.001, ARPP-16/MAST3 vs ARPP-16/MAST3-S512A/FSK. Panel d: P-S46-ARPP-16: ****p<0.001, ARPP-16/MAST3 vs ARPP-16/MAST3/FSK; ****p<0.001 ARPP-16/MAST3-T628D vs ARPP-16/MAST3; $$$p<0.005 ARPP-16/MAST3-T628A vs ARPP-16/MAST3-T628A/FSK; $$$p<0.005 ARPP-16/MAST3-S747A vs ARPP-16/MAST3-S747A/FSK. Panel d: P-S88-ARPP-16: ####p<0.001, ARPP-16/MAST3 vs ARPP-16/MAST3/FSK; ####p<0.001, ARPP-16/MAST3 vs ARPP-16/MAST3-T628A/FSK; ####p<0.001, ARPP-16/MAST3 vs ARPP-16/MAST3-S747A/FSK.
Figure 7
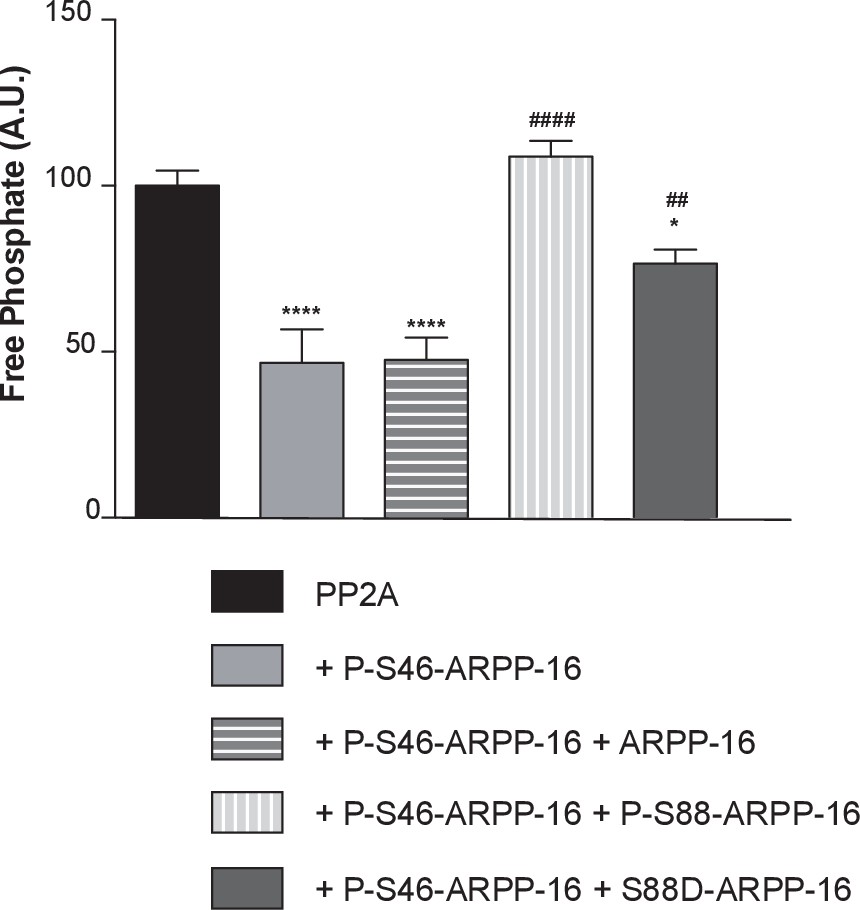
ARPP-16 phosphorylation at Ser88 influences the regulation of PP2A activity.
Recombinant Flag-Bα was expressed in HEK293T cells and the Bα-PP2A heterotrimer isolated by immunoprecipitation using anti-Flag antibody. PP2A-Bα activity was measured in the presence of thiophosphorylated P-γ-S46-ARPP-16, or a mixture of P-γ-S46-ARPP-16 plus ARPP-16, plus P-S88-ARPP-16, or plus S88D-ARPP-16 (200 nM for each protein). Phosphatase activity was detected using a malachite green assay kit (Millipore). Results are expressed as percent activity with respect to PP2A-Bα activity measured in the absence of any inhibitor (black bar). Data were analyzed by one-way ANOVA multiple comparison test (post-hoc test Tukey) (error bars show SEM). ****p<0.001 P-S46-ARPP-16 vs PP2A control; ****p<0.001 P-S46-ARPP-16 + ARPP-16 vs PP2A control; ####p<0.001, P-S46-ARPP-16 + /P-S88-ARPP-16 vs P-S46-ARPP-16. ##p<0.01, P-S46-ARPP-16 + S88D-ARPP-16 vs P-S46-ARPP-16; *p<0.05, P-S46-ARPP-16 + S88D-ARPP-16 vs PP2A control.
Figure 8
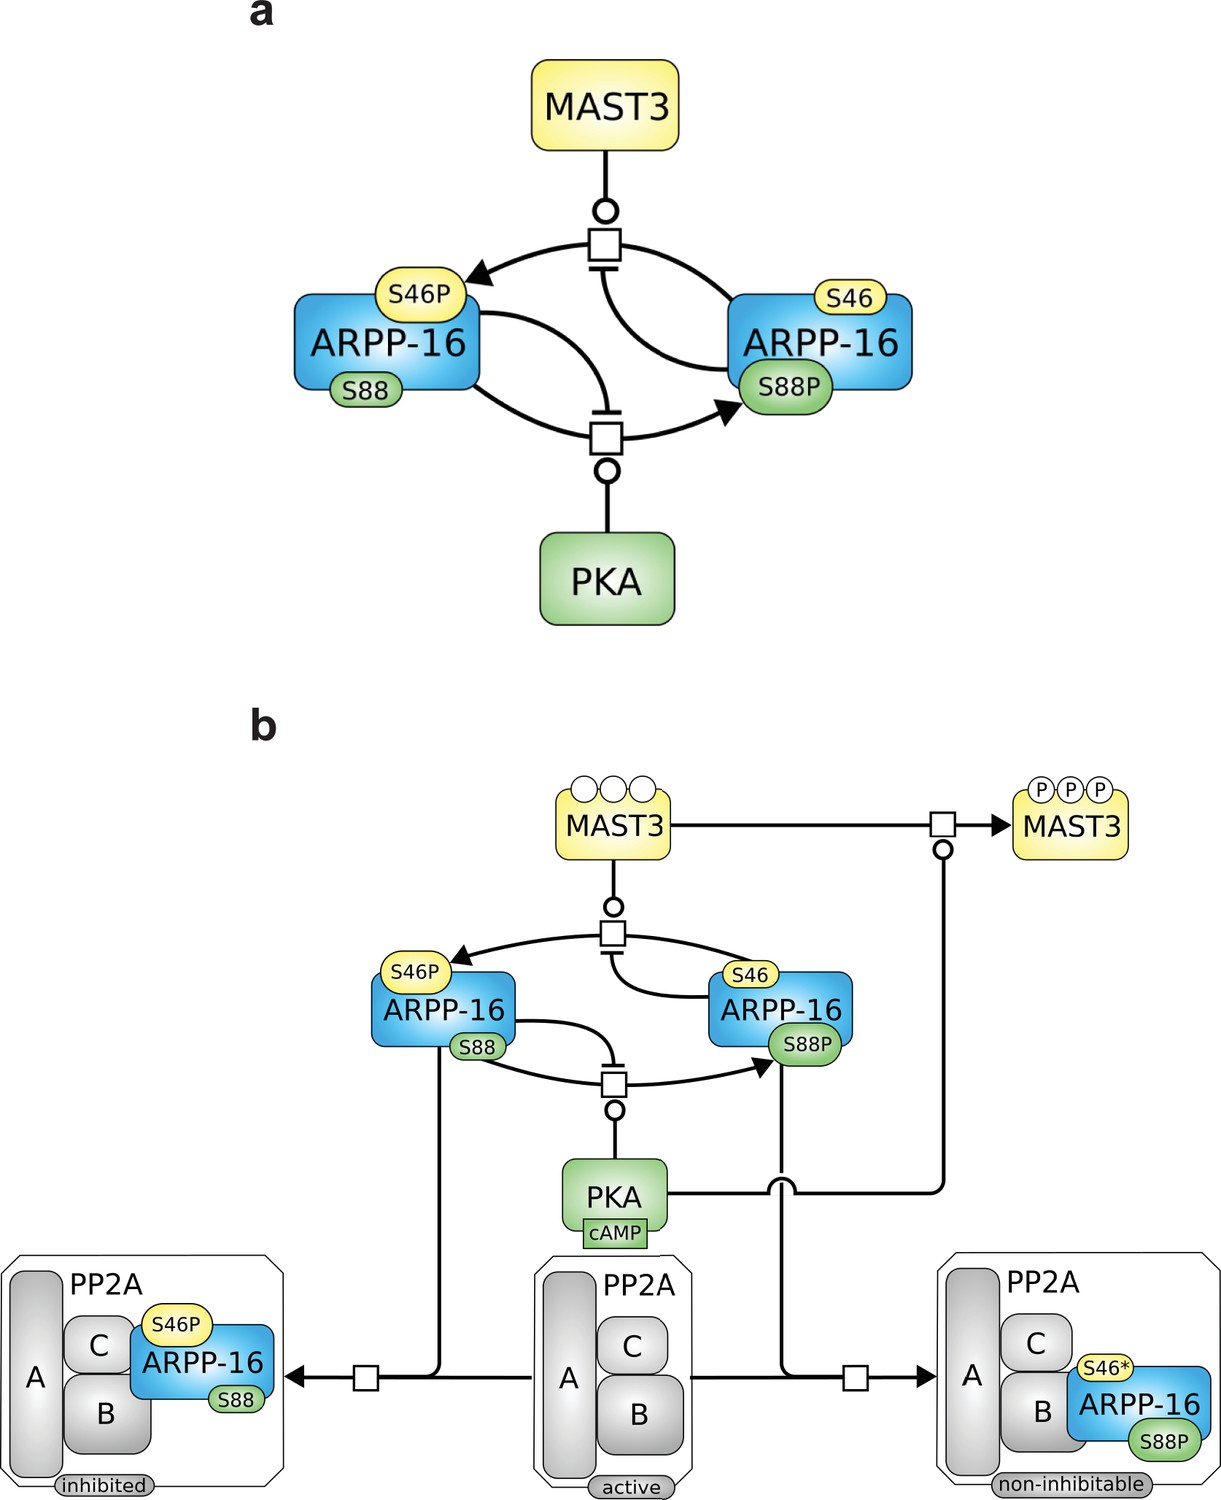
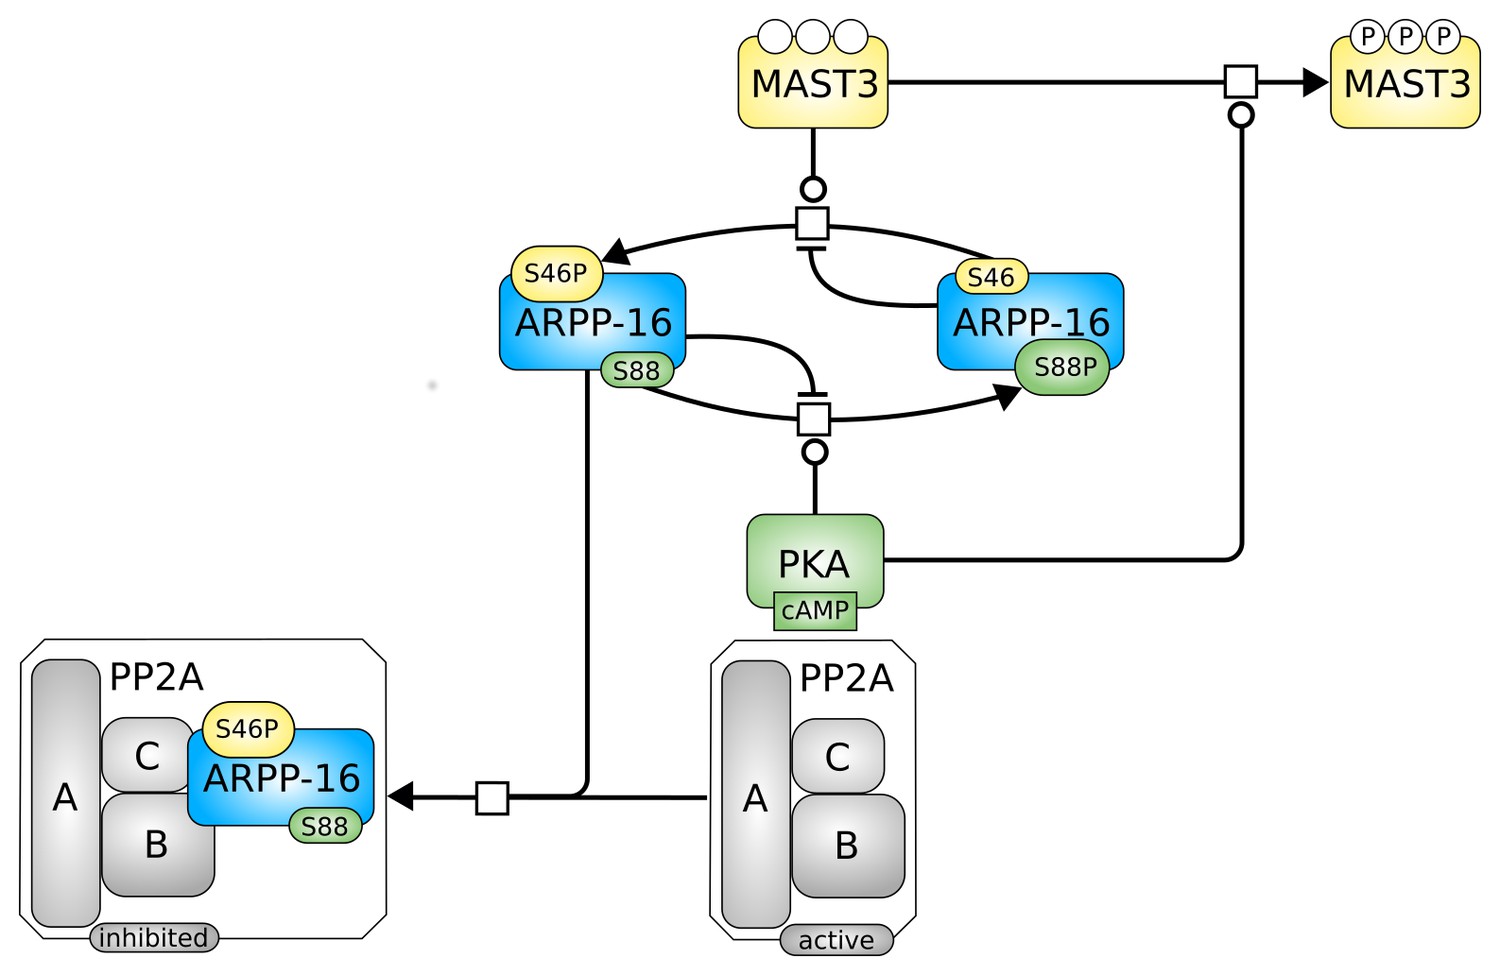
Roles of MAST3 and PKA in the regulation of PP2A by ARPP-16.
(a) Phosphorylation of ARPP-16 at Ser88 by PKA suppresses the phosphorylation of Ser46 by MAST3, while conversely phosphorylation of Ser46 by MAST3 acts in a reciprocal manner to suppress phosphorylation of Ser88 by PKA. (b) The balance of MAST3 kinase and PKA activities determines the state of phosphorylation of Ser46 and Ser88, and subsequent regulation of PP2A heteromers. SBGN Process Description (Le Novère et al., 2009) map showing ARPP-16 phosphorylations by MAST3 and PKA and the different direct and indirect effects of PKA on the modulation of PP2A by ARPP-16. Phosphorylation of ARPP-16 at Ser88 inhibits its phosphorylation at Ser46, phosphorylation of MAST3 inhibits its activity towards S46-ARPP-16, and dominant-negative effect of P-S88-ARPP-16, precluding binding of P-S46-ARPP-16 to PP2A.
Appendix 1—scheme 1
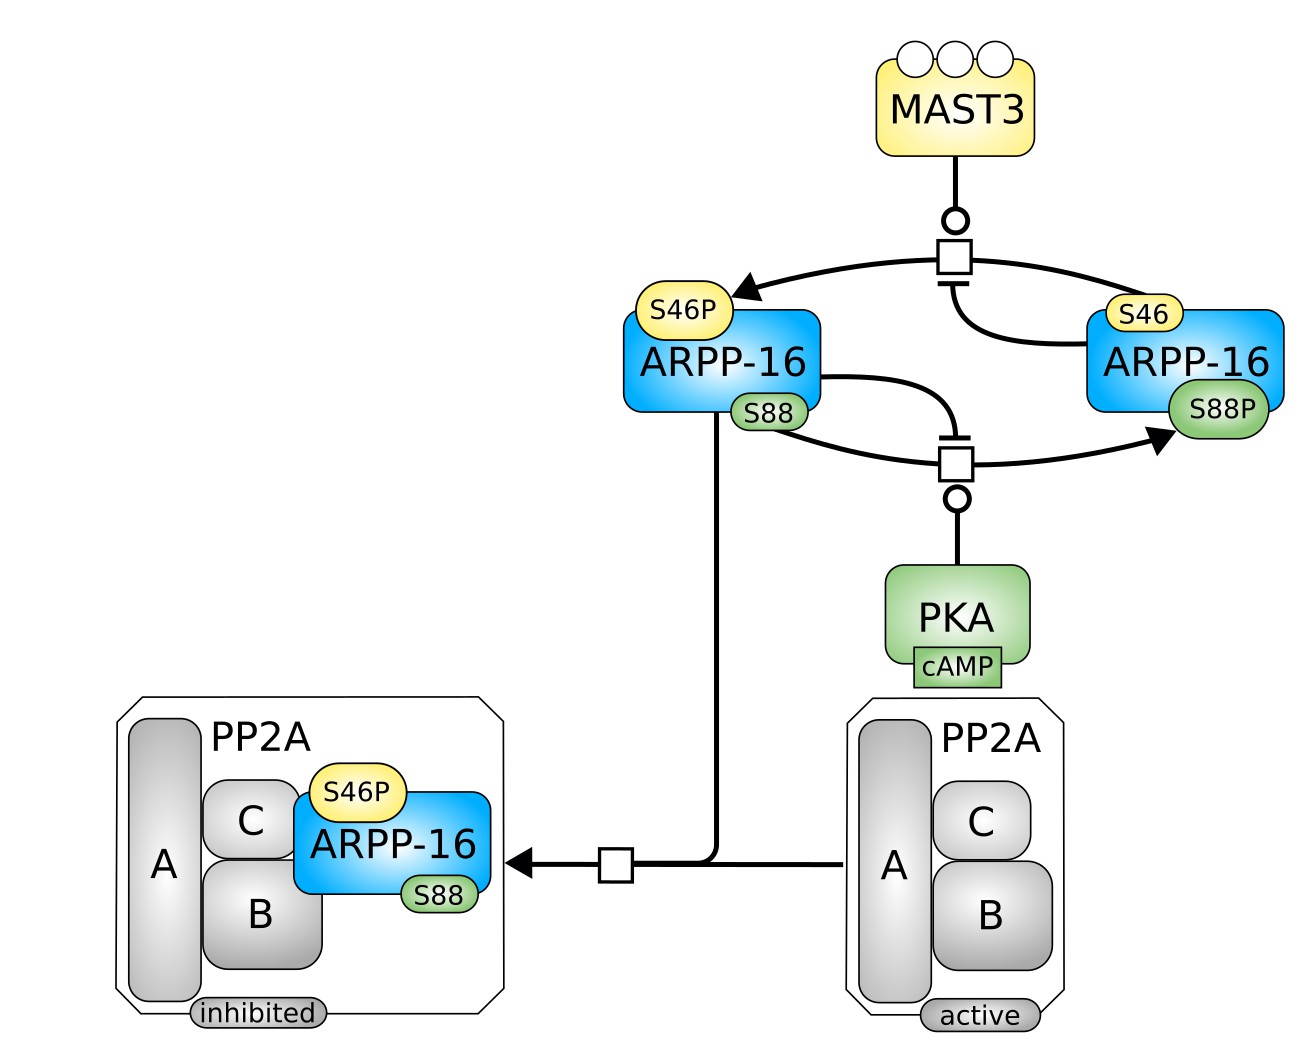
SBGN schema of the model including the mutual inhibition between P-S46-ARPP-16 and P-S88-ARPP-16, was well as the direct action of PKA on ARPP-16.
https://doi.org/10.7554/eLife.24998.021
Appendix 1—figure 1
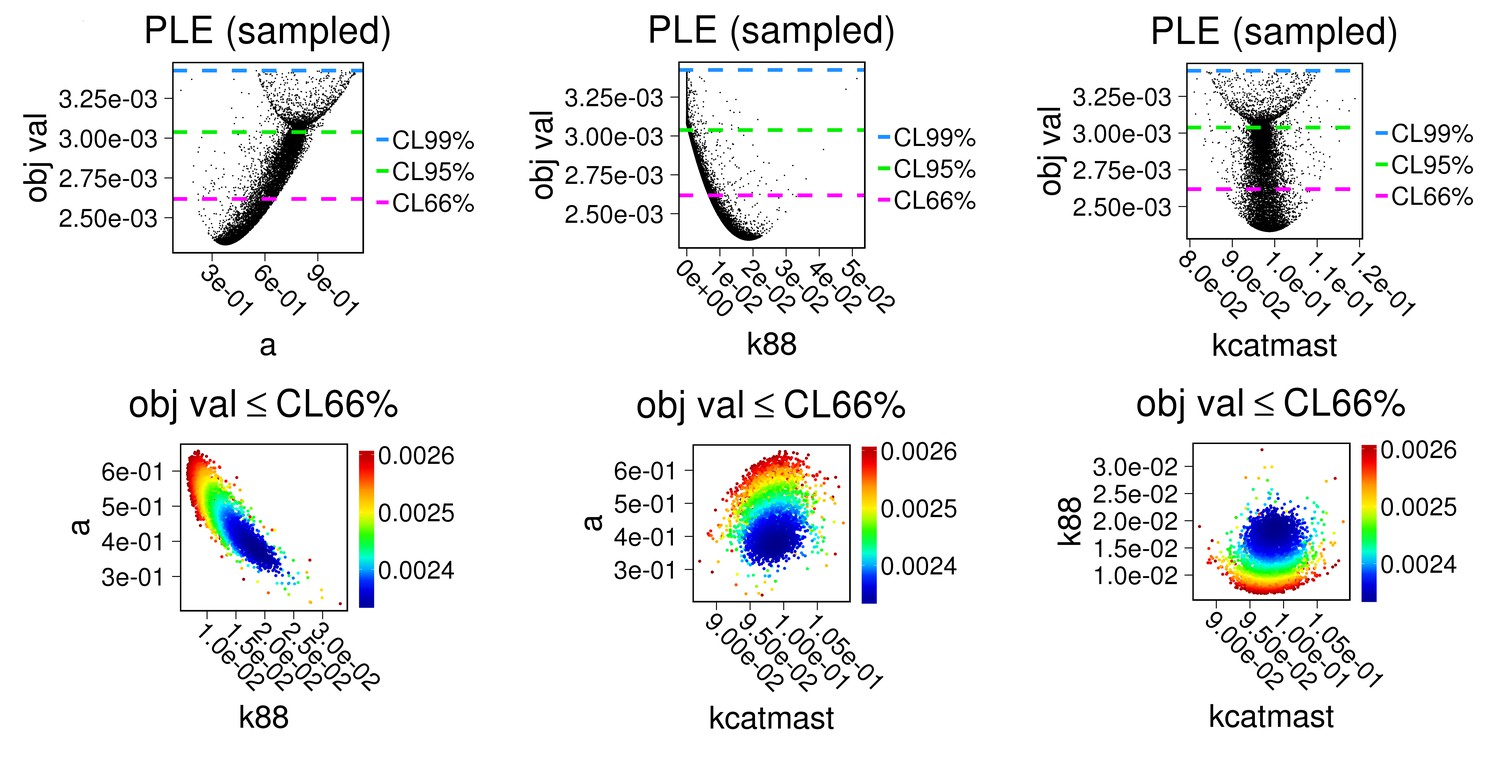
First row: parameter estimation results displayed against chi-square score; Second row: estimations for each pair of parameters showing identifiability.
Parameters a, k88 and kcatmast were estimated using the Particle Swam method 500 times, based on data from main Figure 1a,b. To match with experimental conditions, concentrations of PKA, and all the phosphatases were set to be zero in the model.
Appendix 1—figure 2
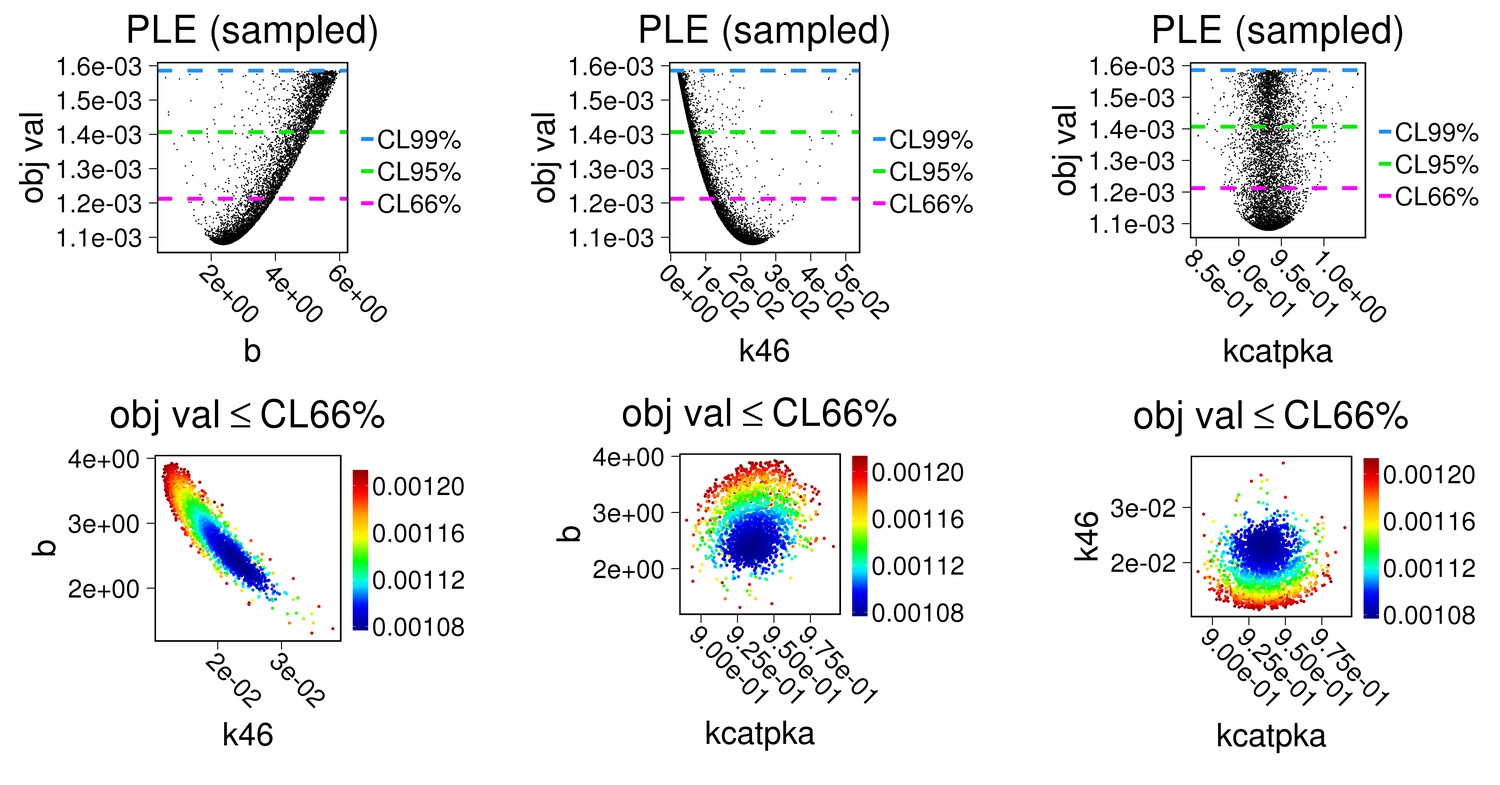
First row: parameter estimation results displayed against chi-square score; Second row: estimations for each pair of parameters showing identifiability.
Parameters b, k46, kcatPKA were estimated as above based on data from main Figure 1 c,d. To match experimental conditions, concentrations of MAST3 and all phosphatases were set to be zero in the model.
Appendix 1—figure 3
Model simulation results compared with experiments presented in main Figure 1a–d (mean±SD).
https://doi.org/10.7554/eLife.24998.024
Appendix 1—scheme 2
SBGN schema of the model including the mutual inhibition between phosphorylated ARPP-16, the direct action of PKA on ARPP-16, as well as PKA phosphorylation of MAST3.
https://doi.org/10.7554/eLife.24998.025
Appendix 1—figure 4
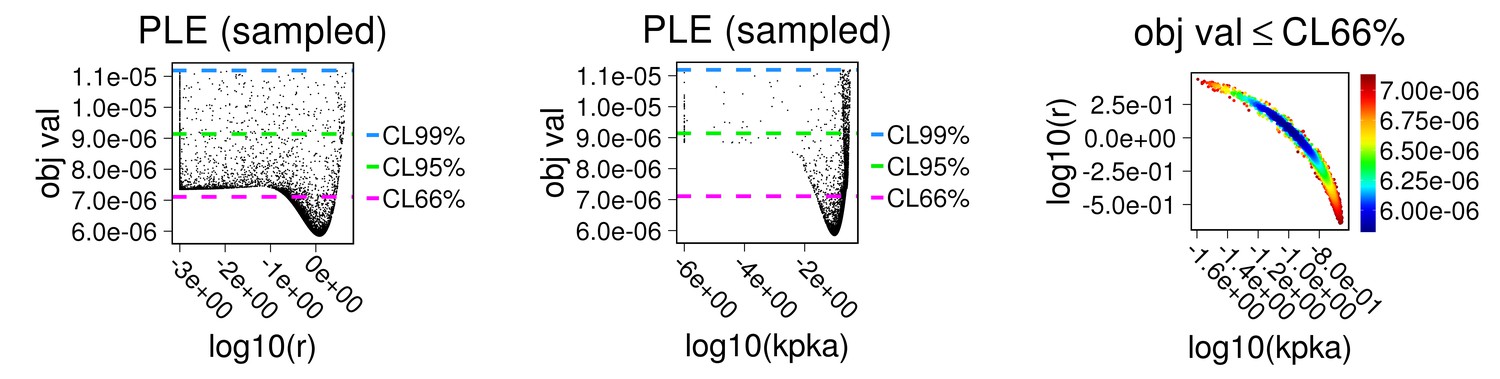
First two panels: parameter estimation results displayed against chi-square score; last panel: estimations for this pair of parameters showing identifiability.
Parameters r and kPKA were estimated following as above based on data from main Figure 4b. To match with experimental conditions, concentrations of all phosphatases were set to zero in the model.
Appendix 1—figure 5

Model simulation results compared with experiments presented on Figure 4b (mean±SD).
https://doi.org/10.7554/eLife.24998.027
Appendix 1—scheme 3
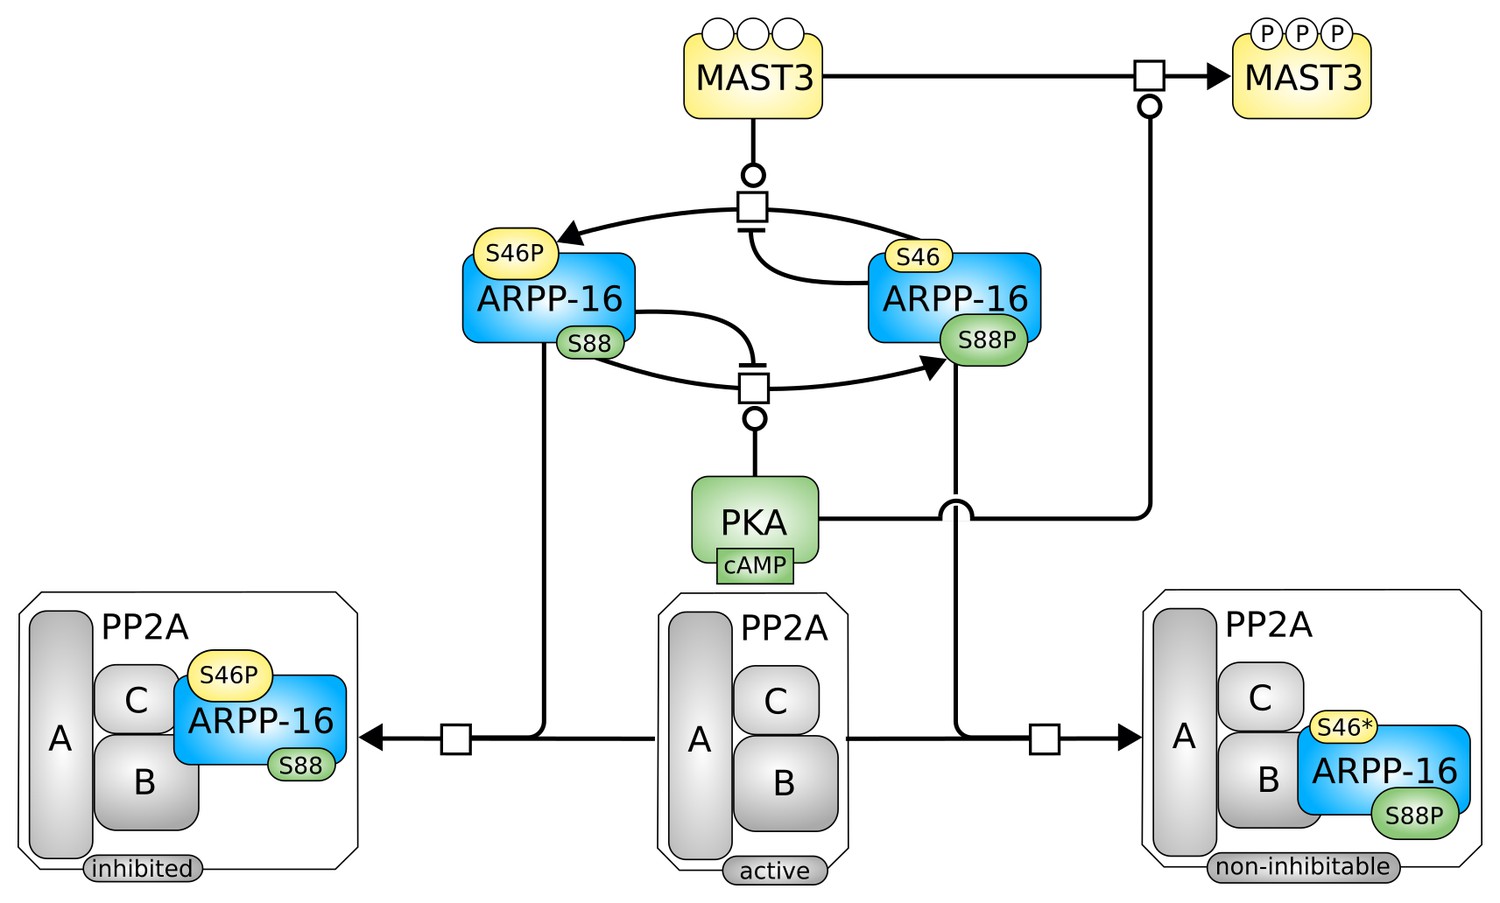
SBGN schema of the model including the mutual inhibition between phosphorylated ARPP-16, the direct action of PKA on ARPP-16, PKA phosphorylation of MAST3, and the dominant negative effect of P-S88-ARPP-16.
https://doi.org/10.7554/eLife.24998.028
Appendix 1—figure 6

Simulation results compared with experiments presented in main Figure 7.
https://doi.org/10.7554/eLife.24998.029
Appendix 1—figure 7

Parameters used in the Hill-equation encoding PKA activation by cAMP were validated against experimental observations (Zawadzki and Taylor, 2004).
Simulation results were obtained by mixing 10 nM of PKA whole enzyme with 200 μM kemptide and cAMP of varying concentrations as described in the published experiments. The enzyme activity was shown as the normalized level of phospho-kemptide after a 2 min simulation.
Author response image 1
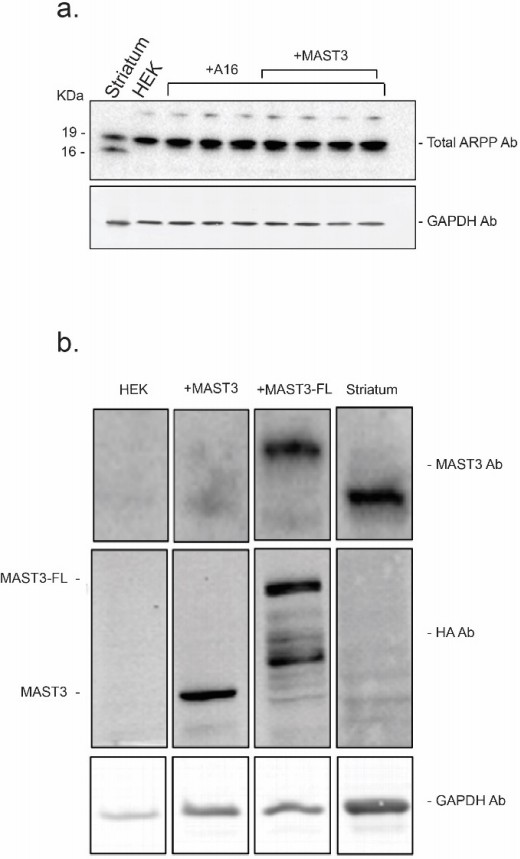
The expression levels of endogenous ARPP-16 (panel a.) and MAST3 (panel b.) in striatum were compared to ARPP16-HA, MAST3-HA (a shorter form of MAST3 used in the studies described in the manuscript) and full length MAST3-FL-HA recombinant proteins expressed in HEK293 cell.
Protein expression was measured by serial immunoblotting using an antibody against MAST3 (to detect endogenous protein in striatum and cells overexpressing MAST3-FL-HA) and an antibody against the HA tag (to compare the levels of MAST3-HA and MAST3-FL-HA). Immunoblots were carried out in a similar range of protein amounts and protein levels were normalized to GAPDH.
Tables
Table 1
Summary of kinetic analysis of ARPP-16 phosphorylation by MAST3 and PKA.
| MAST3 | Vm | Km | Catalytic efficiency | |
|---|---|---|---|---|
| 32P-incorporation/minute | nM | Vm/Km | ||
| Figure 1b | ARPP-16 | 1388 ± 27 | 90 ± 5 | 15.4 |
| P-S88-ARPP-16 | 866 ± 59 | 158 ± 26 | 5.5 | |
| Figure 1—figure supplement 1 | ARPP-16 | 1391 ± 34 | 92 ± 6 | 15.1 |
| P-S88D-ARPP-16 | 465 ± 32 | 138 ± 24 | 3.4 | |
| PKA | Vm | Km | Catalytic efficiency | |
| 32P-incorporation/minute | nM | Vm/Km | ||
| Figure 1d | ARPP-16 | 6999 ± 127 | 1685 ± 51 | 4.1 |
| P-S46-ARPP-16 | 1027 ± 39 | 870 ± 47 | 1.2 |
Appendix 1—table 1
Parameter values.
| Equation | Parameter | Value | Reference |
|---|---|---|---|
| 1 | Kd | 1 nM | Vinod and Novak (2015) |
| v | 100 | Estimated and validated using data from Figure 7 | |
| 2 | kcatMAST3 | 0.0988 s−1 | Estimated using data from Figure 1a,b |
| KmMAST3 | 0.09 µM | Obtained from Figure 1b | |
| a | 0.37526 | Estimated using data from Figure 1a,b | |
| r | 1.2 | Estimated using data from Figure 4b | |
| kcatPP2A | 0.05 s−1 | Vinod and Novak (2015) | |
| 3 | kcatPKA | 0.935 s−1 | Estimated using data from Figure 1c,d |
| KmPKA | 1.6 µM | Obtained from Figure 1d | |
| b | 2.36 | Estimated using data from Figure 1c,d | |
| kcatPP1 | 0.5 s−1 | Estimated using data from Hayer and Bhalla (2005) | |
| KmPP1 | 1 µM | Estimated using data from Hayer and Bhalla (2005) | |
| 4 | kppx | 0.05 s−1 | Estimated in this study |
| k88 | 0.01865 µM−1s−1 | Estimated using data from Figure 1a,b | |
| kPKA | 0.097 | Estimated using data from Figure 4b | |
| 5 | kcAMP | 0.7 s−1 | Estimated and validated by Zawadzki and Taylor (2004) |
| n | 2 | Estimated and validated by Zawadzki and Taylor (2004) | |
| KA | 10 µM | Estimated and validated by Zawadzki and Taylor (2004) | |
| k46 | 0.02335 µM−1.s−1 | Estimated using data from Figure 1c,d |
Appendix 1—table 2
Initial concentrations.
| PP2Atot | 2 µM |
|---|---|
| Atot | 10 µM |
| MAST3tot | 2.7 µM |
| PKAtot (total catalytic subunits) | 12 µM |
| PP1 | 5 µM |
Additional files
-
Supplementary file 1
Summary of phospho-peptides identified by LC-MS/MS:
The sequences of phospho-peptides identified in HA-MAST3 isolated from HEK293T cell experiments are listed in order of amino acid residue position in the protein sequence. Data from six different experiments (labelled as 1–6) are from the various digestion conditions utilized as described in the Materials and methods section. Samples from HEK293T cells incubated under control conditions (CTRL) or in the presence of forskolin (FSK) are shown. Criteria for positive phospho site identification (Primary or Alternative) includes (1) meeting PhosphoRS criteria; (2) Mascot expectation score of 0.05 or less; and peptide mass accuracy of 10 ppm or less.
- https://doi.org/10.7554/eLife.24998.020
Download links
A two-part list of links to download the article, or parts of the article, in various formats.
Downloads (link to download the article as PDF)
Open citations (links to open the citations from this article in various online reference manager services)
Cite this article (links to download the citations from this article in formats compatible with various reference manager tools)
Reciprocal regulation of ARPP-16 by PKA and MAST3 kinases provides a cAMP-regulated switch in protein phosphatase 2A inhibition
eLife 6:e24998.
https://doi.org/10.7554/eLife.24998


