A quantitative hypermorphic CNGC allele confers ectopic calcium flux and impairs cellular development
- Ludwig Maximilian University of Munich, Germany
- University of Erlangen-Nürnberg, Germany
Figures
Figure 1 with 3 supplements
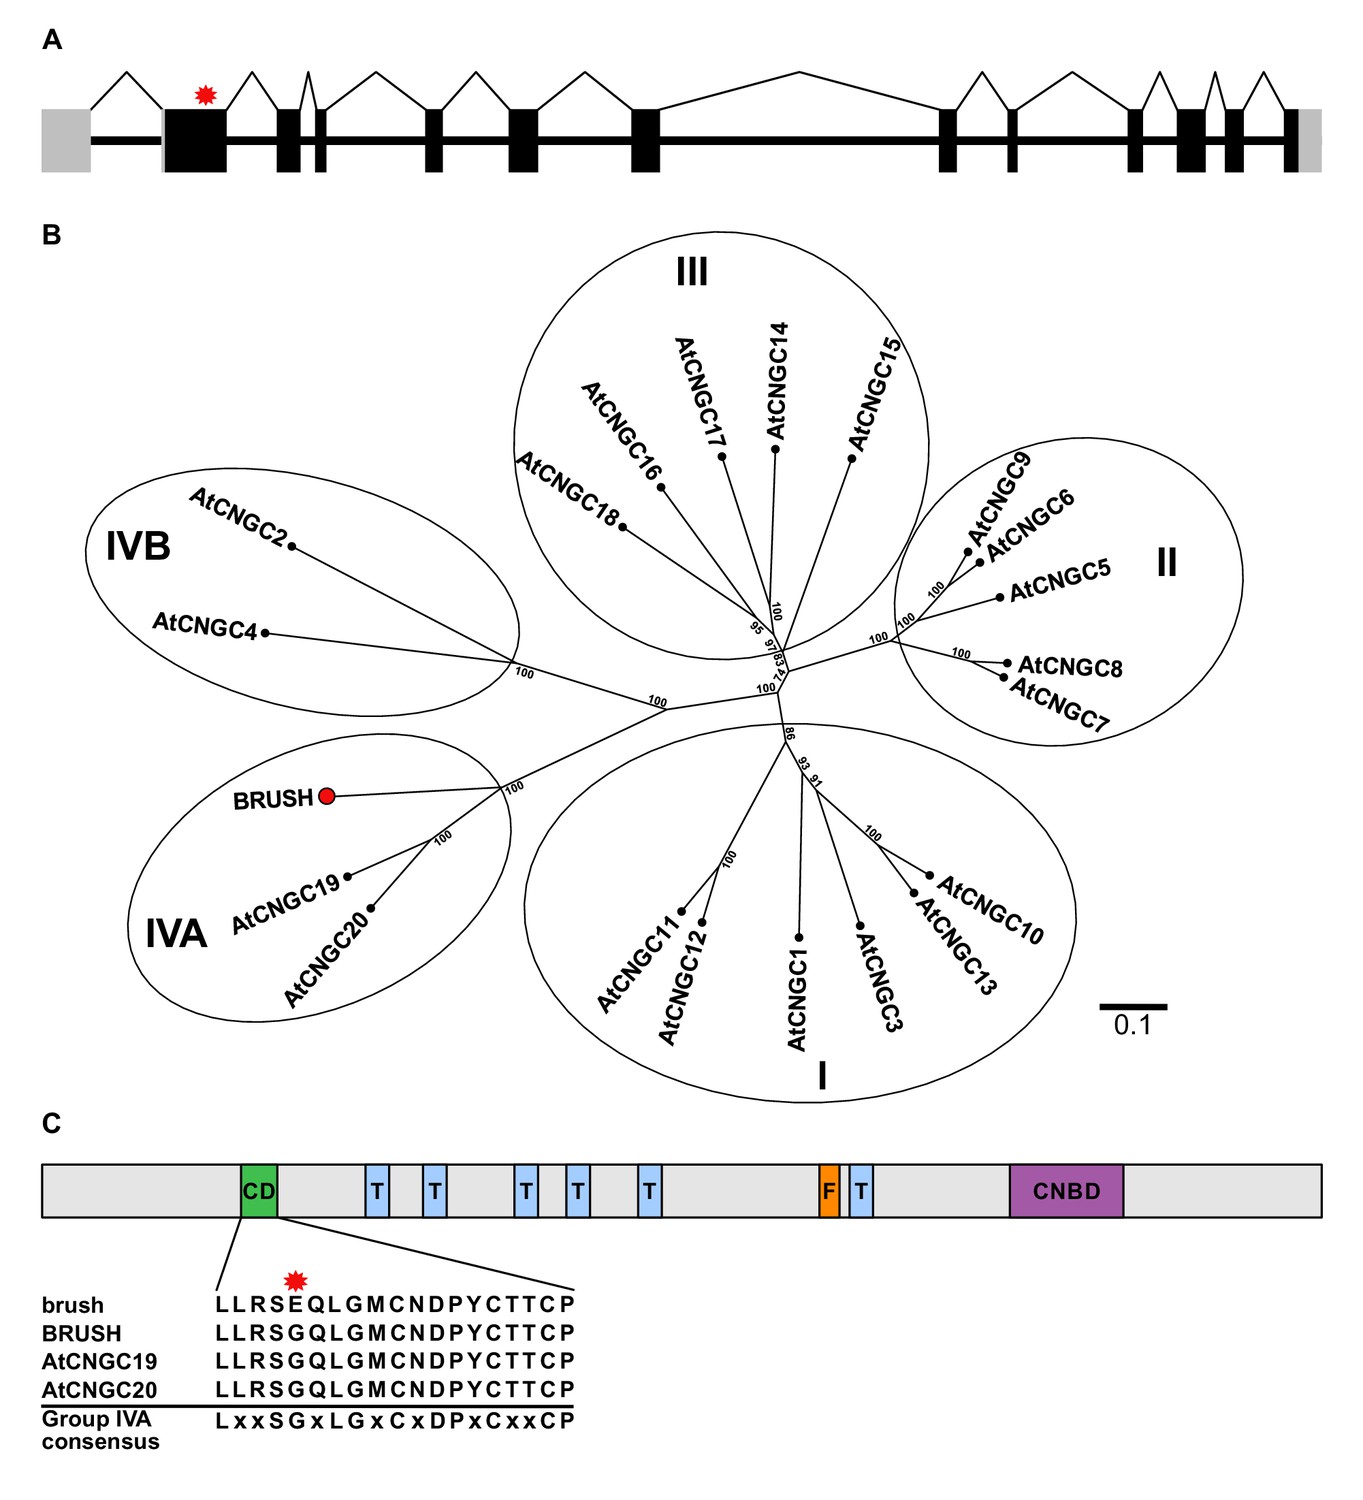
brush contains a point mutation in CNGC.IVA1 (BRUSH).
(A) Schematic of the intron-exon structure of BRUSH highlighting the brush mutation in the first exon (red asterisk). (B) Phylogenetic tree of BRUSH (red node end) in relation to Arabidopsis thaliana CNGC proteins. BRUSH is orthologous to the Group IVA members AtCNGC19 and AtCNGC20. (C) Overview of the BRUSH protein domain structure highlighting the conserved Group IVA domain (CD, green), transmembrane domains (T, light blue), putative filter region (F, orange), and the predicted cyclic nucleotide-binding domain (CNBD, purple). Shown below is the CD sequence in brush (G134E mutation, asterisk) relative to BRUSH, AtCNGC19, and AtCNGC20 and the Group IVA CNGC consensus (Yuen and Christopher, 2013). Numbers at the branch points in (B) indicate the percentage bootstrap values (100 iterations) for the inferred tree. Scale bar in (B) indicates the number of amino acid substitutions per site.
-
Figure 1—source data 1
Figure 1B source data.
- https://doi.org/10.7554/eLife.25012.007
Figure 1—figure supplement 1
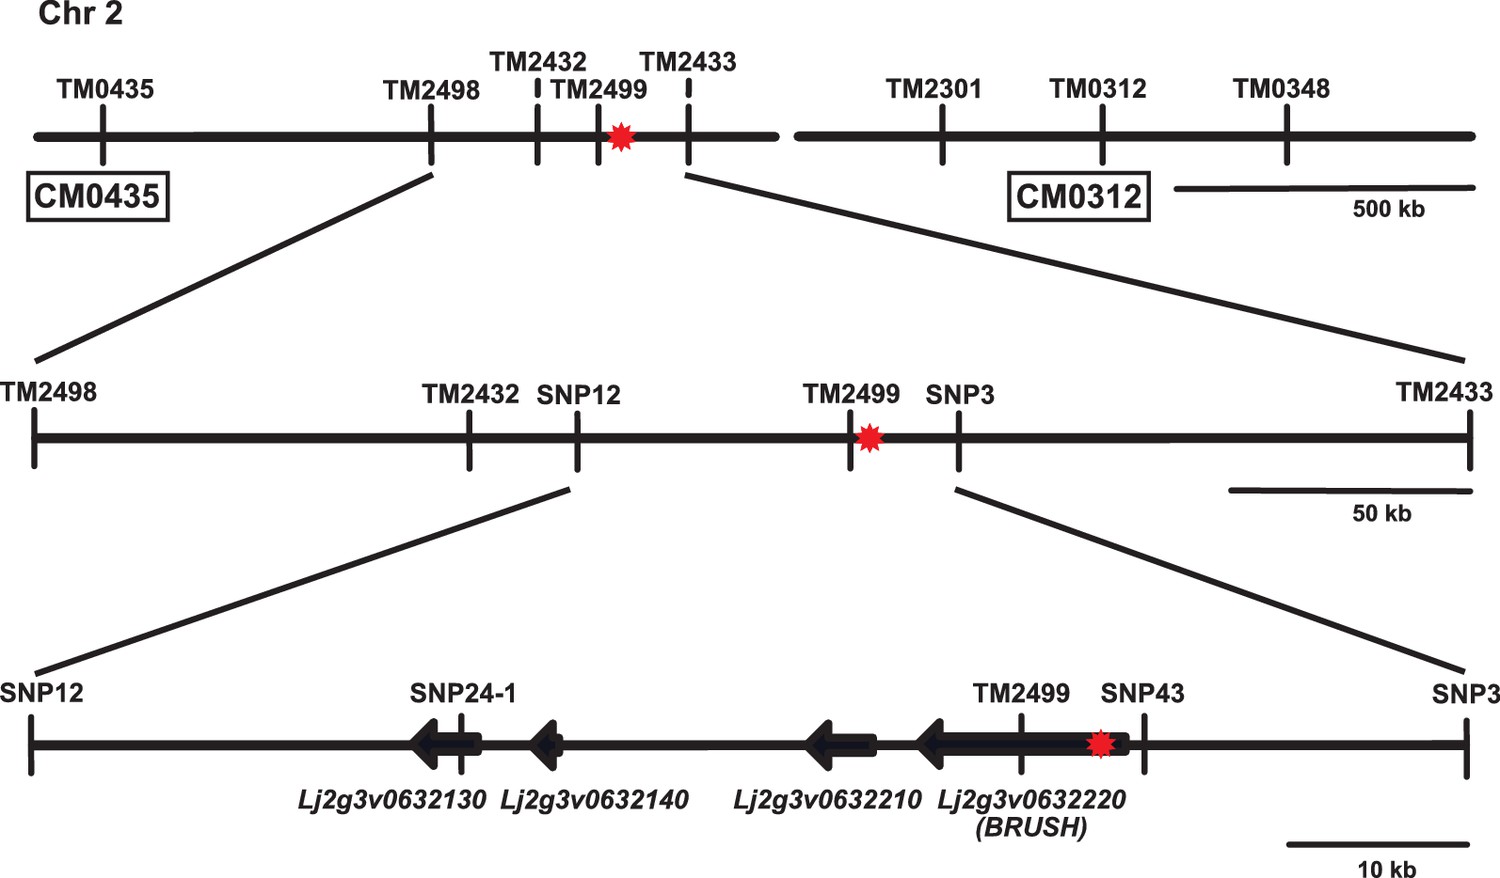
Map-based cloning of the brush mutation on chromosome 2.
Overview of contigs CM0435 and CM0312 (Lotus japonicus genome v2.5) on the short arm of chromosome 2 surrounding the brush target region. The relative location of SSR and SNP markers used for mapping are indicated on the contigs. The brush mutation was previously linked to TM0312 by rough mapping. The red asterisk indicates the position of the causative mutation responsible for the brush phenotype. SSR markers were amplified with fluorescent primers and analysed on an ABI capillary sequencer. SNPs were genotyped by sequencing and/or KASP (LGC).
Figure 1—figure supplement 2
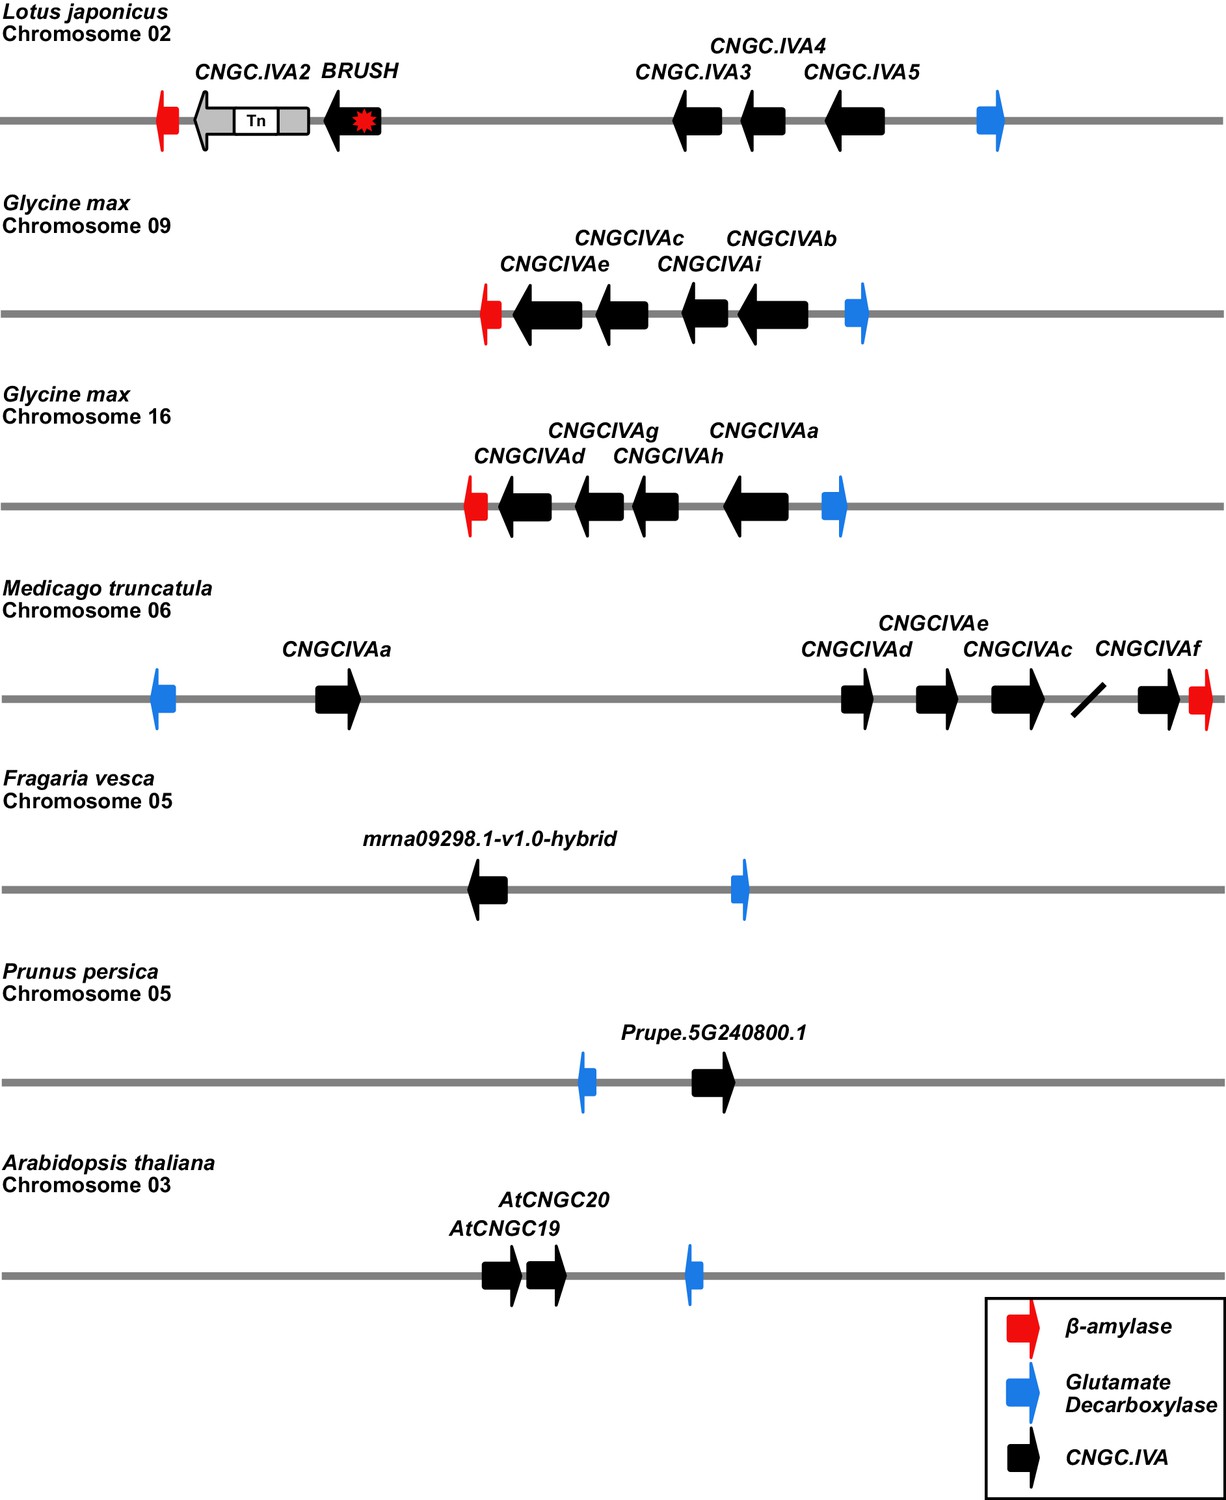
Syntenic chromosomal locations of CNGC.IVA genes in selected plant species.
A cluster of 5 CNGC.IVA genes are present on chromosome 2 of L. japonicus. CNGC.IVA2 contains a large transposon (Tn) insertion. The CNGC.IVA cluster is bordered by genes encoding for β-amylase (red) and glutamate decarboxylase (blue). The Glycine max (soybean) and Medicago truncatula genomes both contain a cluster of CNGC.IVAs (Charpentier et al., 2016) associated with the same anchor genes. In contrast, two non-legume plant species of the Rosaceae family (Fragaria vesca and Prunus persica) contain a single CNGC.IVA copy in association with the glutamate decarboxylase anchor. Chromosome 3 of Arabidopsis thaliana contains 2 CNGC.IVA copies. The chromosomal depictions are simplified to highlight the syntenic loci. The slash between CNGCIVAc and CNGCIVAf on Medicago chromosome 6 represents a gap of 480 kb.
Figure 1—figure supplement 3
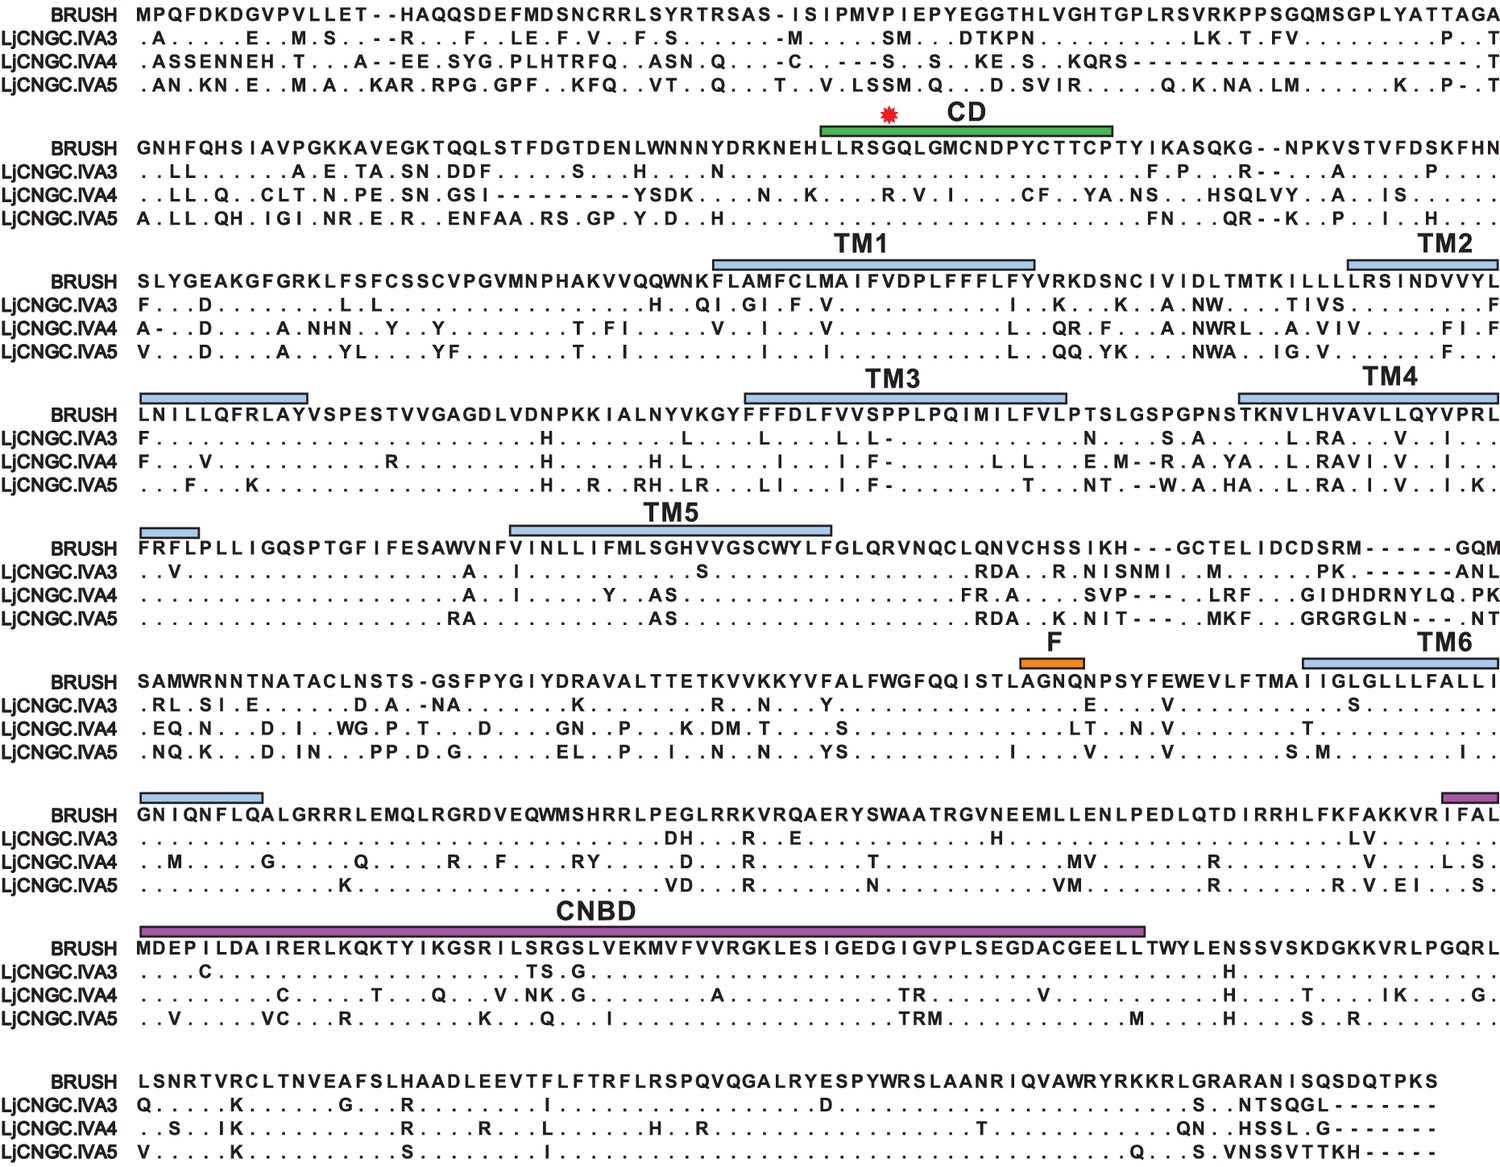
Protein sequence comparison of Group IVA CNGCs from Lotus japonicus.
Protein sequence alignment of BRUSH (CNGC.IVA1), CNGC.IVA3, CNGC.IVA4, and CNGC.IVA5. Residues identical to BRUSH are shown as dots and gaps are shown as dashes. Shown is the Group IVA CNGC conserved domain (CD, green), the position of the brush mutation (red asterisk), predicted transmembrane domains (TM, light blue), putative selectivity filter (F, orange) in the pore region, and the cyclic nucleotide-binding domain (CNBD, purple). CNGC.IVA3 (81%), CNGC.IVA4 (65%), and CNGC.IVA5 (72%) show high-sequence identity to BRUSH.
Figure 2 with 6 supplements
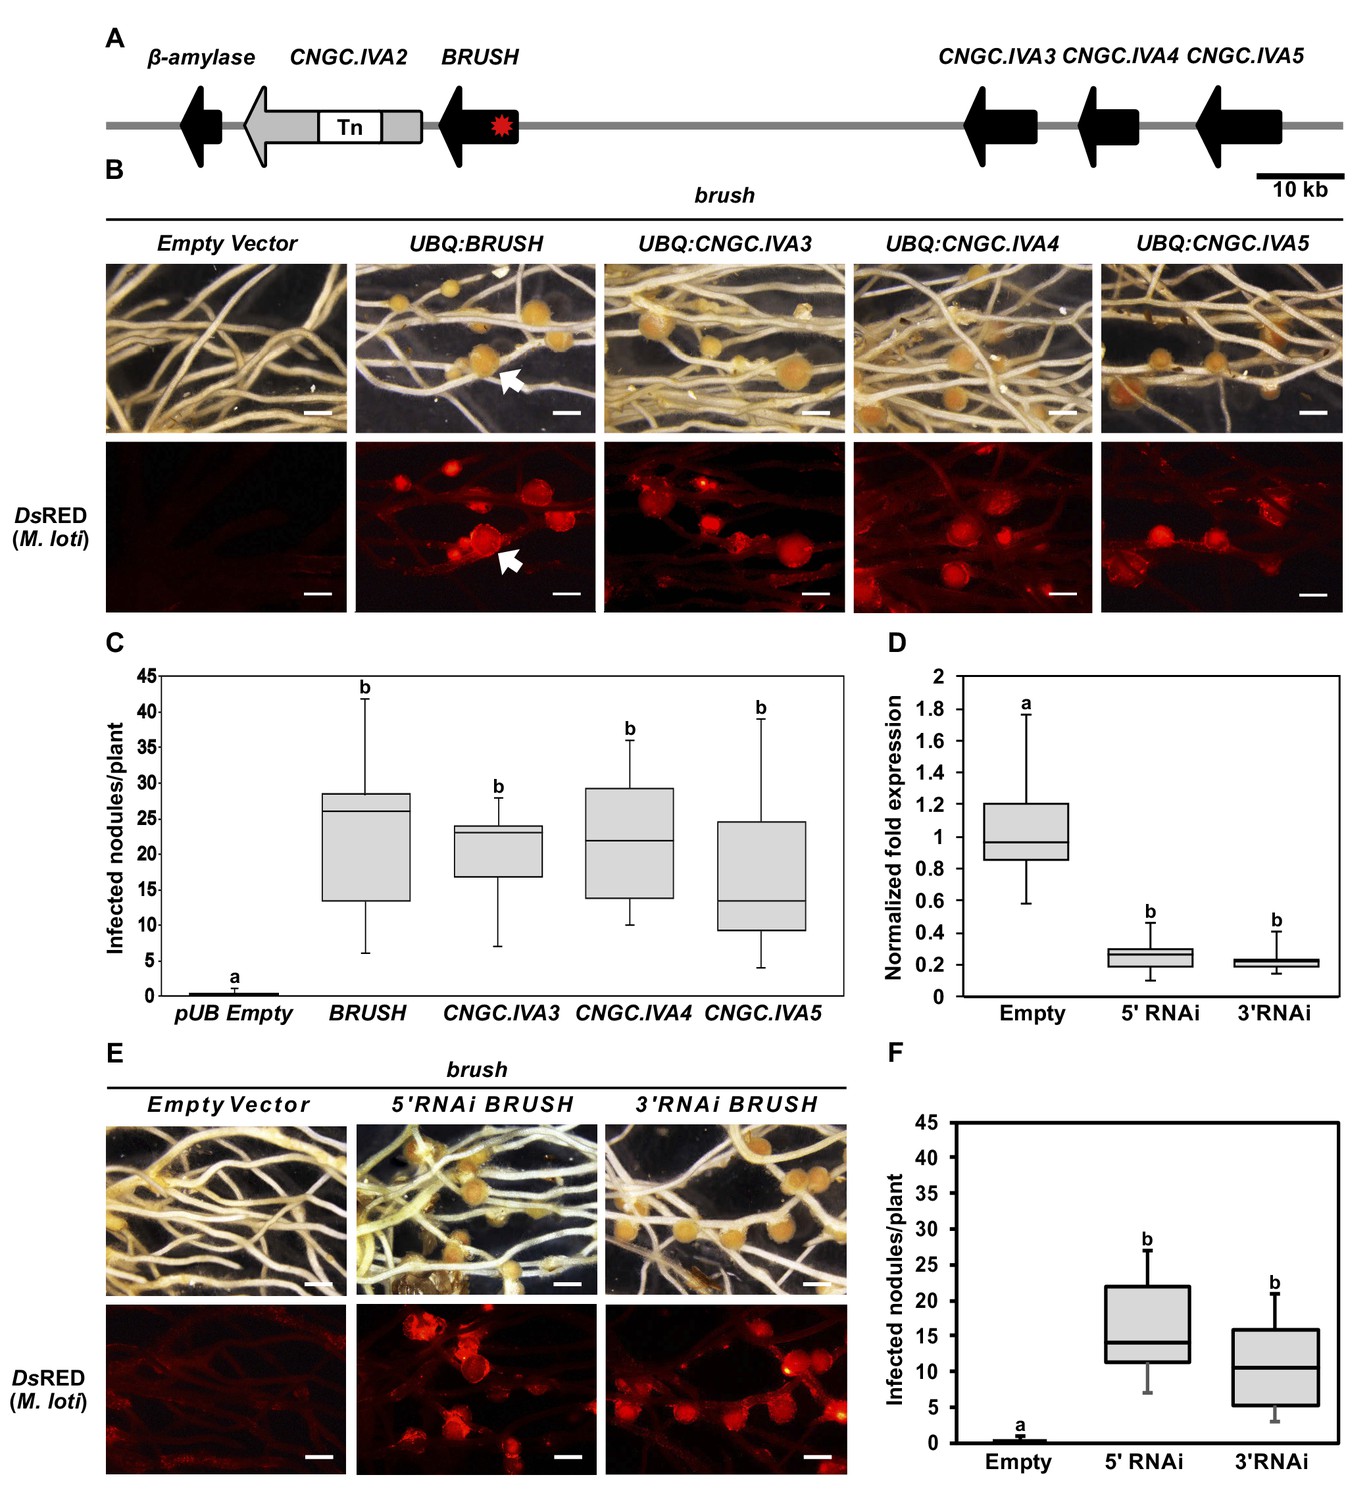
Genetic complementation of brush.
(A) Genomic region surrounding BRUSH on L. japonicus chromosome 2 showing a cluster of five CNGC.IVA genes (red asterisk, brush causative mutation). CNGC.IVA2 contains a large transposon (Tn) insertion. CNGC.IVA2 contains a large transposon insertion (shown as a gap). (B) Complementation assay of brush roots by overexpression (ubiquitin promoter, UBQ) of the four expressed CNGC.IVA cluster members (bright field, top panel). The presence of red fluorescent nodules (arrow) colonized by Mesorhizobium loti expressing the red fluorescent protein DsRED (lower panel) indicates successful bacterial infection and thus complementation. (C) Number of nodules per transformed plant from (B) (n = 10 for all constructs). (D) Quantitative reverse-transcription PCR analysis of brush transcript levels after RNAi targeting either the 5'UTR or 3' UTR of brush. The normalized fold expression of brush is shown relative to empty vector control roots (n = 6 for all constructs). (E) Complementation analysis of brush expressing RNAi fragments targeting either the 5'UTR or 3'UTR of brush in the brush mutant. Panels are the same as (B). (F) Number of nodules per transformed plant (n = 10 for all constructs) from (E). Roots for both complementation experiments were observed 6 weeks after inoculation with rhizobia. Scale bars in (B) and (E) represent 1 mm. Letters in (C), (D), and (F) indicate different statistical groups (ANOVA followed by Tukey’s HSD test). F(4, 45)=10.86, p < 0.001 (C), F(2, 15)=20.82, p < 0.001 (D), F(2, 27)=22.72, p < 0.001 (F).
-
Figure 2—source data 1
Figure 2C source data.
- https://doi.org/10.7554/eLife.25012.015
-
Figure 2—source data 2
Figure 2D source data.
- https://doi.org/10.7554/eLife.25012.016
-
Figure 2—source data 3
Figure 2F source data.
- https://doi.org/10.7554/eLife.25012.017
-
Figure 2—source data 4
Figure 2—figure supplement 1B source data.
- https://doi.org/10.7554/eLife.25012.018
-
Figure 2—source data 5
Figure 2—figure supplement 3A,C source data.
- https://doi.org/10.7554/eLife.25012.019
-
Figure 2—source data 6
Figure 2—figure supplement 4B source data.
- https://doi.org/10.7554/eLife.25012.020
-
Figure 2—source data 7
Figure 2—figure supplement 5A source data.
- https://doi.org/10.7554/eLife.25012.021
Figure 2—figure supplement 1
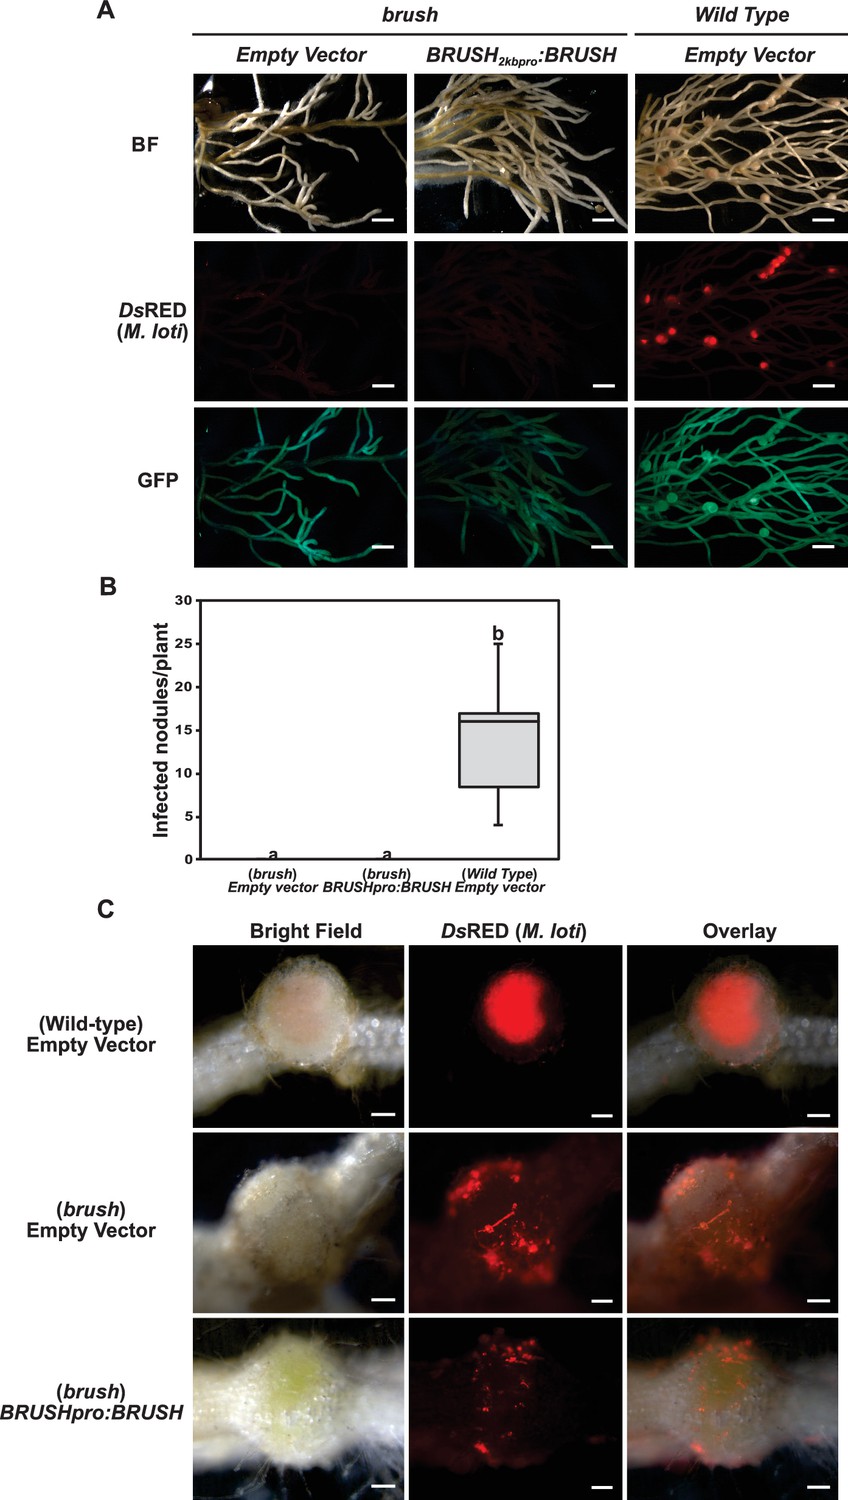
Expression of the BRUSH native genomic sequence in brush.
(A) Complementation assay of brush roots by transformation of BRUSH2kbpro:BRUSHgenomic or empty vector relative to Gifu wild type. No infected nodules were observed in brush roots expressing the BRUSH genomic sequence. Shown are DsRED fluorescence of rhizobia (middle panel) and GFP fluorescence (lower panel) as transformation reporter. Composite plants were transfered into Weck jars, cultivated at 26°C, and inoculated with M. loti expressing DsRed. Roots were analyzed 4 weeks after inoculation. (B) Box plot showing the number of nodules per transformed plant (n = 8) from (A). (C) Close-up of transformed roots. Scale bars in (A) represent 2 mm, 0.2 mm in (C). Different letters in (B) indicate different statistical groups (ANOVA followed by Tukey’s HSD test, F(2, 21)=33.60, p < 0.001).
Figure 2—figure supplement 2
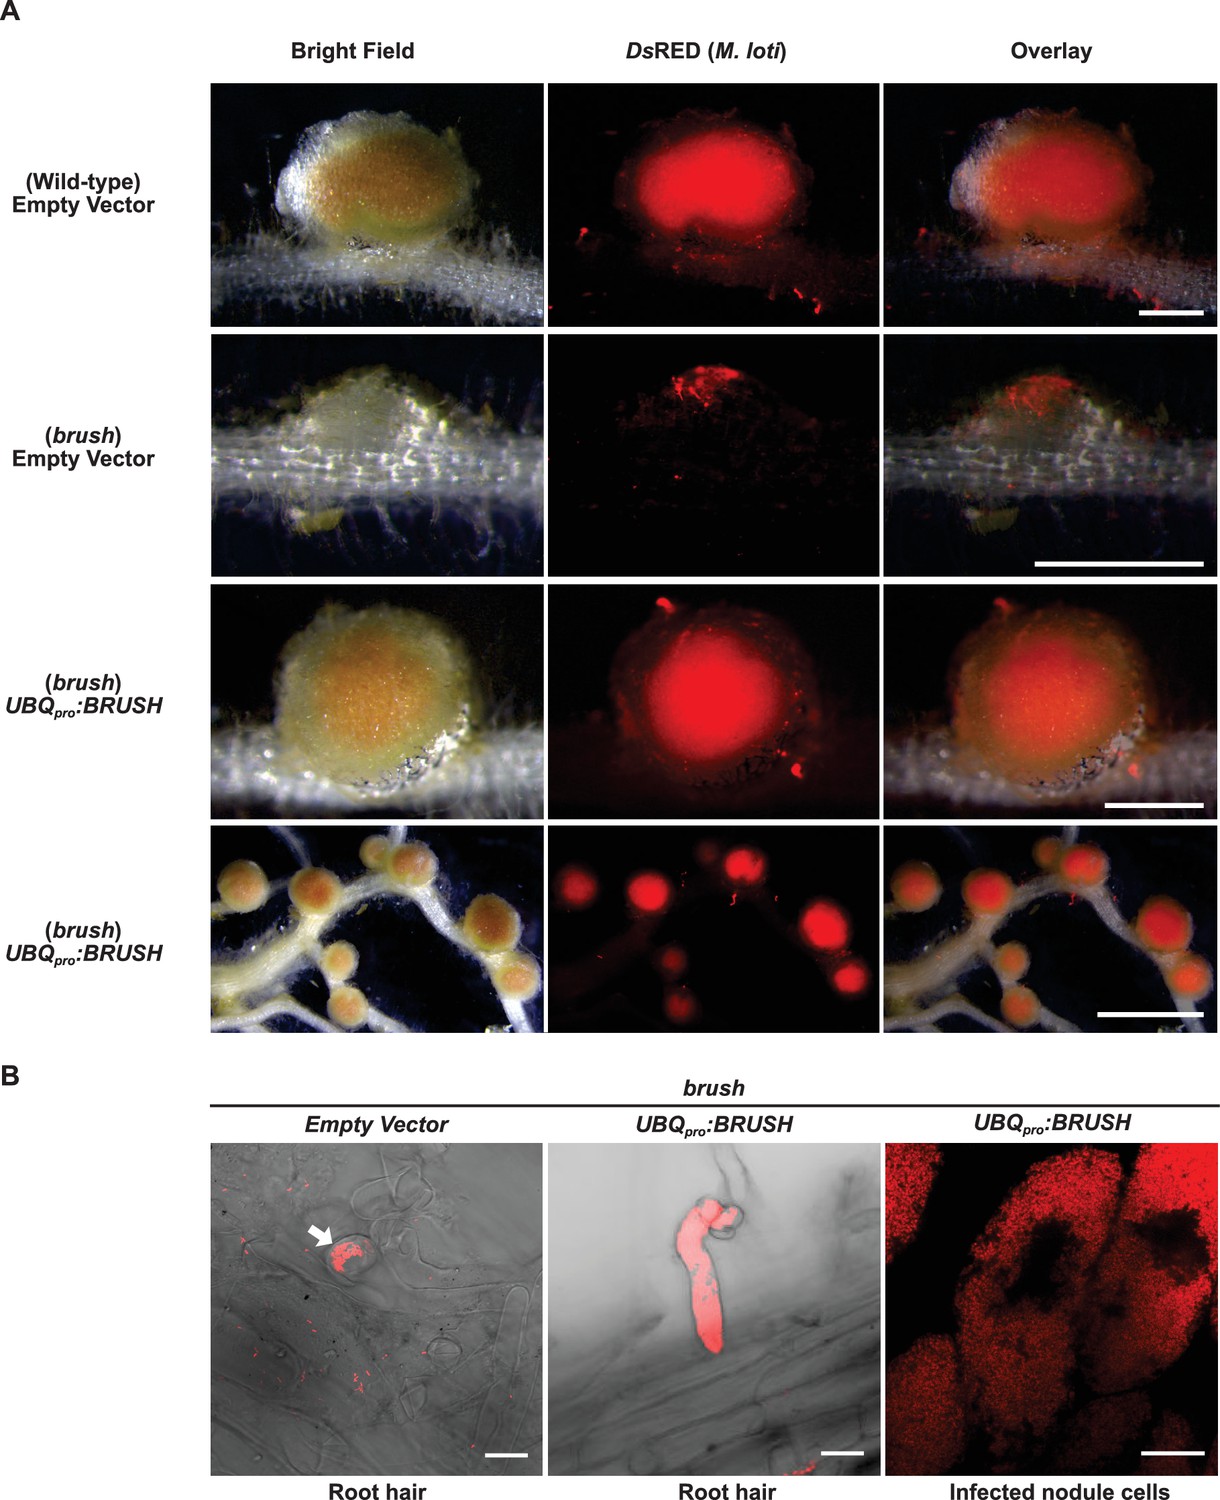
Complementation of brush by overexpression of BRUSH.
(A) Nodulation and rhizobial infection assay upon hairy root transformation of the brush mutant with an empty vector control or an UBQpro:BRUSHgenomic construct compared to the wild-type (Gifu) hairy roots transformed with empty vector. Infected nodules were observed in brush roots constitutively expressing the BRUSH genomic sequence. Shown are bright-field images of roots and DsRED fluorescence of rhizobia. (B) Rhizobia remain entrapped in infection pockets in brush root hairs (left image, arrow). Overexpression of BRUSH restores infection of root hairs (middle) leading to infected nodule cells (right). The root hair images are composites of bright field and DsRED fluorescence. Plants with hairy roots were grown in Weck jars, cultivated at 26°C, and inoculated with M. loti expressing DsRed. Roots were analyzed 4 weeks after inoculation. Scale bars represent 0.5 mm in the top three panels of (A), lower panel 2 mm. Scale bars in (B) represent 15 µm.
Figure 2—figure supplement 3
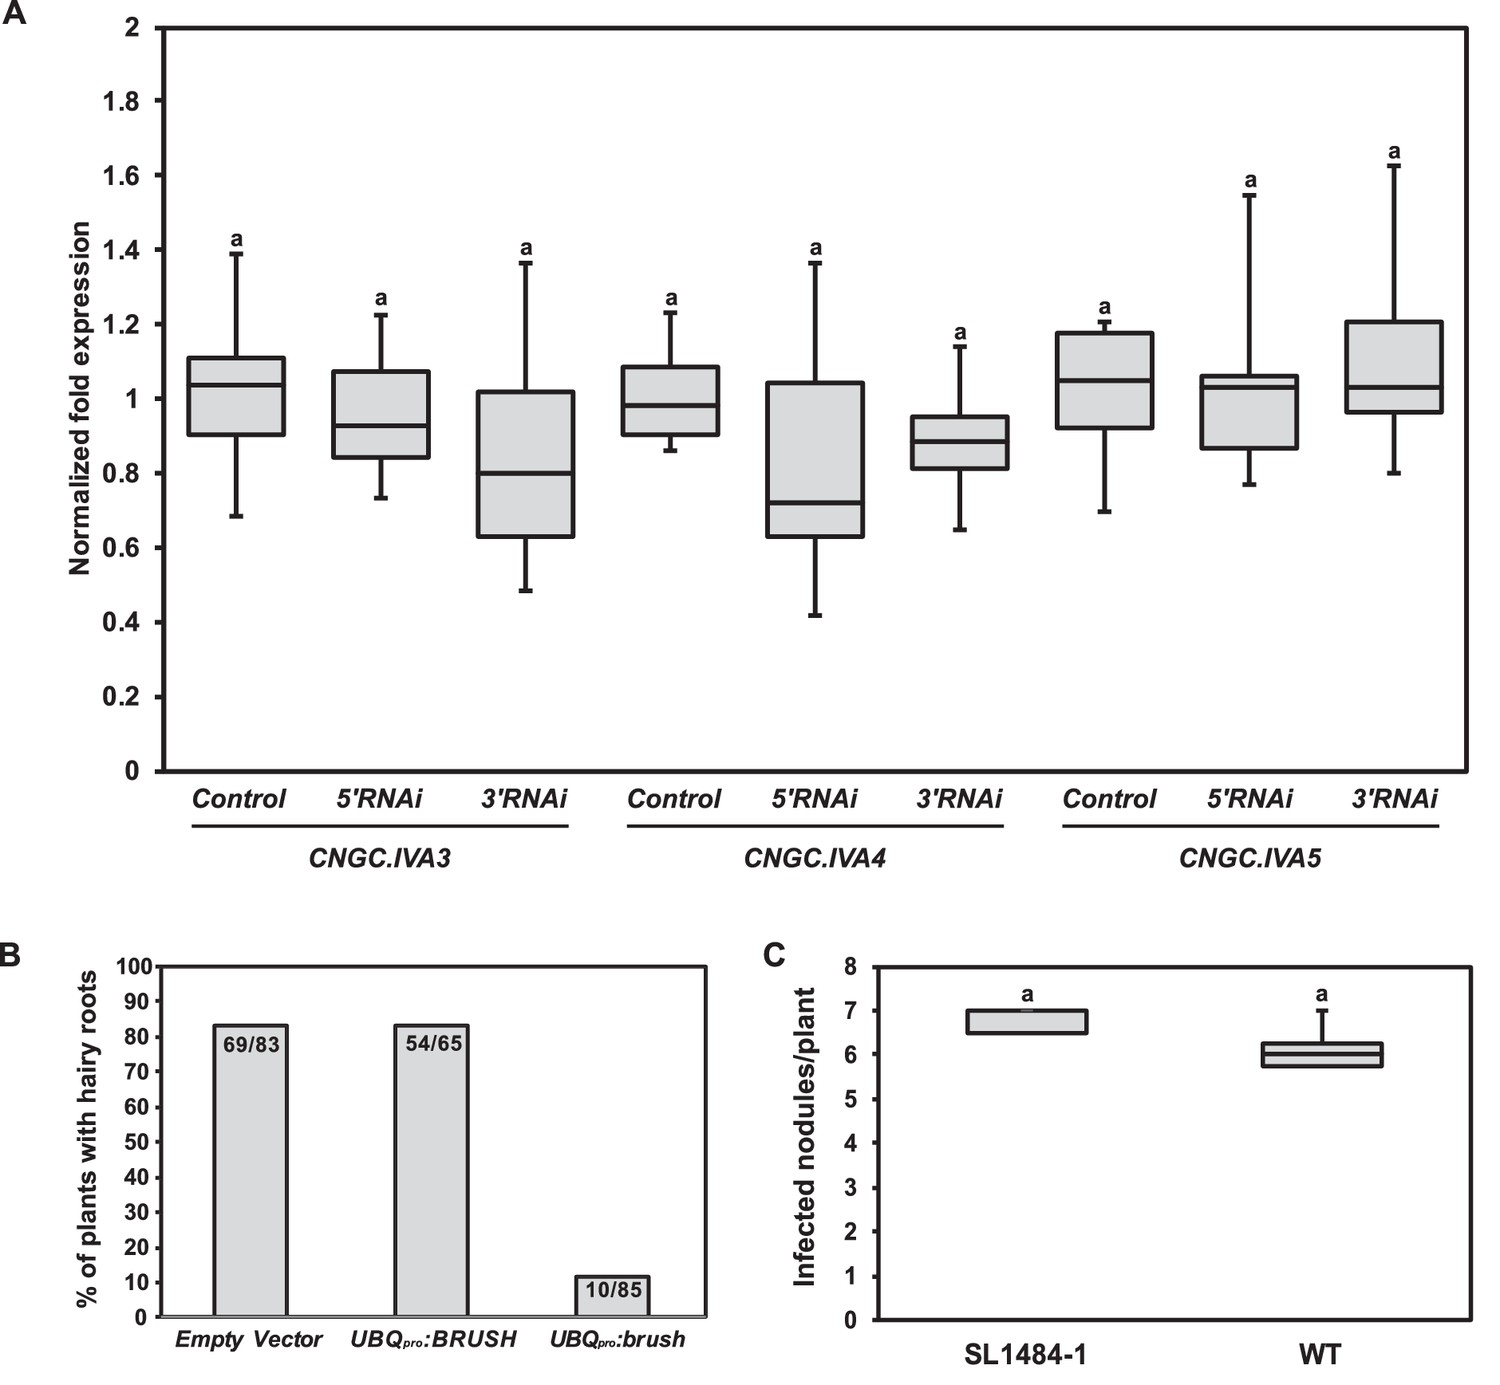
RNAi off-target controls and phenotypes associated with either overexpression of brush or a null BRUSH allele.
(A) RT-qPCR of CNGC.IVA3, CNGC.IVA4, and CNGC.IVA5 in hairy roots transformed with an empty vector control (control) or an RNAi fragment targeting either the 5'UTR (5'RNAi) or 3'UTR (3'RNAi) of brush in the brush mutant. The normalized fold expression is shown relative to the average expression level in control roots transformed with the empty vector (n = 6 for all constructs). Transgenic root tissue was isolated 6 weeks after inoculation with rhizobia. (B) Hairy root formation efficiency of Gifu wild-type plants inoculated with A. tumefaciens carrying a T-DNA containing either UBQpro:BRUSHgenomic or UBQpro:brushgenomic or empty vector as a control. Numbers on the columns indicate the number of plants with GFP-positive hairy roots per total number of inoculated plants. (C) A BRUSH TILLING line (SL1484-1) with a G357A exchange leading to a stop codon (W119Stop) was isolated. Nodule formation in homozygous SL1484-1 plants (n = 3) was not impaired relative to wild-type (n = 8). Plants were cultivated at 26°C and inoculated with M. loti MAFF DsRed. Nodules were counted 2 weeks after inoculation. Letters in (A,C) indicate statistical groups. (A) ANOVA followed by Tukey’s HSD test; F(8, 45)=0.9405, p > 0.05, (C) t-test, p > 0.05.
Figure 2—figure supplement 4
Complementation of brush by overexpressing AtCNGC19 or AtCNGC20.
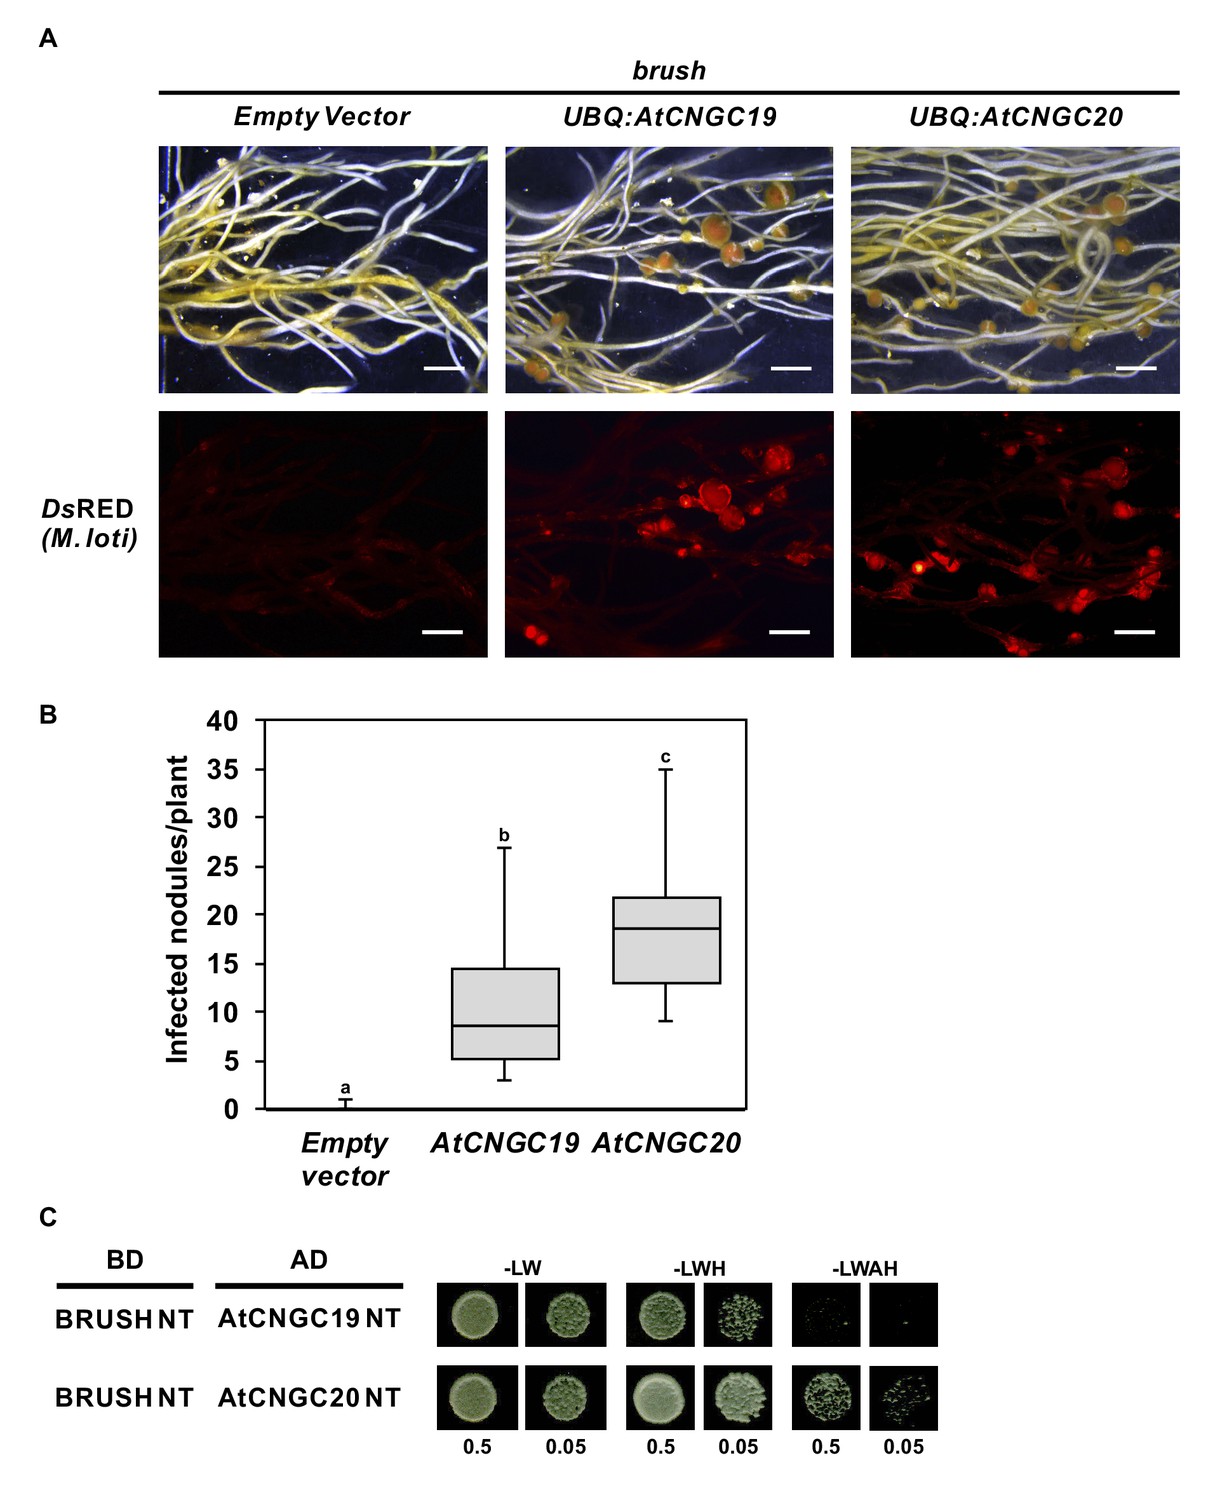
(A) Nodulation and rhizobial infection assay upon hairy root transformation of brush with T-DNA constructs leading to overexpression of AtCNGC19 and AtCNGC20 or with an empty vector as a control. (B) Box plot showing the number of DsRED-positive nodules per transformed plant (n = 10 for all constructs). (C) Yeast two-hybrid interaction assay with the BRUSH N-terminus (BRUSH NT) fused to the GAL4 binding domain (BD) and either AtCNGC19 NT or AtCNGC20 NT fused to the GAL4 activation domain (AD). Yeast cells were resuspended in water (OD600= 0.5 and 0.05) and spotted onto -LW (leucine, tryptophan), -LWH (leucine, tryptophan, histidine) and -LWAH (leucine, tryptophan, adenine, histidine) solid media. The lower panel in (A) contains images of the DsRED channel to visualize Mesorhizobium loti. Roots were observed 6 weeks after the addition of rhizobia. Scale bars in (A) represent 2 mm. Different letters in (B) indicate different statistical groups (ANOVA followed by Tukey’s HSD test, F(2, 27)=20.94, p < 0.001).
Figure 2—figure supplement 5
CNGC.IVA gene expression in Lotus japonicus roots after rhizobial inoculation.
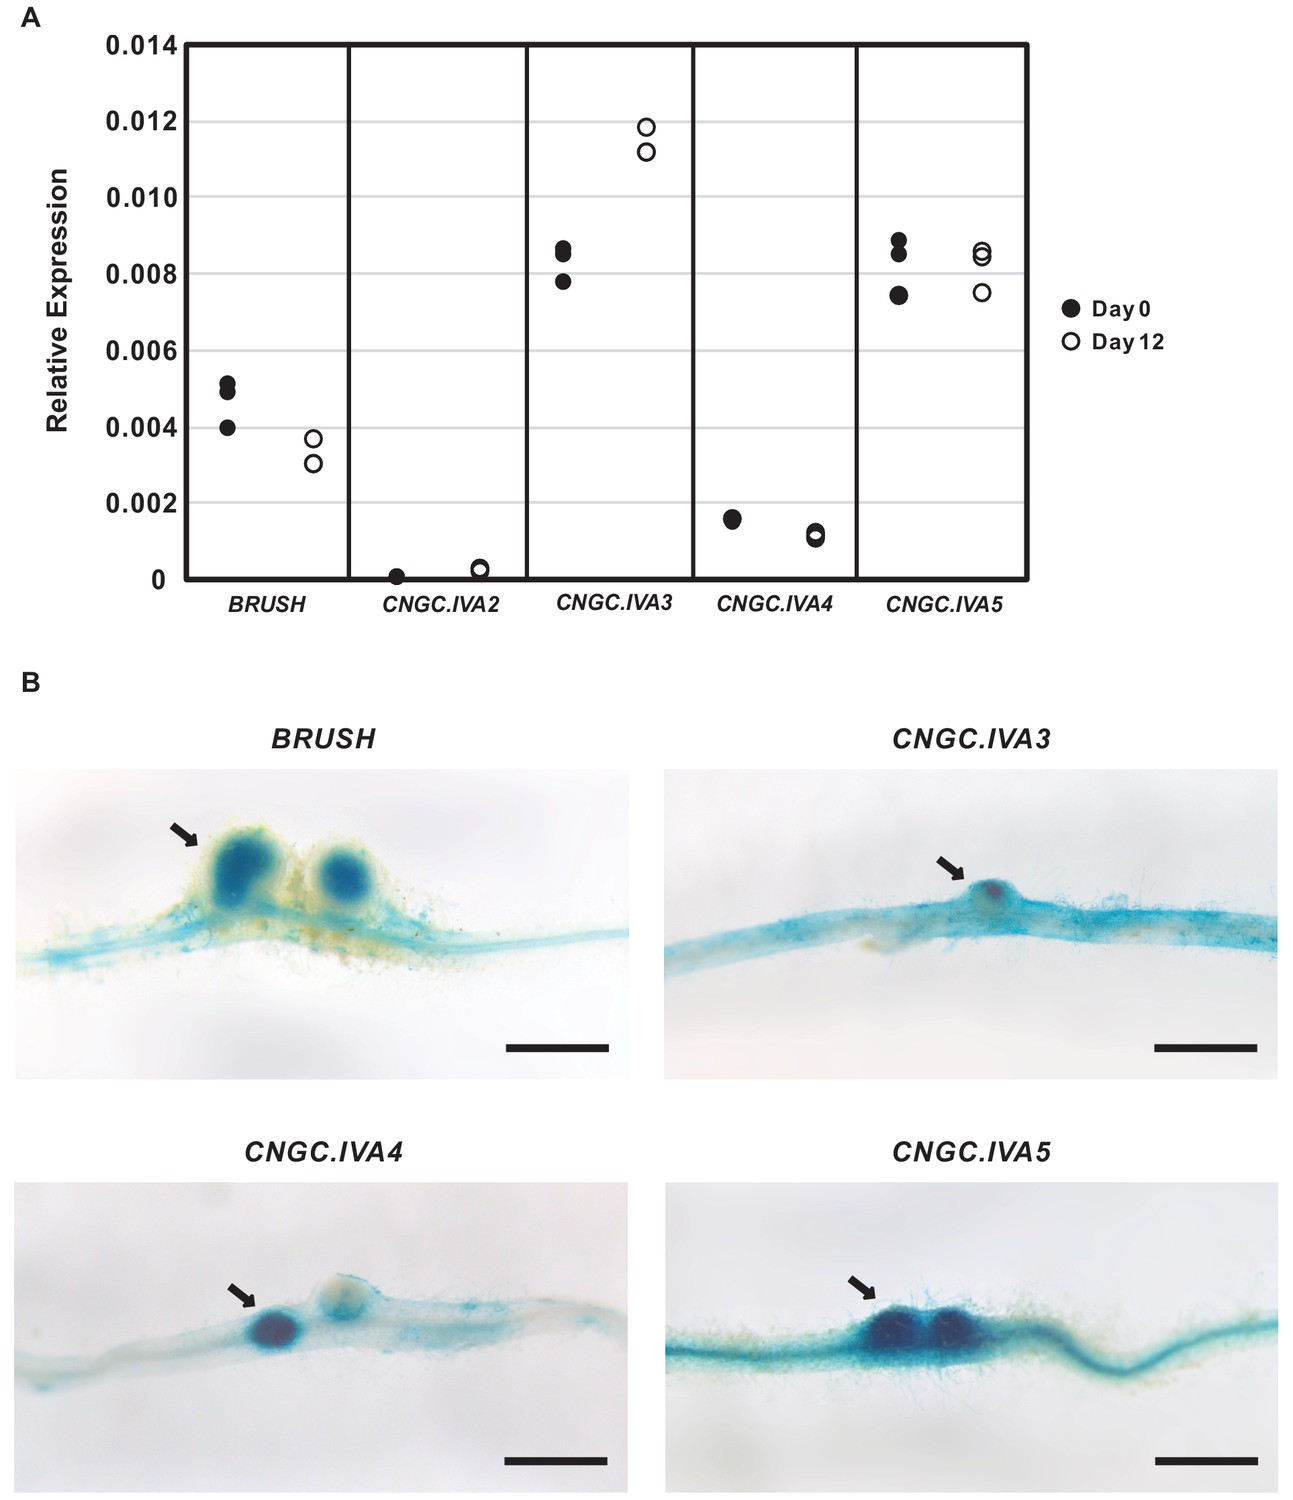
(A), Expression of CNGC.IVA cluster genes in roots as analyzed by RT-qPCR on Day 0 (●) and Day 12 (○) after inoculation with Mesorhizobium loti. Each point represents a biological replicate. Shown is the relative expression as calculated with the 2△△CT method using eEF-1Aα as a reference. (B) Promoter activity of CNGC.IVA genes three weeks after inoculation with Mesorhizobium loti. The 2 kb promoter sequence of each gene was fused to GUS and introduced into Gifu wild-type roots by hairy root transformation. Expression of GUS was detected in developing nodules (arrows) after overnight staining. Scale bars in (B) represent 1 mm.
Figure 2—figure supplement 6
BRUSH expression in roots during nodulation.
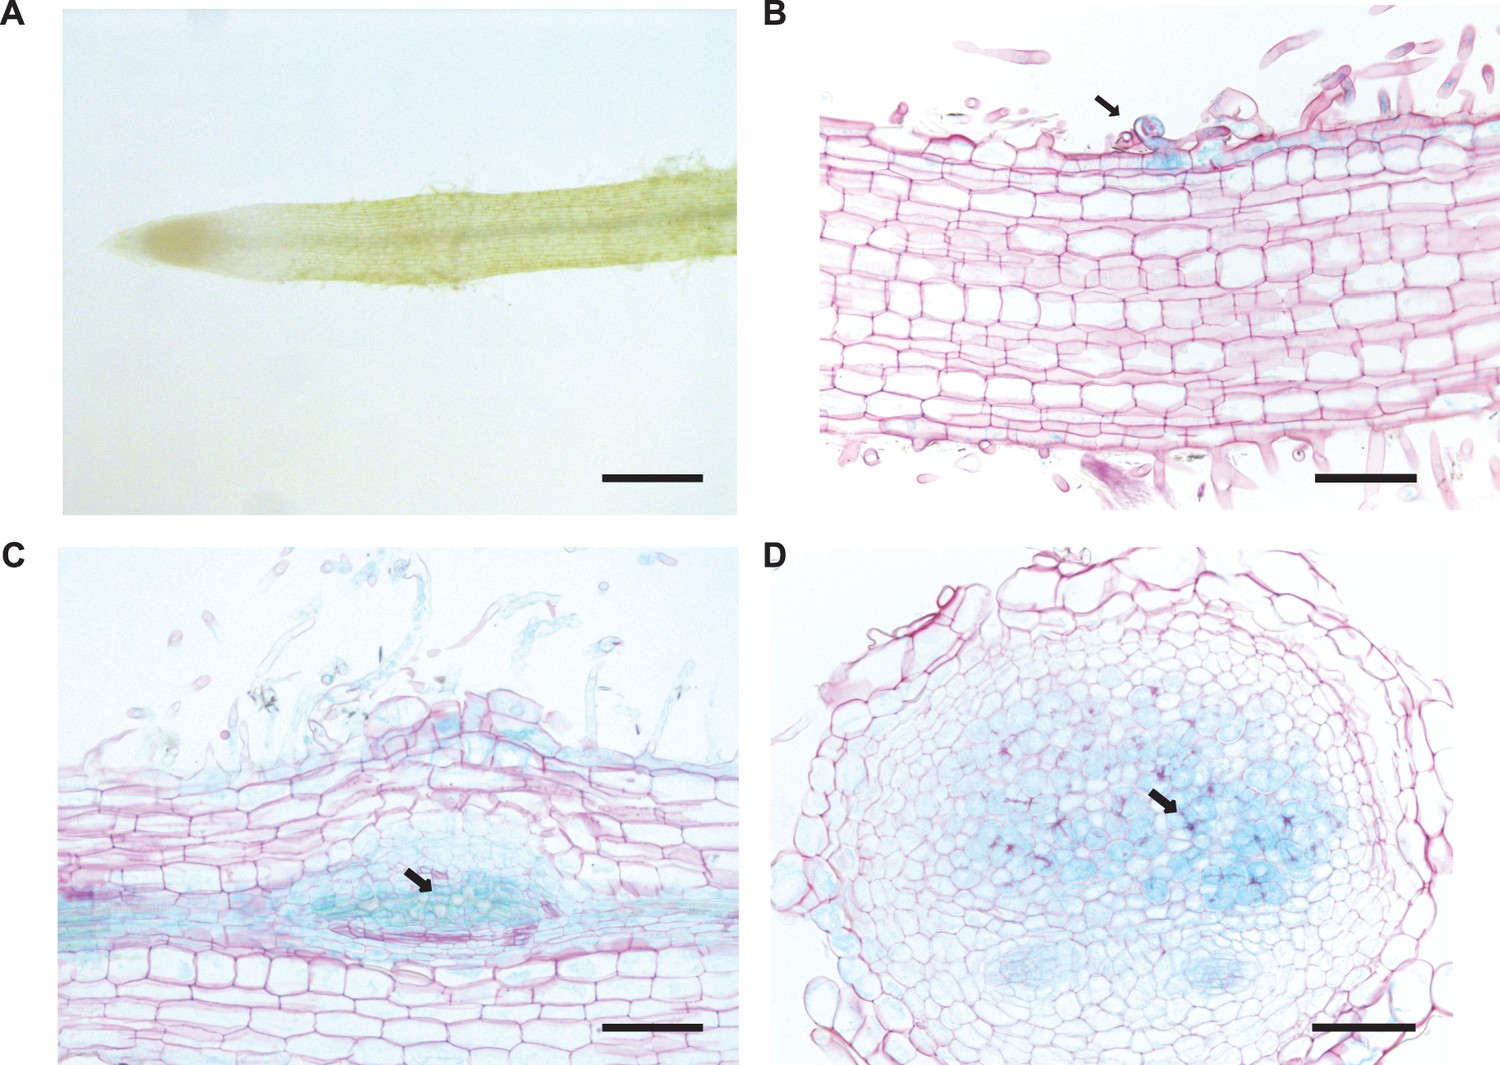
(A) BRUSH 2 kb promoter activity was not evident in the root susceptible zone prior to inoculation. After inoculation with Mesorhizobium loti, promoter activity was observed in infected root hairs (B, arrow), nodule primordia (C, arrow) and infected nodule cells (D, arrow). The promoter sequence was fused to GUS and introduced into Gifu wild-type plants by hairy root transformation. Roots were harvested 3 weeks after inoculation with rhizobia, stained for GUS activity overnight, and counterstained with ruthenium red after sectioning (B,C,D). Scale bars represent 0.6 mm (A), and 0.2 mm (B,C,D).
Figure 3 with 2 supplements
Interaction of CNGC.IVA N-termini in yeast and channel activity in Xenopus oocytes.
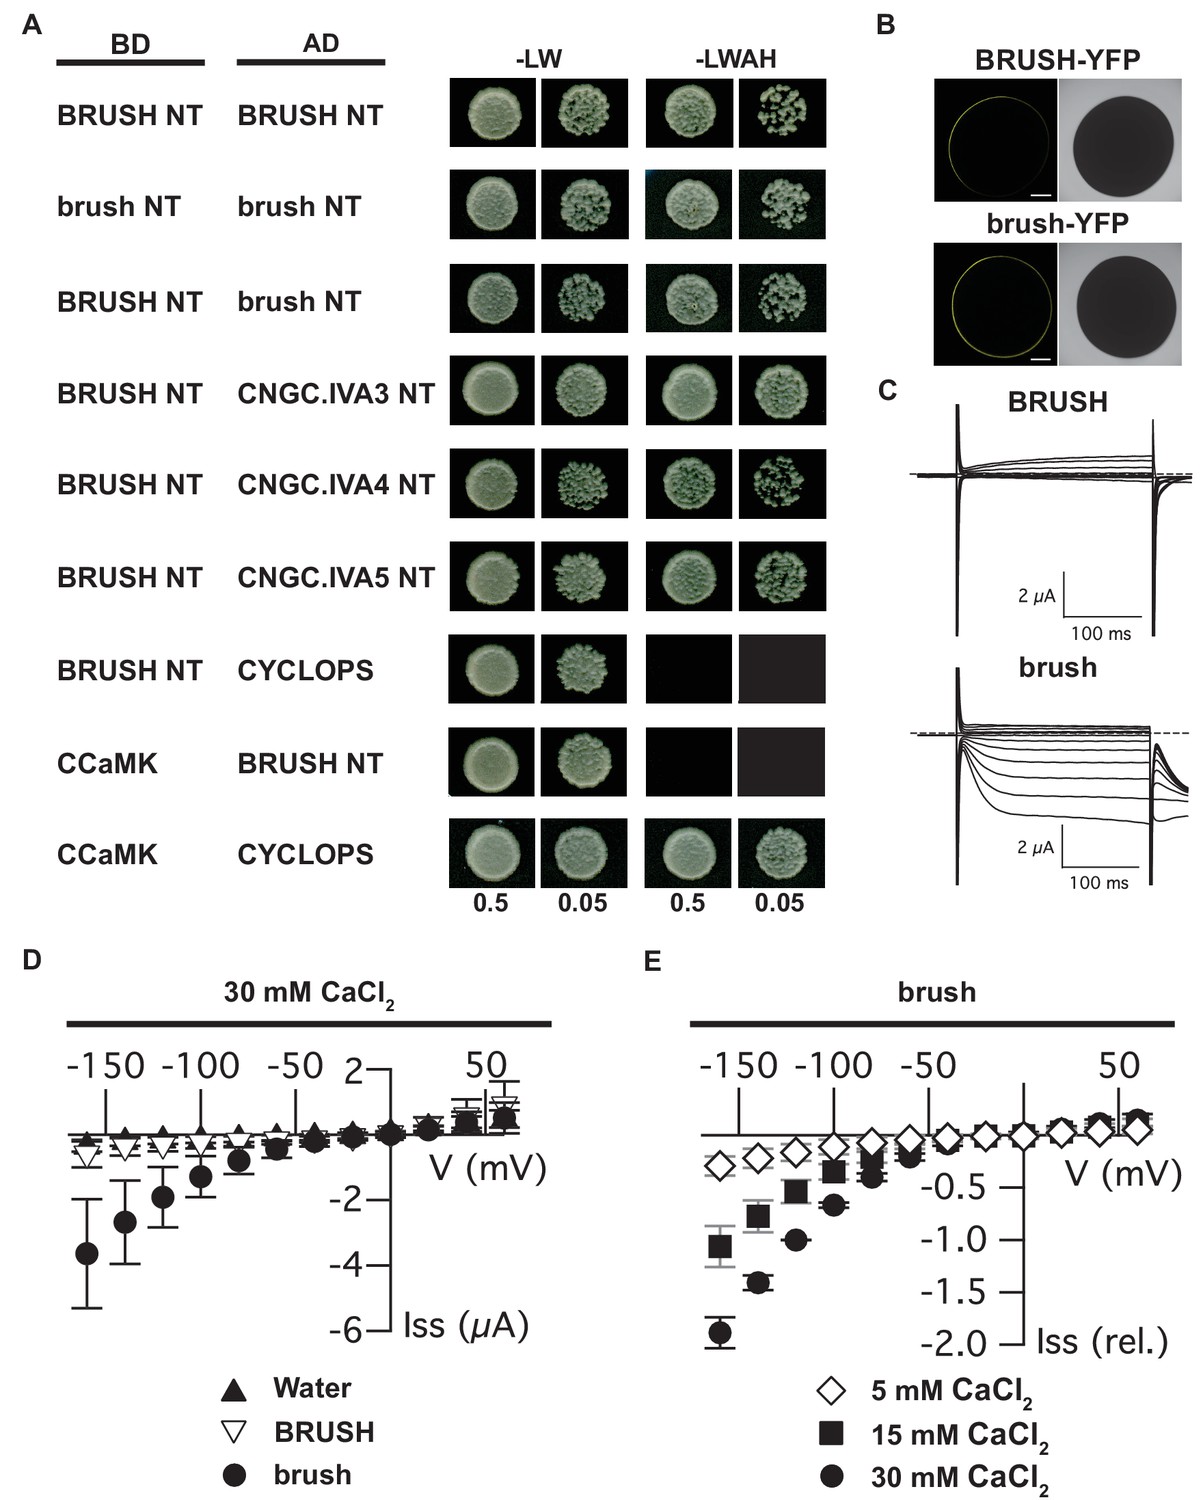
(A) Yeast two-hybrid interaction of the soluble BRUSH N-terminus (NT) fused to the GAL4-binding domain (BD) and the NT of the indicated CNGC.IVA proteins fused to the GAL4 activation domain (AD). Yeast cells were resuspended in water (OD600= 0.5 and 0.05) and spotted onto -LW (leucine, tryptophan) and -LWAH (leucine, tryptophan, adenine, histidine) solid media. (B) Confocal fluorescence images of oocytes expressing either BRUSH-YFP or brush-YFP fusion proteins. (C) Plasma membrane currents of oocytes expressing BRUSH or brush in the presence of 30 mM CaCl2. Voltage steps ranged from +60 to −160 mV in 20 mV increments, starting from a holding potential of −40 mV. Dashed lines indicate 0 µA. (D) Current-voltage relations of oocytes injected with water or YFP (▲, n=15), BRUSH or BRUSH-YFP (▽, n=17), and brush or brush-YFP (●, n=26) . (E) Relative current-voltage relations for oocytes expressing brush and brush-YFP in the presence of 5 mM CaCl2 (◇ , n = 3), 15 mM CaCl2 (■, n = 3), and 30 mM CaCl2 (●, n = 6). Currents are shown relative to the current at −120 mV in the presence of 30 mM CaCl2. Data in (D) and (E) represent mean values ± standard deviations. Scale bars in images (B) represent 250 µm.
-
Figure 3—source data 1
Figure 3D source data.
- https://doi.org/10.7554/eLife.25012.025
-
Figure 3—source data 2
Figure 3E source data.
- https://doi.org/10.7554/eLife.25012.026
-
Figure 3—source data 3
Figure 3—figure supplement 2E source data.
- https://doi.org/10.7554/eLife.25012.027
-
Figure 3—source data 4
Figure 3—figure supplement 2F source data.
- https://doi.org/10.7554/eLife.25012.028
Figure 3—figure supplement 1
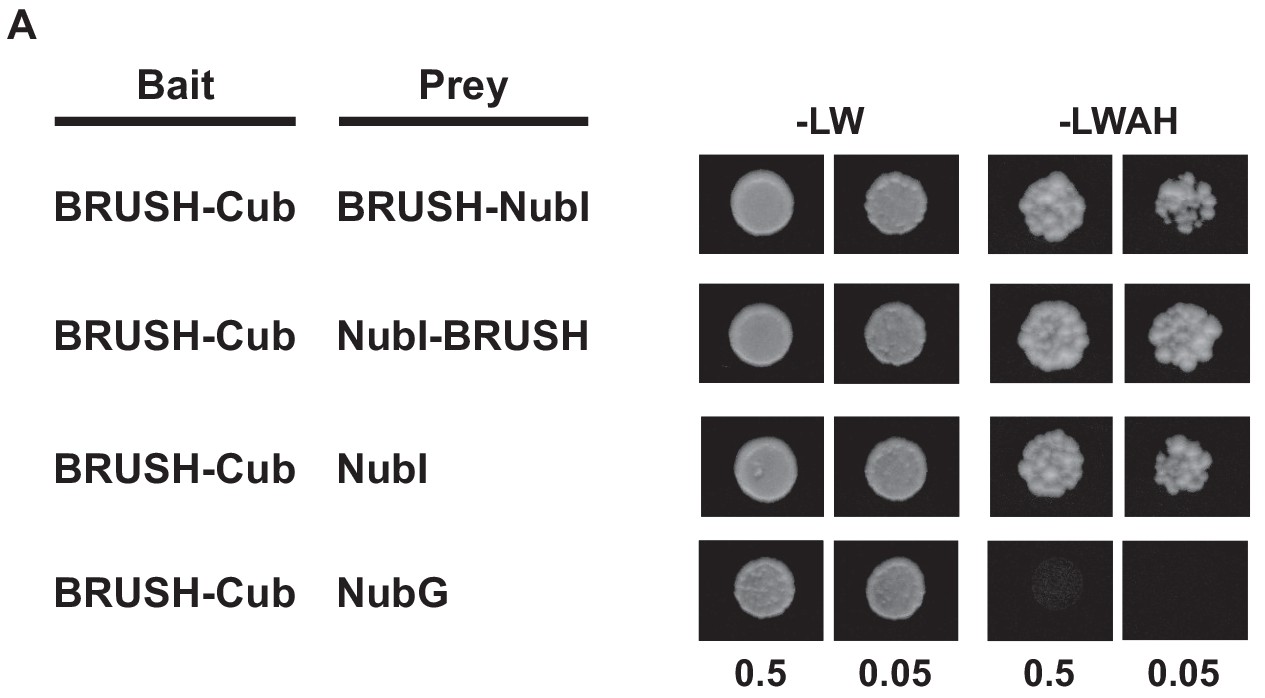
BRUSH topology determination in yeast.
(A) Yeast split-ubiquitin assay to determine the location of the BRUSH termini. A fusion of BRUSH to the C-terminal fragment of ubiquitin (BRUSH-Cub) was co-transformed with BRUSH fused C- or N-terminally to the N-terminal fragment of ubiquitin (NubI-BRUSH or BRUSH-NubI), NubI alone, or NubG. NubI (wild type, isoleucine at position 13) spontaneously associates with Cub and activates the reporters when both fragments are located in the cytoplasm. The mutated NubG variant (glycine at position 13) has no inherent affinity for Cub. Yeast cells were resuspended in water (OD600= 0.5 and 0.05) and spotted onto -LW (leucine, tryptophan) and -LWAH (leucine, tryptophan, adenine, histidine) solid media.
Figure 3—figure supplement 2
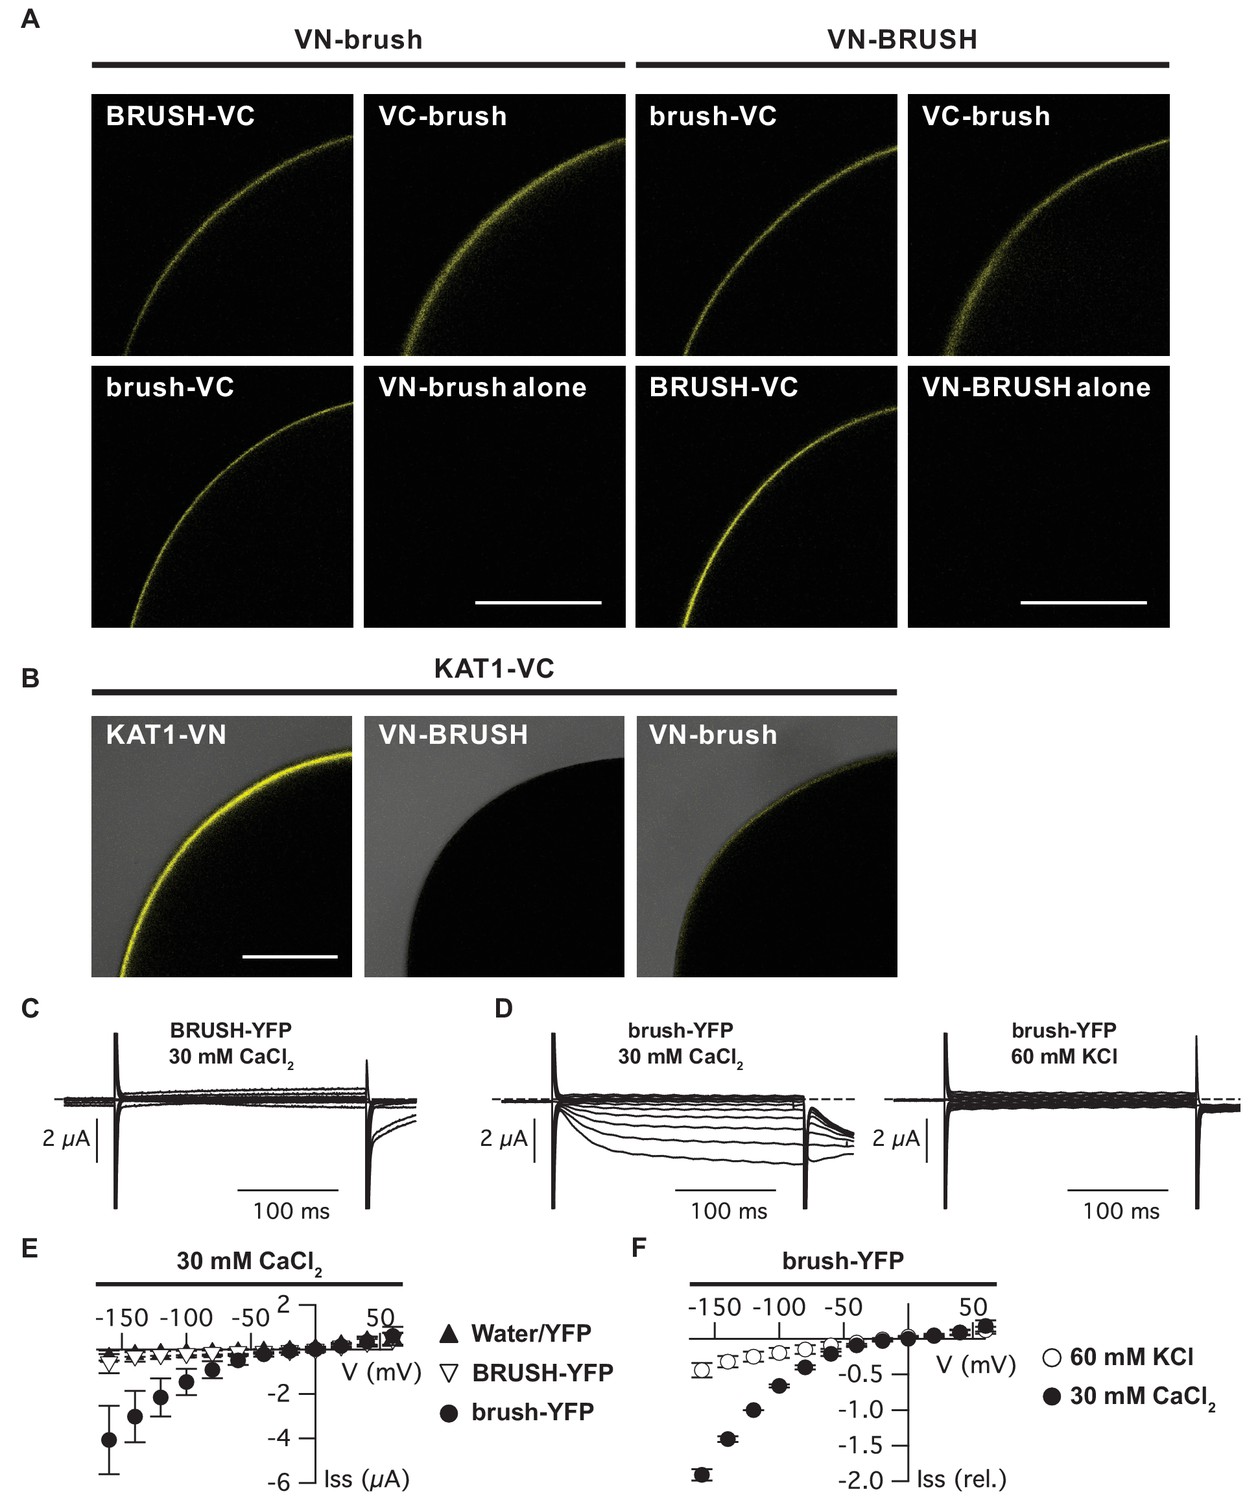
Brush interaction in oocytes and permeability to Ca2+ and K+.
(A) Bimolecular fluorescence complementation (BiFC) analysis of BRUSH and brush fused to either a N-terminal (VN) or C-terminal (VC) fragment of Venus (YFP). Shown are representative oocytes 3 days after co-injection of the corresponding cRNAs. The bottom right image of each panel (VN fusion alone) displays the (non-detectable) background oocyte fluorescence. (B) Control BiFC experiments utilizing AtKAT1. Images are overlays of bright-field and fluorescent images. (C) Current responses of an oocyte expressing BRUSH-YFP in the presence of 30 mM CaCl2. (D) Currents of a brush-YFP injected oocyte in the presence of 30 mM CaCl2 (left) or 60 mM KCl (right). (E) Current-voltage relations of BRUSH-YFP (▽, n = 8), brush-YFP (●, n = 14), and oocytes injected with water or YFP (▲, n = 16). (F) Mean relative current-voltage relations (n = 4) in the presence of 30 mM CaCl2 (●) and 60 mM KCl (○) ±standard deviations. Currents were normalized to the value at −120 mV in the presence of 30 mM CaCl2. Scale bars (A,B) represent 250 µm.
Figure 4
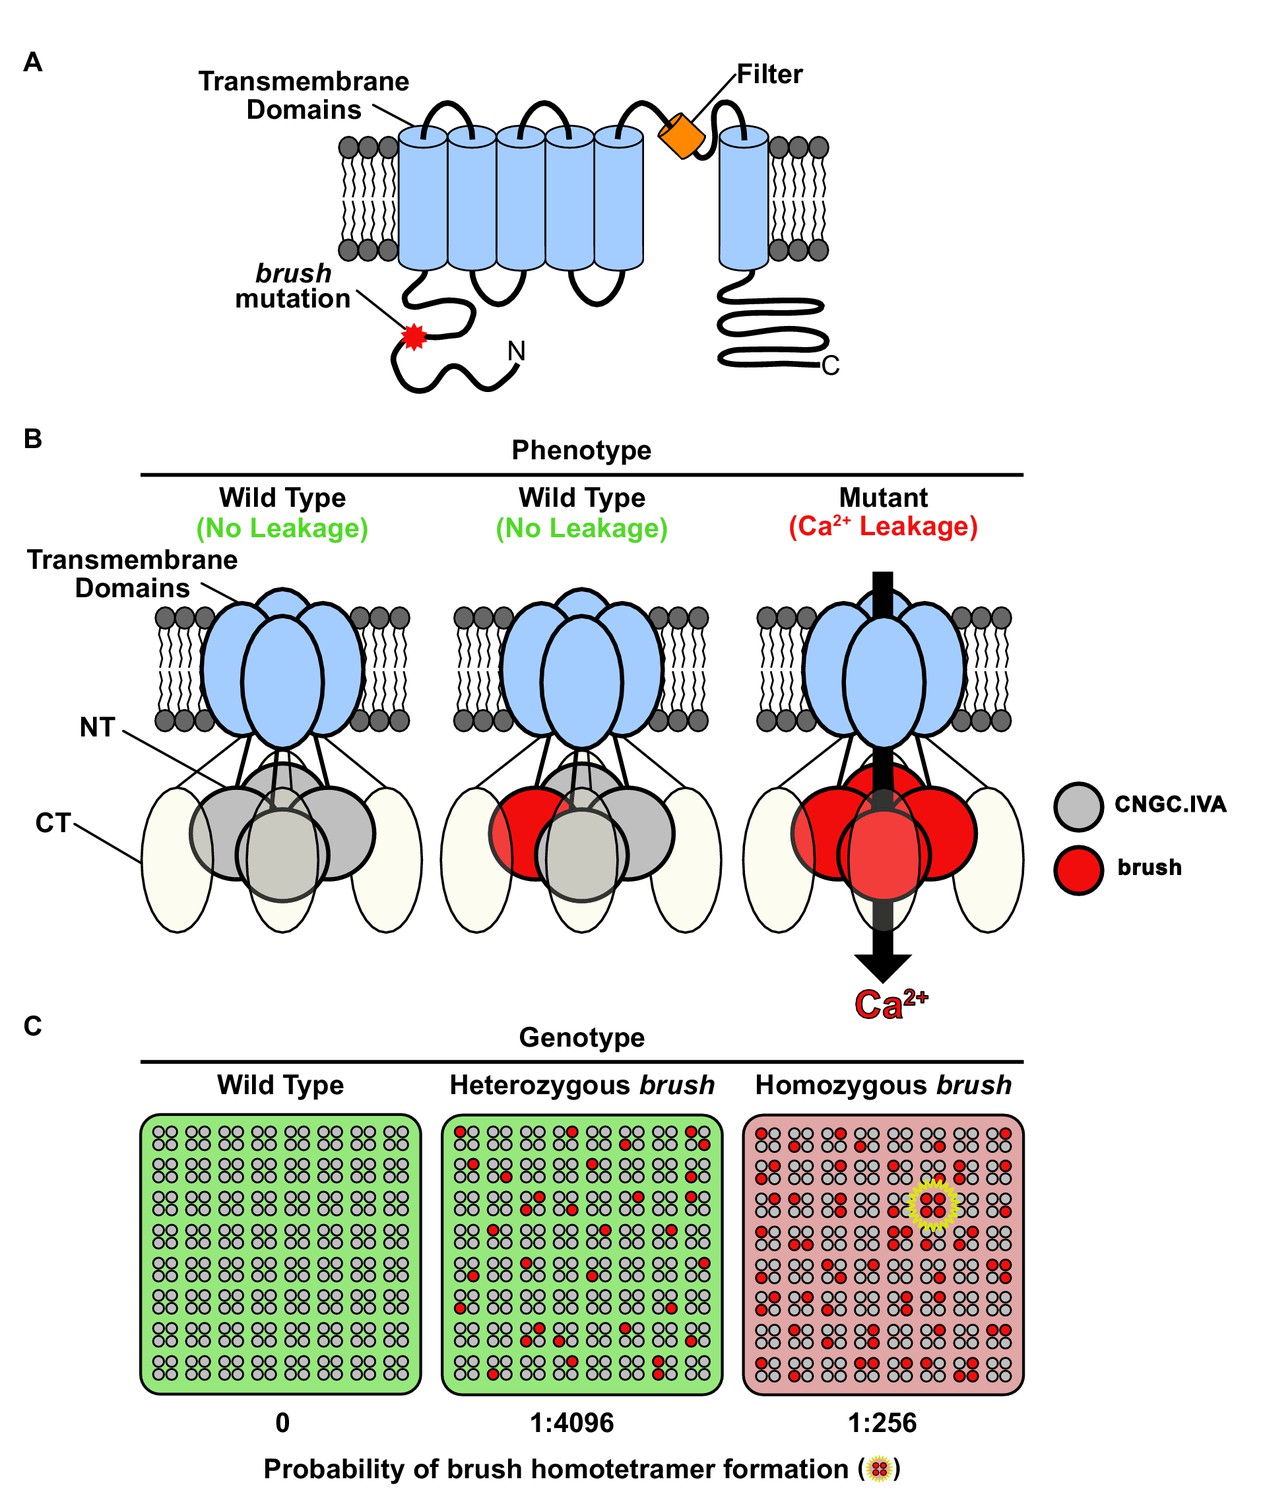
Model for brush activity in planta.
(A) The predicted two-dimensional topology of a brush monomer embedded in a lipid bilayer. (B) Model explaining the mechanistic connection between the relative abundance of the brush mutant channel with the unusual quantitative genetic behavior of the brush phenotype. Based on complementation and interaction studies, BRUSH engages in a tetrameric complex along with 3 other CNGC.IVA proteins. From the segregation analysis, plants heterozygous for brush exhibit a wild-type phenotype. Expression of brush in oocytes mediates leaky Ca2+ influx, indicating that a homotetramer is inappropriately active. (C) Probability-based overview of brush homotetramer formation assuming that each of the 4 CNGC.IVA subunits participates with equal likelihood in complex formation. Shown is a grid containing 8 × 8 tetramers with CNGC.IVA WT (grey dots) and brush (red dots) subunits. Both wild-type and heterozygous plants do not exhibit a phenotype (indicated by green background). The probability of forming brush homotetramer is 1:4096 for a heterozygous and 1:256 for a brush homozygous genotype. A brush homotetramer (shown inside yellow star) is required to trigger the phenotype (red background). This frequency-dependent assembly of the leaky brush tetramer explains the phenotypic differences observed in plants harboring different allele frequencies.
Additional files
-
Supplementary file 1
Oligonucleotides used in this study.
- https://doi.org/10.7554/eLife.25012.030
-
Supplementary file 2
DNA plasmids used in this study.
- https://doi.org/10.7554/eLife.25012.031
-
Supplementary file 3
List of key plant material used in this study.
- https://doi.org/10.7554/eLife.25012.032
-
Transparent reporting form
- https://doi.org/10.7554/eLife.25012.033
Download links
A two-part list of links to download the article, or parts of the article, in various formats.
Downloads (link to download the article as PDF)
Open citations (links to open the citations from this article in various online reference manager services)
Cite this article (links to download the citations from this article in formats compatible with various reference manager tools)
A quantitative hypermorphic CNGC allele confers ectopic calcium flux and impairs cellular development
eLife 6:e25012.
https://doi.org/10.7554/eLife.25012


