Saccadic suppression as a perceptual consequence of efficient sensorimotor estimation
- Institute of Information and Communication Technologies, Electronics and Applied Mathematics, Université catholique de Louvain, Belgium
- Institute of Neuroscience, Université catholique de Louvain, Belgium
- Rehabilitation Institute of Chicago, Northwestern University, United States
Figures
Figure 1
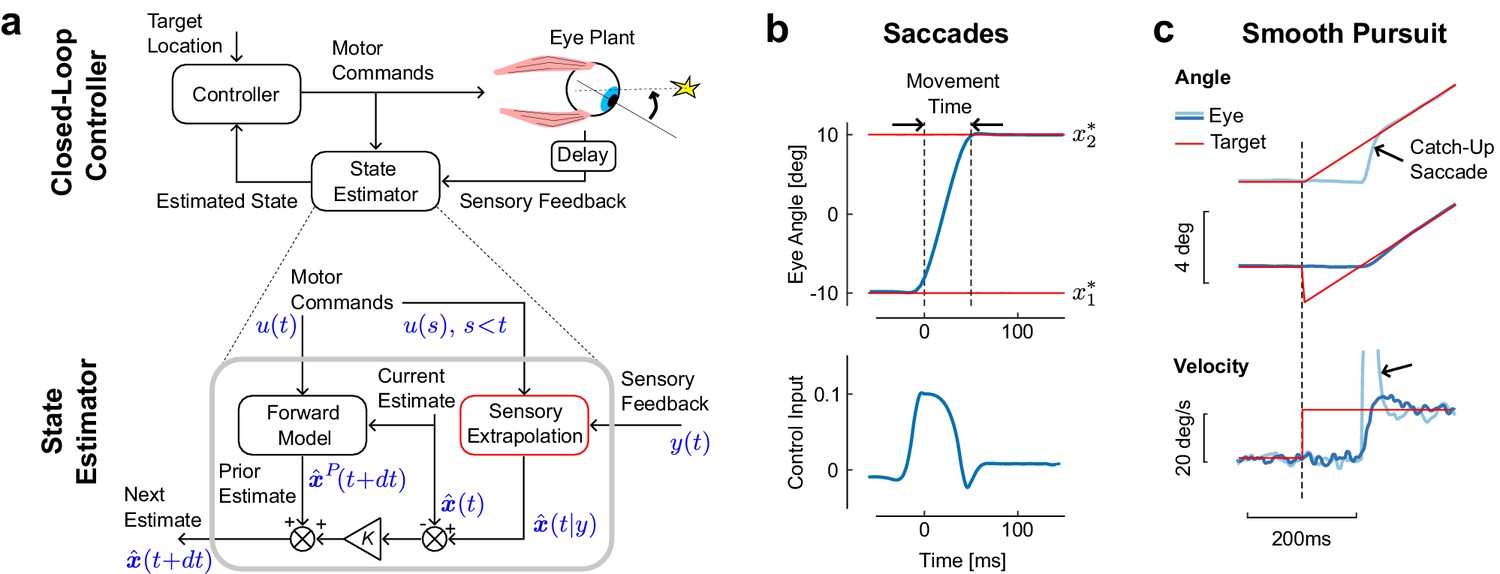
Model architecture and simulations of eye movements.
(a) Schematic representation of the control and estimation architectures. We consider a closed loop controller based on optimal feedback control and state estimation. The dynamics of the eye plant corresponded to a second order system with time constants taken from the literature (13 ms and 224 ms). Bottom: Optimal state estimator based on usual Kalman filtering, and augmented with the extrapolation of sensory feedback to compensate for sensorimotor delays (Sensory Extrapolation, red box). The symbolic representation of the signals in blue follows the same notations as in the Materials and methods: is the sensory feedback, is the extrapolation of sensory feedback, is the sequence of previous and current control commands, and are the prior and posterior estimates at the corresponding time steps. (b) Top: Modeled saccadic eye movement from the first () to the second fixation target (). Bottom: Associated control function. Time zero corresponds to the end of the fixation period to the first target. (c) Illustration of the sensory extrapolation performed in the state estimator. The simulated task is to track the target, which suddenly starts moving (velocity jump) with or without position jump in the opposite direction. The simulated eye trajectory shows how the extrapolation of target motion over the delay interval generates a catch up saccade (black arrow). This compensatory movement is also illustrated in the velocity trace.
Figure 2
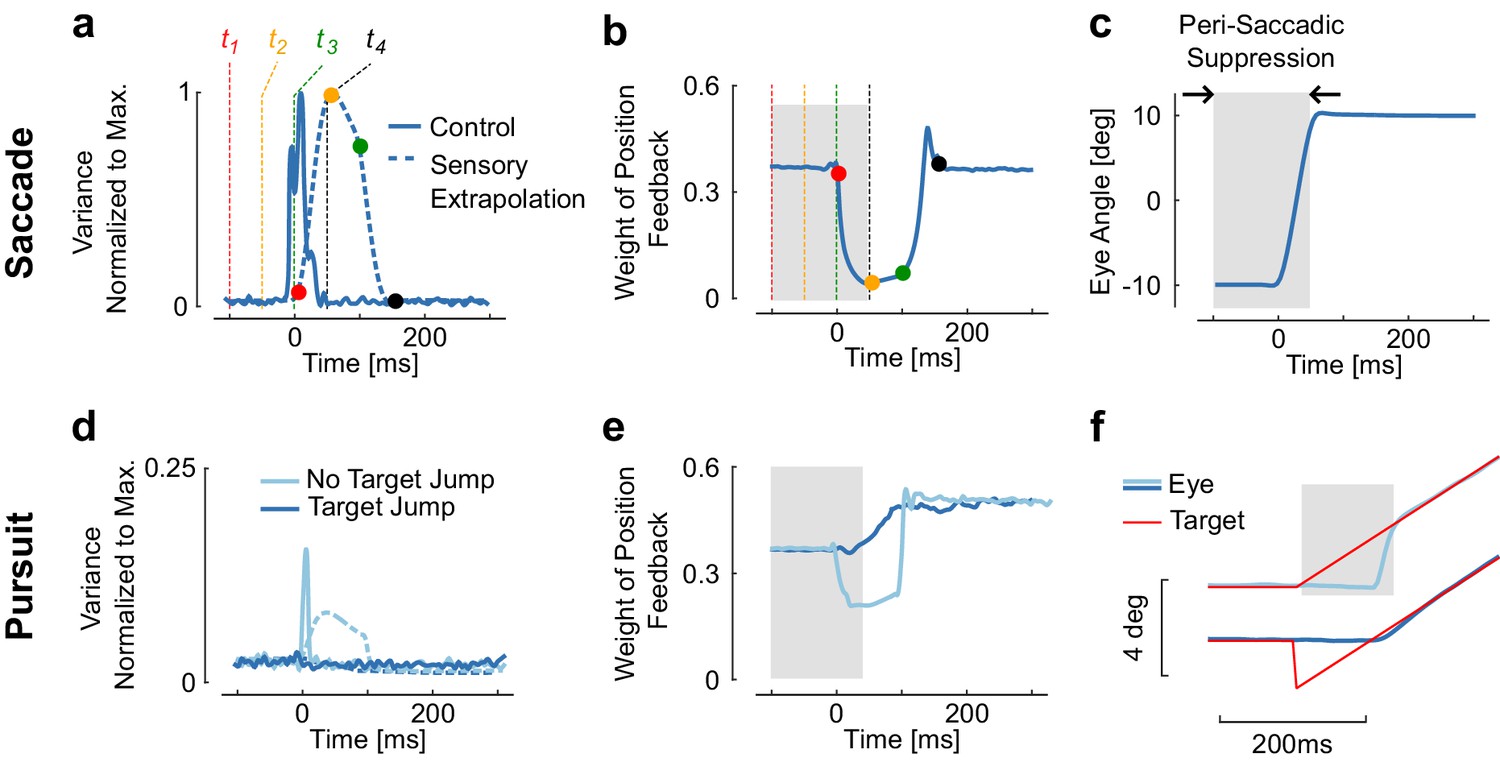
Reduction of sensory weight.
(a) Variance of the control signal (solid) and of the extrapolation of sensory feedback (dashed). Four times are represented to illustrate how signal-dependent noise impacts the extrapolation of sensory feedback is ( = −100 ms, −50 ms, 0 ms, and 50 ms). The dots with similar color represent the moment when the information at the corresponding time is available (). Observe the increase in extrapolation variance associated with stimuli between and . (b) Weight of the position feedback for correcting the estimate of the position. This weight is directly taken from the Kalman gain matrix. The reduction in Kalman gain at each selected time point is directly linked to the increase in variance. (c) Representation of a modeled saccadic eye movement, with the gray area corresponding to the interval of time during which sensory input is given less weight as a result of the extrapolation variance. (d) Control and extrapolation variance normalized to the maximum values obtained for saccades of 20 deg (top traces). (e) Weight of sensory feedback for the two simulations. Observe that although the catch-up saccade is very small (~2 deg), the transient increase in extrapolation variance gives rise to a reduction in weight. (f) Illustration of the smooth pursuit task with (dark blue) or without (light blue) initial target jump occurring simultaneously with the velocity jump. The absence of target jump evokes a catch-up saccade, which is associated with ta reduction in sensory weight. There is no reduction with the initiation of smooth pursuit.
Figure 3
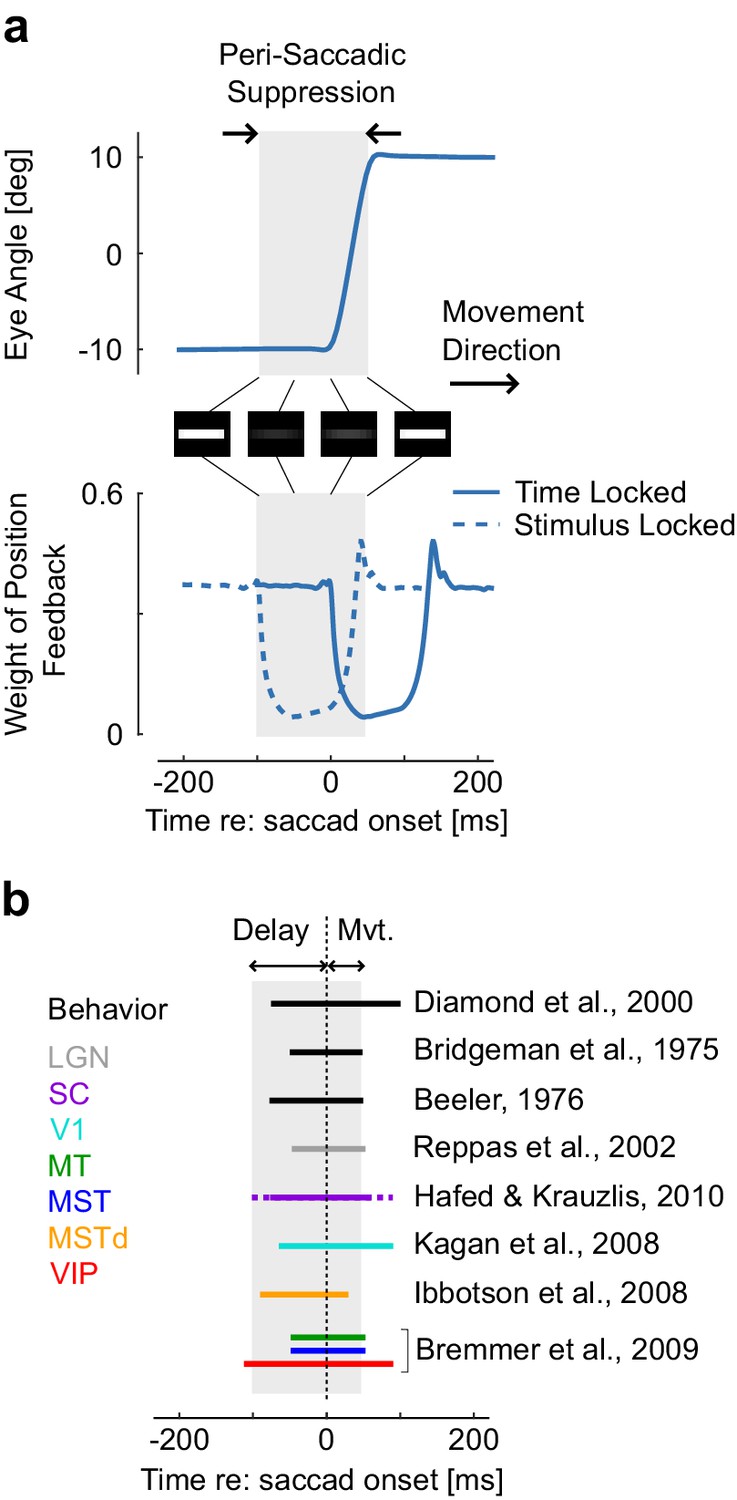
Representation of a simulated 20 deg saccade ad dynamic weight of sensory feedback, with the perisaccadic suppression highlighted in gray.
These traces are similar as Figure 3a and c. The images represent the convolution of a horizontal stripe with a Gaussian kernel with variance proportional to the extrapolation variance to highlight that assigning higher variance may lead to reduced contrast, even when the movement is aligned with the stimulus orientation. Times correspond to the Figure 3. The decrease in Kalman gain occurs from 0 to 150 ms relative to saccade onset (solid trace: time locked), thus the window during which stimuli are suppressed corresponds to −100 to 50 ms (dashed trace: stimulus-locked). (b) Illustration of how the predicted saccadic suppression compares with previously reported suppression from behavioral and neural data. The duration of the perisaccadic suppression in the model is the sum of the temporal delay and of the movement time as represented above with the gray rectangle. Comparisons are approximate as movement time was not the same across all studies. The solid and dashed traces for saccadic suppression in SC indicates the range of onset and offset as given by Hafed and Krauzlis (2010). Other intervals of saccadic suppression were drawn following the authors’ summary or based on visual inspection of the corresponding references.
Figure 4
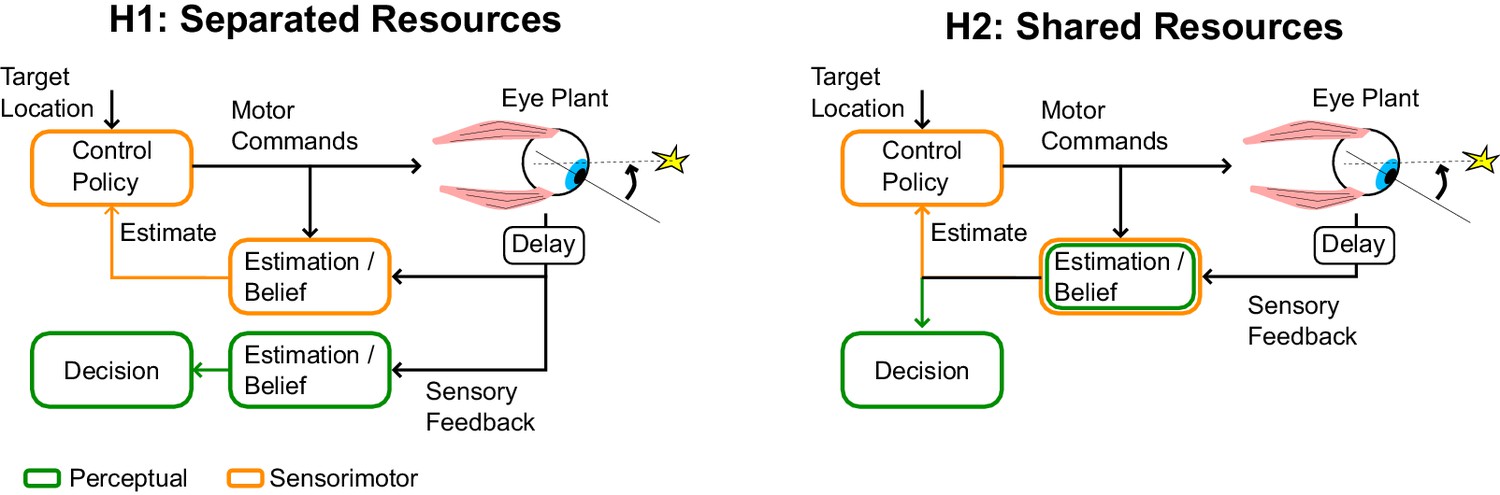
Schematic illustration of separate or shared resources hypotehses.
In the hypothesis of separated resources (H1), computations of the posterior belief are carried out independently for perception and control. In this scenario, the uncertainty induced by the control commands does not impact the perceptual estimate. This possible architecture is optimal in the sense that it would minimize loss of sensory information. In the hypothesis of shared resource (H2), the computation of the posterior belief about the state of a variable is shared for perception and control, thus both processes are similarly influenced by control-dependent noise. Although the first hypothesis is optimal, the second hypothesis is more efficient in terms of neural resources, and is also self-consistent (see Discussion).
Download links
A two-part list of links to download the article, or parts of the article, in various formats.
Downloads (link to download the article as PDF)
Open citations (links to open the citations from this article in various online reference manager services)
Cite this article (links to download the citations from this article in formats compatible with various reference manager tools)
Saccadic suppression as a perceptual consequence of efficient sensorimotor estimation
eLife 6:e25073.
https://doi.org/10.7554/eLife.25073


