Dual role for Jumu in the control of hematopoietic progenitors in the Drosophila lymph gland
- College of Life Sciences, Northeast Forestry University, China
Figures
Figure 1
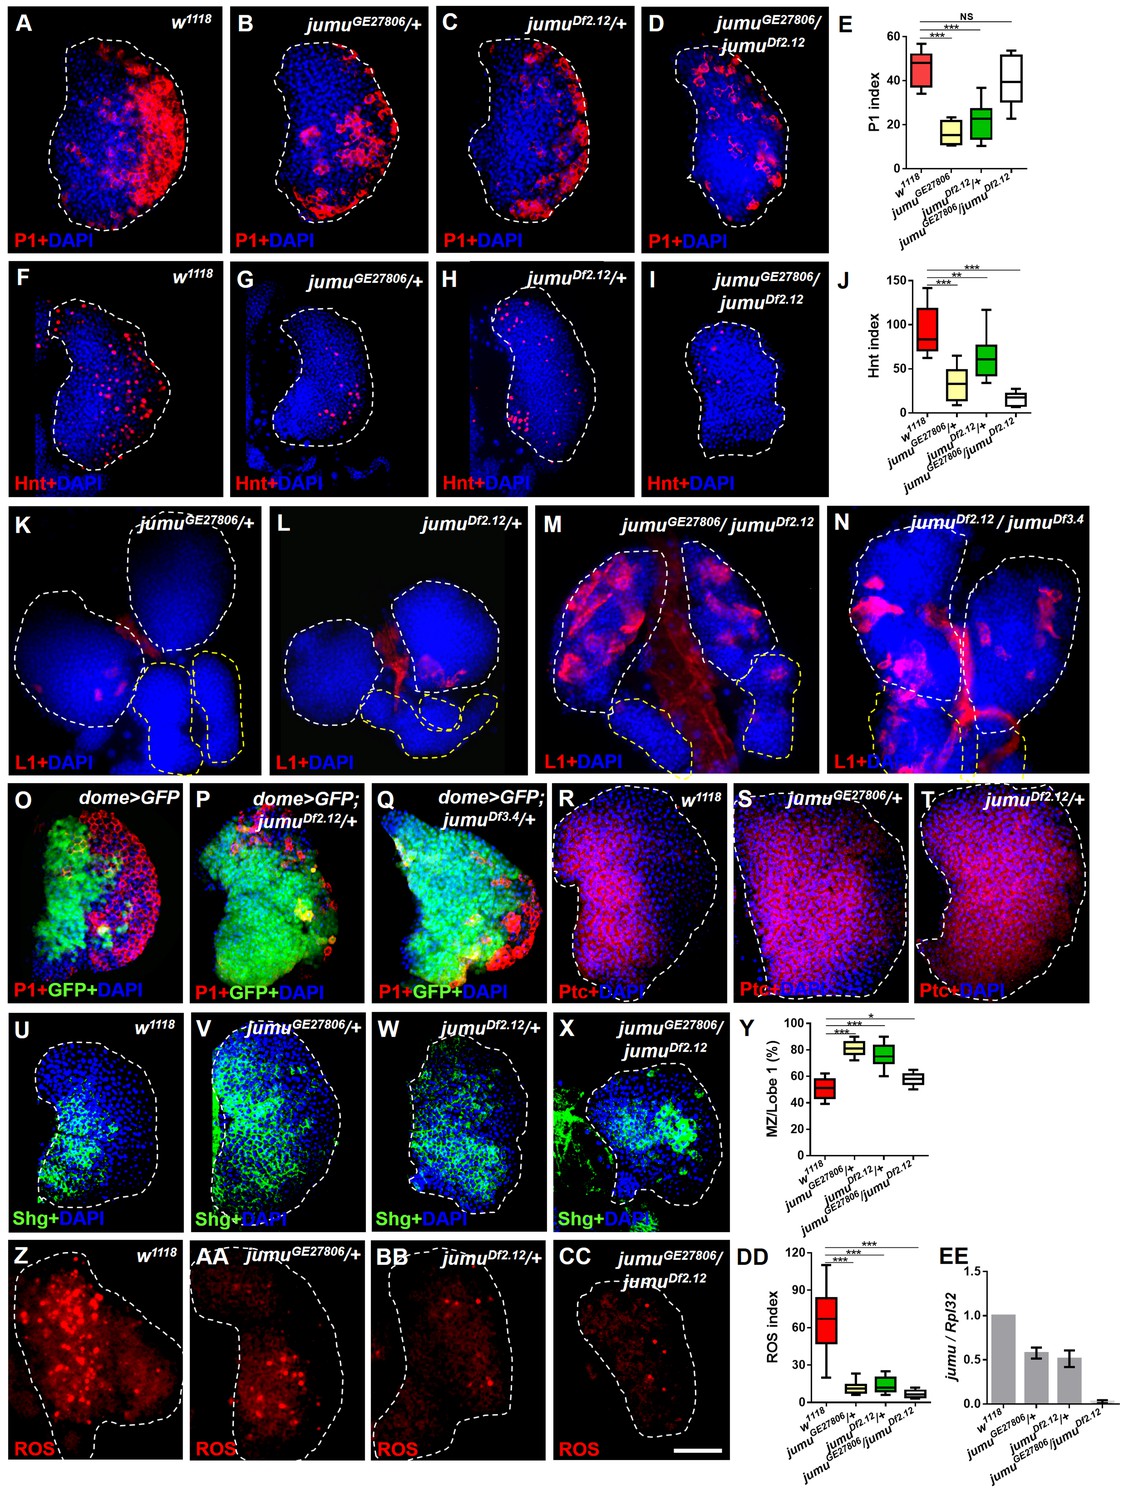
Loss of jumu affects prohemocyte differentiation in the lymph gland.
(A–D) Immunostaining against the plasmatocyte marker P1 (red) in the lymph glands of third-instar larvae. The numbers of plasmatocytes are significantly reduced in jumu heterozygotes but not obviously reduced in double heterozygotes mutants. (F–I) Immunostaining against the crystal cell marker Hnt (red) in the lymph glands of third-instar larvae. The numbers of crystal cells are significantly reduced in the mutant flies. (E, J) Quantification of plasmatocyte and crystal cell indexes in primary lobes. (K–N) Immunostaining against the lamellocyte marker L1 (red) shows few lamellocytes in jumu heterozygotes (K, L) and substantial increases in the lamellocyte number in jumu double heterozygotes mutants (M, N). (O–Q) The lymph glands of jumuDf2.12and jumuDf3.4 third-instar larvae display expansion of the medullary zone (MZ) as marked by dome>GFP (green) and a reduced plasmatocyte signal (red). (R–X) Immunostaining against Ptc (red) (R–T) and Shg (green) (U–X) shows MZ expansion in mutant third-instar larvae. (Y) Quantification of the proportions of the primary lobes occupied by prohemocytes (Shg+ MZ area/primary lobe area). (Z–CC) The ROS levels (red) are increased in the MZ of w1118third-instar larvae, but similar increases are rarely observed in mutant third-instar larvae. (DD) Quantification of the ROS+ cell index in primary lobes. (EE) Real-time PCR analysis of the jumu level in the entire third-instar larvae. The data are presented as box-and-whisker representations in E, J, Y and DD and as column-bar-graph representations (in which the error bars represent ± S.E.M.) in EE. For all quantifications: NS, not significant; *p<0.1; **p<0.01; ***p<0.001 (Student’s t test). Dashed white and yellow lines outline the edges of the primary and secondary lobes, respectively, in all of the figures. Scale bars: 50 μm.
Figure 2
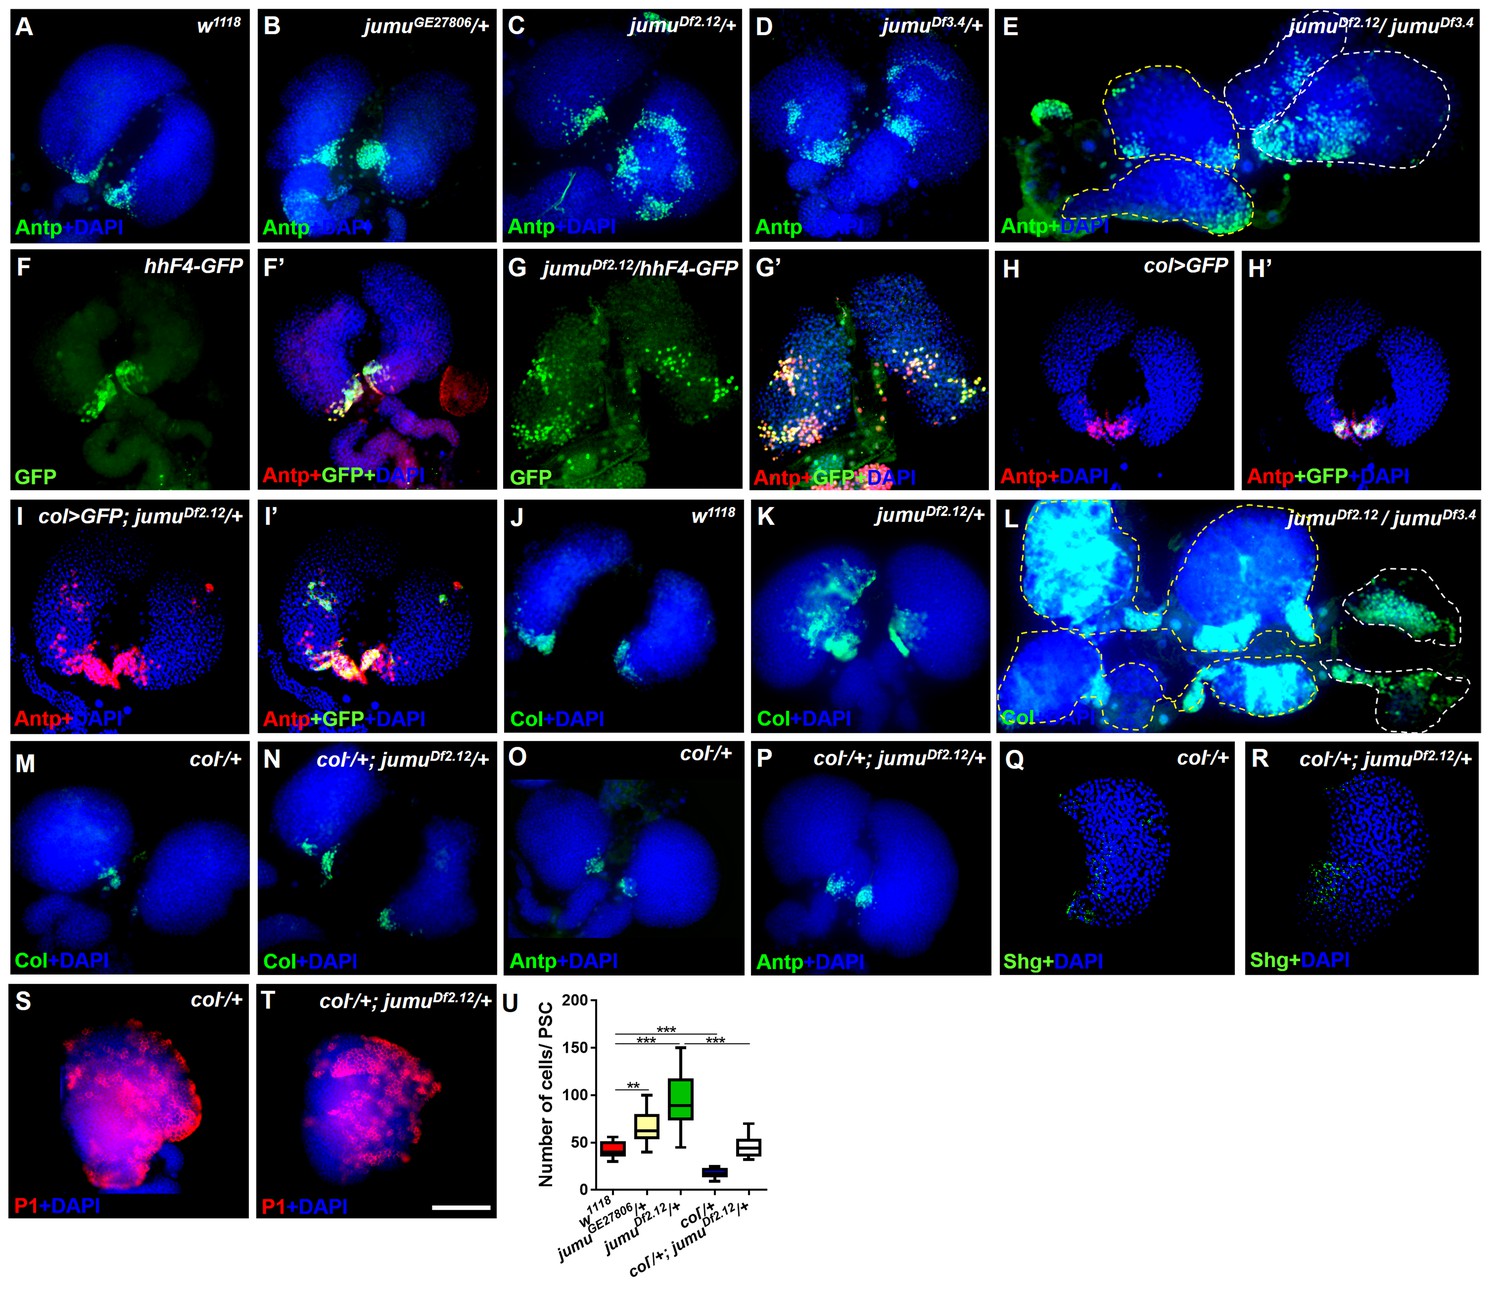
Loss of jumu causes expansion of the populations of Col+ PSC cells in the lymph gland.
(A–E) Immunostaining against the PSC cell marker Antp (green) shows an increased number and ectopic expansion of PSC cells in jumu-mutant lymph glands. (F–G’) Increased hhF4f-GFP-positive PSC cells (green) are located throughout the lymph glands of jumuDf2.12 third-instar larvae, and these cells are co-localized with Antp (red). (H–I’) Antp immunostaining (red) of the lymph glands of third-instar larvae expressing GFP under the control of col-Gal4 (green) shows col>GFP ectopic expression and co-localization with Antp in jumuDf2.12. (J–L) Immunostaining against Col (green) shows ectopic expansion of Col+ PSC cells in jumu-mutant lymph glands. (M–P) Deficiency in the col levels (col−/+) reduces the numbers of both Col+ and Antp+ PSC cells in jumuDf2.12. (Q–T) Deficiency in the col levels (col−/+) reduces Shg expression (green) (Q, R) and increases the differentiation of plasmatocytes (red) (S, T) in jumuDf2.12. (U) Quantification of the number of PSC cells (Antp+ cells) per lymph gland lobe. The data are presented through a box-and-whisker representation. **p<0.01 and ***p<0.001 (one-way ANOVA). Dashed white and yellow lines outline the edges of the primary and secondary lobes, respectively, in E and L. Scale bars: 100 μm.
Figure 3
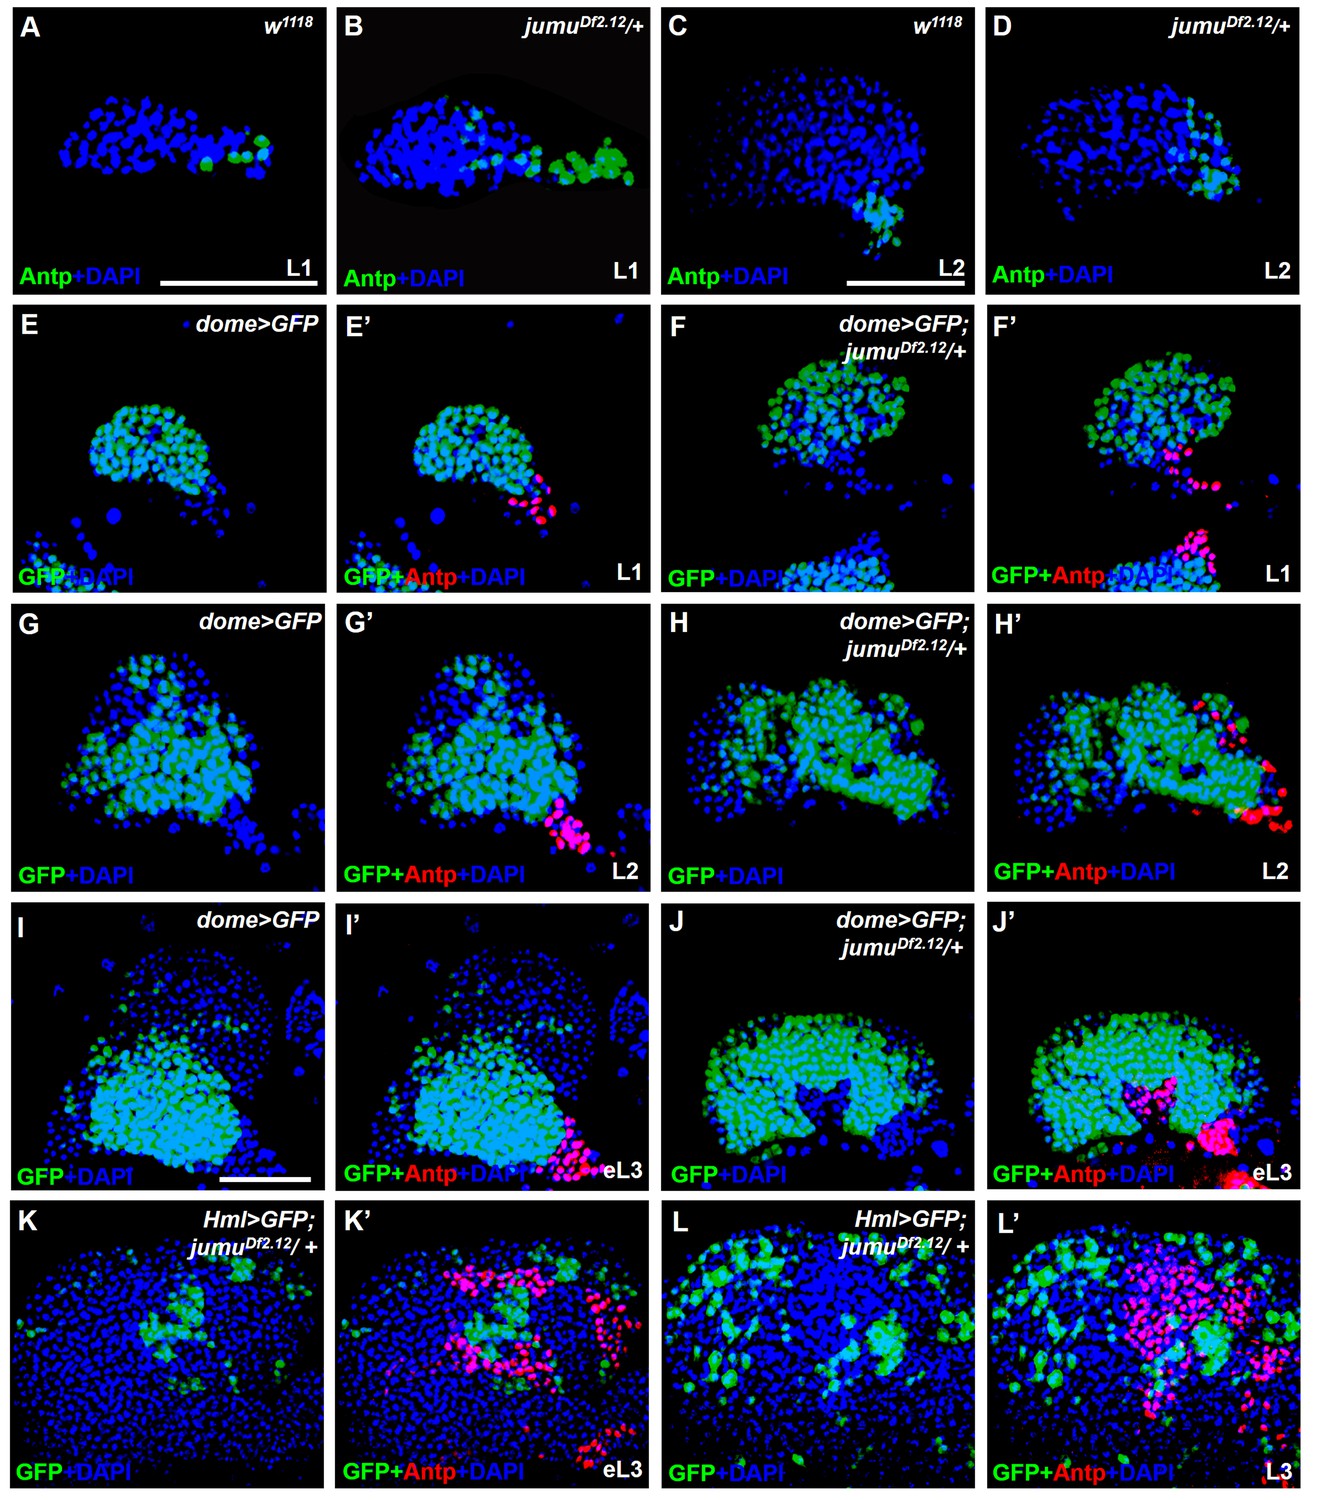
jumu is required for the prevention of ectopic PSC cells derived from the PSC domain during larval development.
(A–D) Immunostaining against the PSC cell marker Antp (green) in L1 larvae (A, B) and L2 larvae (C, D). (E–J’) The expanded Antp+ PSC cells (red) in jumuDf2.12 lymph glands show no co-localization with dome-GFP+ cells during the L1 larvae (E–F’), L2 larvae (G–H’) and early L3 (I–J’) stages. (K–L’) The expanded Antp+ PSC cells (red) in jumuDf2.12 lymph glands show no co-localization with Hml-GFP+ cells during the early L3 (K, K’) and L3 (L, L’) stages. Scale bars: 50 μm.
Figure 4
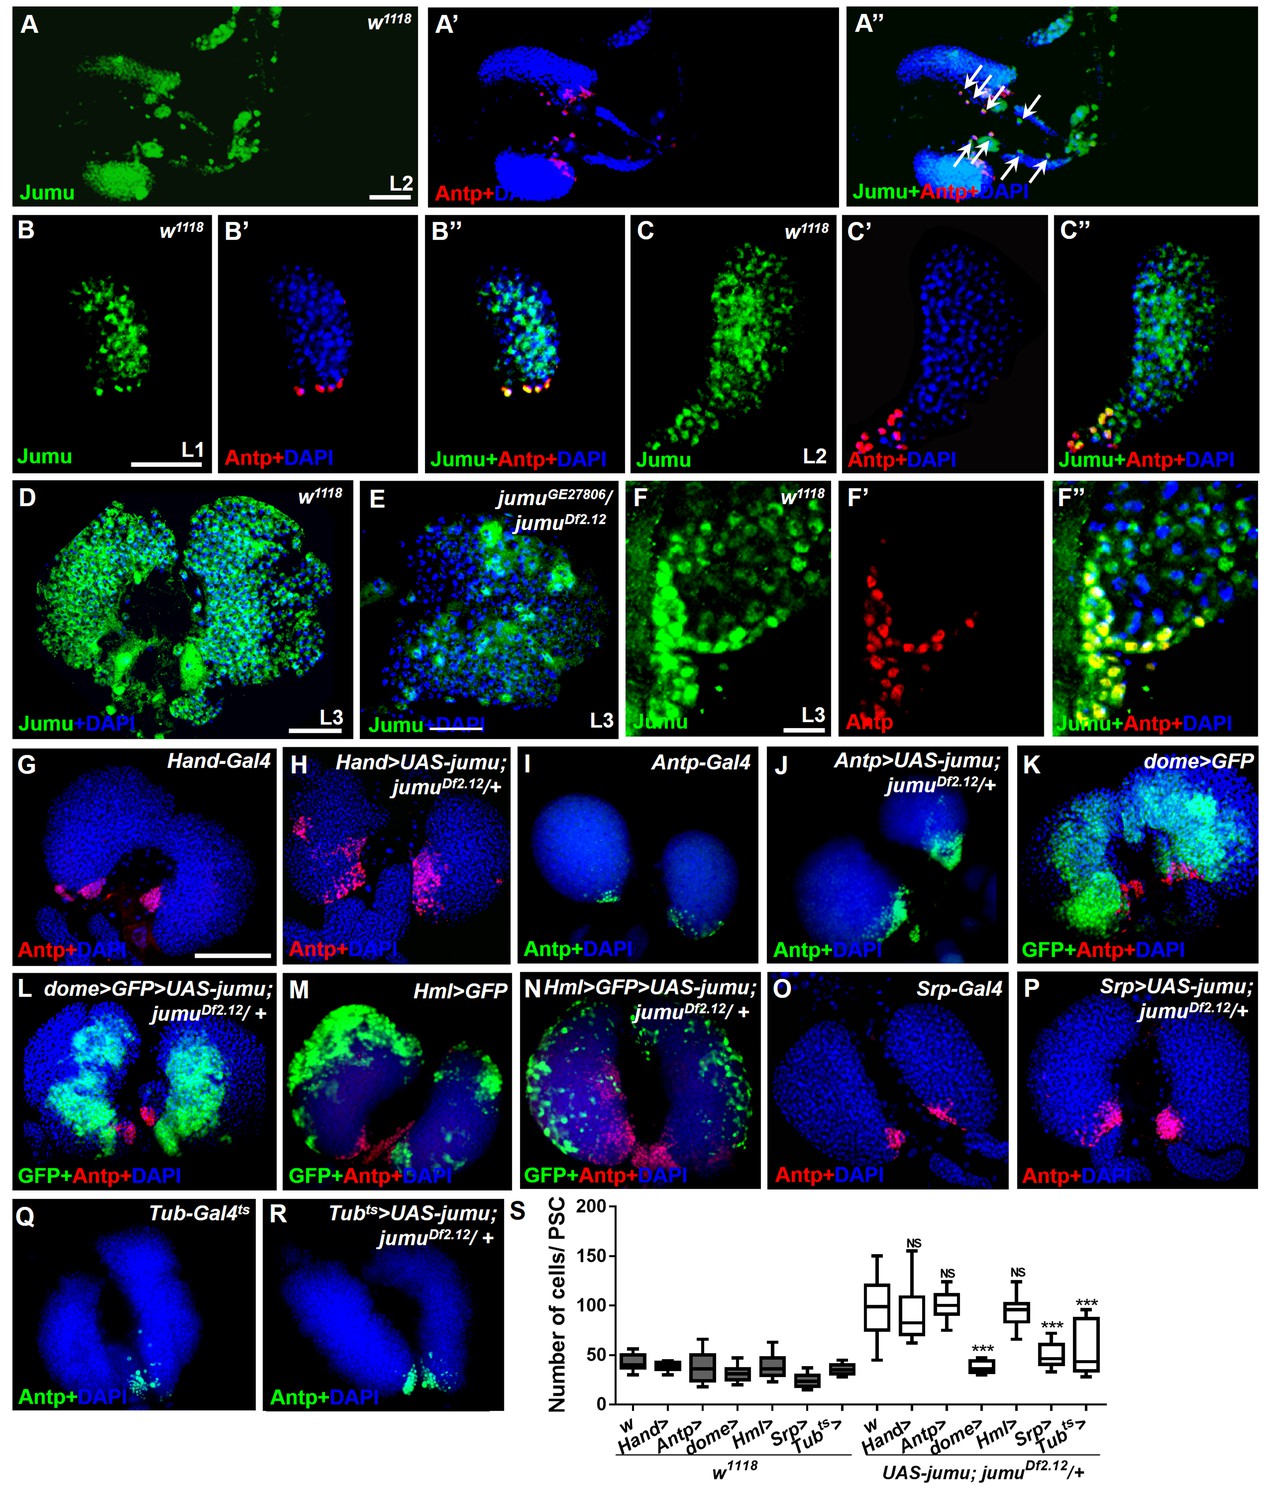
Expression of Jumu in prohemocytes is required for preventing the expansion of PSC cells.
(A–D) Immunostaining against Jumu protein shows that Jumu (green) is expressed throughout the w1118 lymph gland and shows co-localization with Antp (red) during the entire larval development process (A–D). Jumu is also expressed in cardiomyocytes and colocalizes with Antp in some cells (arrow) (A’’). (E) The expression of Jumu (green) is obviously decreased in jumu double heterozygotes mutants. (F–F’’) Jumu (green) is expressed at high levels in Antp+ PSC cells (red). (G–R) The overexpression of jumu using Hand-Gal4 (heart specific), Antp-Gal4 (PSC niche specific) and Hml-Gal4 (CZ specific) in jumuDf2.12 lymph glands cannot inhibit the expansion of PSC cells (red) (H, J, N); however, the use of dome-Gal4 (MZ specific), Srp-Gal4 (entire lymph gland) or Tub-Gal4ts (entire lymph gland) to overexpress jumu in jumuDf2.12 lymph glands effectively prevents the expansion of PSC cells (L, P, R). (S) Quantification of the number of PSC cells (Antp+ cells). The data are presented in a box-and-whisker representation. NS, not significant, ***p<0.001 (Student’s t test). Scale bars: 50 μm (A–E), 20 μm (F–F’’), and 100 μm (G–R).
Figure 5 with 1 supplement

Jumu in prohemocytes non-cell-autonomously regulates the expression of dMyc in the PSC.
(A–I) The knockdown of jumu in prohemocytes (TepIV>jumu RNAi) (C) or in the entire lymph gland (Srp>jumu RNAi, e33C>jumu RNAi) (F, I) causes the expansion of Antp+ PSC cells (red), and the overexpression of jumu in prohemocytes (TepIV>UAS-jumu) or in the entire lymph gland (Srp>UAS-jumu) does not affect the number of PSC cells (D, G). (J–L’) The knockdown of jumu in prohemocytes (TepIV>jumu RNAi) causes increased levels of dMyc (red) in PSC cells (green) (K, K’), but the dMyc level is not changed in TepIV>UAS-jumu (L, L’). (M–Q’) The expression of dMyc (red) is substantially increased in PSC cells (green) of the e33C>jumu RNAi (N, N’), jumuGE27806 (P, P’) and jumuDf2.12 mutants (Q, Q’). (R) Quantification of the number of PSC cells (Antp+ cells). (S) Quantification of the pixel intensity of dMyc (integrated density of the dMyc signal in the PSC divided by the PSC area). (T–V) The use of col-Gal4 to knock down dmyc can rescue the expanded PSC cells in jumuDf2.12. All of the quantification data are presented as box-and-whisker representations. NS, not significant, ***p<0.001 (Student’s t test). Dashed white lines outline the PSC in J-Q’. Scale bars: 50 μm.
Figure 5—figure supplement 1
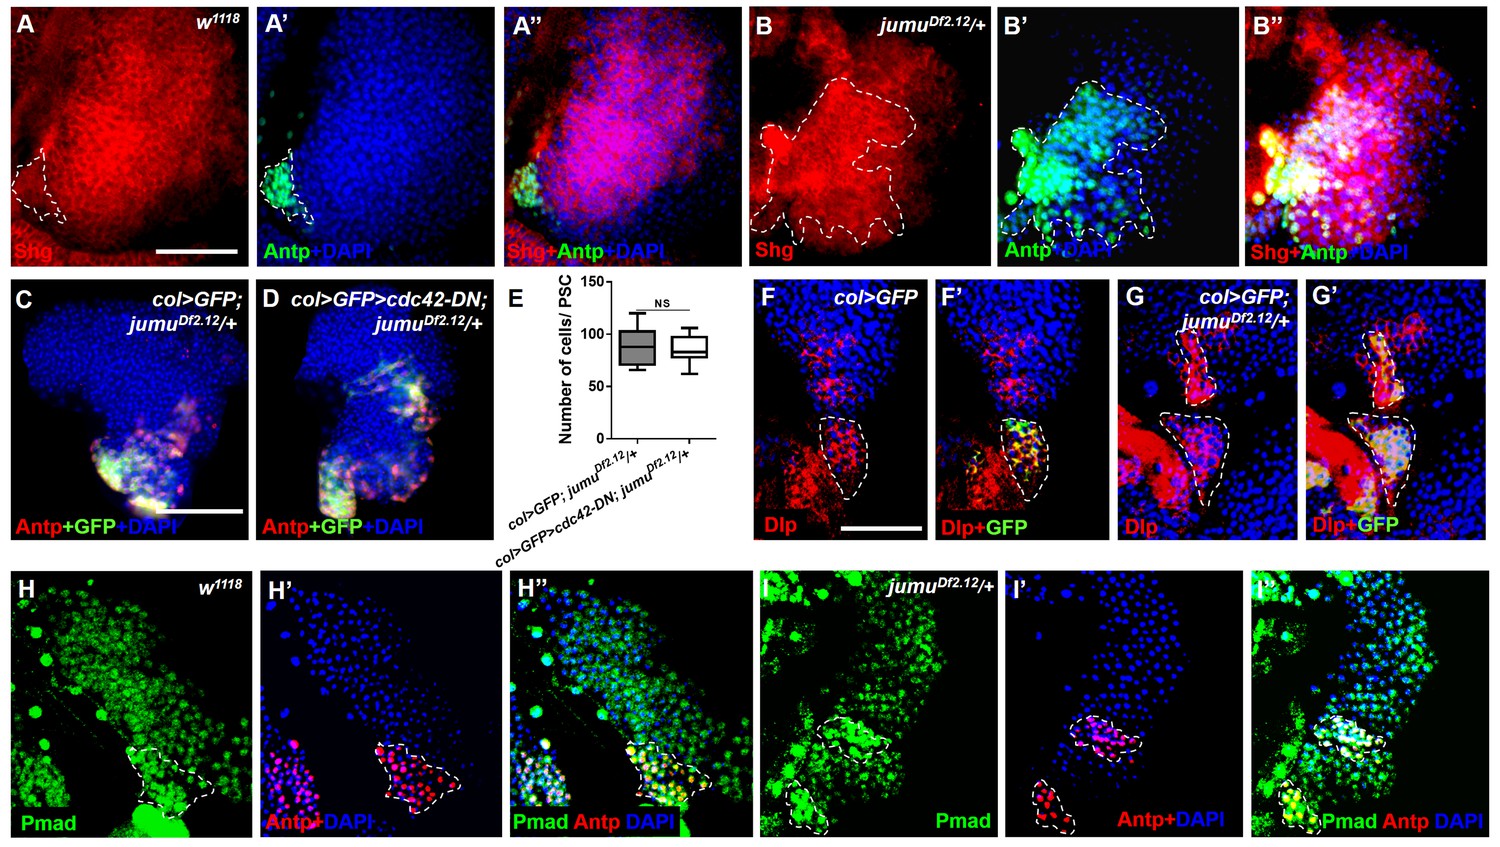
Jumu protein in the MZ controls PSC morphology through a Slit/Robo- and BMP/Dpp-independent mechanism.
(A–B”) Immunostaining against Shg shows that the expression of Shg (red) in Antp+ PSC cells of jumuDf2.12 is not reduced compared with the control. (C–E) The use of col-Gal4 to express cdc42-DN in jumuDf2.12 cannot rescue the number of PSC cells (Antp+ and col>GFP+ cells) and their expansion. (F–G’) Immunostaining for Dlp (red) shows that the expression of Dlp is not changed in the PSC (green, col>GFP) of jumuDf2.12 compared with the control. (H–I’) Immunostaining for p-Mad (green) and Antp (red) shows the co-localization of p-Mad with Antp in the PSC of the control and jumuDf2.12, and the expression of p-Mad is not reduced in the PSC of jumuDf2.12. All quantification data are presented as box-and-whisker representations. NS, not significant, **p<0.01, ***p<0.001 (Student’s t test). Dashed white lines outline the PSC. Scale bars: 50 μm (A–B”, F–I”) and 100 μm (C, D).
Figure 6 with 3 supplements
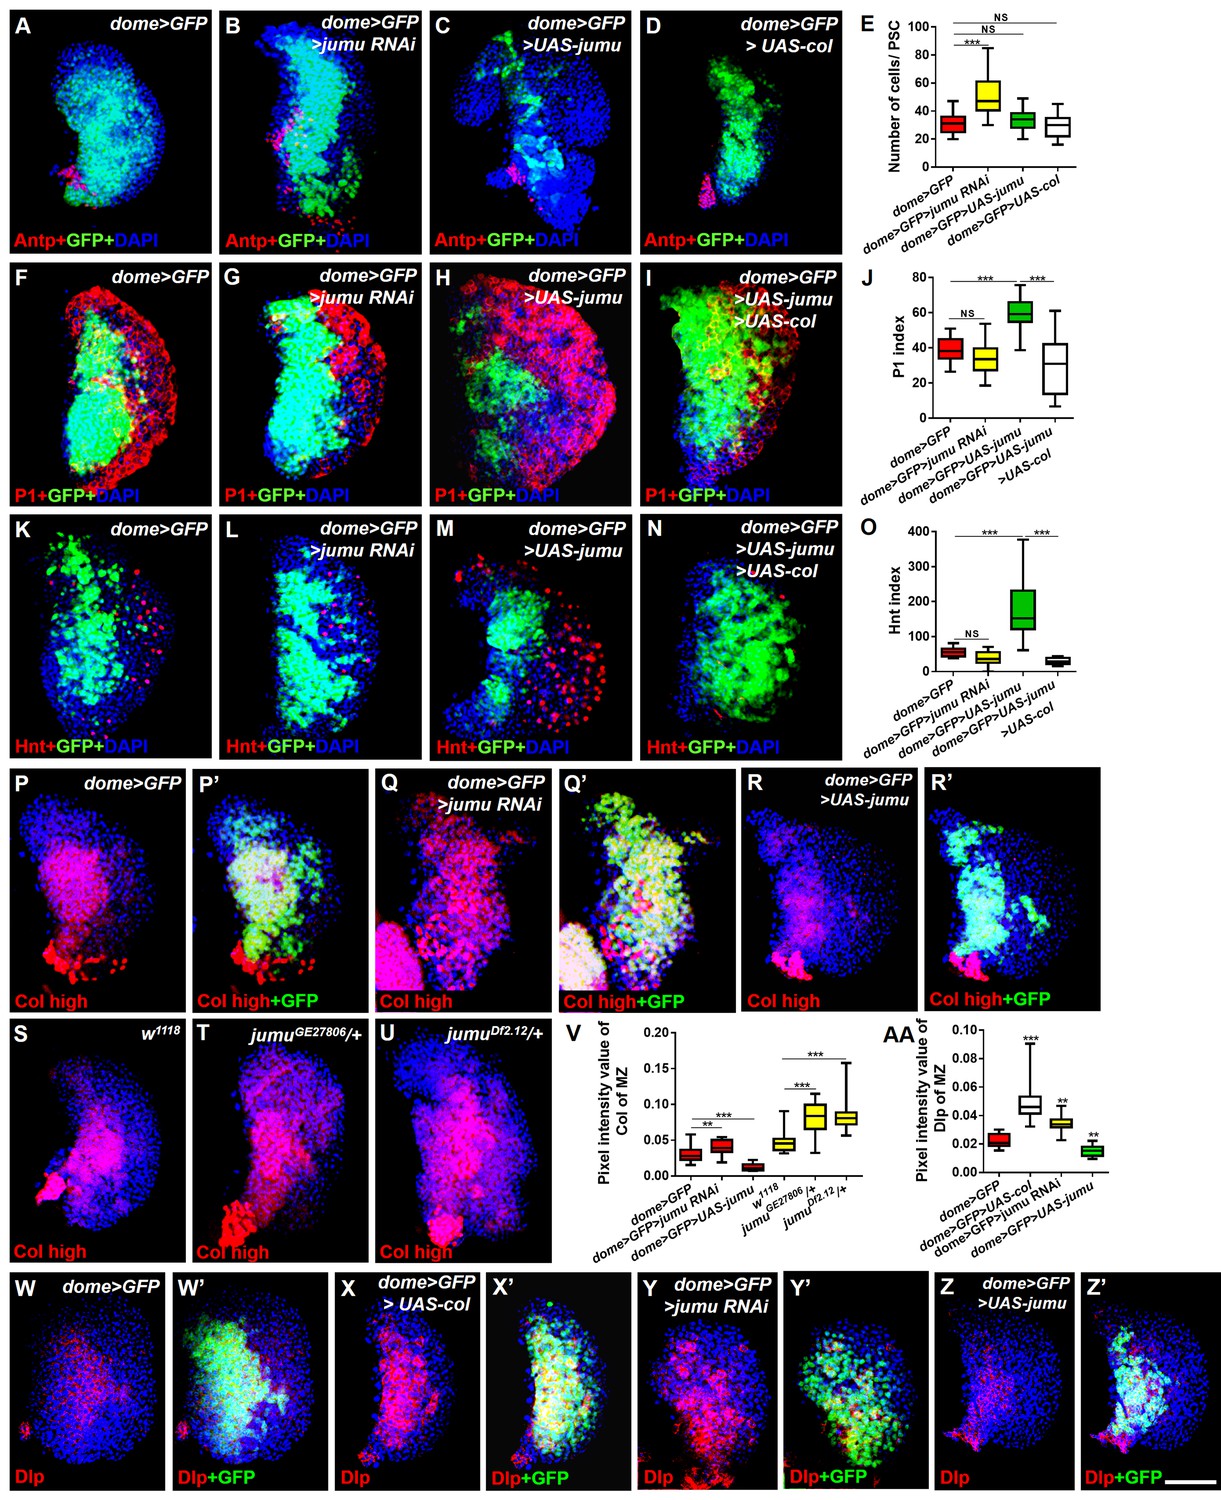
Jumu cell-autonomously regulates the differentiation of blood cell progenitors by maintaining low expression levels of Col of the MZ.
(A–D) Immunostaining against Antp shows that the knockdown of jumu in the MZ causes ectopic and increased PSC cells (B), but the overexpression of jumu or col in the MZ does not change the number of PSC cells (C, D). (E) Quantification of the number of PSC cells (Antp+ cells). The data are shown through a box-and-whisker representation. NS, not significant, ***p<0.001 (Student’s t test). (F–I, K–N) The knockdown of jumu in prohemocytes does not cause an obvious reduction in plasmatocyte and crystal cell differentiation compared with the control (G, L), whereas the forced expression of jumu in prohemocytes causes increases in plasmatocyte and crystal cell differentiation (H, M). The overexpression of col suppresses the increases in plasmatocyte and crystal cell numbers in dome>GFP>UAS-jumu (I, N). (J, O) Quantification of plasmatocyte and crystal cell indexes in primary lobes. The data are presented in a box-and-whisker representation. NS, not significant, ***p<0.001 (one-way ANOVA). (P–U) High-exposure visualization of Col immunostaining (red) shows that compared with the controls, the Col levels of the MZ are increased in dome>GFP>jumu RNAi (Q, Q’) and in heterozygous jumu mutants (T, U) but are reduced in dome>GFP>UAS-jumu (R, R’). (W–Z’) Dlp (red) is expressed in the MZ of dome>GFP and is increased in dome>GFP>UAS-col (X, X’) and dome>GFP>jumu RNAi (Y, Y’); however, Dlp expression is reduced in dome>GFP>UAS-jumu (Z, Z’). (V, AA) Quantification of the pixel intensity of Col or Dlp (integrated density of Col or Dlp signal in the MZ divided by the area of the primary lobe). The data are presented in a box-and-whisker representation. **p<0.01, ***p<0.001 (Student’s t test). Scale bars: 50 μm.
Figure 6—figure supplement 1
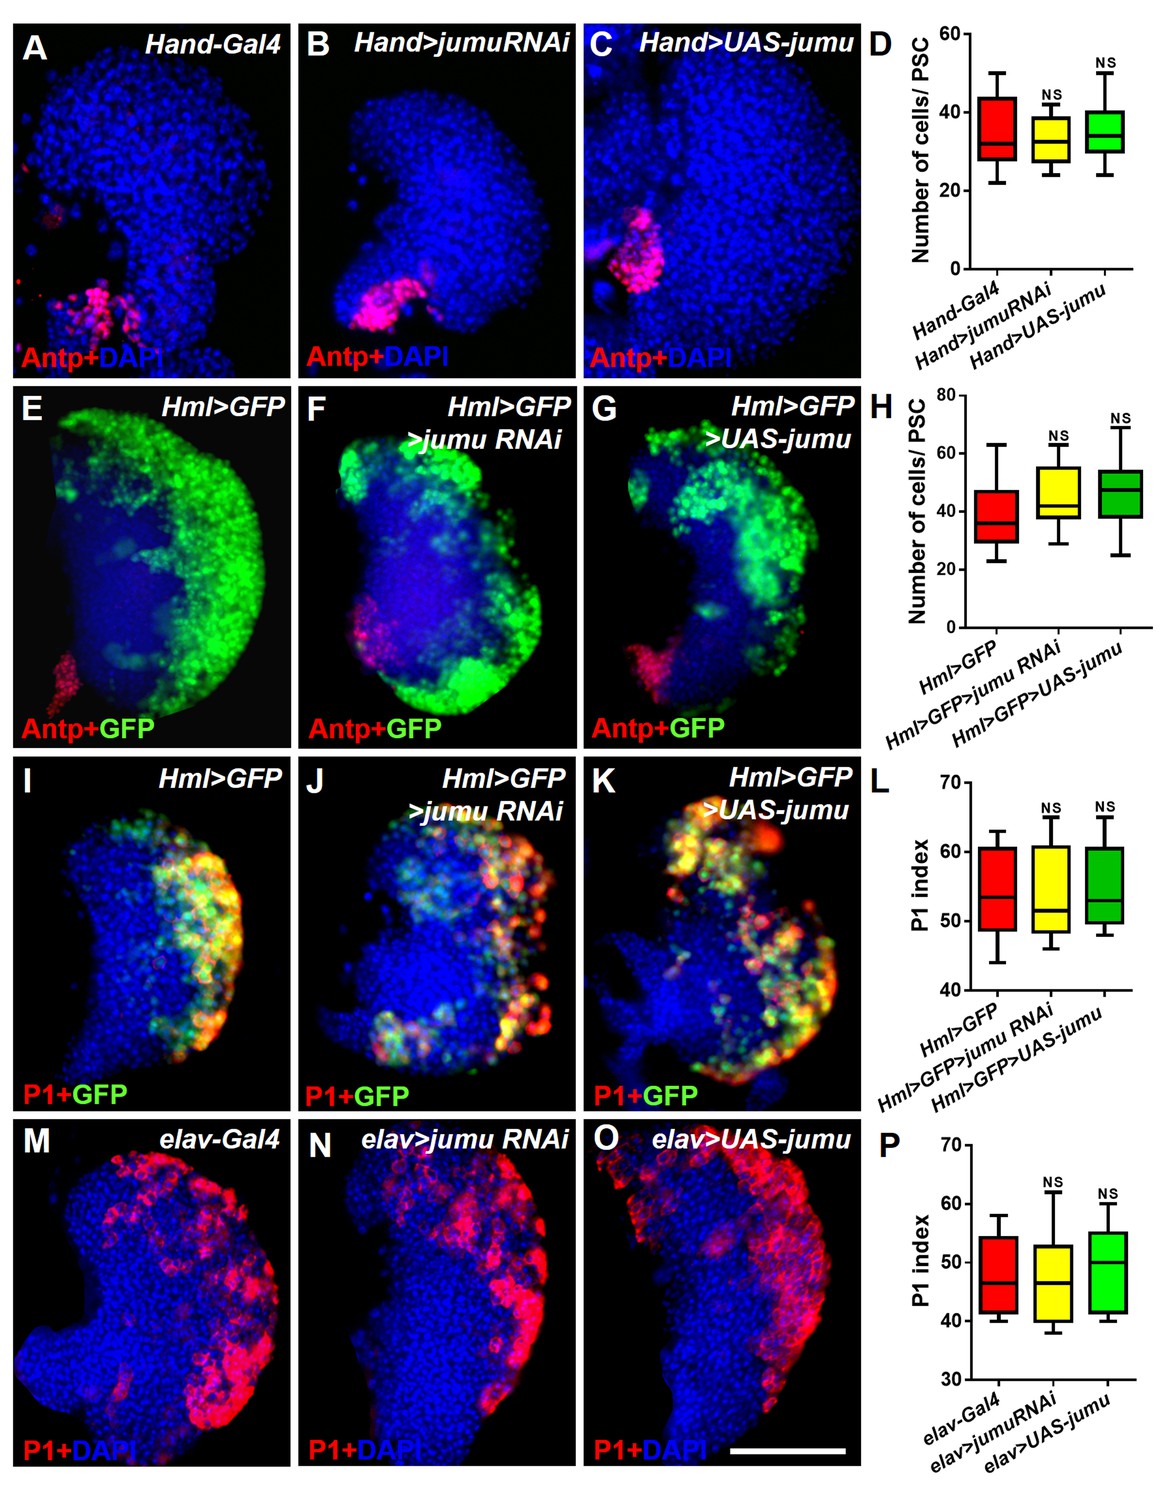
Jumu protein in the heart, the CZ of the lymph gland and the brain does not regulate the number of PSC cells or prohemocyte differentiation.
(A–H) Immunostaining against Antp (red) and quantification of PSC cells show that the knockdown or overexpression of jumu under the control of Hand-Gal4 or Hml-Gal4 does not change the number of PSC cells. (I–P) The knockdown or overexpression of jumu using Hml-Gal4 or elav-Gal4 does not affect P1+ (red) or Hml>GFP+ cell (green) differentiation. The quantification data are presented as box-and-whisker representations. NS, not significant (Student’s t test). Scale bars: 100 μm.
Figure 6—figure supplement 2
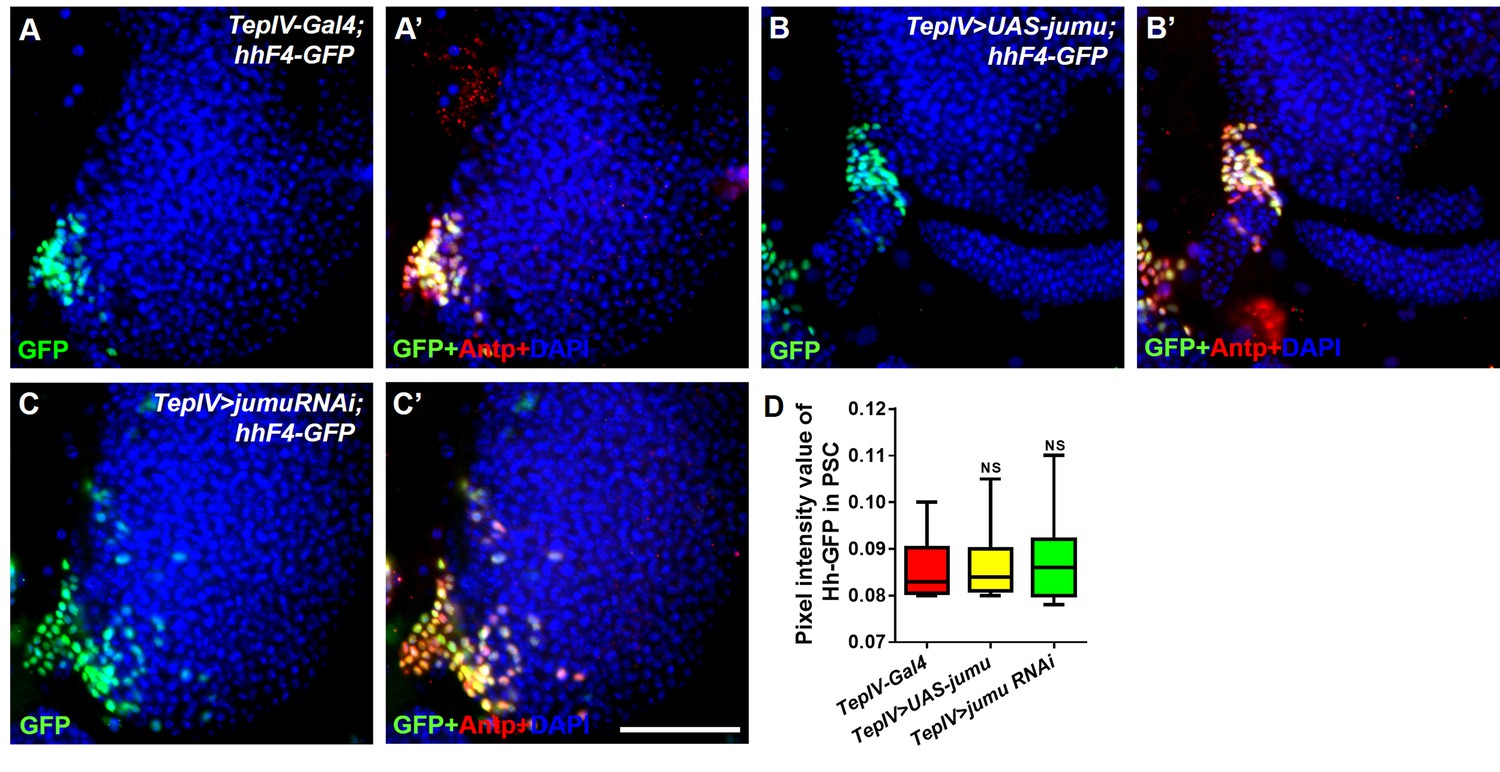
Changes in the expression levels of jumu in the MZ do not affect the expression of Hh in the PSC.
(A–C’) Immunostaining for Antp (red) and Hh-GFP (green) shows that the overexpression or knockdown of jumu in the MZ does not affect the expression of Hh in the PSC. Scale bars: 100 μm. (D) Quantification of the pixel intensity of Hh-GFP (integrated density of the Hh-GFP signal in the PSC divided by the area of the PSC). The data are presented in a box-and-whisker representation. NS, not significant (Student’s t test).
Figure 6—figure supplement 3
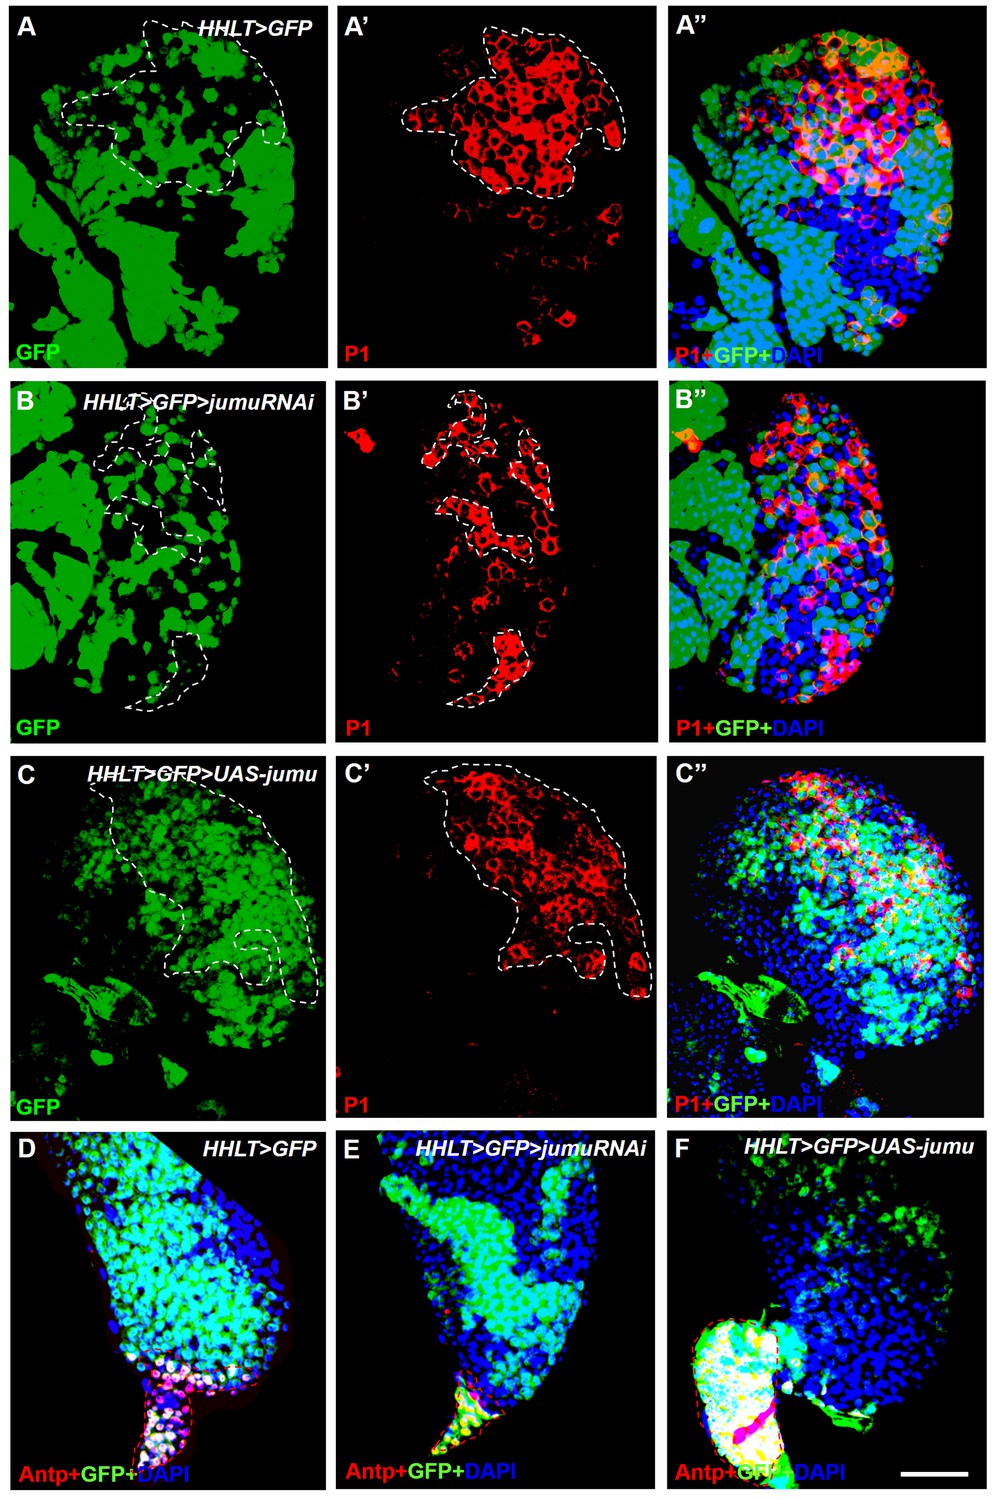
Jumu cell-autonomously regulates the differentiation of blood cell progenitors and PSC proliferation.
(A–F) HHLT (hand-gal4, hml-gal4, UAS-2xEGFP, UAS-FLP; A5C-FRT-STOP-FRT-gal4) was used to clonally overexpress or knock down jumu in the lymph gland. Clonal cells are marked with GFP (green). (A–A’’) P1+ differentiated plasmatocytes (red) are only partly colocalized with the wild-type clones (GFP+) in peripheral CZ regions. (B–B’’) Clonally knocking down jumu in the lymph gland autonomously inhibits hemocyte differentiation within clonal cells, and most clones do not express P1. (C–C’’) Most P1+ cells are expressed in clonal cells overexpressing jumu (GFP+) in the lymph gland. (D–F) Immunostaining against Antp (red) shows that clonally knocking down jumu in PSC cells autonomously reduces the PSC cell number (E) and that clonally overexpressing jumu in the PSC autonomously increases the PSC cell number (F). Dashed white and red lines outline the edges of P1+ plasmatocytes and Antp+ PSC cells, respectively, in all images. Scale bars: 50 μm.
Figure 7 with 3 supplements
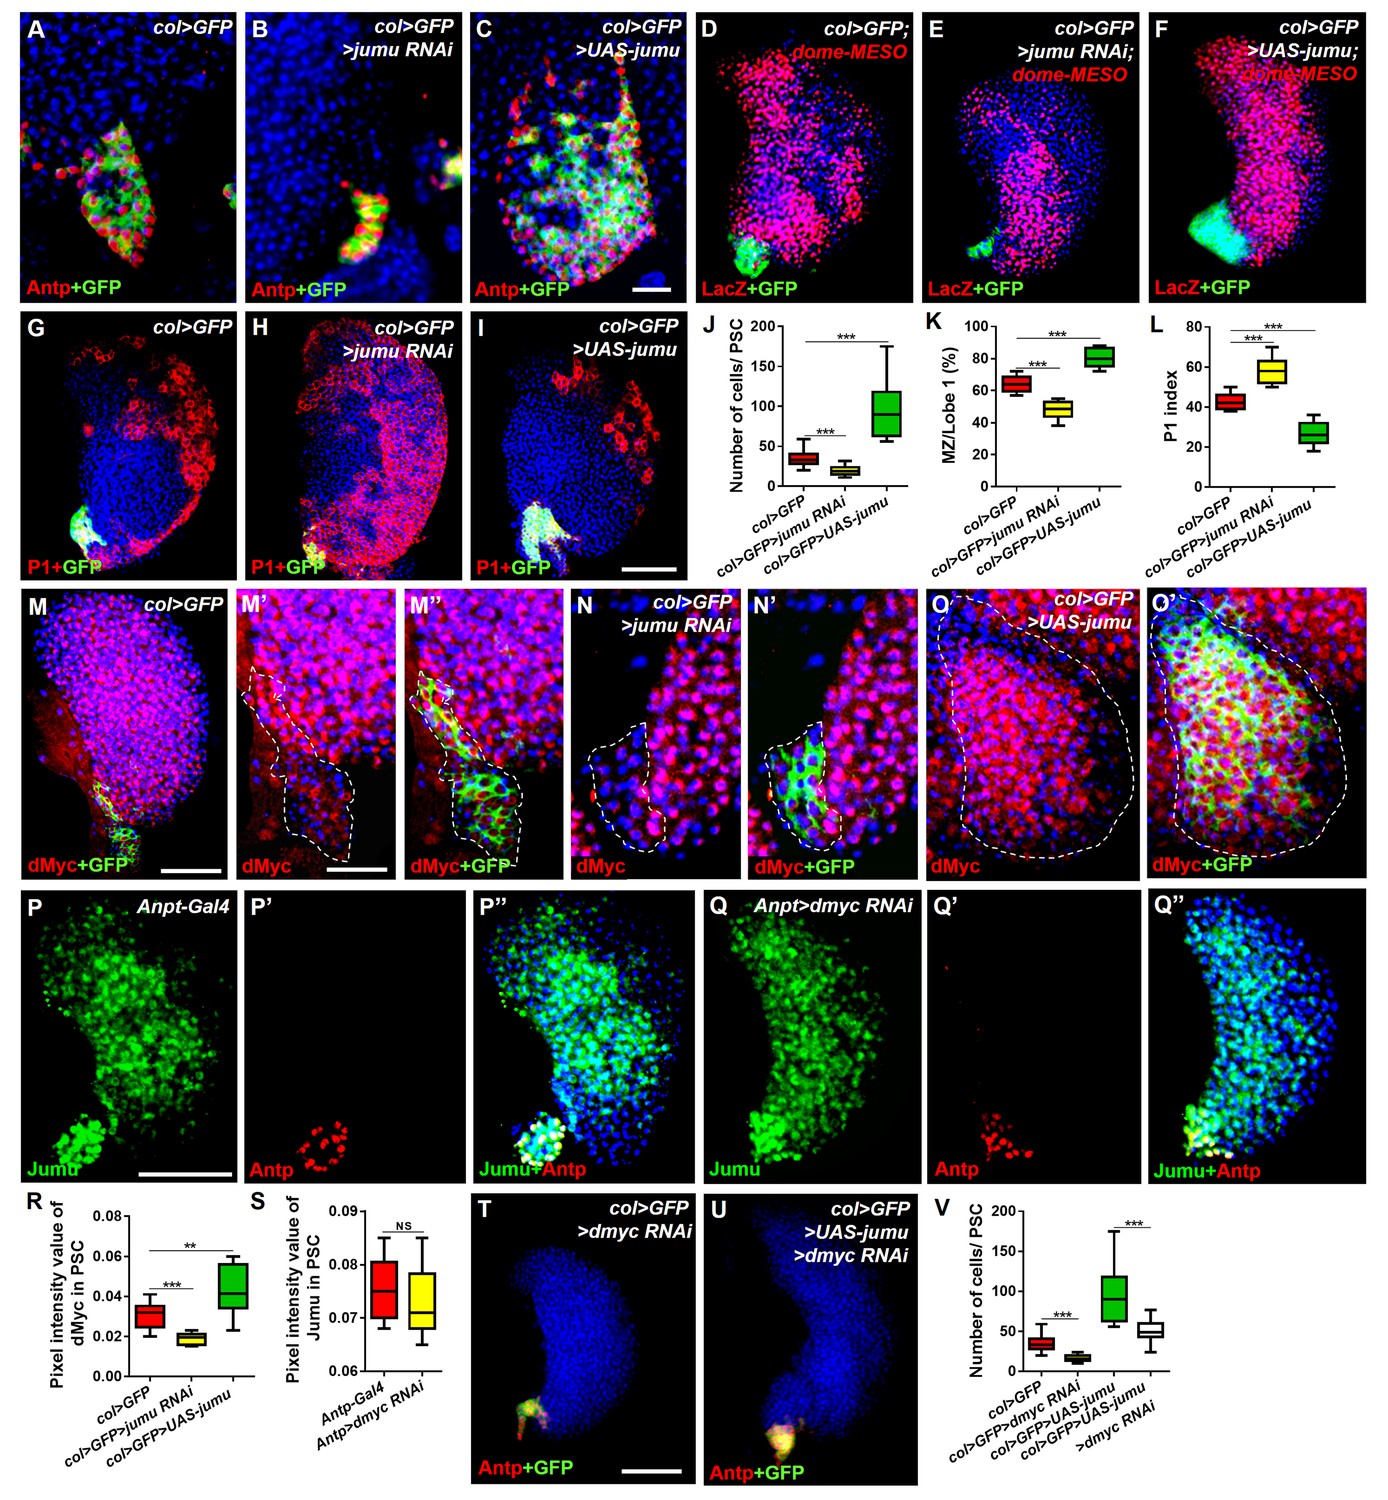
Jumu cell-autonomously controls the size of the PSC by regulating the expression of dMyc and indirectly affects prohemocyte differentiation.
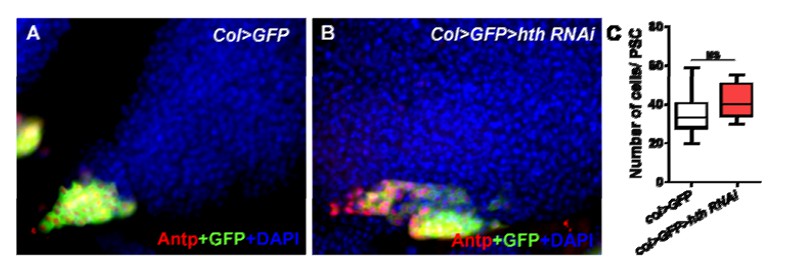
(A–C) Immunostaining against Antp (red) shows that jumu RNAi in the PSC (col>GFP>jumu RNAi) causes a reduction in the number of PSC cells (B), but the overexpression of jumu in the PSC (col>GFP>UAS-jumu) can substantially increase the size and cell number of the PSC niche (anti-Antp, red) (C). (D–F) The use of dome-MESO (LacZ) (red), which serves as a marker of prohemocytes, shows a reduction of the MZ in col>GFP>jumu RNAi (E) and an expansion of the MZ in col>GFP>UAS-jumu (F). (G–I) Plasmatocyte differentiation (anti-P1, red) is increased in col>GFP>jumu RNAi and reduced in col>GFP>UAS-jumu. (J) Quantification of the number of PSC cells (Antp+ cells). (K) Quantification of the proportion of the primary lobes occupied by prohemocytes (dome-MESO+ MZ area divided by the primary lobe area). (L) Quantification of the plasmatocyte index in primary lobes. (M–O’) Compared with the control (col>GFP), the expression of dMyc (red) is reduced in the PSC of col>GFP>jumu RNAi (N, N’) and significantly increased in col>GFP>UAS-jumu (O, O’). Dashed white lines outline the PSC. (P–Q’’) The levels of Jumu (green) are not decreased in the PSC cells (red) of Antp>dmyc RNAi. (R, S) Quantification of the pixel intensity of dMyc or Jumu (integrated density of dMyc or Jumu signal in the PSC divided by the PSC area). (T, U) The knockdown of dmyc in the PSC (col>GFP>dmyc RNAi) reduces the number of PSC cells (anti-Antp, red) (T) and suppresses the increase in PSC cells observed in col>GFP>UAS-jumu (U). (V) Quantification of the number of PSC cells (Antp+ cells). The quantification data are presented as box-and-whisker representations. NS, not significant. **p<0.01 and ***p<0.001 (Student’s t test) in J-L, R and S; ***p<0.001 (one-way ANOVA) in V. Scale bars: 20 μm (A–C, M’–O’) and 50 μm (D–I, M, P–Q’’, T, U).
Figure 7—figure supplement 1

Jumu controls the size of the PSC through Col- and Dpp-independent mechanisms.
(A–C) Immunostaining for Antp (red) shows that the overexpression of jumu in the PSC (Antp>UAS-jumu) can increase the number of PSC cells. (D–F) The average pixel intensity values of the Col signal are not reduced in the PSC cells of Antp>UAS-jumu larvae. (G–H’) Hh (green) is co-localized with Antp (red) in the PSC of the controls (G, G’) and is not decreased in the increased Antp+ PSC cells of Antp>UAS-jumu larvae (H, H’). (I–K’) Immunostaining for Dlp (red) shows that Dlp is expressed in the PSC (green) of col>GFP (I, I’). Dlp disappears completely in the PSC of col>GFP>col RNAi larvae but is not significantly altered in the PSC of col>GFP>UAS-jumu (J–K’). Dashed white lines outline the PSC in G-K’. (L–M’) Immunostaining for p-Mad (green) and Antp (red) shows the co-localization of p-Mad with Antp in the PSC of the control and Antp>UAS-jumu, and the expression of p-Mad is not reduced in the PSC of Antp>UAS-jumu. The data are presented as box-and-whisker representations in C and F. NS, not significant; ***p<0.001 (Student’s t test). Scale bars: 20 μm (A, B, G–K’, L–M”) and 50 μm (D, E).
Figure 7—figure supplement 2
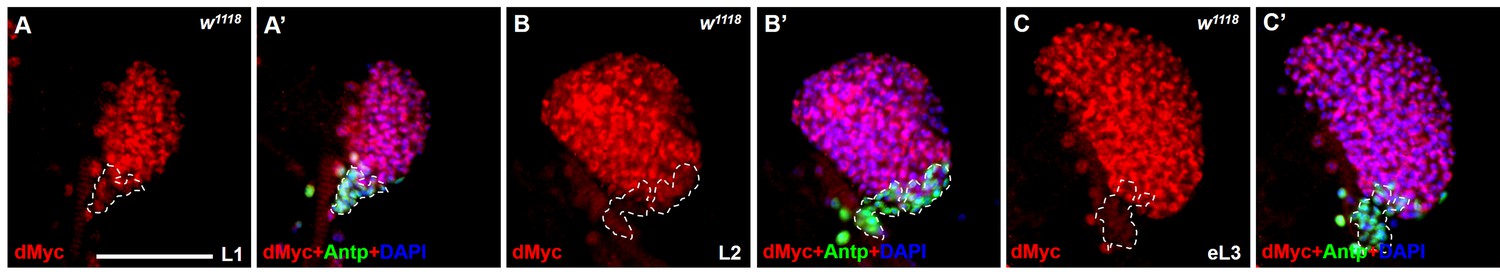
Expression pattern of dMyc in the lymph gland during larval development.
(A–C’) Immunostaining for dMyc (red) and Antp (green) show that the expression pattern of dMyc in lymph gland does not change throughout larval development: L1 larvae (A, A’), L2 larvae (B, B’), early L3 larvae (C,C’). Scale bars: 50 μm.
Figure 7—figure supplement 3
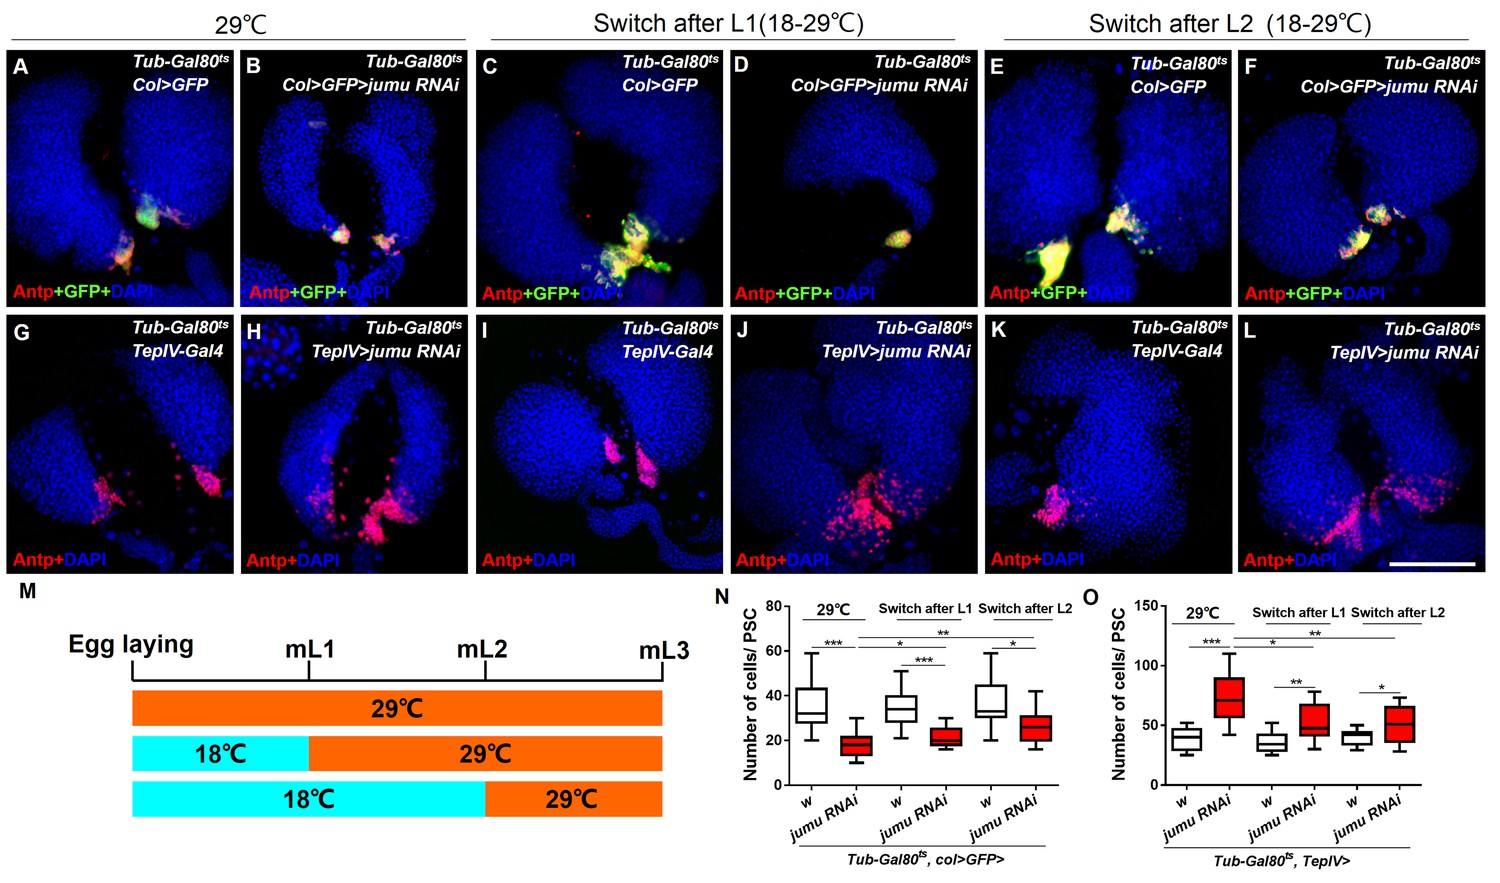
Spatial-temporal regulation of Jumu on PSC morphology during larval development.
(A–L) The knockdown of jumu at different time points during larval development was performed using the Gal80ts/Gal4 expression system. The temperature shift (18–29°C) was performed at different time points, and the lymph glands were detected in L3. (A–F) Immunostaining against Antp (red) shows that the knock down pf jumu in PSC from embryogenesis, the L1 larval stage and the L2 larval stage results in reduction in the PSC cell number to different degree. (G–L) Immunostaining against Antp (red) shows that the knock down jumu in the MZ from embryogenesis, the L1 larval stage and the L2 larval stage increase the number and expansion phenotype of PSC cells to different degrees. (M) Schematic representation showing the temperature shift at different time points. (N, O) Quantification of the number of PSC cells (Antp+ cells). The data are presented in a box-and-whisker representation. *p<0.1, **p<0.01, ***p<0.001 (Student’s t test). Scale bars: 100 μm.
Figure 8
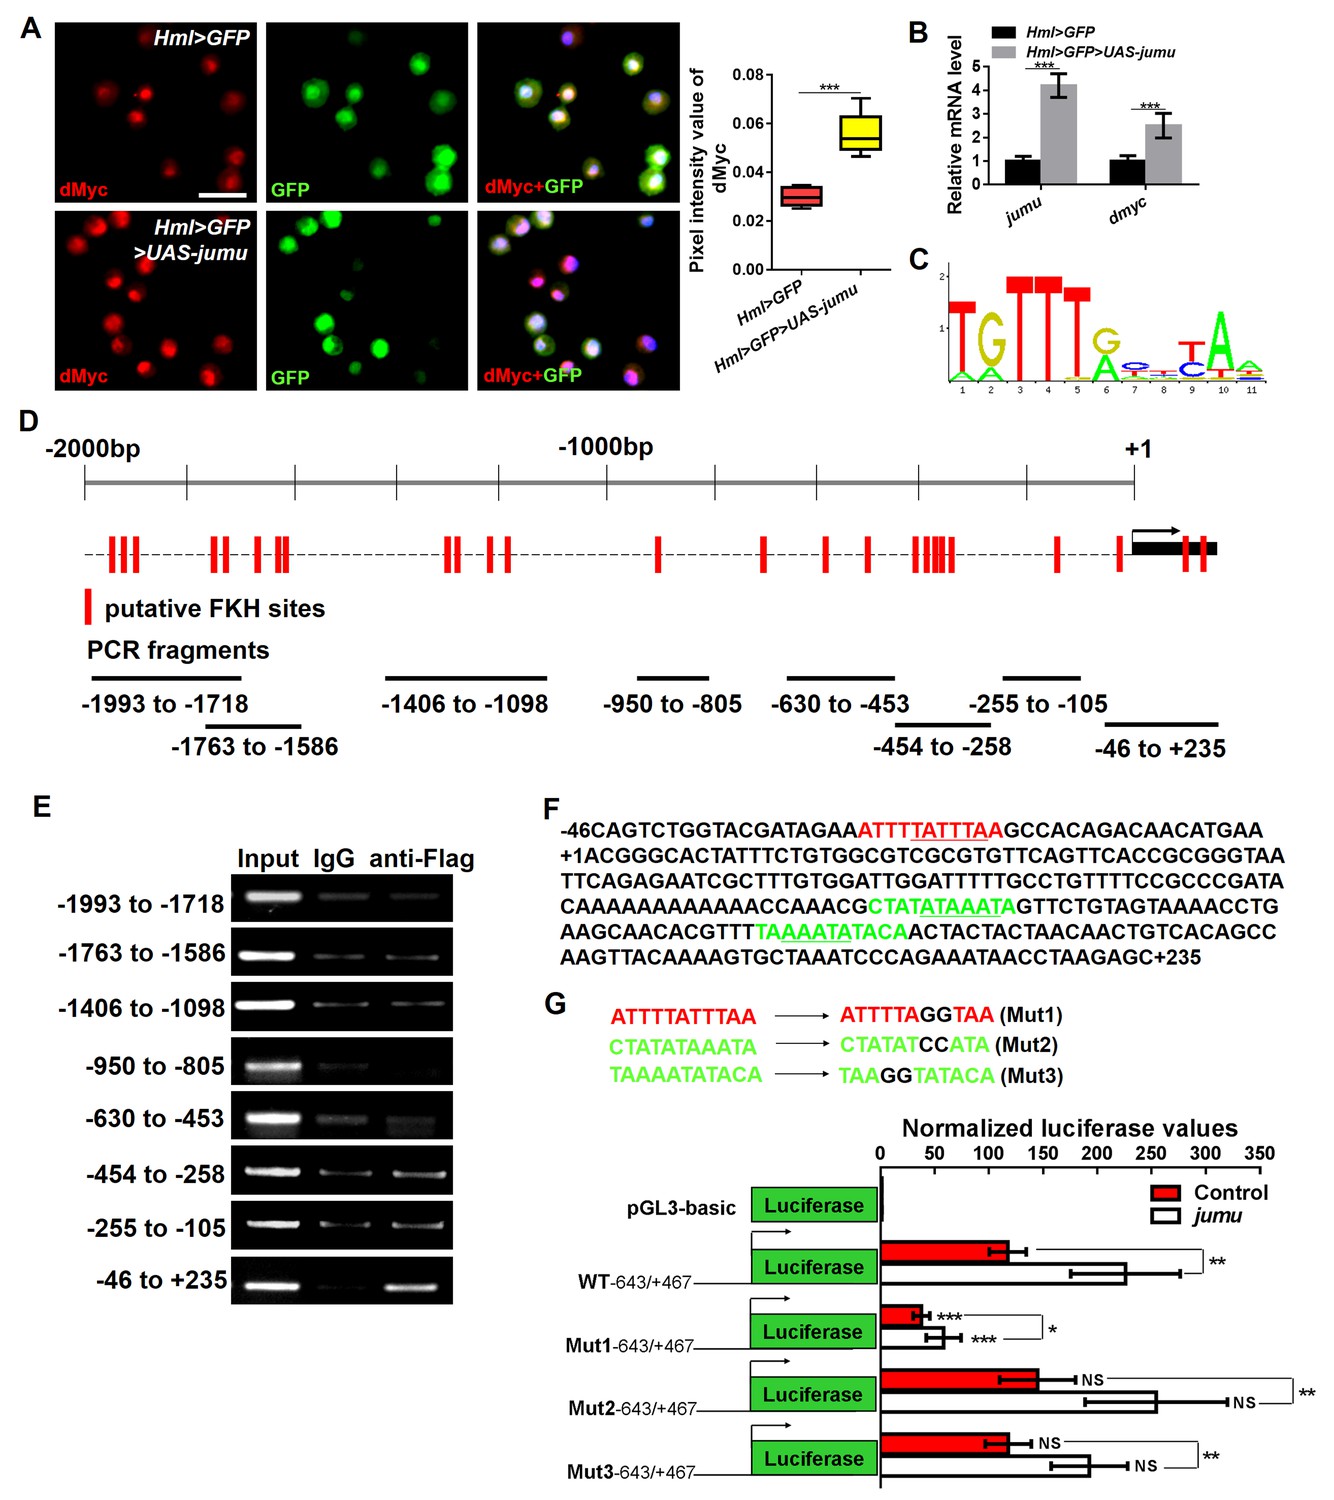
Jumu regulates the expression of dmyc by binding to its FKH-binding site.
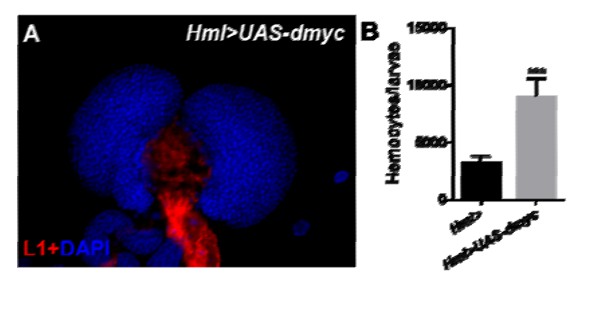
(A, B) The overexpression of jumu in circulating hemocytes (Hml>GFP>UAS-jumu) up-regulates dmyc expression at the translation (A) and transcription levels (B). ***p<0.001 (Student’s t test). Scale bars: 20 μm in A. (C) Optimal FKH DNA-binding consensus motif obtained from the JASPAR database. (D) Schematic of the dmyc gene promoter locus showing putative FKH-binding sites (red lines) and DNA fragments from ChIP PCR amplification (black lines). (E) S2 cells stably expressing Flag-jumu were used for ChIP experiments to screen for the presence of endogenous Jumu on the dmyc promoter region. The enrichment of target DNA fragments relative to IgG is shown on an agarose gel. ChIP-PCR demonstrates that Jumu can bind to the dmyc gene in the region from −46 bp to +235 bp. (F) The analysis of the dmyc gene region from −46 bp to +235 bp contains one putative FKH site (red) inside dmyc promoter region and two putative FKH sites (green) inside the 5’UTR of dmyc. (G) Three putative FKH-binding sites (in −46 bp to +235 bp of the dmyc gene region) were mutagenized. The quantification of the results from a dual-luciferase reporter assay of S2 cells transfected with pMK33-jumu (white bars) or empty pMK33 vector (red bars) shows the activation of the wild-type (WT) dmyc promoter and that the mutagenesis of the Mut1 site, but not of the Mut2 or Mut3 sites, prevents activation of the dmyc promoter. The normalized luciferase values are the ratios of firefly-to-Renilla luciferase. The data are presented as the means ± S.E.M. NS, not significant, *p<0.1, **p<0.01, ***p<0.001 (Student’s t test).
Figure 9 with 2 supplements
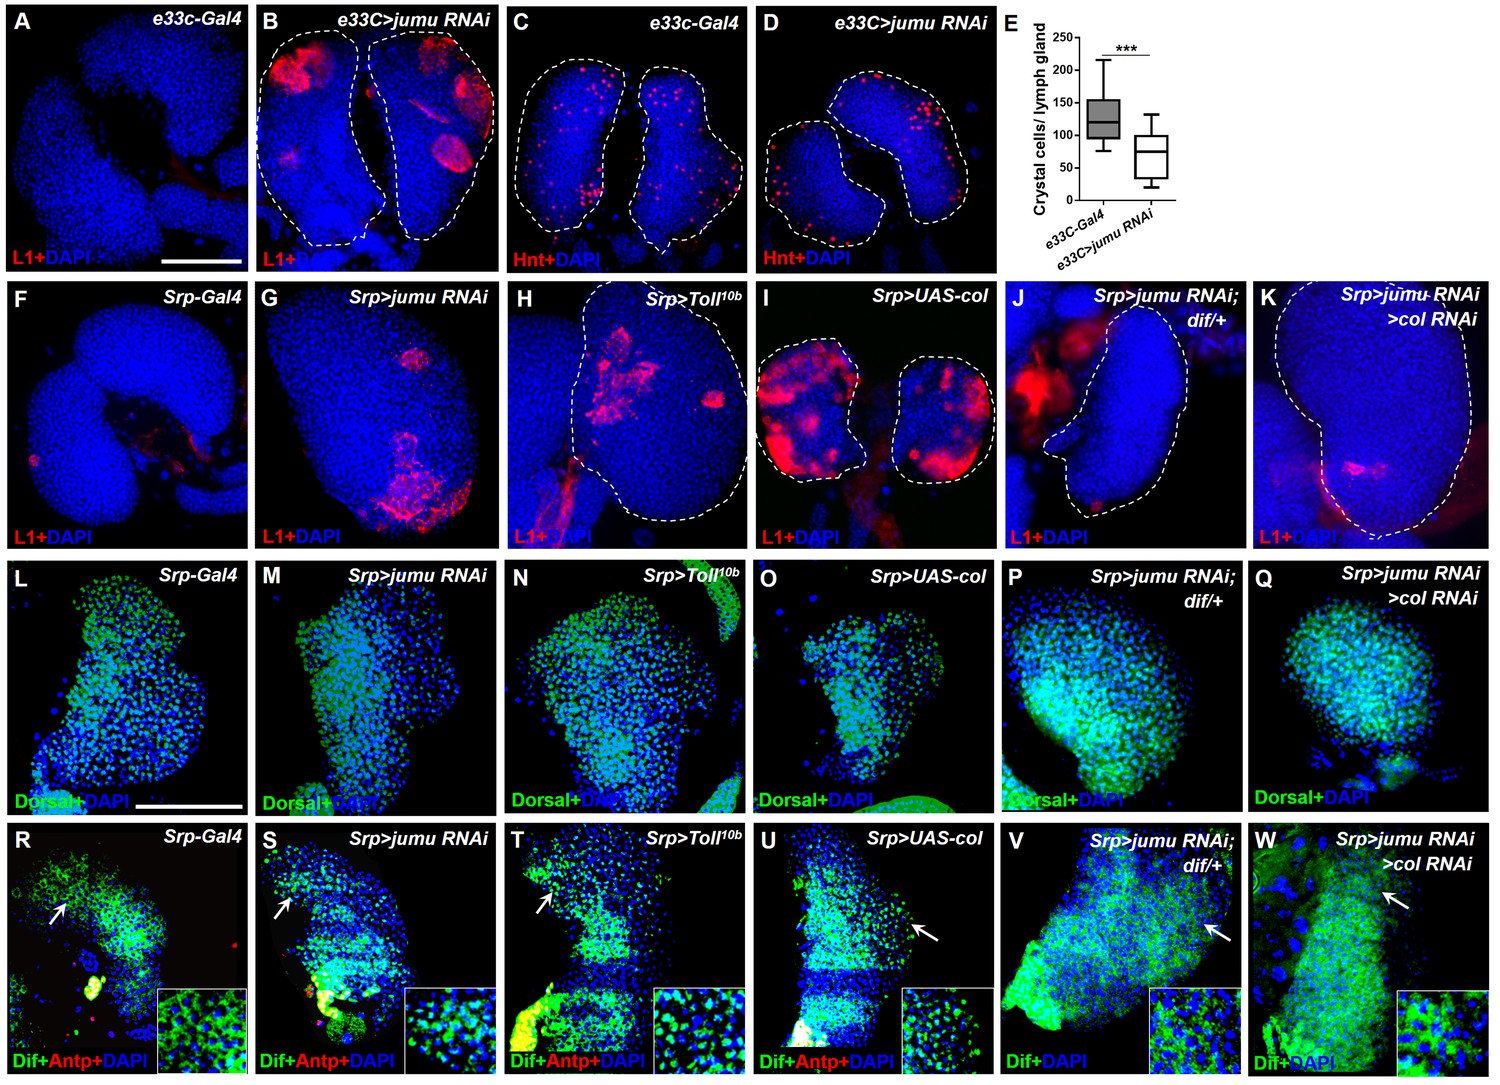
Loss of jumu in the entire lymph gland induces the generation of lamellocytes through the activation of Toll signaling.
(A–D) Immunostaining for L1 (red) and Hnt (red) shows that the knock down of jumu in the entire lymph gland increases the number of lamellocytes (B) and reduces the number of crystal cells (D). (E) Quantification of the number of PSC cells (Antp+ cells). The data are presented in a box-and-whisker representation. ***p<0.001 (Student’s t test). (F–K) Immunostaining for L1 (red) shows that only less than 20% of lymph glands of the Srp-Gal4 control display a few lamellocytes (n = 24) (F), but numerous lamellocytes are generated in more than 60% of the lymph glands of Srp>jumu RNAi (n = 36) (G) and in more than 80% of the lymph glands of Srp>Toll10b (n = 30) (H) and Srp>UAS-col (n = 26) (I). The deficiency of dif and col in Srp>jumu RNAi clearly reduces the number of lamellocytes, and only less than 10% (n = 36) (J) and 20% of the lymph glands (n = 32) (K) generated a few lamellocytes, respectively. (L–Q) Immunostaining for Dorsal (green) shows that Dorsal is enriched in nuclei throughout the lymph glands of the control animals (L), and the expression and localization of Dorsal is not changed in the crosses (M–Q). (R–W) Immunostaining for Dif (green) shows that Dif is expressed in the cytoplasm of cells throughout the lymph glands of the control animals (R) but shows nuclear enrichment mainly in the CZ and partly in the MZ of Srp>jumu RNAi (S), Srp>Toll10b (T) and Srp>UAS-col (U). The deficiency of dif (V) and col (W) in Srp>jumu RNAi clearly reduces the nuclear enrichment of Dif. The regions indicated by the arrows are magnified. Dashed white lines outline the edges of the primary lobes. Scale bars: 100 μm.
Figure 9—figure supplement 1
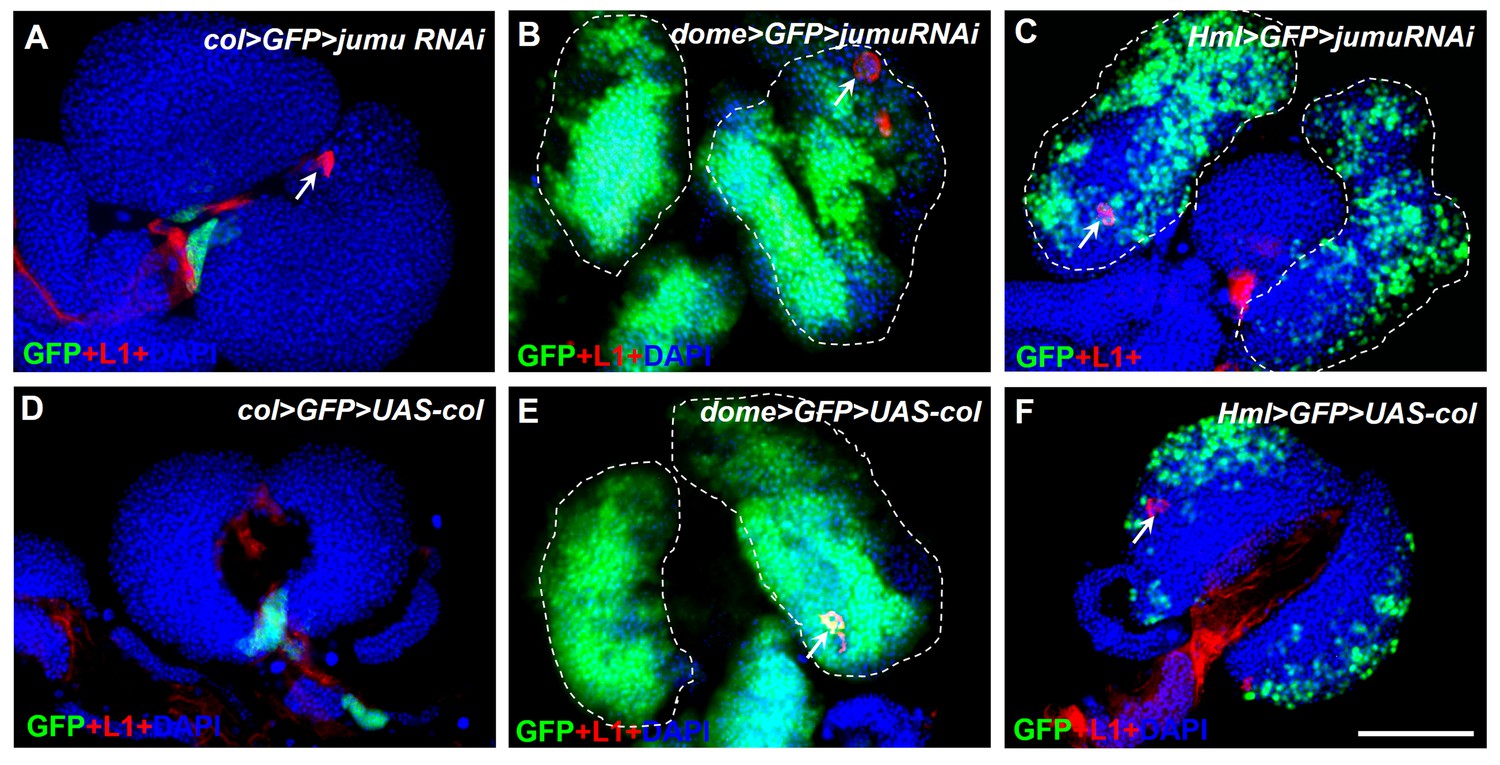
jumu knockdown or col overexpression in different specific zones of the lymph gland does not affect lamellocyte differentiation.
(A–F) Immunostaining for L1 (red) shows that only a few lamellocytes are generated in less than 20% of the lymph gland in col>GFP>jumu RNAi, dome>GFP>jumuRNAi and Hml>GFP>jumuRNAi (n > 30) and in less than 10% of the lymph gland in col>GFP>UAS-col, dome>GFP>UAS-col and Hml>GFP>UAS-col (n > 30). Scale bars: 100 μm.
Figure 9—figure supplement 2
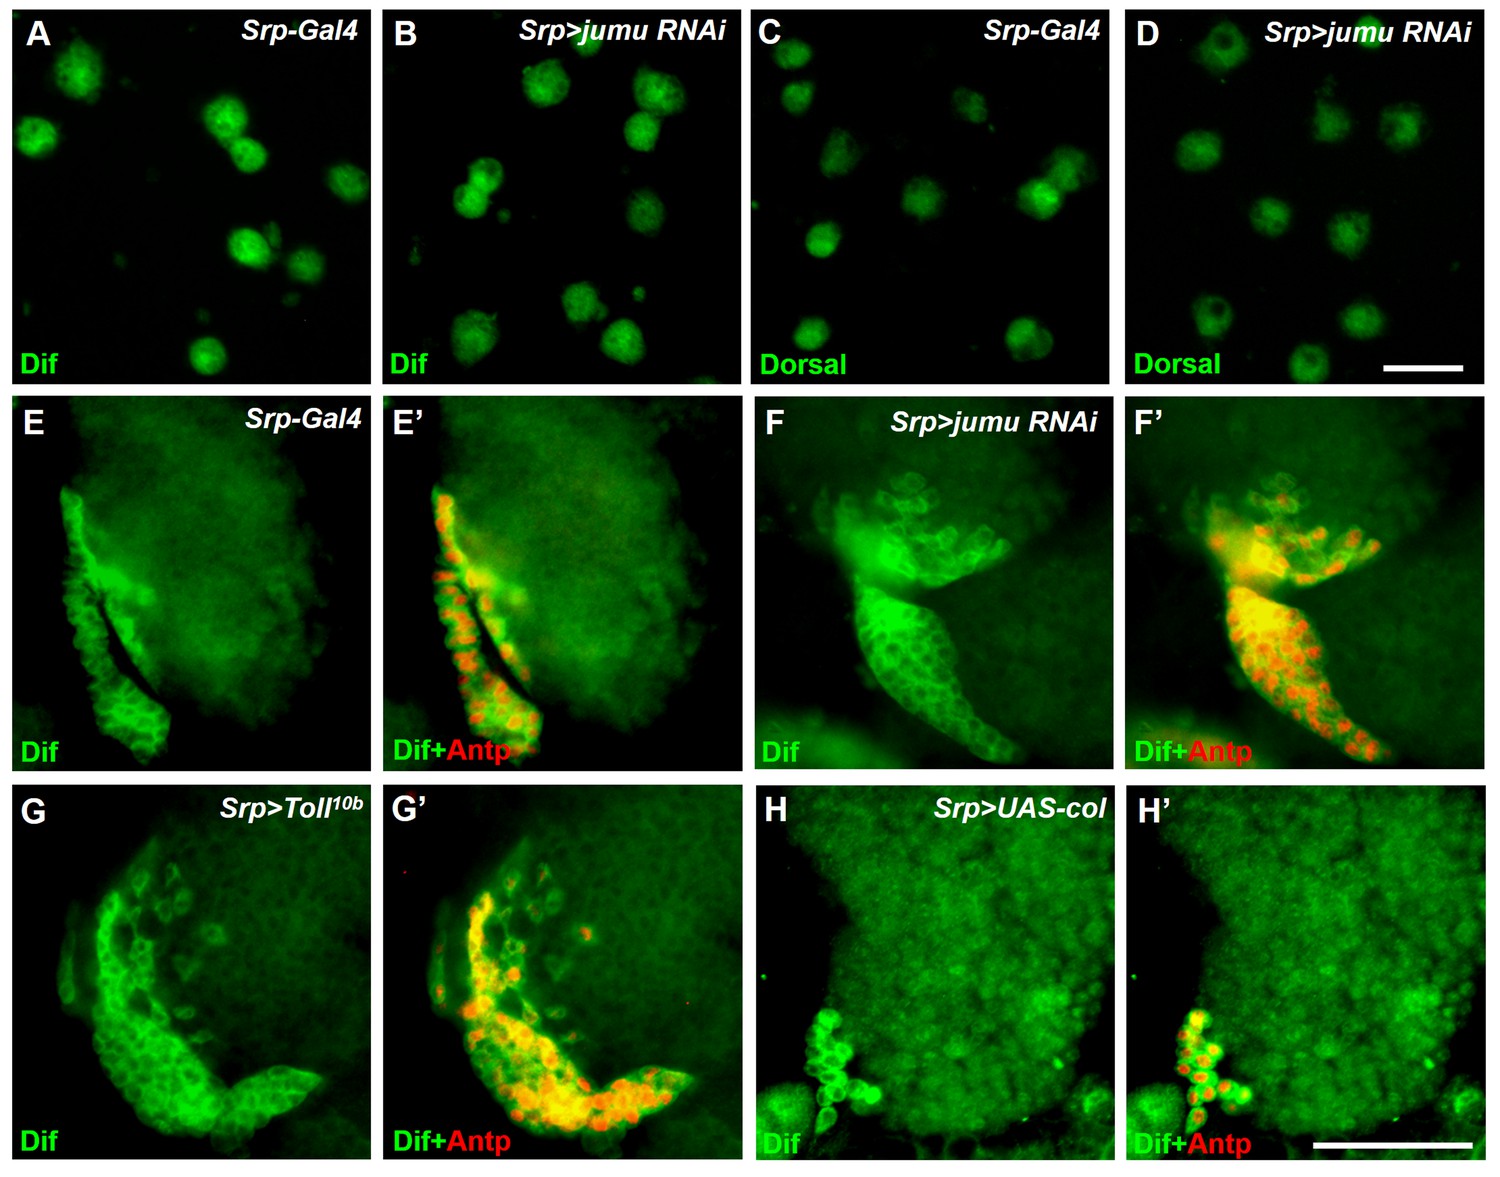
Analysis of subcellular localization of Dorsal and Dif in circulating cells and the lymph gland.
(A–D) Immunostaining for Dif (green) and Dorsal (green) shows that Dorsal and Dif are not obviously expressed in nuclei of circulating cells of Srp>jumu RNAi compared with the control. (E–H’) Immunostaining for Dif (green) shows that Dif is highly expressed in the cytoplasm of PSC cells in the control (E, E’), Srp>jumu RNAi (F, F’), Srp>Toll10b (G, G’) and Srp>UAS-col (H, H’). Scale bars: 20 μm (A–D); 50 μm (E–J’).
Figure 10

Model of the role of Jumu in lymph gland hematopoiesis.
(A) Schematic representation showing that the fate of hemocyte differentiation is determined by the level of jumu expression in the entire lymph gland. The loss of one copy leads to the overproliferation of lymph gland hemocytes, the expansion of PSC cells and a reduction in the differentiation of plasmatocytes and crystal cells. The loss of two copies induces a more severe phenotype of PSC cell expansion throughout the primary and secondary lobes of the lymph gland and favors lamellocyte differentiation. Furthermore, the loss of two copies also leads to the overgrowth of the secondary lobes of the lymph gland. (B) Jumu protein in the entire lymph gland prevents the activation of Toll signaling by down-regulating the expression of Col, consequently preventing the differentiation of lamellocytes. (C) Schematic representation showing the mechanisms through which Jumu regulates PSC homeostasis and the maintenance of prohemocytes. In the PSC, Jumu controls the proper PSC cell proliferation by regulating the expression of dMyc as a positive transcription factor. In the MZ, Jumu cell-autonomously maintains the differentiation of prohemocytes via the repression of Col levels. Moreover, Jumu protein in the MZ prevents the overexpression of dMyc in the PSC in a non-cell-autonomous manner and consequently suppresses the expansion of PSC cells.
Author response image 1
Author response image 2
Additional files
-
Supplementary file 1
PCR primer sequences.
- https://doi.org/10.7554/eLife.25094.021
Download links
A two-part list of links to download the article, or parts of the article, in various formats.
Downloads (link to download the article as PDF)
Open citations (links to open the citations from this article in various online reference manager services)
Cite this article (links to download the citations from this article in formats compatible with various reference manager tools)
Dual role for Jumu in the control of hematopoietic progenitors in the Drosophila lymph gland
eLife 6:e25094.
https://doi.org/10.7554/eLife.25094


