Complex chromosomal neighborhood effects determine the adaptive potential of a gene under selection
- Institute of Science and Technology Austria, Austria
Figures
Figure 1 with 1 supplement
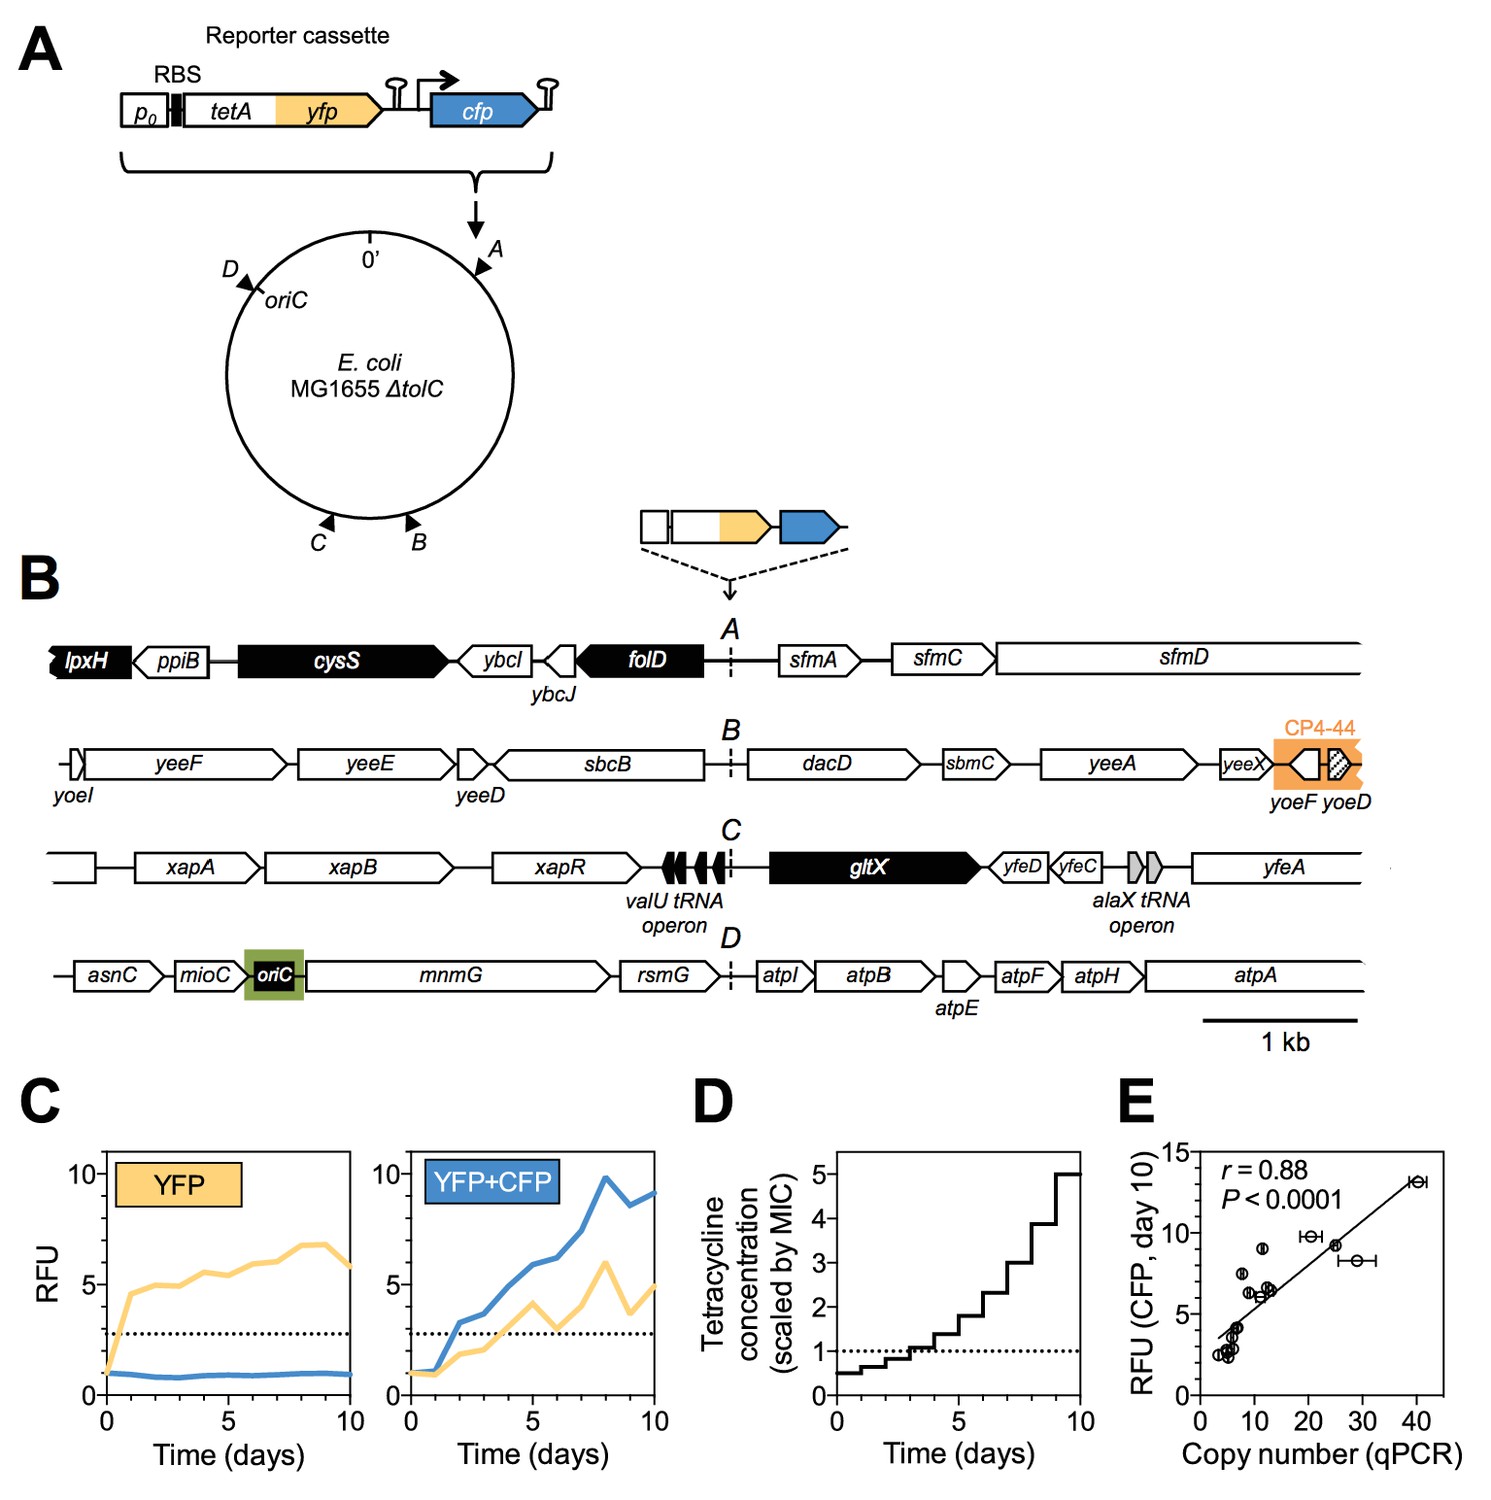
A dual-fluorescence reporter cassette for real-time tracking of adaptive mutations of different types.
(A) Reporter cassette construct for chromosomal insertion. p0 = 188 bp random DNA sequence, RBS = ribosomal binding site, hairpins = transcriptional terminators, tetA-yfp = selected gene, cfp = constitutively expressed amplification reporter. A, B, C, D = intergenic chromosomal insertion loci, oriC = origin of replication. (B) Immediate chromosomal neighborhoods of loci A-D. Black arrows = essential genes. White arrows = non-essential genes. Grey arrows = no essentiality data available. Patterned arrow (yoeD) = pseudogene. Orange = cryptic prophage CP4-44. Green = origin of replication (oriC). Chromosomal neighborhoods of loci B, C, and D are shown reversed with respect to conventional chromosome coordinates, so that the orientation relative to the reporter cassette is shown in the same way for all four loci. Reporter cassette genes are not drawn to scale. (C) Example fluorescence trajectories of rescued populations with YFP or YFP+CFP (amplification) fluorescence phenotype. RFU = relative fluorescence units (see Methods), yellow and blue lines = YFP and CFP fluorescence, dotted lines = threshold for phenotype classification. (D) Increase of tetracycline concentration in ten-day experiment, normalized to strain-specific minimal inhibitory concentration (MIC, dotted line). (E) qPCR validation of CFP fluorescence as an indicator of extent of amplifications. x-axis: tetA-yfp copy number as determined by qPCR on genomic DNA of rescued population with a YFP+CFP fluorescence phenotype. Error bars = SD of technical qPCR triplicates. r is the Pearson correlation coefficient and P its p-value. RFU = relative fluorescence units, line = linear fit.
-
Figure 1—source data 1
Chromosomal coordinates of reporter cassette insertion loci.
- https://doi.org/10.7554/eLife.25100.003
-
Figure 1—source data 2
Source data for Figure 1E.
Mean and standard deviation of chromosomal tetA-yfp copy number (qPCR) and final CFP fluorescence (plate reader data).
- https://doi.org/10.7554/eLife.25100.004
Figure 1—figure supplement 1
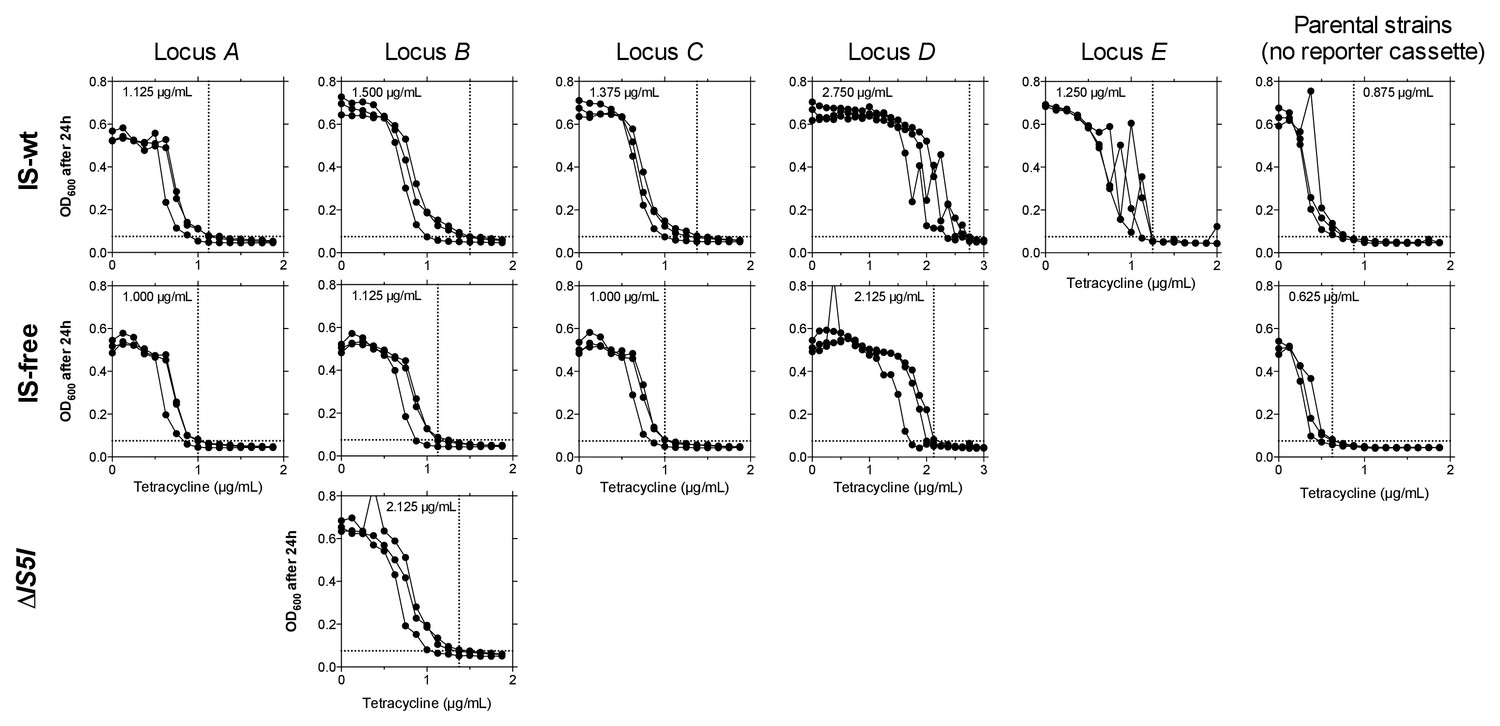
Fine-scale determination of MICs of tetracycline for ancestor strains used in experimental evolution.
OD600 (platereader units) after 24 hr is shown across tetracycline concentrations (triplicates). Panel columns = integration loci of the reporter cassette, panel rows = genetic background. Note the different scaling of the x-axis for D strains. We define MIC (dashed vertical lines and inset values) as the lowest concentration that restricts growth to OD600 ≤0.075 (= ODt, plate reader units, dashed horizontal lines) in all three replicates. We regard the highest replicate value of strain E at 2 µg/mL as an outlier uninformative about ancestral drug sensitivity, as this culture showed highly increased CFP fluorescence indicative of reporter cassette amplification. The selective conditions in evolution experiments (i.e., tetracycline concentrations) were adjusted according to strain-specific MICs to make results more comparable between strains. Without such an adjustment in tetracycline concentrations, different MICs would cause large differences in population sizes and consequently in the probability of acquiring beneficial mutations.
-
Figure 1—figure supplement 1—source data 1
Triplicate OD600 values (plate reader units) across tetracycline concentrations.
- https://doi.org/10.7554/eLife.25100.006
Figure 2 with 2 supplements

Large differences in adaptation by amplification depend on flanking homology in the chromosomal neighborhood.
(A) Numbers of rescued populations by fluorescence phenotype. The numbers of rescued vs. extinct populations and the distribution of fluorescence phenotypes (YFP or YFP+CFP) differ among strains A, B, C, and D (p<10−16 and p<10−7, Fisher’s exact test). (B) The ability of evolved clones to grow on tetracycline depends on the reporter cassette. Pictures show YFP-fluorescence of cultures spotted at different dilutions on solid medium with and without tetracycline (2.25 µg/mL). Top rows: evolved clones sampled from rescued populations of three different strains. Bottom rows: respective deletion mutants lacking reporter cassette genes. In parentheses: position of the sampled populations on 96-well plates in evolution experiments. (C) Numbers of rescued populations by fluorescence phenotype in two additional replicate sets of evolution experiments. (D) IS5 copies flanking locus B promote duplication. Left: Cartoon showing the position of the reporter cassette between two copies of IS5 (distances not drawn to scale, genes in between omitted) and the putative unequal crossing over-event causing initial duplications. Right: The expected amplicon junction is present in amplifications in strain B, but not in the ancestor or in amplifications in strain BΔIS5I. Arrow: junction PCR product obtained with outward facing primers shown as pointers in the cartoon on the left.
Figure 2—figure supplement 1
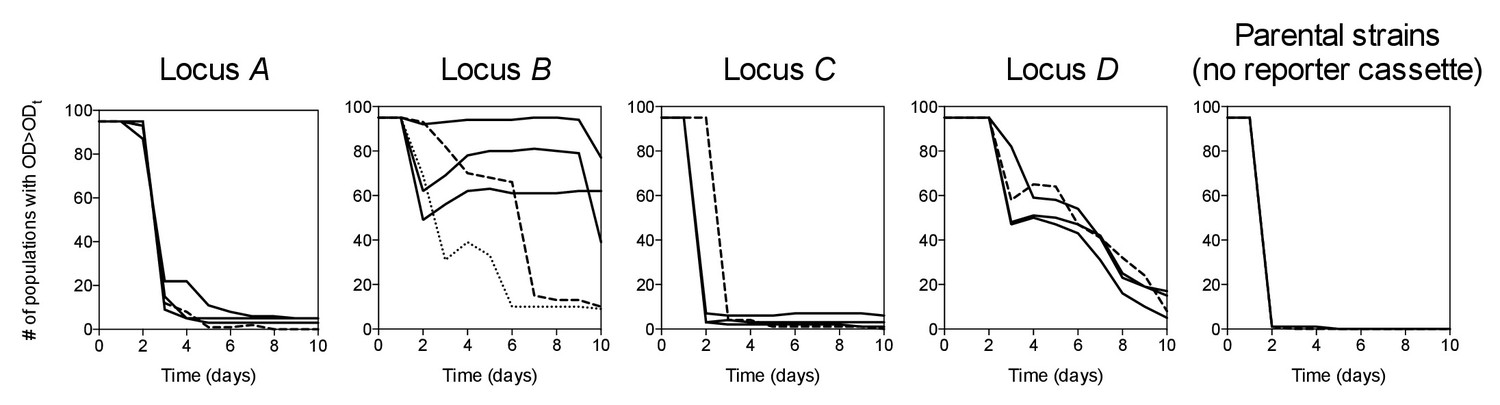
Survival curves of 95 populations in evolution experiments.
ODt = threshold OD600. Solid lines = IS-wt genetic background, dashed lines = IS-free genetic background, dotted line in Locus B panel = strain BΔIS5I. Triple solid lines for loci A-D represent replicate sets of evolution experiments. Local minima in the number of populations are due to populations that fell below ODt only transiently.
-
Figure 2—figure supplement 1—source data 1
Numbers of populations with OD600>ODt.
- https://doi.org/10.7554/eLife.25100.009
Figure 2—figure supplement 2
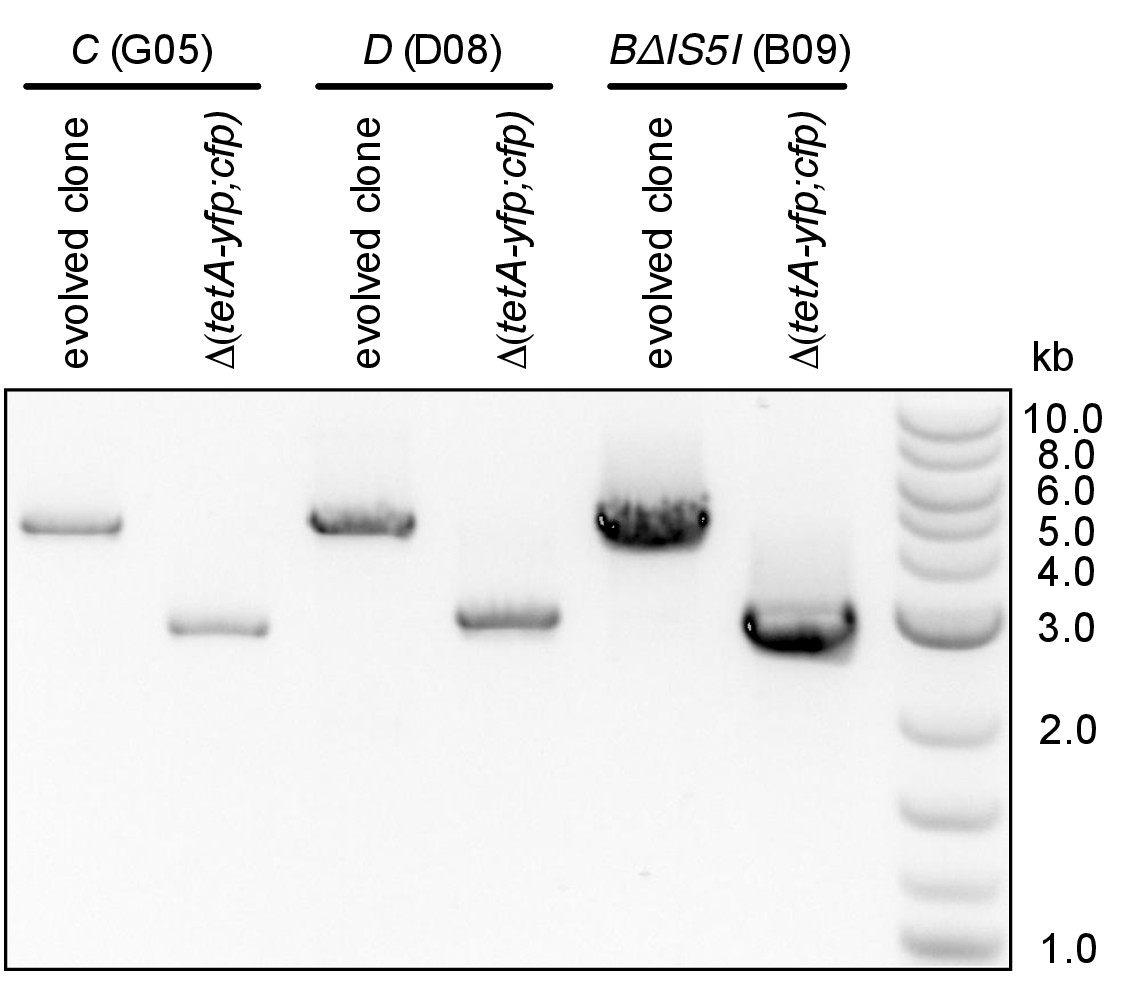
PCR products confirming the deletion of reporter cassette genes in clones shown in Figure 2B.
Colony PCR was performed with primers flanking integration loci.
Figure 3 with 5 supplements
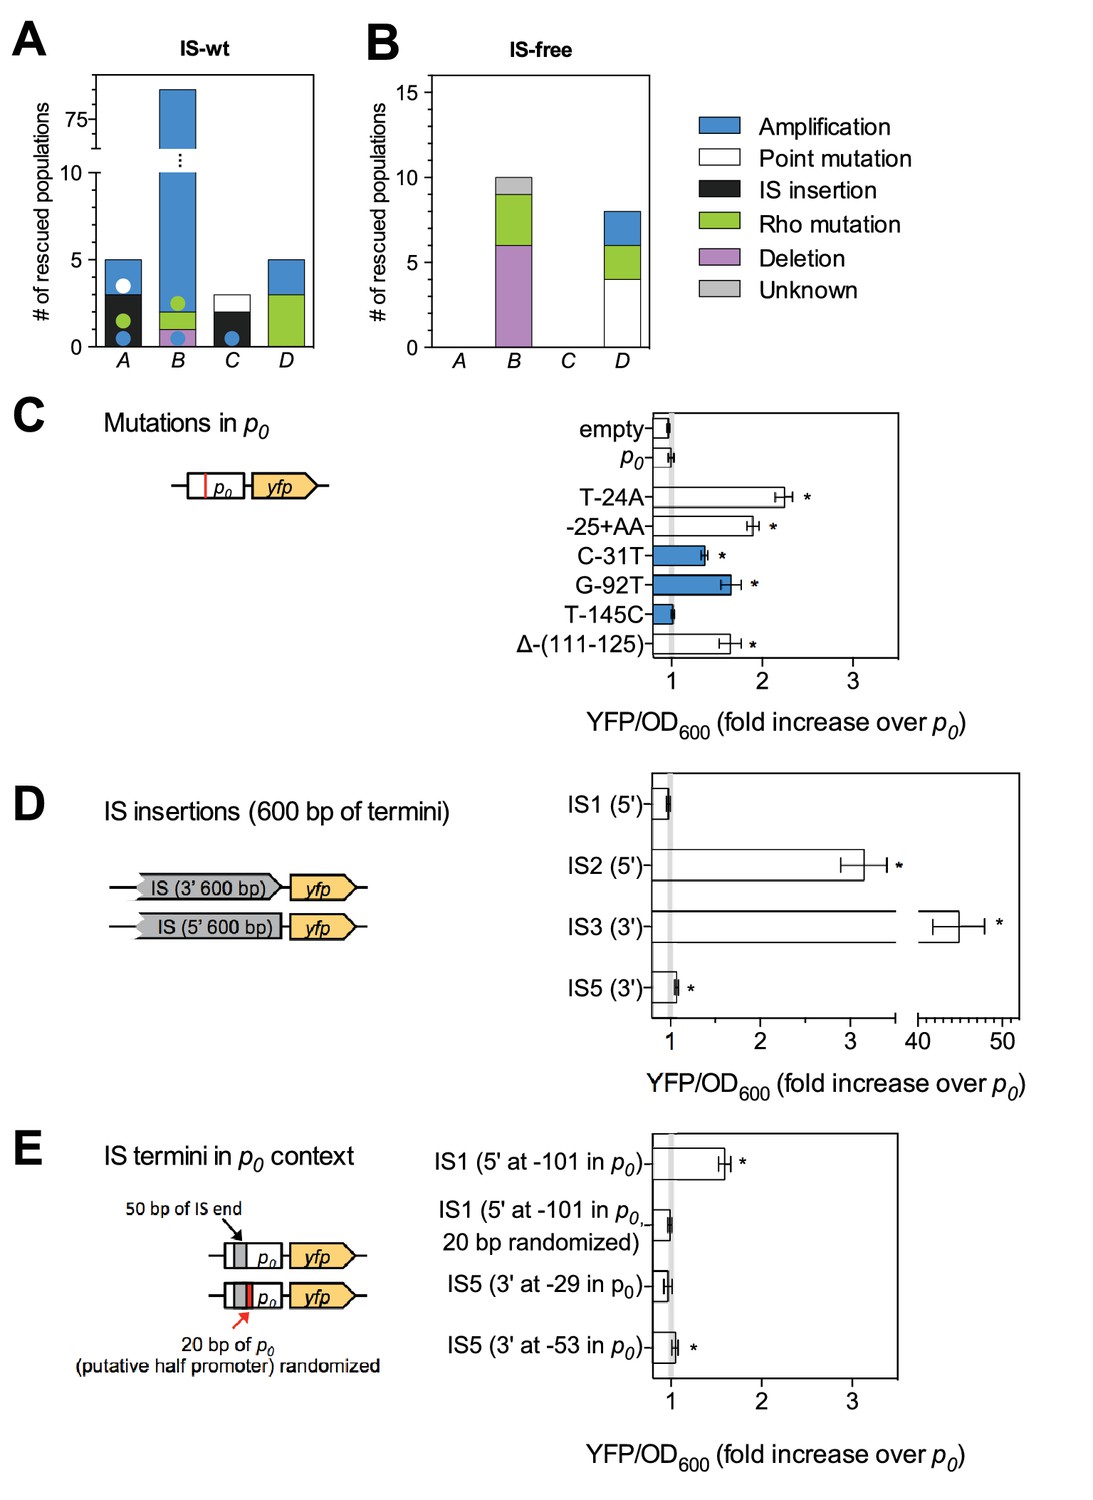
Adaptation involves a broad diversity of mutation types.
Mutation types in rescued populations of IS-wt (A) and IS-free (B) strains. Colored dots = later mutations occurring on top of other mutations (see Methods). Mutation types differ between loci (p=10−9 (A) and p=0.003 (B), Fisher’s exact test). (C–E) Effect of reconstructed point mutations and IS insertions on reporter expression on plasmids. Plasmids contain mutations reconstructed upstream of a ribosomal binding site (not shown) and a yfp reporter gene as shown in cartoons. Empty = auto-fluorescence control (plasmid backbone); p0 = ancestral 188 bp random sequence. Error bars = 95% confidence intervals of six technical replicates. Grey shading: 95% confidence interval of OD600-normalized p0 fluorescence. Asterisks = p<0.05, two-tailed t-test on mean fluorescence difference in comparison with p0. (C) Reporter fluorescence driven by small mutations within p0 (single bp substitutions and small insertions or deletions). Mutation coordinates = distance of mutation to start codon of yfp. Blue bars = mutations that co-occur with amplifications and show overlapping peaks in the sequence chromatogram of evolved clones, indicating presence of mutations only in a subset of copies in an amplification. (D) Reporter fluorescence driven by IS insertions. Plasmids contain the termini of IS which were truncated to 600 bp. 5’ and 3’ refers to the direction of the IS-contained transposase gene. IS2 and IS3 drive strong fluorescence of yfp in the plasmid context; IS1 and IS5 do not. (E) Reporter fluorescence driven by IS in the precise sequence context of p0. IS1, but not IS5, contains a partial promoter whose activity depends on the adjacent sequence in p0. Numbers in parentheses = distance between insertion point and the yfp start codon. ‘rnd’ = random shuffling of 20 bp of p0 downstream of the IS1 insertion point.
-
Figure 3—source data 1
Source data for Figure 3C–E.
OD600-normalized fluorescence values measured in exponential phase (six replicates).
- https://doi.org/10.7554/eLife.25100.012
Figure 3—figure supplement 1
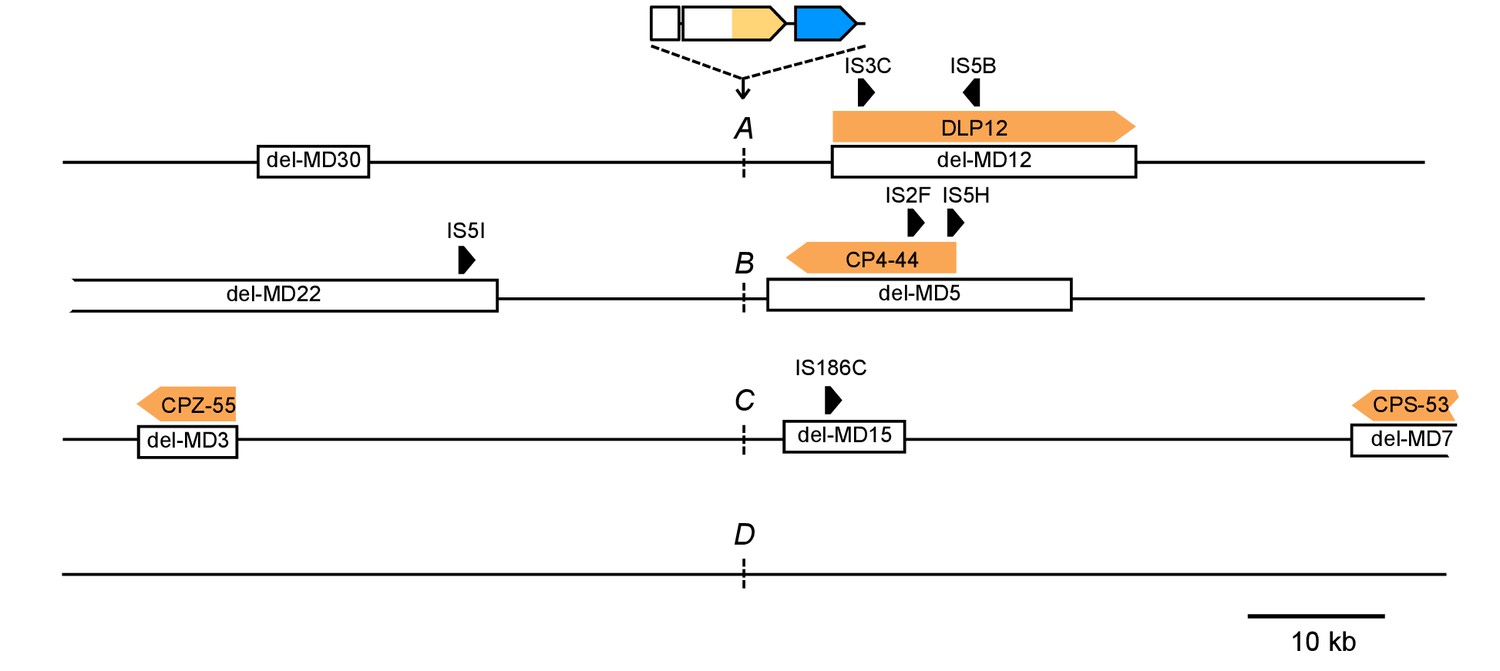
Differences in the chromosomal neighborhood (100 kb) of loci A-D between IS-wt and IS-free strains.
White boxes = regions deleted in the IS-free strains derived from strain MDS42 (Pósfai et al., 2006). Orange arrows = prophages, black arrows = insertion sequences. Chromosomal neighborhoods of loci B, C, and D are shown reversed with respect to conventional chromosome coordinates, so that the orientation relative to the reporter cassette is shown in the same way for all four loci. Reporter cassette genes are not drawn to scale.
Figure 3—figure supplement 2
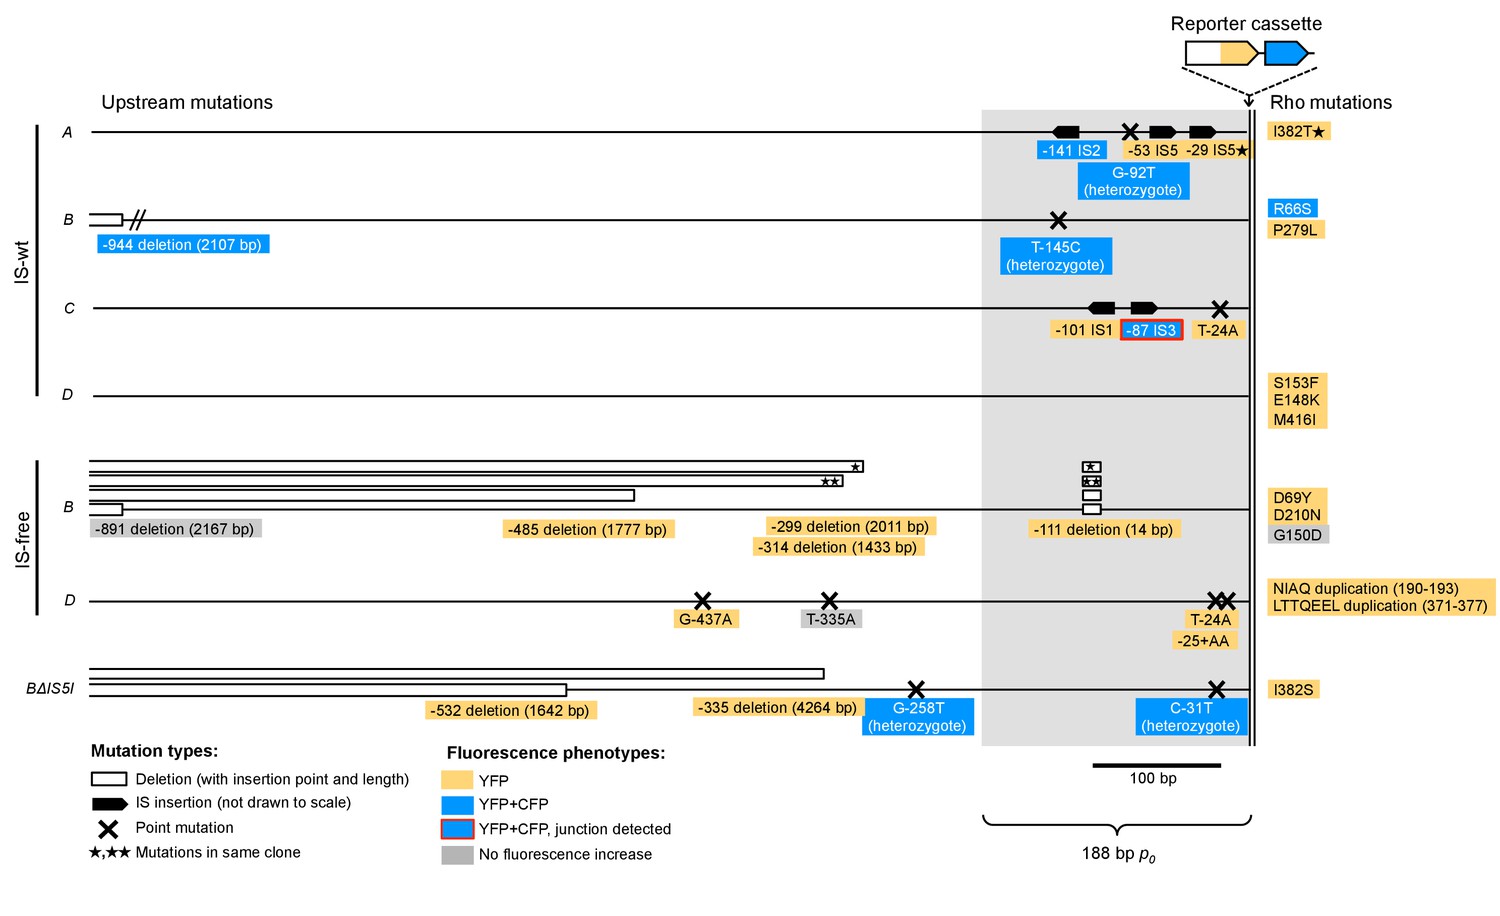
Graphical overview of mutations identified by sequencing.
All mutations found within 1 kb DNA upstream of tetA-yfp are labeled with their distance to the tetA-yfp start codon and the fluorescence phenotype of the population they were found in (YFP or YFP+CFP). Grey-shaded area indicates the 188 bp random DNA sequence common to all strains. Trans mutations in the Rho protein are shown at the right edge. IS-free A and C strains are not shown as they did not give any survivors. ‘Heterozygote’ indicates overlapping peaks in the sequence chromatogram, which suggests that the mutation is present only in some copies contained in the amplification. Red box frame indicates that for this amplification, we showed by PCR that the junction of this amplification was at the breakpoint between the newly inserted IS3 copy and a second IS3 copy downstream of locus C. Mutations identified in additional replicate experiments are not shown.
Figure 3—figure supplement 3
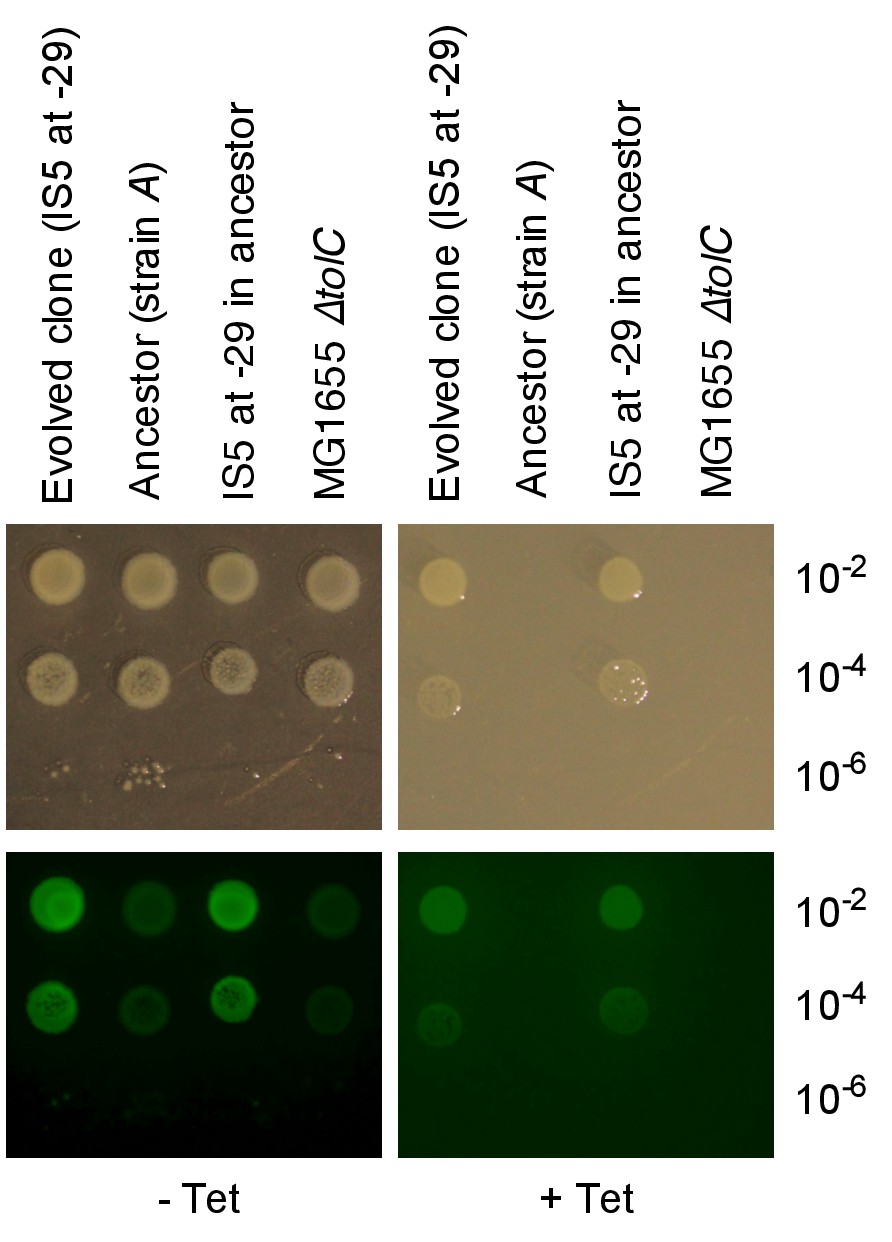
An upstream IS5 insertion in the chromosomal context of the reporter cassette confers resistance to tetracycline and increases tetA-yfp fluorescence.
Pictures show brightfield (top) and YFP-fluorescence (bottom) images of cultures spotted at different dilutions on solid medium with and without tetracycline (2.25 µg/mL). We used an evolved clone isolated from population A09 of strain A in which IS5 was found inserted 29 bp upstream of the TetA-YFP start codon as a donor for P1 transduction of the reporter cassette with upstream IS5. MG1655 ∆tolC, the cassette-free parent strain of strain A was used as recipient strain for the transduction.
Figure 3—figure supplement 4

Mutations identified by whole genome sequencing of clones from four rescued populations of IS-wt strain D.
All mutations identified by the breseq pipeline (Barrick et al., 2014) in reference to the strain D ancestral genome are shown. Black arrow in magnified box: reporter cassette. Mutations from the same clone are indicated by the same color. Orange (source population C10): 11-fold amplification of a region including tetA-yfp and half of the cfp gene, explaining why we did not observe increased CFP fluorescence. Notably, this amplification included the origin of replication. Blue, purple, green: Mutations found in sequenced clones of the three remaining populations (blue = A11, purple = D08, green = C08), in which we consider non-synonymous substitutions in rho as main adaptive mutations. We interpret missing coverage in one of the rRNA operons as an assembly artifact related to the multiplicity of rRNA operons, rather than as a deletion, as no corresponding junction was detected. The inversion found in the stfP-stfE region of prophage e14 is catalyzed by the e14-encoded Pin recombinase (van de Putte et al., 1984), possibly expressed as a secondary effect of rho mutations (Cardinale et al., 2008). We thus assume that the same inversion was found three times not because it was adaptive, but because it was the consequence of an adaptive mutation in rho. Mutations at other sites were not tested for their fitness effect. Fastq files are deposited online: http://dx.doi.org/10.15479/AT:ISTA:65.
Figure 3—figure supplement 5
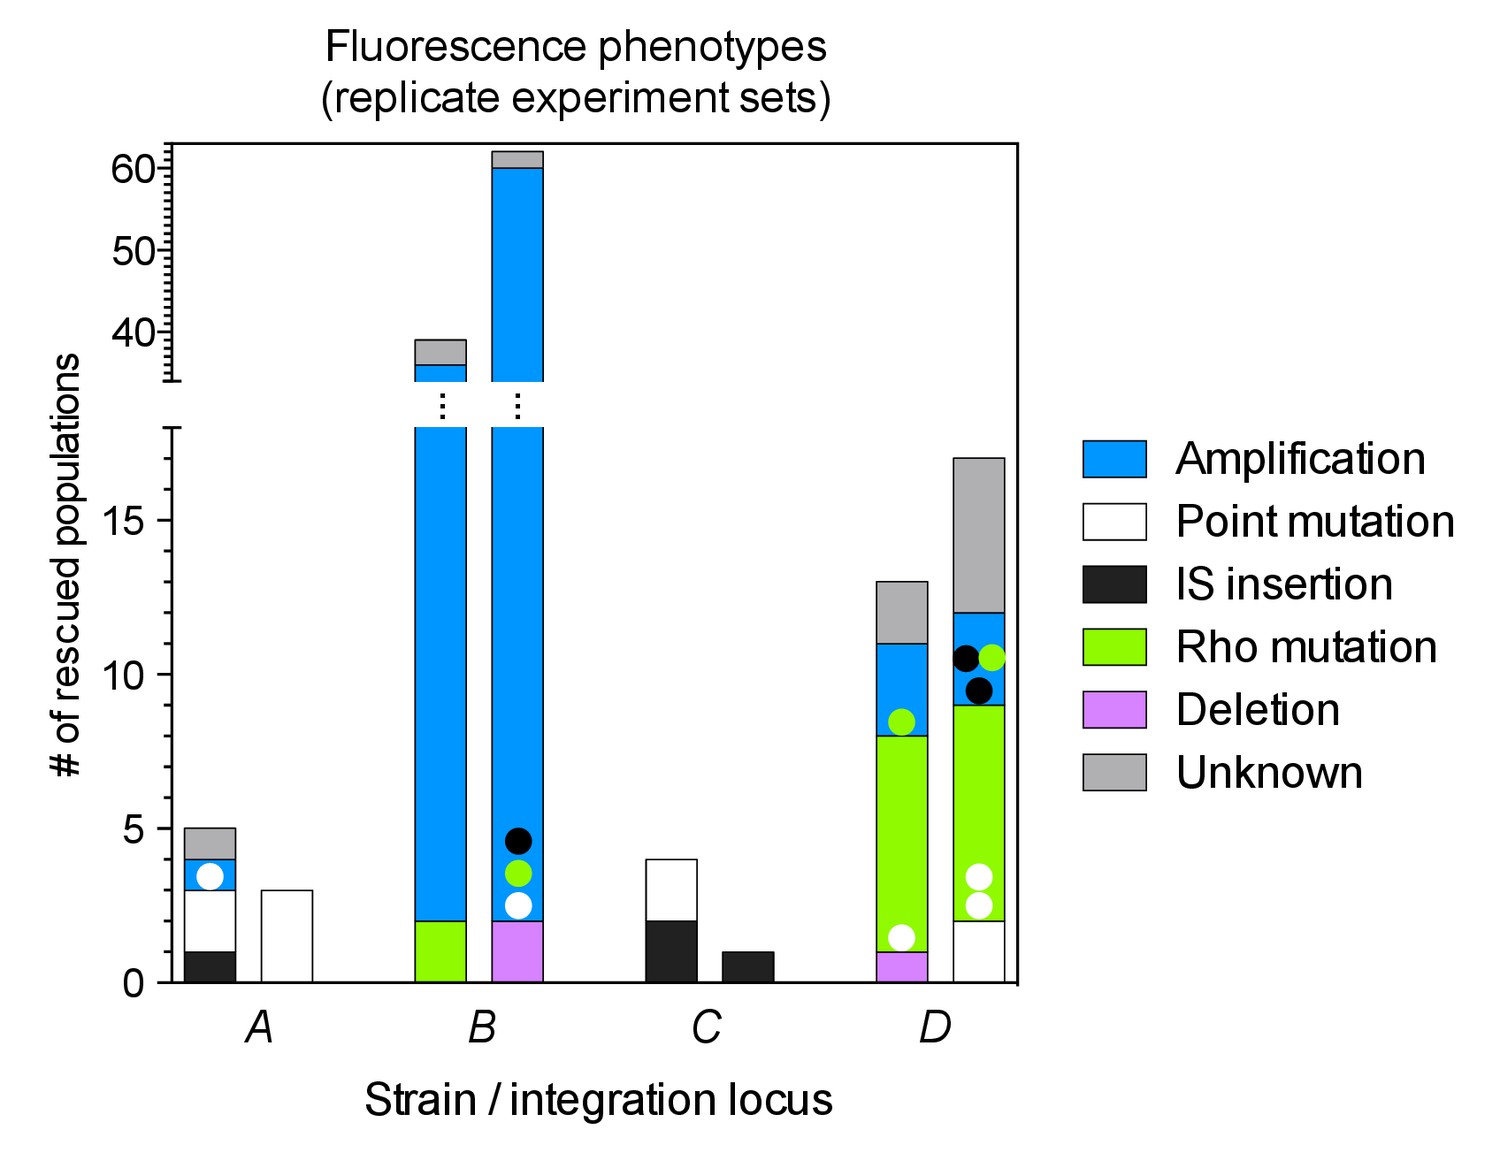
Numbers of rescued populations by mutation type in two additional replicate sets of evolution experiments.
Each bar represents the number of rescued populations out of 95 started populations per experiment.
Figure 4 with 2 supplements
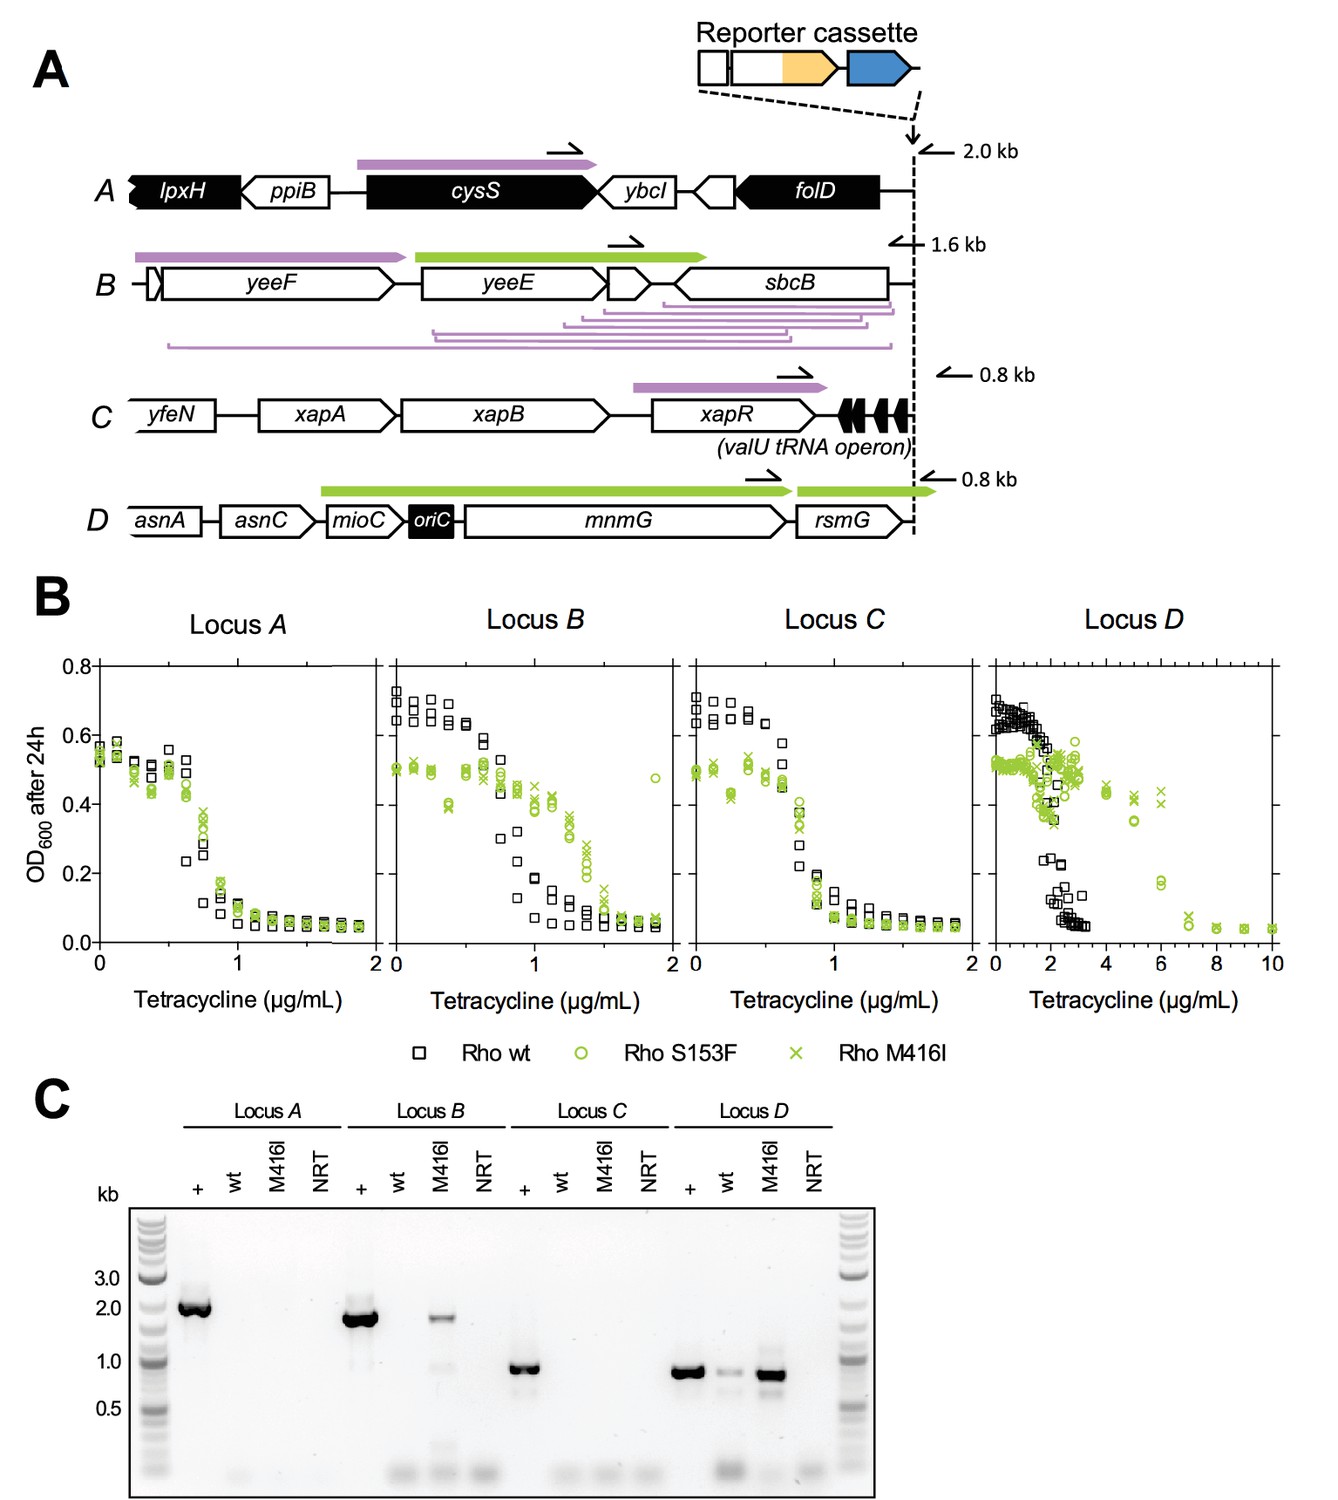
The fitness effect of promoter co-opting deletions and Rho-mutations depends on properties of upstream neighboring genes.
(A) Genes and transcripts upstream of loci A, B, C, and D. Promoters of intrinsically terminated transcripts (purple) can be co-opted by deletions (purple brackets) if no essential gene (black arrows) is deleted. Promoters of Rho-terminated transcripts (green) can be co-opted by deletions or by partial loss-of-function mutations in Rho. Only putatively expressed transcripts oriented toward the reporter cassette are shown (all transcripts in Figure 4—figure supplement 1). Pointers and numbers on the right = position and size of PCR products shown in (C). (B) Tetracycline dose-response curves of strains with wt (black squares) or transduced mutant Rho (green circles = S153F, green crosses = M416I). Final OD600 after 24 hr (platereader units) was measured in three biological replicates. Rho mutants are more tolerant to tetracycline only with the reporter cassette at loci B and D. (C) Read-through transcripts spanning upstream terminators in a Rho-mutant background are detectable at loci B and D, but not at loci A and C. Bands show PCR products obtained from genomic DNA (+ control) or cDNA from a Rho-wt or Rho mutant (M416I) strain grown with sub-inhibitory levels of tetracycline. Positions of used primers as indicated in (A). NRT = negative control (no reverse transcriptase).
-
Figure 4—source data 1
Source data for Figure 4B.
Triplicate OD600 values (plate reader units) across tetracycline concentrations.
- https://doi.org/10.7554/eLife.25100.019
Figure 4—figure supplement 1

Fully annotated genes and putatively expressed transcripts of either orientation upstream of the reporter cassette insertion loci.
Genes and transcripts upstream of loci A, B, C, and D. Black arrows = essential genes (see Methods), white arrows = non-essential genes, purple arrows = intrinsically terminated transcripts, green arrows = Rho-terminated transcripts, purple brackets = deletions. Start- and endpoints of expressed transcripts and termination mode (intrinsic or factor-dependent) were taken from a recent dataset (Conway et al., 2014), for which RNA from E. coli cells grown in minimal glucose medium was sequenced at base pair resolution. Pointers on the right = position of PCR products shown in Figure 4C.
Figure 4—video 1
Animated structure of the Rho hexamer with mutated residues highlighted.
Mutations were mapped on the previously published structure of Rho (Skordalakes and Berger, 2003).
-
Figure 4—video 1—source data 1
Rho mutations from all replicate evolution experiments.
28 unique mutations (substitutions at 22 different amino acid residues, two internal duplications and one upstream insertion) were found in 31 rescued populations. Affected amino acid residues of Rho are highlighted in red in Figure 4—video 1.
- https://doi.org/10.7554/eLife.25100.022
Figure 5 with 1 supplement
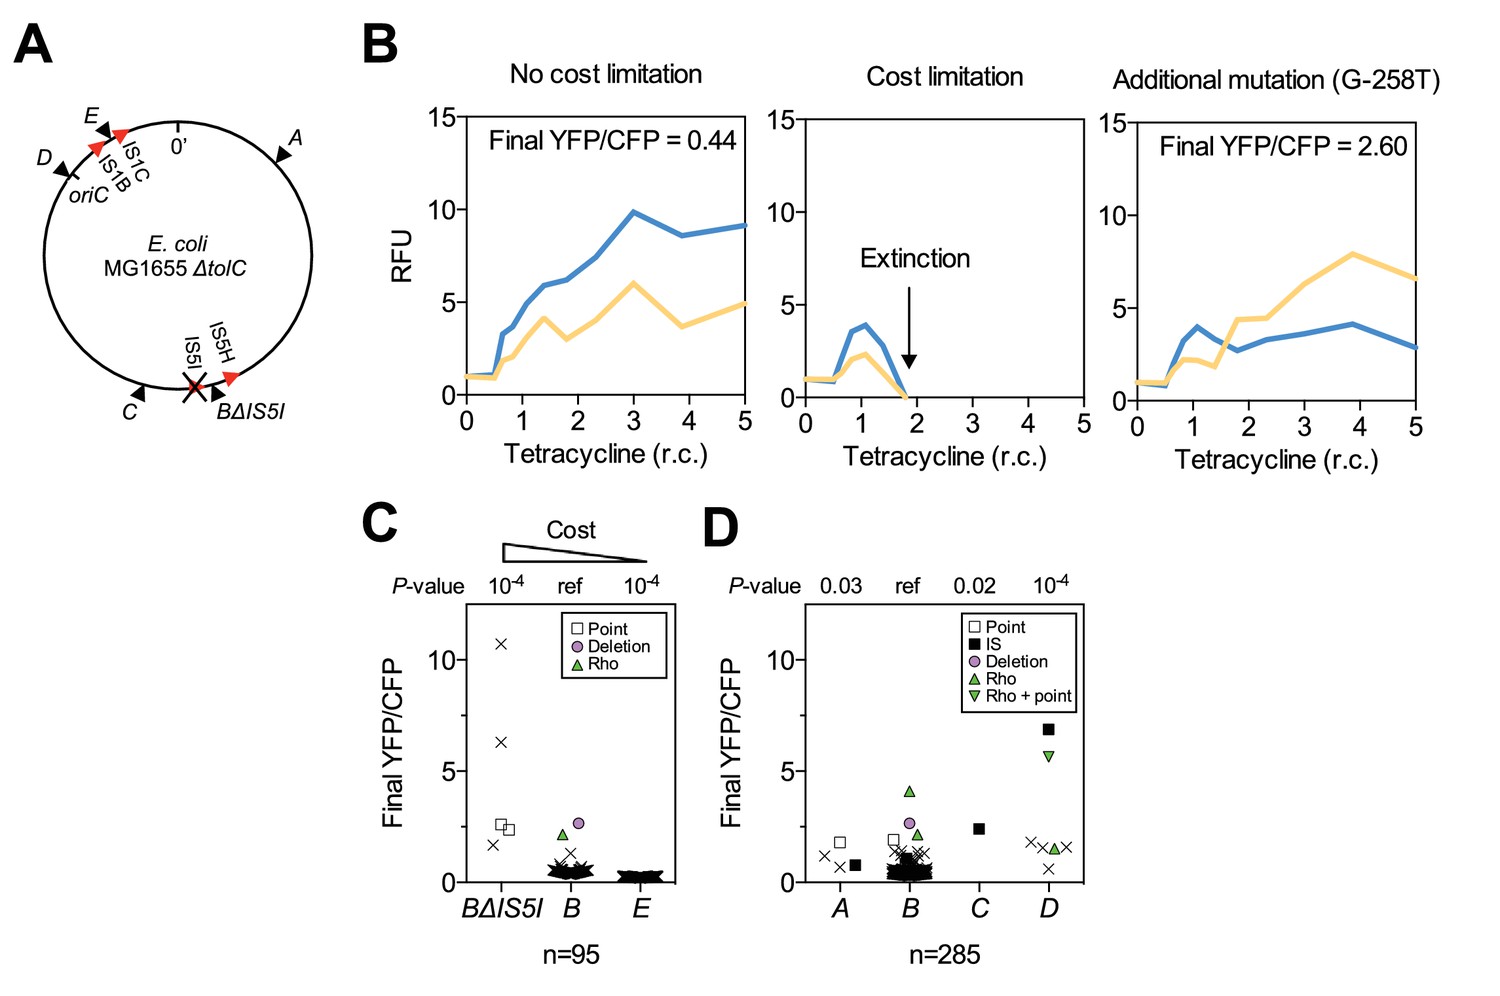
Chromosomal neighborhood influences the fitness cost of amplifications.
(A) Chromosomal location of reporter cassette in strains BΔIS5I and E (IS distances not drawn to scale). (B) Example fluorescence trajectories. Left: low-cost amplifications expand in correlation with the increase in tetracycline concentration over 10 days. Middle: Cost-limited amplifications fail to expand at higher tetracycline concentrations resulting in extinction. Right: Amplifications can escape extinction in combination with other mutations increasing tetA-yfp expression, resulting in higher final YFP/CFP. RFU = relative fluorescence units (see Materials and methods), r.c. = relative concentration as multiples of MIC. (C) Final YFP/CFP ratios of rescued amplifications in strains expected to have a higher (strain BΔIS5I) or lower (strain E) cost of amplifications compared to strain B. n = initial number of replicate populations used for analysis. Crosses = populations rescued by amplifications without additional mutations. Other symbols = secondary mutations (see legend). p-values: permutation tests in comparison with strain B. (D) Final YFP/CFP ratios of rescued amplifications in strains A-D. n = 285 includes replicate evolution experiments to increase statistical power. Symbols and p-values as in (C).
-
Figure 5—source data 1
Source data for Figure 5C and D.
Mutations identified in combination with amplifications and respective final YFP/CFP ratios (points indicated by symbols other than crosses in Figure 5CD).
- https://doi.org/10.7554/eLife.25100.024
Figure 5—figure supplement 1
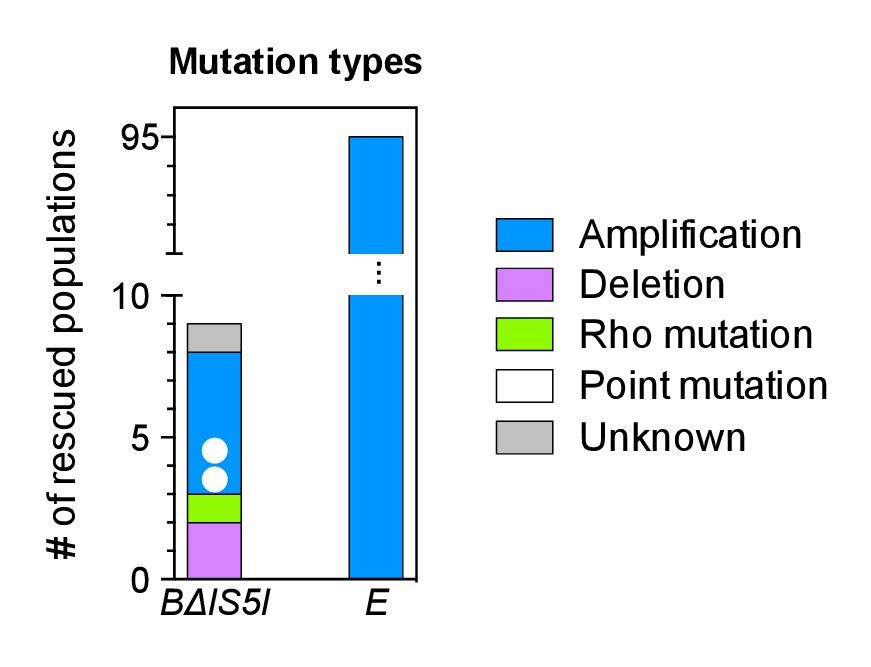
Rescued populations of strains BΔIS5I and E by mutation type.
Number of rescued populations out of 95 replicates, shown by mutation type. Colored dots = later mutations occurring on top of earlier mutations.
Figure 6 with 2 supplements

Tetracycline-resistant mutants arising in a single-step plating experiment.
For each strain (top panels = IS-wt, bottom panels = IS-free), 10 replicate cultures grown in the absence of tetracycline were plated on agar with tetracycline concentration two times the strain-specific MIC. Left: Colony counts after 2 days of incubation. Right: Colony counts after 5 days of incubation. Horizontal lines show the median colony number from 10 replicate plates. Pie charts = fraction of plates in which a single tested colony appearing at day 2 (left) or at days 4–5 (right) showed high CFP fluorescence indicative of amplification (Figure 6—figure supplement 2).
-
Figure 6—source data 1
Numbers of colonies on replicate plates at days 2 and 5.
- https://doi.org/10.7554/eLife.25100.028
Figure 6—figure supplement 1
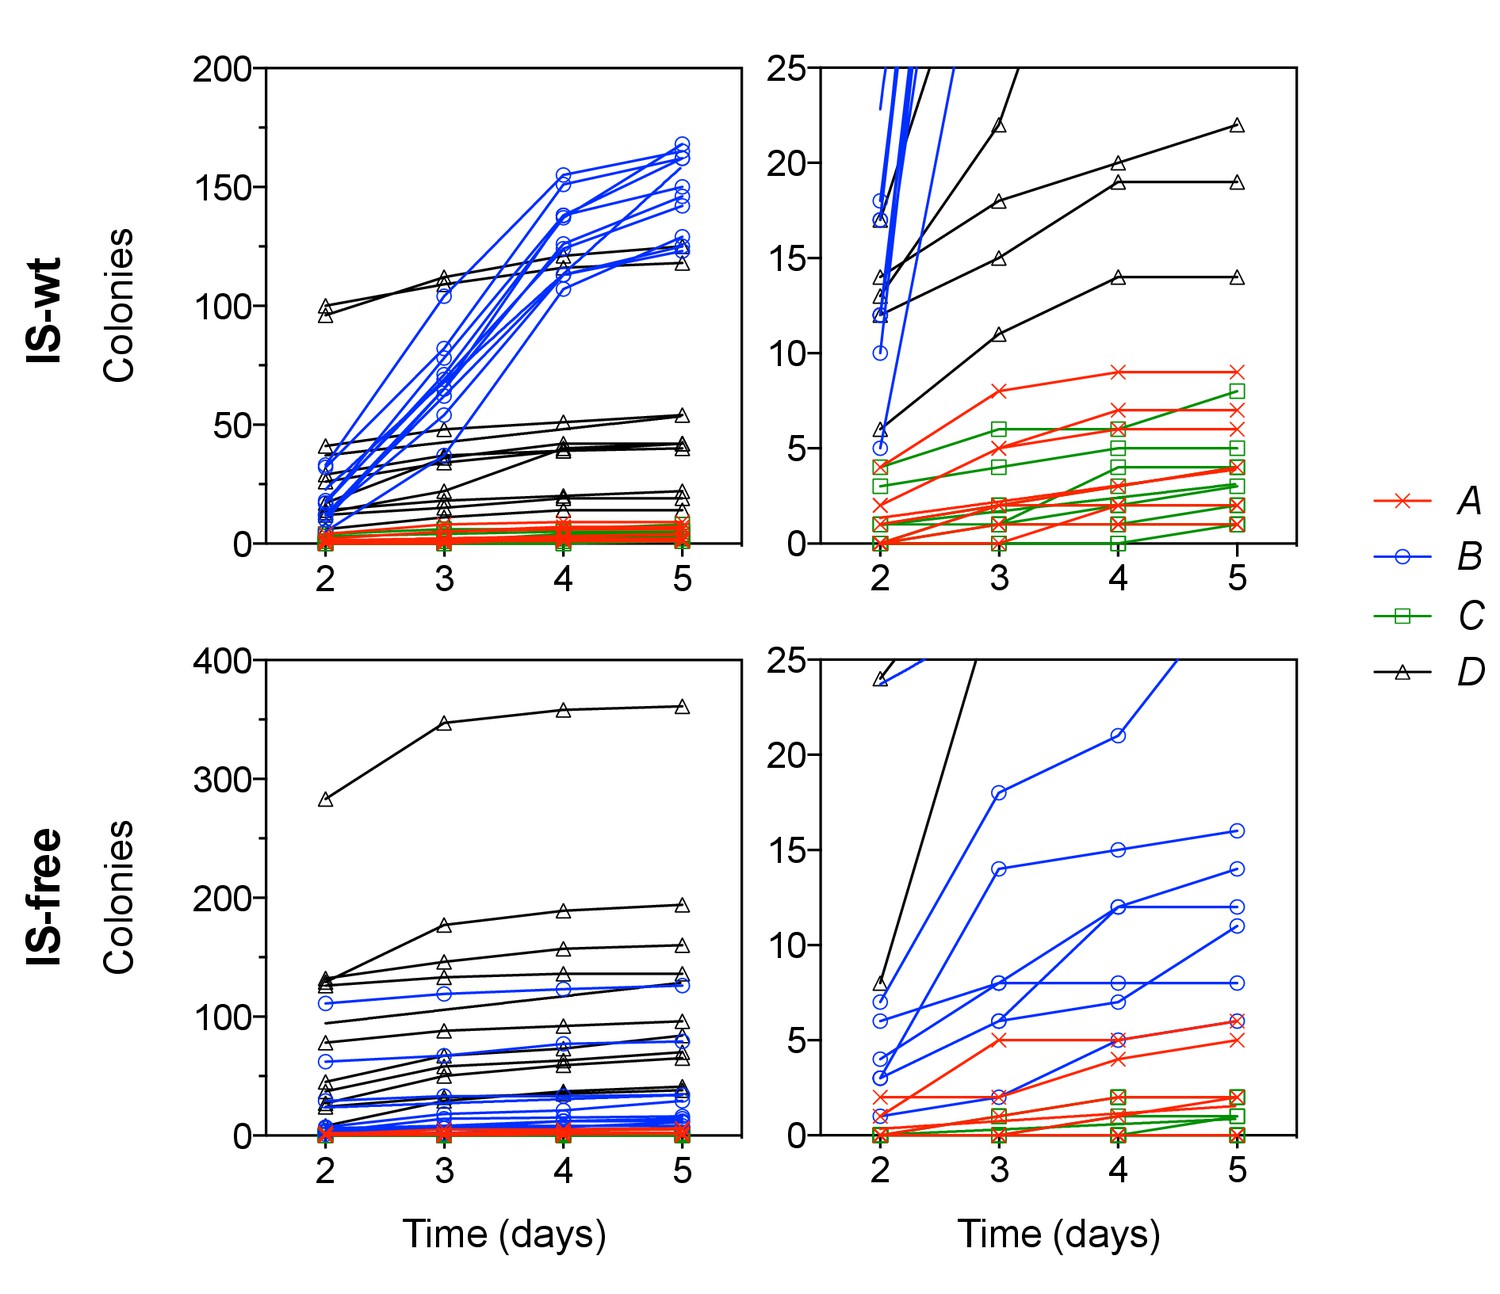
Colony appearance over time in plating experiments.
Each line represents the number of colonies on one of 10 replicate plates per strain. Right panels show the same data as on the left with different y-axis scaling.
-
Figure 6—figure supplement 1—source data 1
Numbers of colonies on replicate plates (time-course).
- https://doi.org/10.7554/eLife.25100.030
Figure 6—figure supplement 2
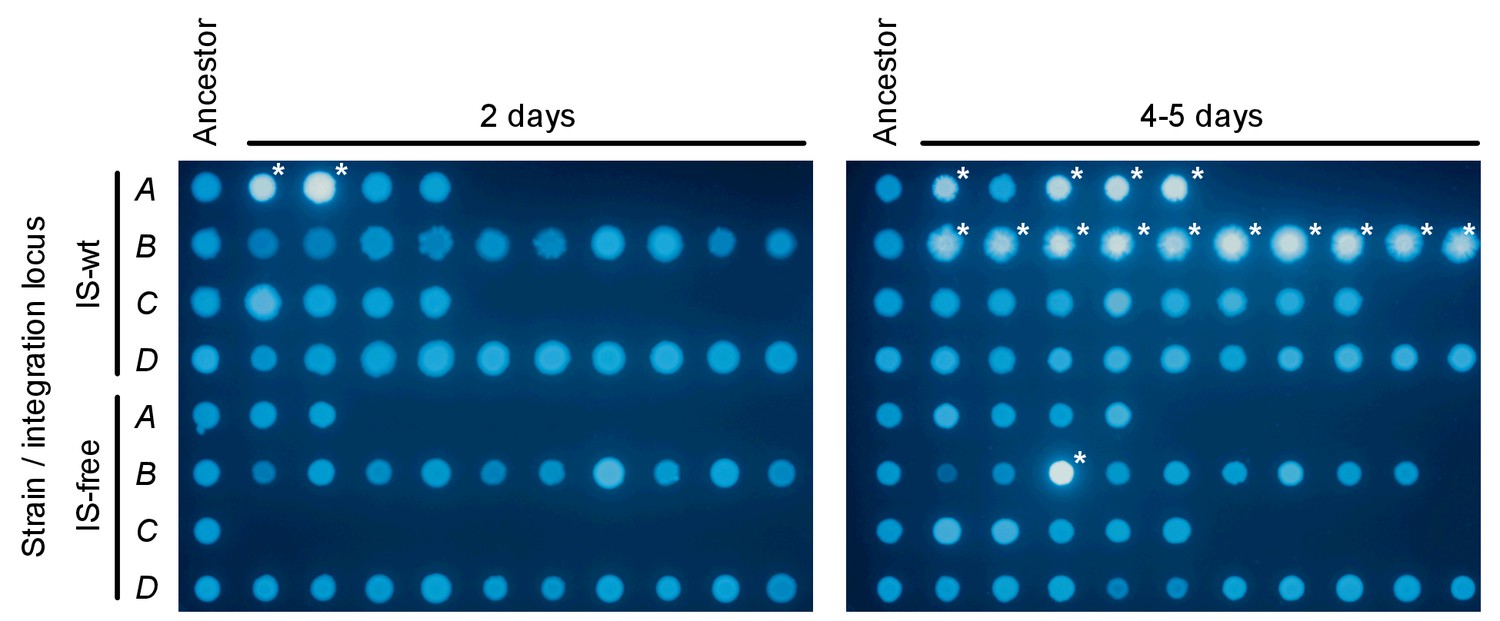
CFP-fluorescence of cultures spotted on non-selective medium used to obtain pie-chart data in Figure 6.
The leftmost column of spots on each picture is derived from colonies of the ancestor strain plated on non-selective medium. The other spots are derived from colonies that appeared on day 2 (left picture) or on days 4–5 (right picture) after plating. One colony was picked from every replicate plate on which at least one colony had appeared in the respective time interval. White asterisks indicate spots with CFP fluorescence intensity greater than 6 standard deviations above the mean fluorescence intensity of all ancestor spots.
-
Figure 6—figure supplement 2—source data 1
Mean fluorescence intensity values of culture spots and thresholding for identification of colonies with extensive amplifications.
- https://doi.org/10.7554/eLife.25100.032
Figure 7
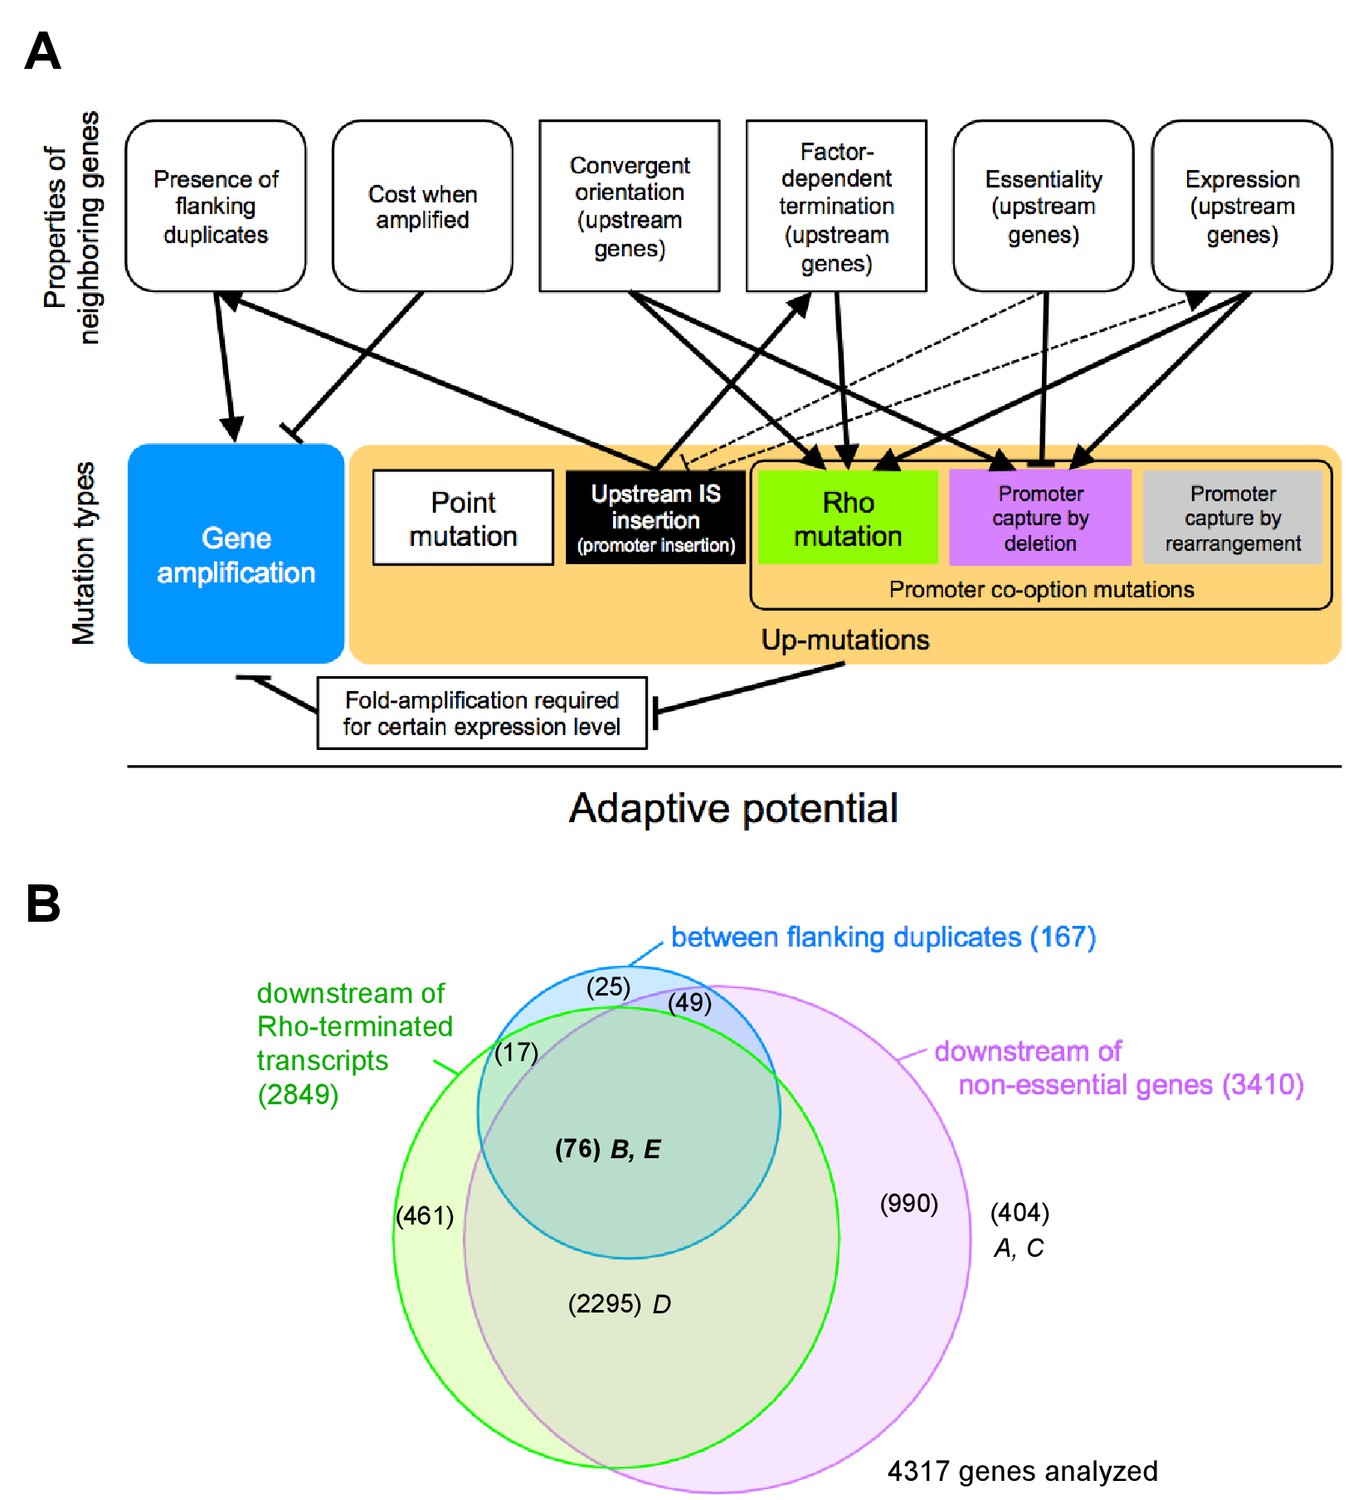
The adaptive potential of a gene under selection for increased gene expression as a complex function of properties of neighboring genes that affect and are affected by mutations of diverse types.
(A) Top row: Properties of neighboring genes that we identify as main determinants of the adaptive potential of a gene given its chromosomal neighborhood. Round corners indicate ‘dynamic’ properties that may be environment-dependent or subject to change over short evolutionary timescales. Bottom row: Different mutation types causing increased expression of a gene. Solid arrows: Effects and interactions shown or suggested by data in this study. Dashed arrows: Other effects and interactions that are likely to exist. Pointed arrowheads indicate a positive effect, T-bar ends indicate a negative effect. A sentence equivalent of each arrow is given in Figure 7—source data 1. As a sum of the above interactions, the adaptive potential of a gene emerges as a system-property. (B) Classification of chromosomal neighborhoods of E. coli genes according to adaptive potential. The chromosomal neighborhood of 4317 genes of E. coli MG1655 was assessed using published information on the position of promoters and terminators (Conway et al., 2014) and gene essentiality (see Methods for details). Numbers in parentheses = genes belonging to respective sets or intersections of sets. Genes in the intersection of all three circles (boldface) are expected to have the highest adaptive potential based on their chromosomal neighborhood. Loci A-E of this study are placed in the respective areas of the diagram.
-
Figure 7—source data 1
Extended legend of Figure 7A explaining each arrow and what loci are affected by respective interactions.
- https://doi.org/10.7554/eLife.25100.034
-
Figure 7—source data 2
List of E. coli genes included in the analysis shown in Figure 7B and their assignment to the three sets shown by colored circles.
- https://doi.org/10.7554/eLife.25100.035
Tables
Table 1
Differences in amplification cost indicated by the extinction risk of populations with amplifications. Populations with amplifications of higher (strain BΔIS5I) or lower (strain E) expected cost of amplifications have a higher or lower risk of becoming extinct, respectively. n = initial number of replicate populations used for analysis (n = 285 includes replicate evolution experiments to increase statistical power), ‘Extinct’ and ‘Rescued’ = numbers of extinct and rescued populations with amplifications as indicated by (transiently) increased CFP fluorescence (see Materials and methods), sample odds ratio compared to strain B, p-values: 2 × 2 Fisher’s exact test.
| n | Strain | Populations with (transiently) increased CFP fluorescence | Sample Odds Ratio | P-value | |
|---|---|---|---|---|---|
| Extinct | Rescued | ||||
| 95 | BΔIS5I | 12 | 5 | 10.1 | 10−4 |
| 95 | B | 18 | 76 | 1 (ref) | – |
| 95 | E | 0 | 95 | 0 | 10−6 |
| 285 | A | 8 | 4 | 5.8 | 10−3 |
| 285 | B | 58 | 168 | 1 (ref) | – |
| 285 | C | 0 | 1 | 0 | n.s. |
| 285 | D | 0 | 7 | 0 | n.s. |
Additional files
-
Supplementary file 1
Population trajectories.
Set of 96-panel figures showing OD and OD-normalized fluorescence values for each population in each of 18 evolution experiments.
- https://doi.org/10.7554/eLife.25100.036
-
Supplementary file 2
Source data populations.
Excel table containing information on survival, fluorescence phenotypes, sequences, and mutation types of every experimental population, as well as information on which populations where used for further investigation (plasmid reconstruction etc.). This contains the source data of Figures 2AC, 3AB, 5CD, Table 1, and respective Figure Supplements.
- https://doi.org/10.7554/eLife.25100.037
-
Supplementary file 3
Strains, plasmids, oligonucleotides.
Excel table with all strains, plasmids and oligonucleotides used in this study
- https://doi.org/10.7554/eLife.25100.038
-
Source code 1
Compressed file containing Matlab scripts and OD/YFP/CFP plate-reader raw data files of evolution experiments.
- https://doi.org/10.7554/eLife.25100.039
Download links
A two-part list of links to download the article, or parts of the article, in various formats.
Downloads (link to download the article as PDF)
Open citations (links to open the citations from this article in various online reference manager services)
Cite this article (links to download the citations from this article in formats compatible with various reference manager tools)
Complex chromosomal neighborhood effects determine the adaptive potential of a gene under selection
eLife 6:e25100.
https://doi.org/10.7554/eLife.25100


