HIF-1α is required for disturbed flow-induced metabolic reprogramming in human and porcine vascular endothelium
- The University of Chicago, United States
- Northeastern University, United States
- University of Virginia, United States
Figures
Figure 1 with 8 supplements
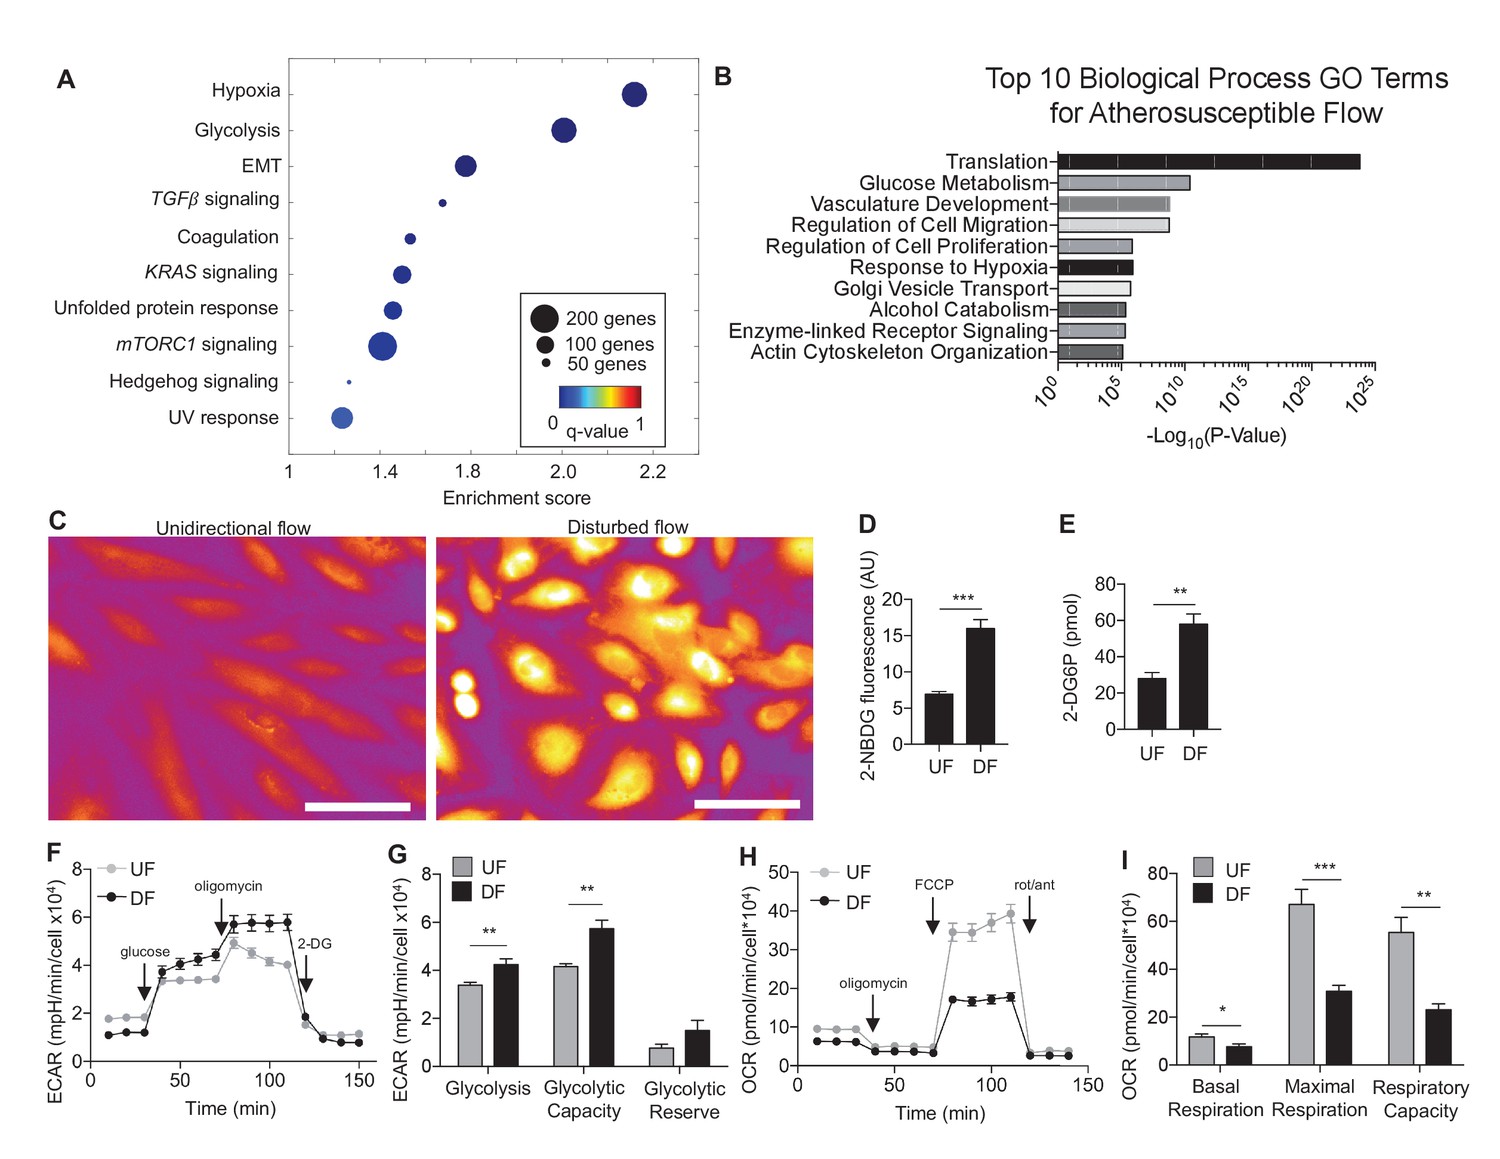
Disturbed flow induces a glycolytic phenotype and inhibits mitochondrial function.
Primary HAECs were subjected to either unidirectional flow (UF) or disturbed flow (DF) for 24 hr before cell lysates were collected. (A) Gene set enrichment analysis of RNA-seq dataset of top 10 pathways enriched under DF compared to UF. (B) Top 10 gene ontology pathways of differentially expressed genes as calculated via DAVID. Source data of differentially expressed genes available online. (C) HAECs are treated with UF or DF for 48 hr before staining with 2-NBDG. Under DF, the cells are markedly brighter and are quantified D (five random fields, 100 cells per condition). (E) Intracellular glucose uptake can also be quantified with an uptake assay using 2-DG6P. Under DF, there is increased glucose uptake (n = 4). (F) HAECs are treated with either UF or DF for 48 hr before re-plating in a Seahorse XFe24 analyzer and assessed with a glycolysis stress test or (H) mitochondrial stress test. In (F), arrows indicate injection of glucose, oligomycin A, and 2-deoxyglucose (2DG). (G) Under glycolysis stress test, HAECs treated with DF demonstrate increased glycolysis and glycolytic capacity when compared against UF (n = 10). (H) Arrows denote addition of oligomycin, carbonyl cyanide-4-(trifluoromethoxy)phenylhydrazone (FCCP), and rotenone/antimycin. (I) Under mitochondrial stress test, HAECs treated with DF have decreased basal respiration, maximal respiration, and respiratory capacity when compared against UF (n = 7). *p<0.05; **p<0.005; ***p<0.0005 as determined by Student’s t-test. Data represent mean ± SEM. Bar is 10 microns. Source data for RNA-seq differentially expressed genes can be found online: DOI: https://doi.org/10.5281/zenodo.260122 (Wu et al., 2017b).
-
Figure 1—source data 1
Differentially expressed genes after UF or DF and RNAseq.
HAECs were treated with either UF or DF for 24 hr prior to cell lysis and total RNA sequencing.
- https://doi.org/10.7554/eLife.25217.004
-
Figure 1—source data 2
Gene sets for hypoxia and glycolysis as ranked by GSEA of HAECs under disturbed flow.
(A) The gene set ‘HALLMARK_HYPOXIA’ ranked by GSEA of HAECs under disturbed flow. ‘Rank Metric Score’ is the signal-to-noise ratio for each gene used to position the gene in the ranked list. ‘Rank in Gene List’ refers to the position of the gene in the ranked list of all genes present in the RNAseq dataset. The ‘Running Enrichment Score’ is the enrichment score for this set at this point in the ranked list of genes. (B) The gene set ‘HALLMARK_GLYCOLYSIS’ ranked by GSEA of HAECs under disturbed flow. ‘Rank Metric Score’ is the signal-to-noise ratio for each gene used to position the gene in the ranked list. ‘Rank in Gene List’ refers to the position of the gene in the ranked list of all genes present in the RNAseq dataset. The ‘Running Enrichment Score’ is the enrichment score for this set at this point in the ranked list of genes.
- https://doi.org/10.7554/eLife.25217.005
Figure 1—figure supplement 1
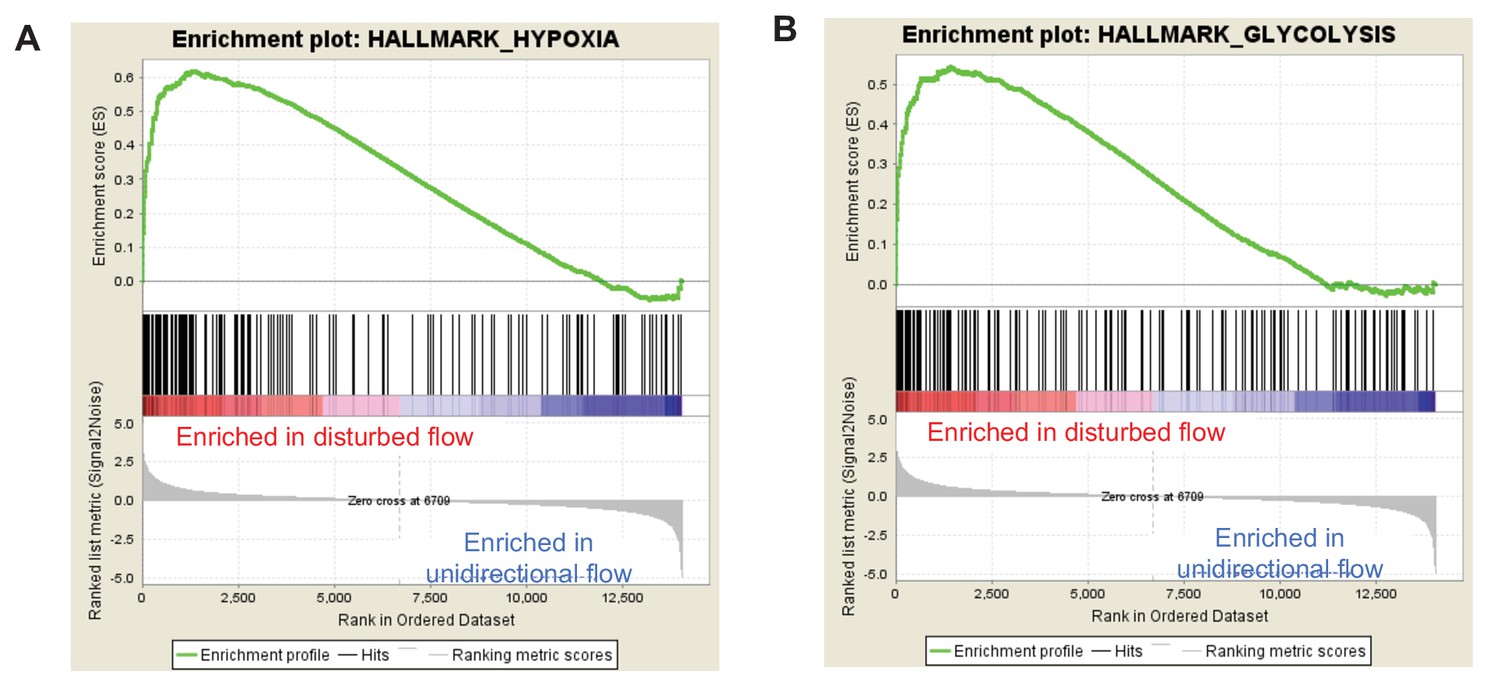
Gene set enrichment analysis (GSEA) enrichment plots for the hypoxia and glycolysis gene sets in unidirectional vs disturbed flow in HAECs.
HAECs were subjected to UF or DF for 24 hr before RNA isolation and total RNA sequencing (RNAseq). Genome-wide expression analysis of the RNAseq data was performed using gene set enrichment analysis (GSEA) software version 2.2.4 available from the Broad Institute (http://www.broadinstitute.org/gsea/downloads.jsp). The GSEA algorithm calculates an enrichment score reflecting the degree of overrepresentation at the top or bottom of the ranked list of the genes included in a gene set in a ranked list of all genes present in the RNAseq dataset. (TOP) A positive enrichment score (ES) indicates gene set enrichment at the top of the ranked list; a negative ES indicates gene set enrichment at the bottom of the ranked list. The final enrichment score for a set is the maximum deviation from zero encountered for that set. (MIDDLE) The location of the hypoxia or glycolytic genes in the ranked set of all genes. The ‘Rank Metric Score’ is the signal-to-noise ratio for each gene used to position the gene in the ranked list. (BOTTOM) The distribution of the rank metric score across all genes present in the expression dataset. The gene set collection used was the h.all.v5.1.symbols.gmt [Hallmarks] gene sets database. The analysis demonstrates that known (A) hypoxia genes and (B) many glycolysis enzymes are positively enriched in the disturbed flow sample.
Figure 1—figure supplement 2

Gene set enrichment analysis of RNA-seq dataset of top 10 pathways enriched under unidirectional flow compared to disturbed flow.
Primary HAECs were subjected to either UF or DF for 24 hr before cell lysates were collected.
Figure 1—figure supplement 3

Gene ontology analysis of top 10 biological processes of differentially expressed genes under unidirectional flow using DAVID.
Primary HAECs were subjected to either UF or DF for 24 hr before cell lysates were collected.
Figure 1—figure supplement 4
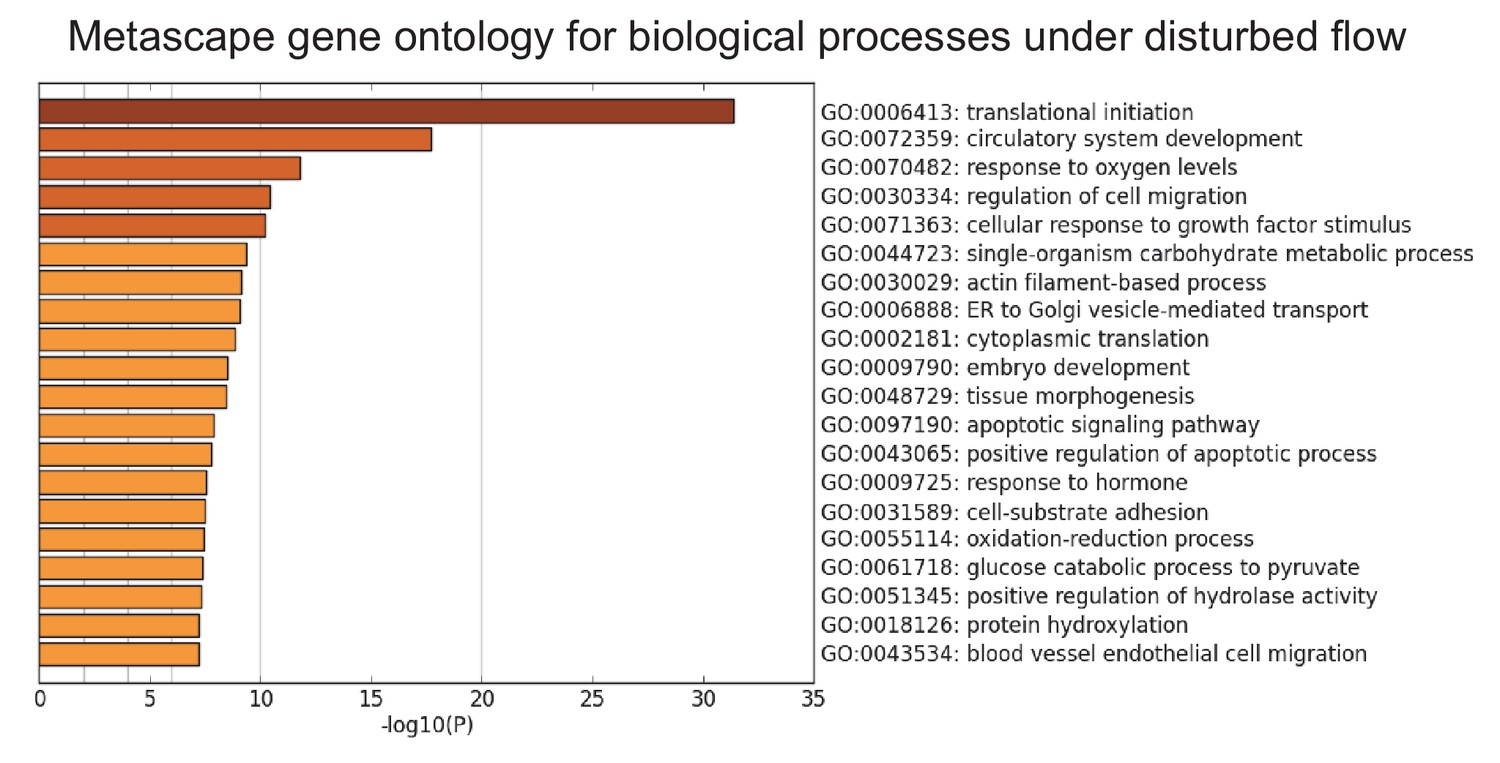
Gene ontology analysis of top biological processes of differentially expressed genes under DF by Metascape.
Primary HAECs were subjected to either UF or DF for 24 hr before cell lysates were collected.
Figure 1—figure supplement 5
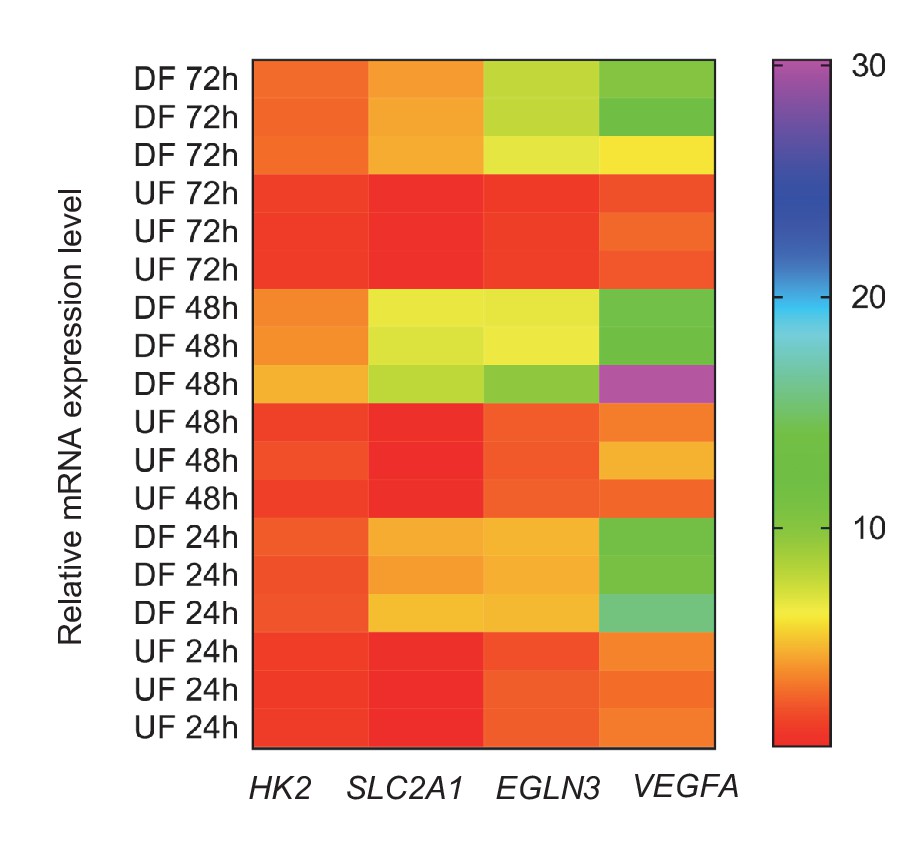
Persistence of glycolytic and hypoxia genes under disturbed or unidirectional flow.
HAECs were subjected to either DF or UF for 24, 48, or 72 hr prior to cell lysis, RNA purification, and qRT-PCR. Fold change of expression of HK2, SLC2A1, EGLN3, and VEGFA, relative to cells not treated with flow at each time point, are given above according to the color-code legend (n = 3 for each time point and each condition).
Figure 1—figure supplement 6
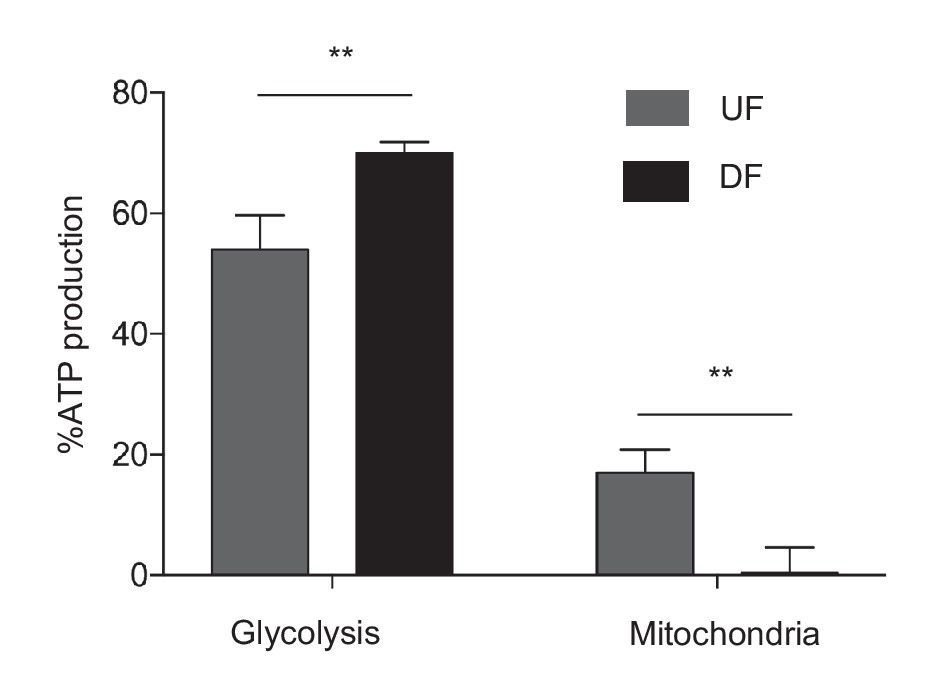
Mitochondrial ATP production is dependent on flow.
HAECs were subjected to either DF or UF for 48 hr. 20,000 cells were then reseeded in either media, media with 2-deoxyglucose, or rotenenone and antimycin. The ATP production was then quantified with a luciferase assay (n = 4 for each condition, technical replicates). DF ATP production comes almost exclusively from glycolysis, compared to UF, which uses mitochondria for a portion (~17%) of ATP production.
Figure 1—figure supplement 7
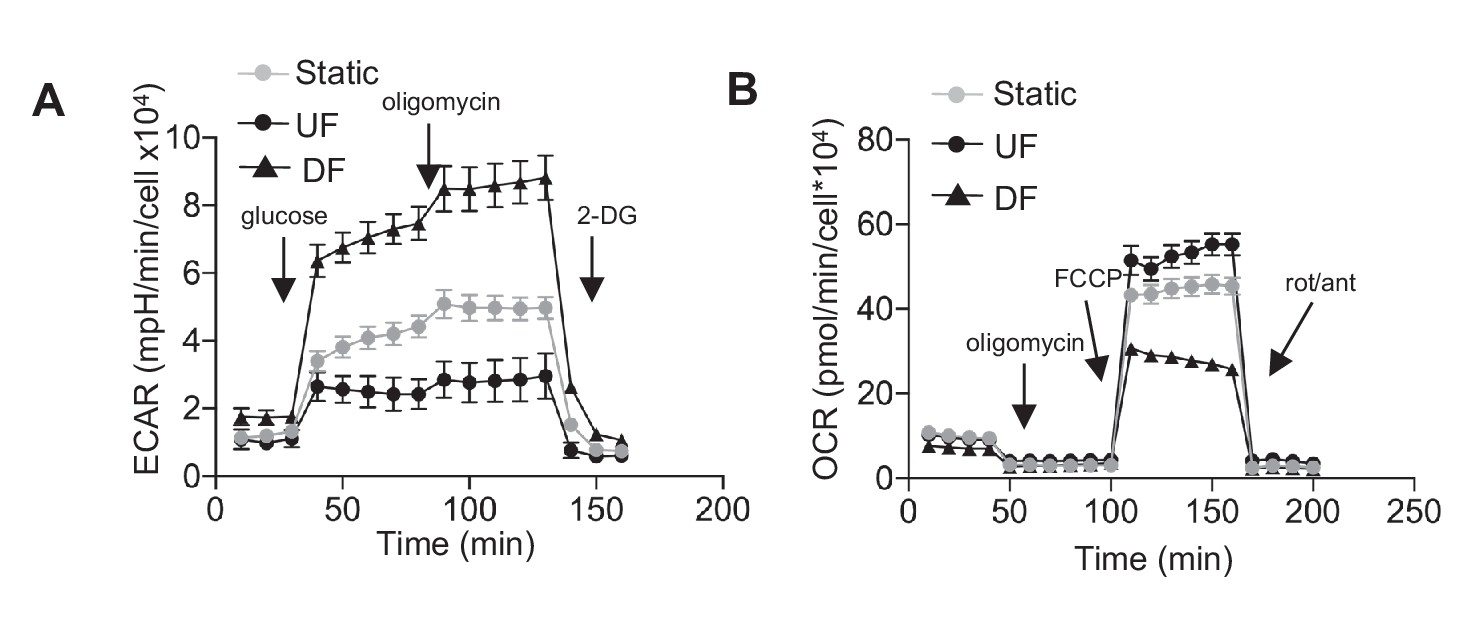
Glycolysis stress test and mitochondria stress test for HAEC after 48 hr of static, unidirectional flow, and disturbed flow.
In (A), arrows indicate injection of glucose, oligomycin A, and 2-deoxyglucose (2DG) (n = 6 for each data point). (B) Arrows denote addition of oligomycin, carbonyl cyanide-4-(trifluoromethoxy)phenylhydrazone (FCCP), and rotenone/antimycin (n = 6 for each data point).
Figure 1—figure supplement 8
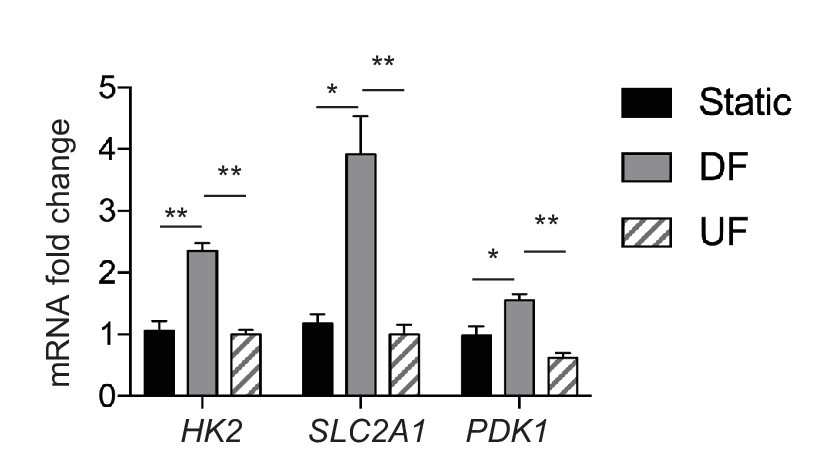
Comparison of glycolytic gene expression under disturbed flow, unidirectional flow, and static conditions.
HAECs were subjected to either no flow (static), DF or UF for 48 hr prior to cell lysis, RNA purification, and qRT-PCR. Fold change of expression of HK2, SLC2A1, and PDK1 are shown (relative to static) (n = 3). *p<0.05; **p<0.005.
Figure 2 with 2 supplements
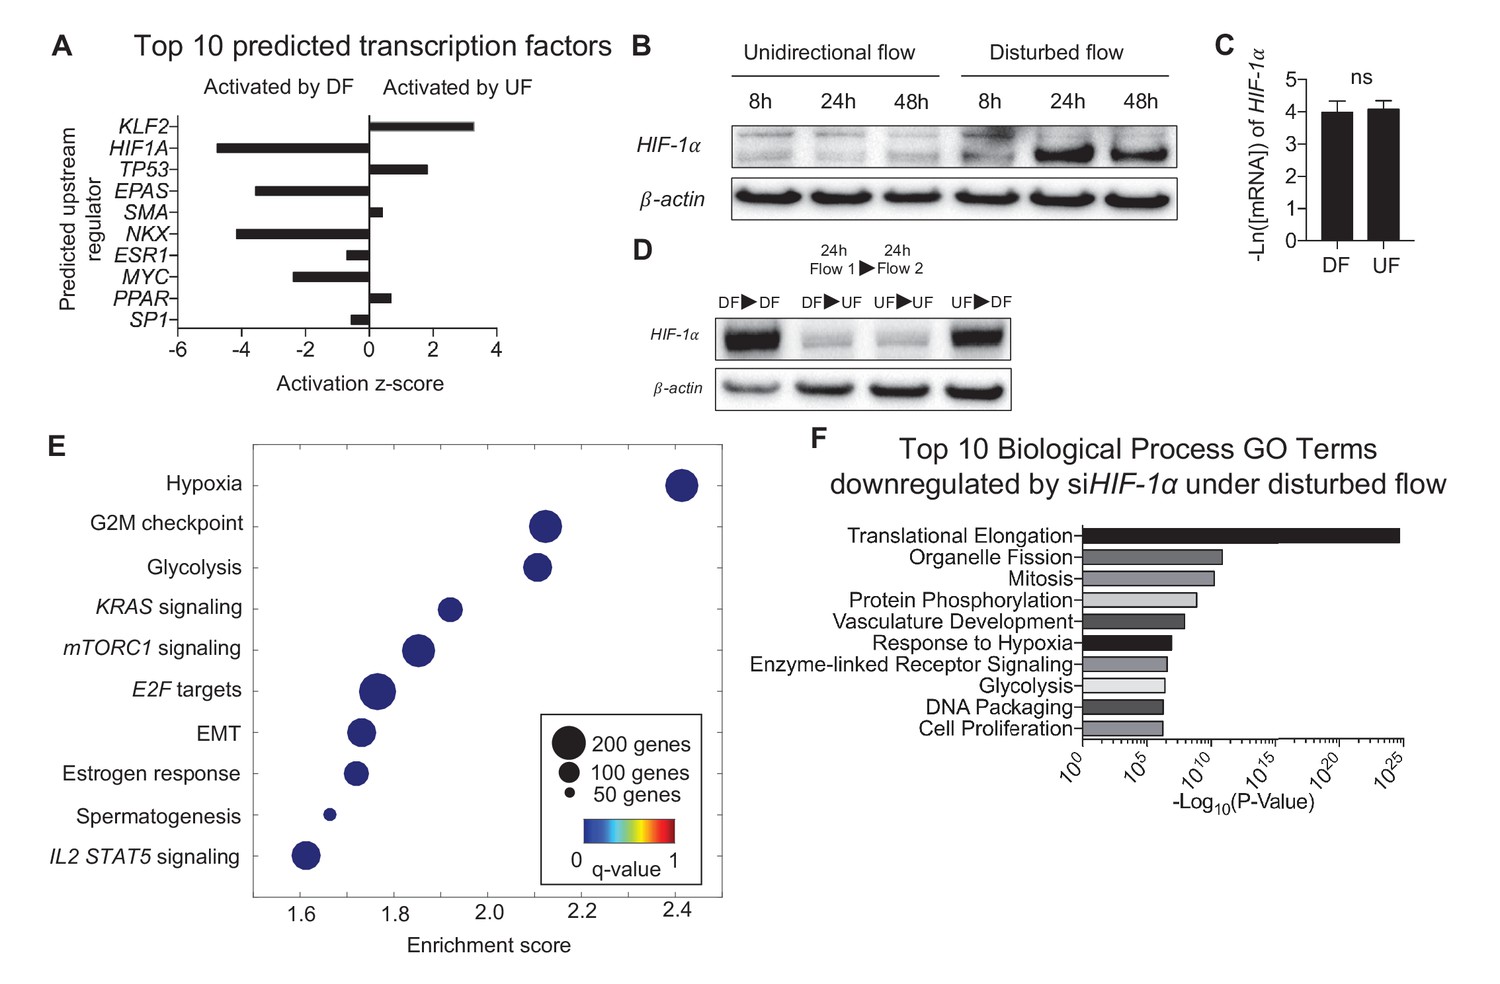
Disturbed flow induces HIF-1α expression, which accounts for a major portion of the differentially expressed genes under DF.
Primary HAECs were subjected to either UF or DF for 24 hr before samples were collected for RNA-seq. (A) Using Ingenuity Pathway Analysis, the RNA-seq data was analyzed for transcription factor predictions. The top two predicted transcription factors are KLF2 (upregulated under UF) and HIF-1α (upregulated under DF), as judged by activation z-score. (B) Western blot of time course of HAECs subjected to UF or DF. HIF-1α starts to appear around 8 hr under disturbed flow. (C) qPCR quantification of HIF-1α under 48 hr of DF or UF (n = 4). (D) HAECs were subjected to either DF or UF for 24 hr, then either UF or DF, respectively, for 24 hr, before lysates were collected. The expression of HIF-1α is reversible. (E) HAECs were treated with either non-targeting siRNA or siHIF-1α for 24 hr before being subjected to AS flow for 48 hr. The cell lysates were then collected and sent for total RNA sequencing. Gene set enrichment analysis of pathways shows that hypoxia and glycolysis are among the top three pathways that are modulated by HIF-1α knockdown. (F) Gene ontology pathways of the differentially expressed genes downregulated by HIF-1α knockdown also demonstrate that metabolic changes via glycolysis is one of the most downregulated pathways. Source data of differentially expressed genes available online. Significance determined by Student’s t-test. Data represent mean ± SEM. Source data for RNA-seq differentially expressed genes can be found online: DOI: https://doi.org/10.5281/zenodo.260120 (Wu et al., 2017a).
-
Figure 2—source data 1
Target genes in RNAseq dataset of predicted transcription factors for HAECs treated with UF and DF, by IPA.
Differentially expressed genes from the UF/DF RNAseq data set were used. The Upstream Regulator is the predicted molecule or transcription factor which regulates the target molecules. The Predicted Activation State is the direction in which the Upstream Regulator is expressed under UF. The activation z-score statistic is a weighted sum of activating and inhibiting interactions on a given gene set. The overlap p‐value measures whether there is a statistically significant overlap between the dataset genes and the curated genes that are regulated by the Upstream Regulator. It is calculated using Fisher’s Exact Test.
- https://doi.org/10.7554/eLife.25217.015
-
Figure 2—source data 2
Differentially expressed genes after DF and siHIF-1α and RNAseq.
HAECs were treated with siHIF-1α or non-targeting siRNA (SC) for 24 hr prior to 48 hr of DF prior to cell lysis and total RNA sequencing.
- https://doi.org/10.7554/eLife.25217.016
-
Figure 2—source data 3
Gene sets for hypoxia and glycolysis as ranked by GSEA of HAECs under disturbed flow and treated with siRNA targeted against HIF-1α.
(A) The gene set ‘HALLMARK_HYPOXIA’ ranked by GSEA of HAECs under disturbed flow and treated with control siRNA. ‘Rank Metric Score’ is the signal-to-noise ratio for each gene used to position the gene in the ranked list. ‘Rank in Gene List’ refers to the position of the gene in the ranked list of all genes present in the RNAseq dataset. The ‘Running Enrichment Score’ is the enrichment score for this set at this point in the ranked list of genes. (B) The gene set ‘HALLMARK_GLYCOLYSIS’ ranked by GSEA of HAECs under disturbed flow and treated with control siRNA. ‘Rank Metric Score’ is the signal-to-noise ratio for each gene used to position the gene in the ranked list. ‘Rank in Gene List’ refers to the position of the gene in the ranked list of all genes present in the RNAseq dataset. The ‘Running Enrichment Score’ is the enrichment score for this set at this point in the ranked list of genes.
- https://doi.org/10.7554/eLife.25217.017
Figure 2—figure supplement 1
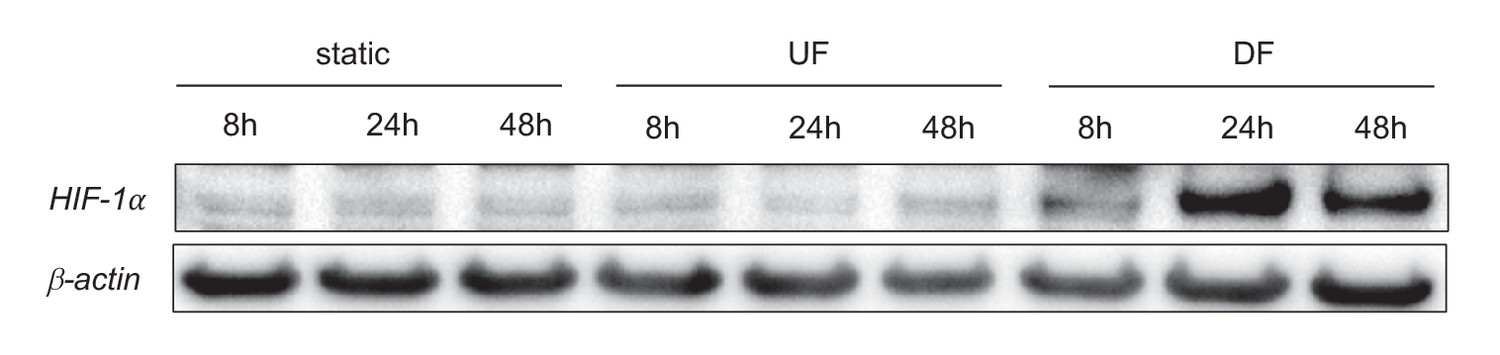
HIF-1 under static, unidirectional flow, and disturbed flow.
HAECs were treated with either UF or DF, or no flow for 8, 24, or 48 hr prior to cell lysis and Western blotting.
Figure 2—figure supplement 2

Gene set enrichment analysis (GSEA) for the hypoxia and glycolysis gene sets in disturbed flow with siRNA targeted towards HIF-1 or control in HAECs.
HAECs were treated with control siRNA or siRNA targeted towards HIF-1α for 24 hr prior to 48 hr of DF, followed by RNA isolation and total RNA sequencing (RNAseq). Genome-wide expression analysis of the RNAseq data was performed using gene set enrichment analysis (GSEA) software version 2.2.4 available from the Broad Institute (http://www.broadinstitute.org/gsea/downloads.jsp). The GSEA algorithm calculates an enrichment score reflecting the degree of overrepresentation at the top or bottom of the ranked list of the genes included in a gene set in a ranked list of all genes present in the RNAseq dataset. (TOP) A positive enrichment score (ES) indicates gene set enrichment at the top of the ranked list; a negative ES indicates gene set enrichment at the bottom of the ranked list. The final enrichment score for a set is the maximum deviation from zero encountered for that set. (MIDDLE) The location of the hypoxia or glycolytic genes in the ranked set of all genes. The ‘Rank Metric Score’ is the signal-to-noise ratio for each gene used to position the gene in the ranked list. (BOTTOM) The distribution of the rank metric score across all genes present in the expression dataset. The gene set collection used was the h.all.v5.1.symbols.gmt [Hallmarks] gene sets database. The analysis demonstrates that known (A) hypoxia genes and (B) many glycolysis enzymes are positively enriched in the control siRNA sample.
Figure 3 with 2 supplements
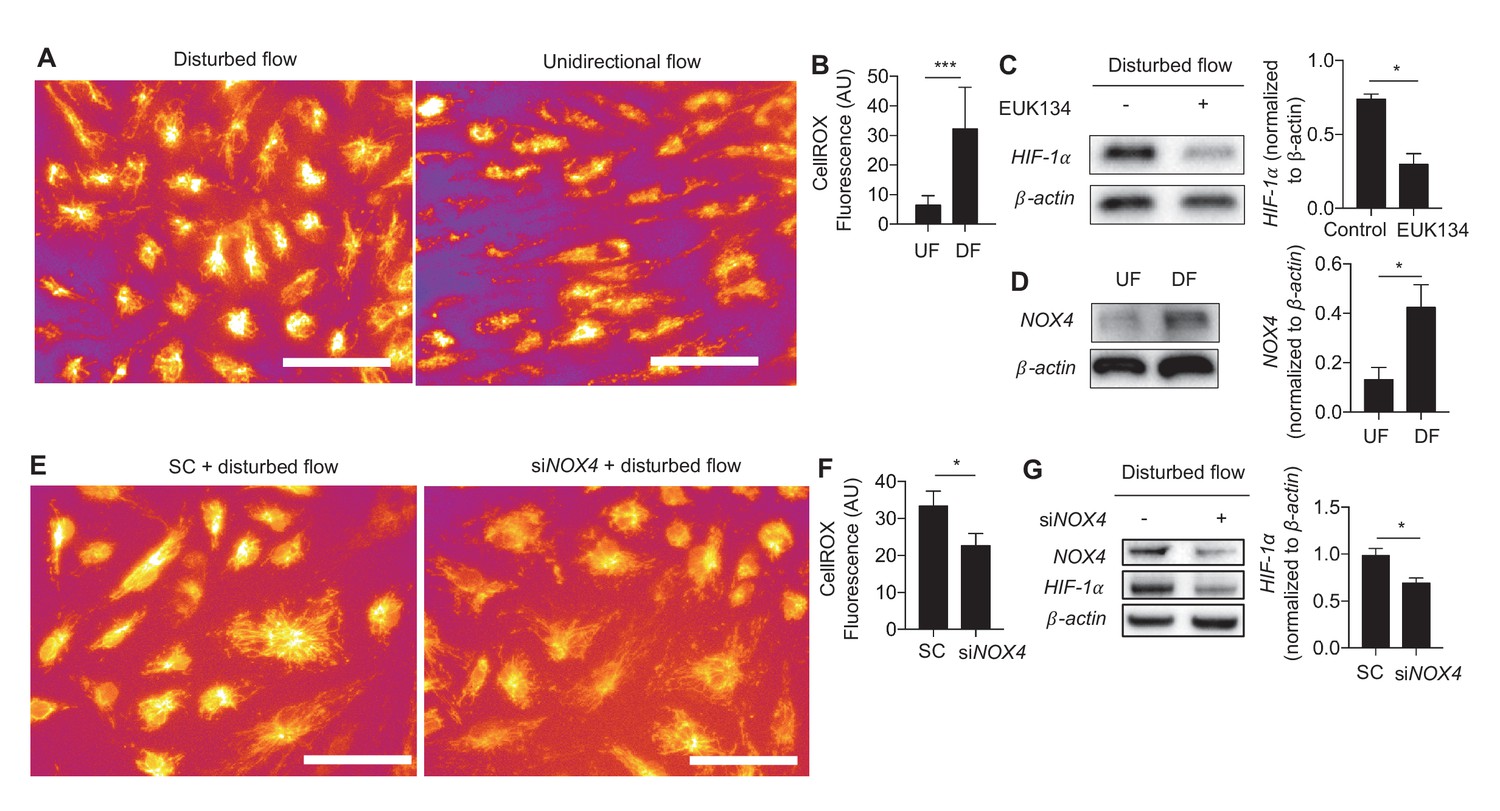
Generation of ROS and NOX4 are required for disturbed flow-induced stabilization of HIF-1α.
(A) HAECs were subjected to either UF or DF for 48 hr before staining for reactive oxygen species with CellROX orange dye (5 μM). (B) The cells were segmented using the fluorescence channel and the background intensity subtracted before calculating the average fluorescent intensity per cell (n = 50 per condition). (C) HAECs were subjected to DF for 24 hr and simultaneously treated with EUK134 or DMSO. The cells were then lysed and Western blotted for HIF-1α and β-actin. Treatment with EUK134 under DF reduces HIF-1α (n = 4). (D) After 24 hr of either UF or DF, cell lysates were collected for Western blot for NOX4 (n = 4). HAECs were treated with siRNA targeted towards NOX4 (siNOX4) or non-targeting control (SC) prior to 48 hr of DF followed by either (E) staining for ROS (CellRox, 5 μM), quantified in (F) (n = 50), or cell lysis and Western blotting (G). NOX4 knockdown reduces HIF-1α under DF (n = 4). *p<0.05; **p<0.005; ***p<0.0005 as determined by Student’s t-test. Data represent mean ± SEM. Bar is 10 microns.
Figure 3—figure supplement 1
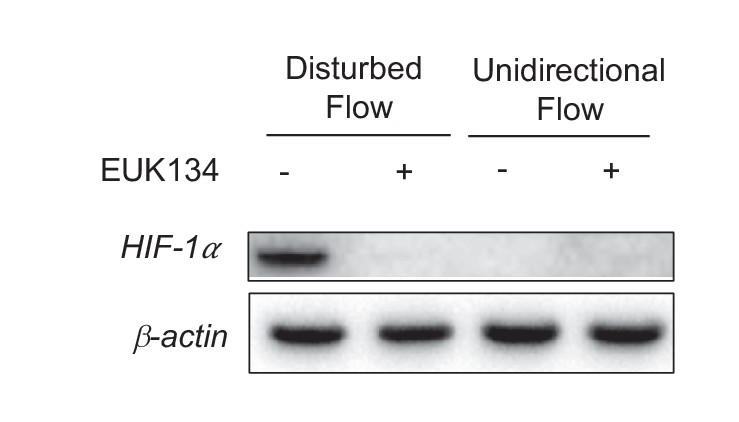
EUK134 has no effect on HIF-1 under UF.
HAECs were subjected to UF or DF for 24 hr, with either DMSO or EUK134 at 1 mM.
Figure 3—figure supplement 2

HIF-1 and NOX4 kinetics under DF.
(A) HAECs were subjected to UF for 24 hr prior to switching to DF for the indicated times. HIF-1 reaches maximal induction at 4 hr before stabilizing at a slightly lower level. NOX4 increases steadily with increasing duration of disturbed flow. (B) HAECs were treated with either non-targeting siRNA (-) or siRNA targeted towards NOX4 (+) for 24 hr before subjecting to DF for 4 hr. Reducing NOX4 at early time points, even when NOX4 is not abundant, will reduce HIF-1 expression.
Figure 4 with 2 supplements
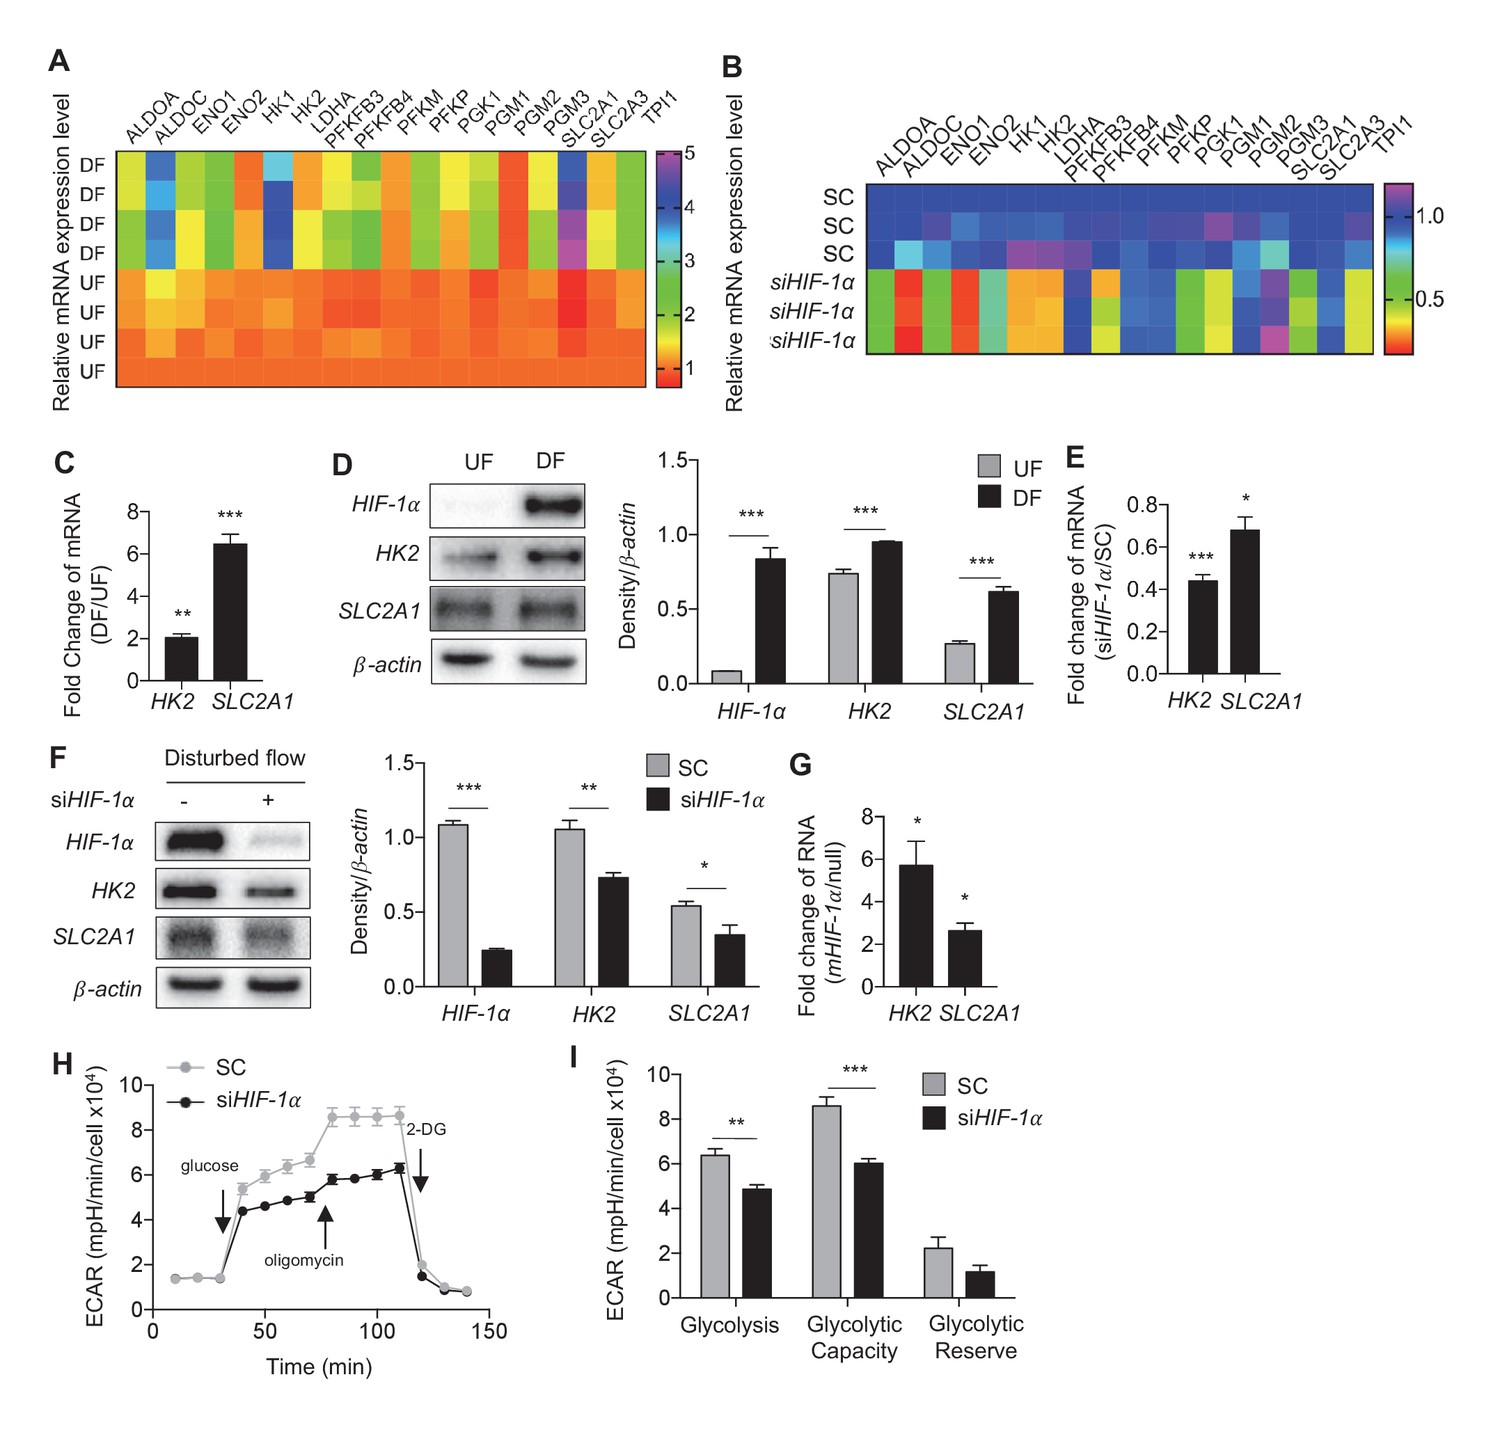
Disturbed flow-induced HIF-1α stabilization is required for the glycolytic phenotype.
(A) Expression profile of all significantly regulated glycolytic enzymes in the RNAseq data set of UF vs DF (flow-seq). Four biological replicates for each condition, and three averaged technical replicates. SLC2A1 and HK2 are the top two enzymes that are upregulated under DF. Relative expression is normalized to UF, last row. HAECs were treated with siRNA for HIF-1α (siHIF-1α) or non-targeting control (SC) for 24 hr before DF for an additional 48 hr. Cell lysates were then collected and sent for total RNA sequencing (siHIF-1α/DF-seq). (B) Expression profile of all significantly regulated glycolytic enzymes in siHIF-1α/DF-seq. Three biological replicates for each condition, and two averaged technical replicates. Relative expression is normalized to SC, first row. (C) SLC2A1 and HK2 upregulated in flow-seq were confirmed with qPCR (n = 4). (D) Western blot and quantification of select glycolytic enzymes (SLC2A1 and HK2) under differential flow after 24 hr (n = 4). HAECs were treated with siHIF-1α or SC for 24 hr before DF for an additional 48 hr before cell lysis and (E) qPCR for HK2 and SLC2A1 (n = 13) or (F) Western blotting/quantification of HIF-1α, HK2, SLC2A1 and β-actin (n = 4). (G) An overexpression vector containing HIF-1α with mutated known prolyl hydroxylase binding amino acids was expressed in HAECs using in vitro transcription for 6 hr before cell lysis and analysis of HIF-1α, SLC2A1 (β-actin serves as a loading control) and qRT-PCR analysis for glycolytic genes SLC2A1 and HK2 at 50 ng dose (n = 3). (H) HAECs were first treated with either SC or siHIF-1α before being subjected to DF for 48 hr. The cells then underwent a glycolysis stress test. Arrows indicate injection of glucose, oligomycin, and 2-deoxyglucose (2DG). (I) Glycolysis and glycolytic capacity obtained during glycolysis stress test are significantly downregulated by HIF-1α knockdown (n = 10). *p<0.05; **p<0.005; ***p<0.0005 as determined by Student’s t-test. Data represent mean ± SEM.
Figure 4—figure supplement 1
Disturbed flow stabilization of HIF-1 precedes NOX4 abundance.
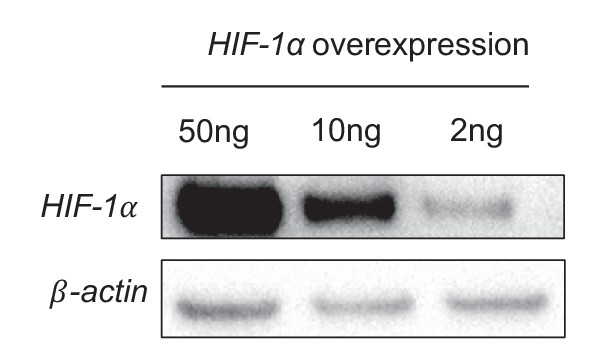
An overexpression vector containing HIF-1α with mutated known prolyl hydroxylase binding amino acids was expressed in HAECs using in vitro transcription for 6 hr before cell lysis and analysis of HIF-1α, SLC2A1 (β-actin serves as a loading control) showing a dose-dependent effect.
Figure 4—figure supplement 2
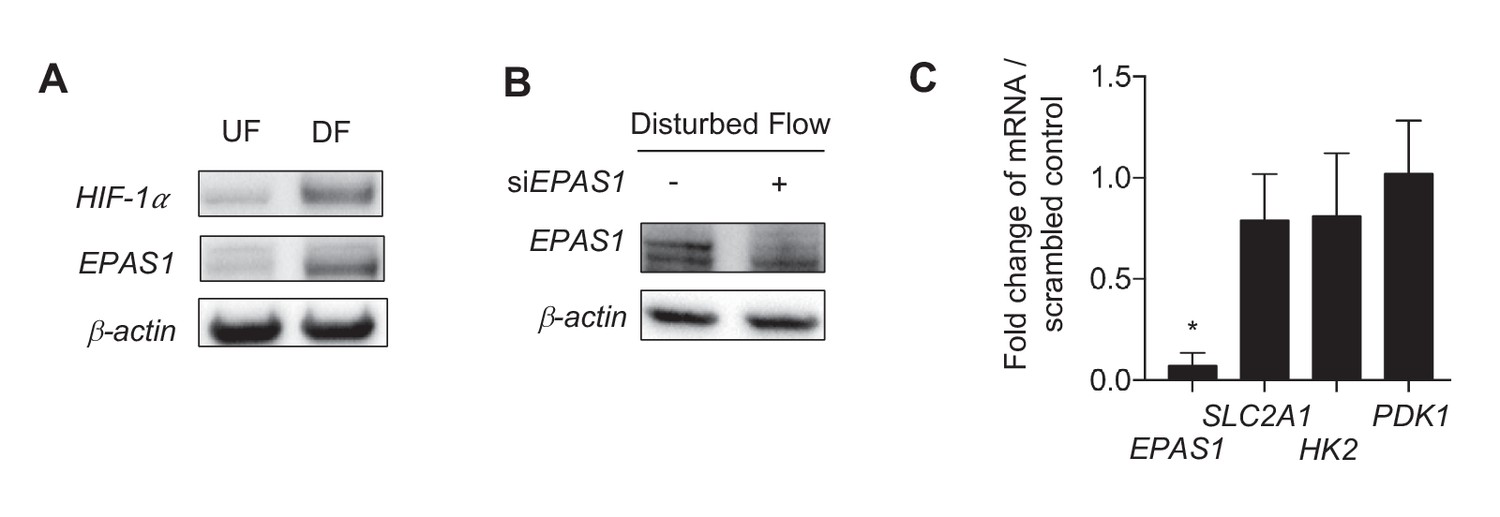
Disturbed flow stabilization of EPAS1 does not contribute to glycolytic gene transcription.
(A) HAECs were subjected to 24 hr of either UF or DF prior to cell lysis and Western blotting. Both HIF-1α and EPAS1 are increased under DF. HAECs were subjected to DF for 24 hr after 24 hr of treatment with either control siRNA or siRNA targeted towards EPAS1 prior to cell lysis, followed by (B) Western blotting or (C) RNA isolation and qRT-PCR. (B) The siRNA is able to reduce EPAS1 under disturbed flow. (C) SLC2A1 and HK2 are unchanged following siEPAS1 treatment and DF. EPAS1 levels are significantly lower (n = 6). *p<0.05.
Figure 5 with 3 supplements

Disturbed flow inhibits mitochondrial respiration via HIF-1α.
(A) HAECs were subjected to either DF for 48 hr following 24 hr treatment with either non-targeting siRNA (SC) or HIF-1a targeted siRNA (siHIF-1α), followed by a mitochondrial stress test. (B) Respiratory parameters (A) are all significantly higher under DF cells treated with siHIF-1α (n = 8). (C) HAECs were subjected to either UF or DF for 48 hr. Glucose oxidation was measured during sequential treatment with UK5099 and BPTES/Etoxomir. Under DF, HAECs use glucose as a larger fraction of the total mitochondrial oxidation (n = 4). HAECs were subjected either 24 hr UF or DF. Western blot (D) and qRT-PCR (E) shows increased PDK1 expression under DF (n = 4 for both). (F) HAECs were subjected to DF for 48 hr following 24 hr treatment with either SC or siHIF-1α. Cell lysates demonstrate reduced PDK1 under siHIF-1α (n = 4). (G) HAECs were subjected to 48 hr of either UF or DF before undergoing a PDH activity dipstick assay. DF reduces PDH activity (n = 4). (H) Under combined siHIF-1α treatment and DF, there is increased PDH activity (n = 4). (I) Under combined siPDK1 treatment and DF, there is increased PDH activity (n = 4). (J) HAECs are treated with either DMSO or DCA (4 mM) and simultaneous DF for 48 hr before mitochondrial stress test. Respiratory parameters are shown in K. There is a signficant increase in maximal respiration and respiratory capacity with DCA treatment (n = 4). (L) HAECs were treated with SC or siPDK1 for 24 hr before DF for 48 hr and subsequent mitochondrial stress test. Respiratory parameters are shown in M (n = 8). *p<0.05; **p<0.005; ***p<0.0005 as determined by Student’s t-test. Data represent mean ± SEM.
Figure 5—figure supplement 1
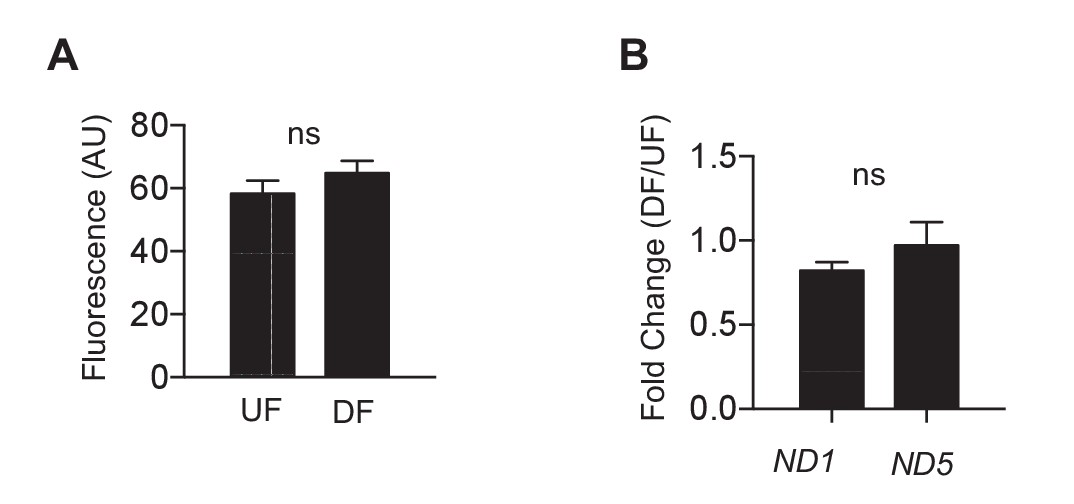
Mitochondrial biogenesis is the same in differential flow.
HAECs were subjected to either DF or UF for 48 hr. (A) After flow, the cells were washed and incubated in mitotracker for 30 min before imaging (n = 50 per condition). (B) After flow, the cells were lysed and RNA harvested before performing qRT-PCR for mitochondrial genes ND1 and ND5 (n = 4).
Figure 5—figure supplement 2
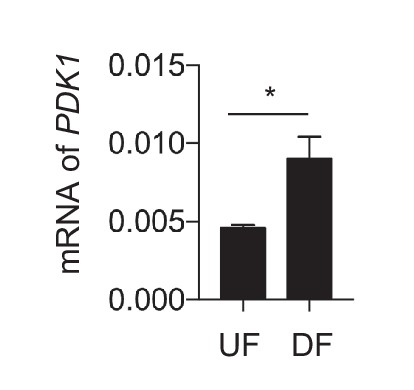
Differential flow regulates PDK1.
HAECs were subjected to either UF or DF for 24 hr prior to cell lysis, RNA purification, and qRT-PCR for PDK1 (n = 4).
Figure 5—figure supplement 3
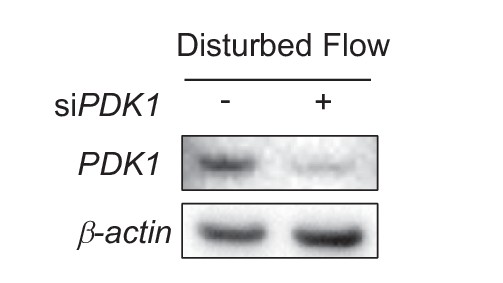
siRNA targeted against PDK1.
HAECs were treated with either control siRNA (-) or siRNA targeted against PDK1 (+) for 24 hr prior to disturbed flow for 48 hr, followed by cell lysis and Western blotting.
Figure 6 with 5 supplements
Disturbed flow-induced metabolic reprogramming is required for expression of inflammatory markers.
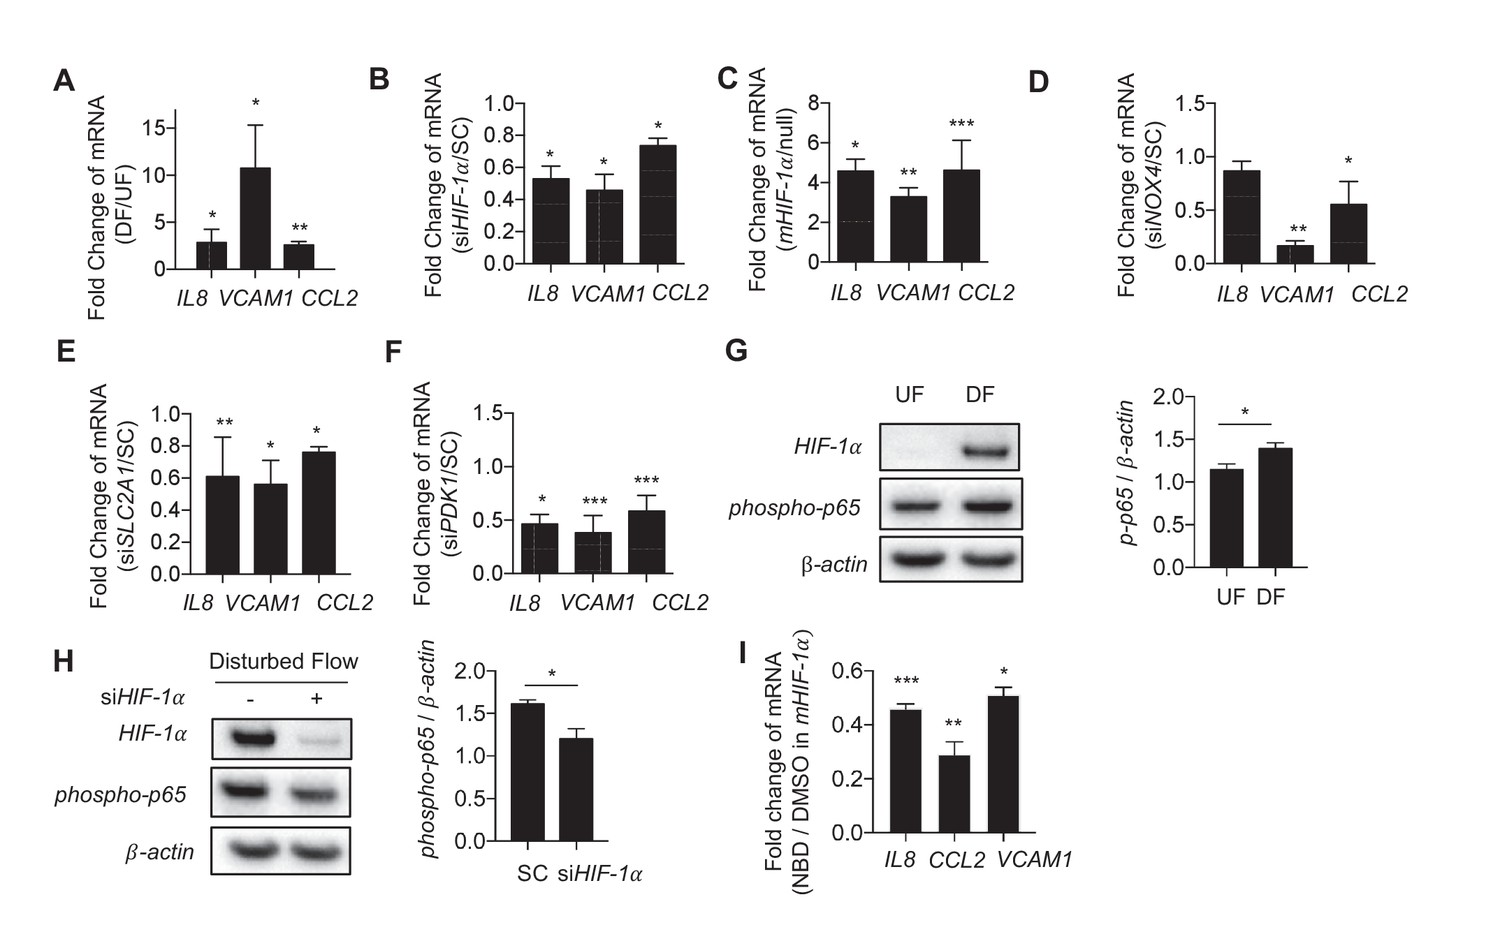
(A) HAECs were treated with either UF or DF for 24 hr prior to lysis, RNA purification, and qRT-PCR for IL8, VCAM1, and CCL2. IL8, VCAM1, and CCL2 are all increased under DF (n = 4). (B) HAECs were treated with either non-targeting siRNA (SC) or siRNA targeting HIF-1α (siHIF-1α) for 24 hr before subjected to DF for 48 hr prior to lysis, RNA purification, and qRT-PCR for IL8, VCAM1, and CCL2. IL8, VCAM1, and CCL2 are all reduced under HIF-1α knockdown (n = 4). (C) HAECs were transfected with either a blank or with stabilized HIF-1α mRNA transcript for 6 hr prior to lysis, RNA purification, and qRT-PCR for IL8, VCAM1, and CCL2. IL8, VCAM1, and CCL2 are all increased under HIF-1α transcription delivery (n = 4). (D) HAECs were treated with either non-targeting siRNA (SC) or siRNA targeting NOX4 (siNOX4) for 24 hr before subjected to DF for 48 hr prior to lysis, RNA purification, and qRT-PCR for IL8, VCAM1, and CCL2. IL8, VCAM1, and CCL2 are all reduced under NOX4 knockdown (n = 4). (E) HAECs were treated with either non-targeting siRNA (SC) or siRNA targeting SLC2A1 (siSLC2A1) for 24 hr before subjected to DF for 48 hr prior to lysis, RNA purification, and qRT-PCR for IL8, VCAM1, and CCL2. IL8, VCAM1, and CCL2 are all reduced under SLC2A1 knockdown (n = 4). (F) HAECs were treated with either non-targeting siRNA (SC) or siRNA targeting PDK1 (siPDK1) for 24 hr before subjected to DF for 48 hr prior to lysis, RNA purification, and qRT-PCR for IL8, VCAM1, and CCL2. IL8, VCAM1, and CCL2 are all reduced under PDK1 knockdown. (G) HAECs were treated with either UF or DF for 24 hr prior to lysis and Western Blotting (n = 4). (H) siHIF-1α treated HAECs were subjected to DF for 48 hr prior to lysis. siHIF-1α significantly reduces phospho-p65 (n = 4). (I) HAECs were treated with 10 μM of NBD for 1 hr prior to HIF-1α overexpression for 6 hr prior to RNA purification and qRT-PCR (n = 4). *p<0.05; **p<0.005; ***p<0.0005 as determined by Student’s t-test. Data represent mean ± SEM.
Figure 6—figure supplement 1
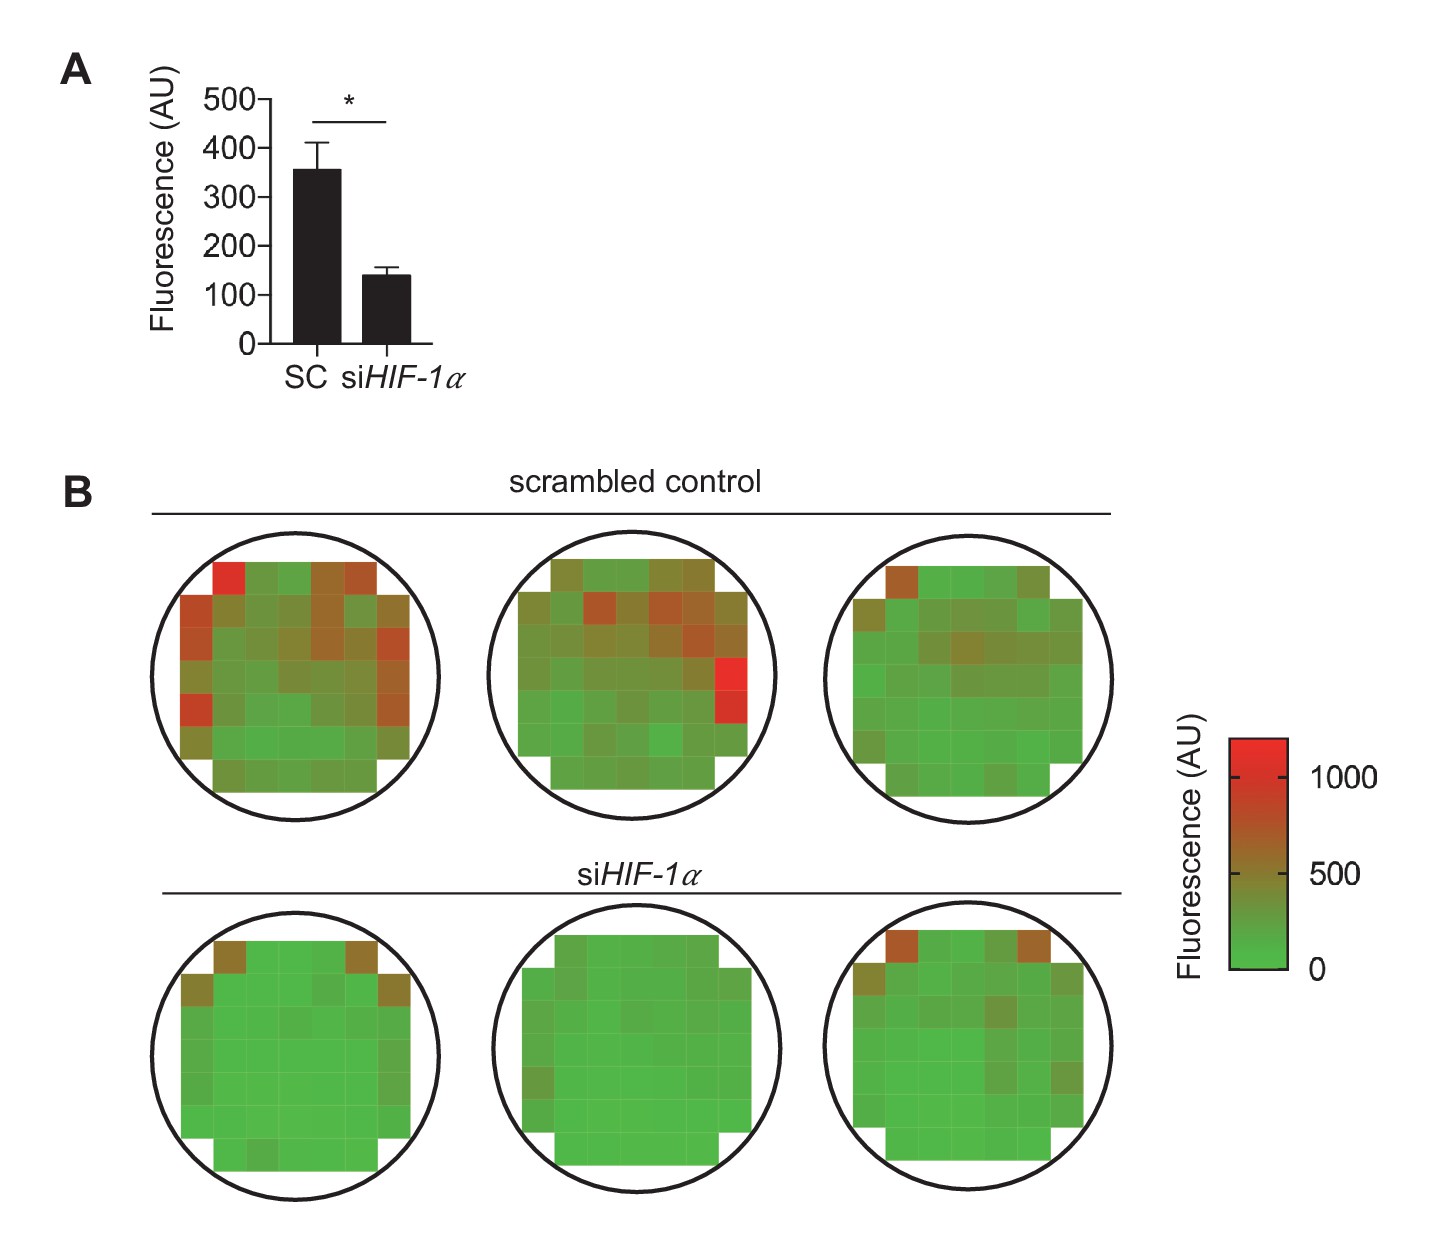
HIF-1 knockdown reduces leukocyte adhesion.
HAECs were subjected to DF for 48 hr after either control siRNA (SC) or siRNA targeted towards HIF-1 treatment for 24 hr. After removal from DF, 5-fold THP-1 cells loaded with 5 µM calcein AM dye for were incubated with the HAECs for 1 hr. The samples were subsequently washed three times with PBS prior to (A) fluorescence counting. (B) Biological replicates and fluorescence intensities of plates are shown (n = 3). *p<0.05.
Figure 6—figure supplement 2
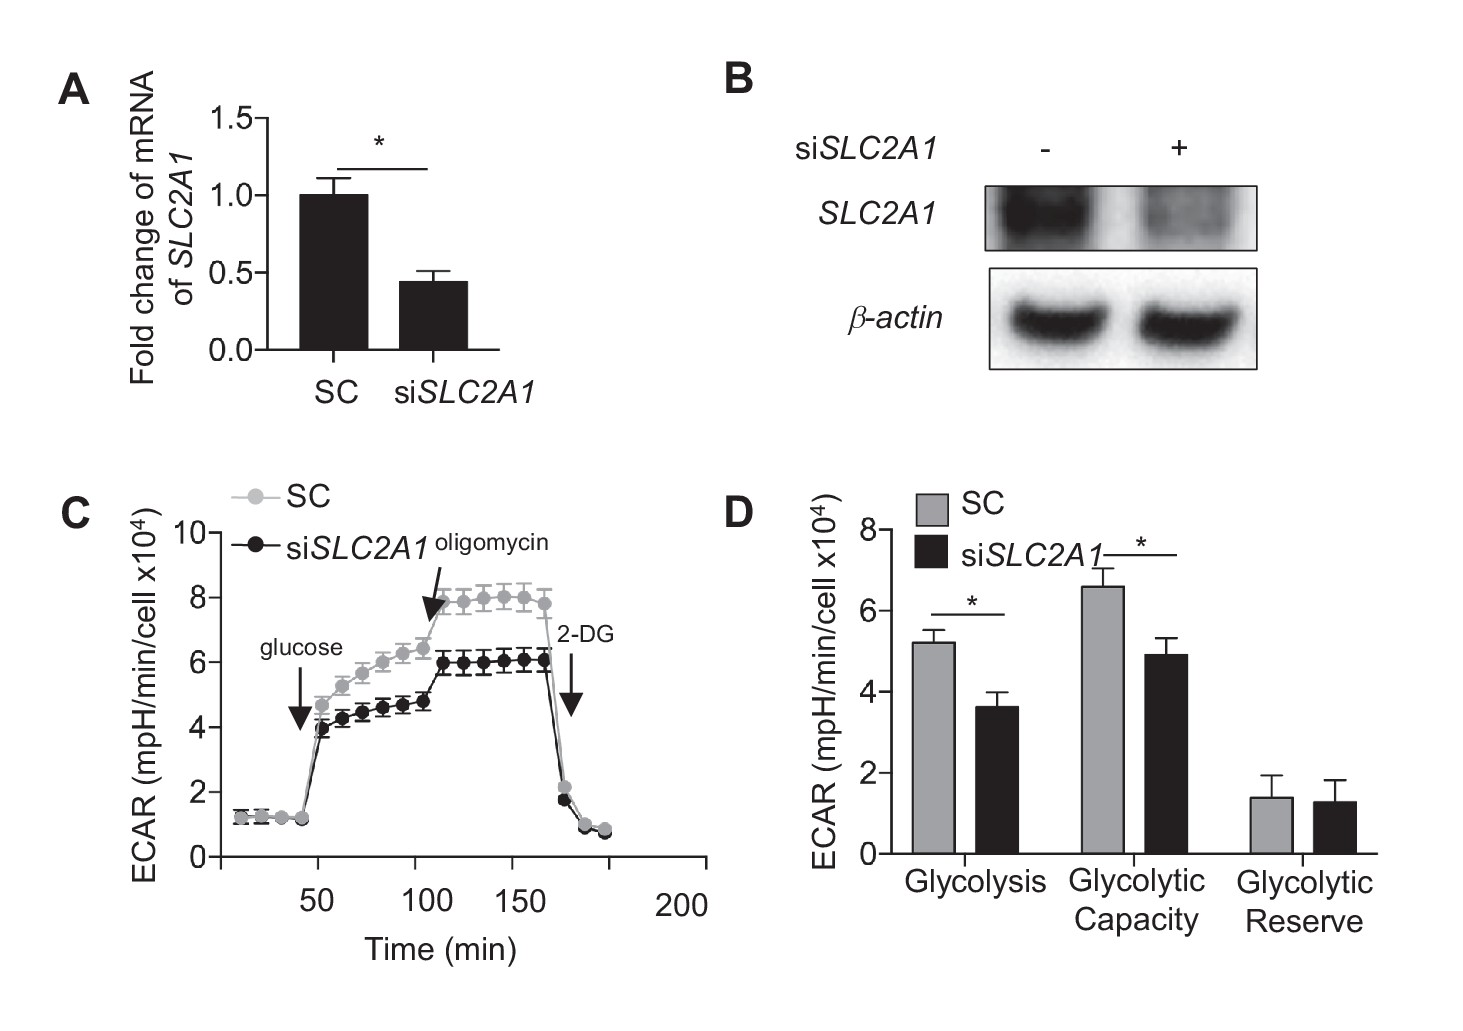
SLC2A1 controls glycolysis in HAECs.
Control siRNA or siRNA targeted against SLC2A1 (50 nM) were incubated with HAECs for 72 hr prior to cell lysis, (A) RNA purification and qRT-PCR for SLC2A1 (n = 4) or (B) Western blotting for SLC2A1. HAECs were treated with either control siRNA or siRNA targeted against SLC2A1 (50 nM) for 24 hr prior to disturbed flow treatment for 48 hr and (C) glycolysis stress test and quantification of glycolysis stress test parameters (D) (n = 5).
Figure 6—figure supplement 3
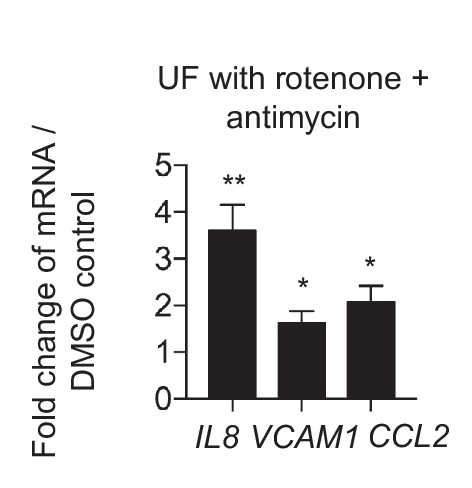
Mitochondrial inhibition increases inflammation.
HAECs were treated with DMSO or rotenone (1 µM) and antimycin (1 µM) and subjected to UF for 24 hr prior to cell lysis, RNA purification, and qRT-PCR (n = 4). *p<0.05; **p<0.005.
Figure 6—figure supplement 4
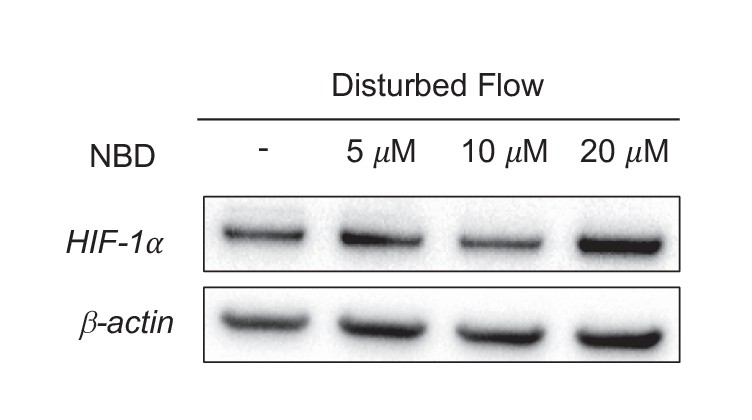
HIF-1 is upstream of NF-κB-induced inflammatory gene transcription.
HAECs were subjected to DF for 24 hr and simultaneously treated with DMSO or NBD prior to cell lysis and Western blotting. There is no reduction in HIF-1 by inhibiting the NF-κB pathway with either of the two compounds.
Figure 6—figure supplement 5
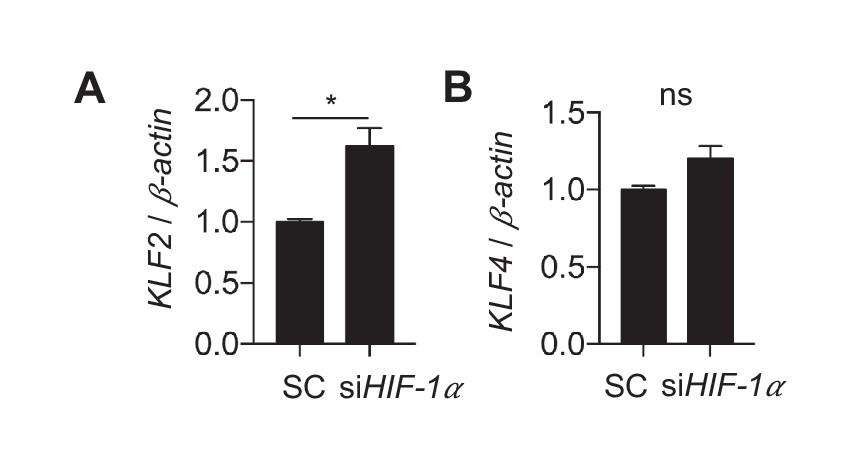
Disturbed flow stabilization of HIF-1 reduces KLF2.
HAECs were treated with either control siRNA or siRNA targeting HIF-1 for 24 hr prior to DF for 48 hr, followed by cell lysis, RNA purification, and qRT-PCR (n = 4). (A) KLF2 is increased under siHIF-1 and disturbed flow. (B) KLF4 is not significant (n = 4, p=0.057).
Figure 7 with 1 supplement
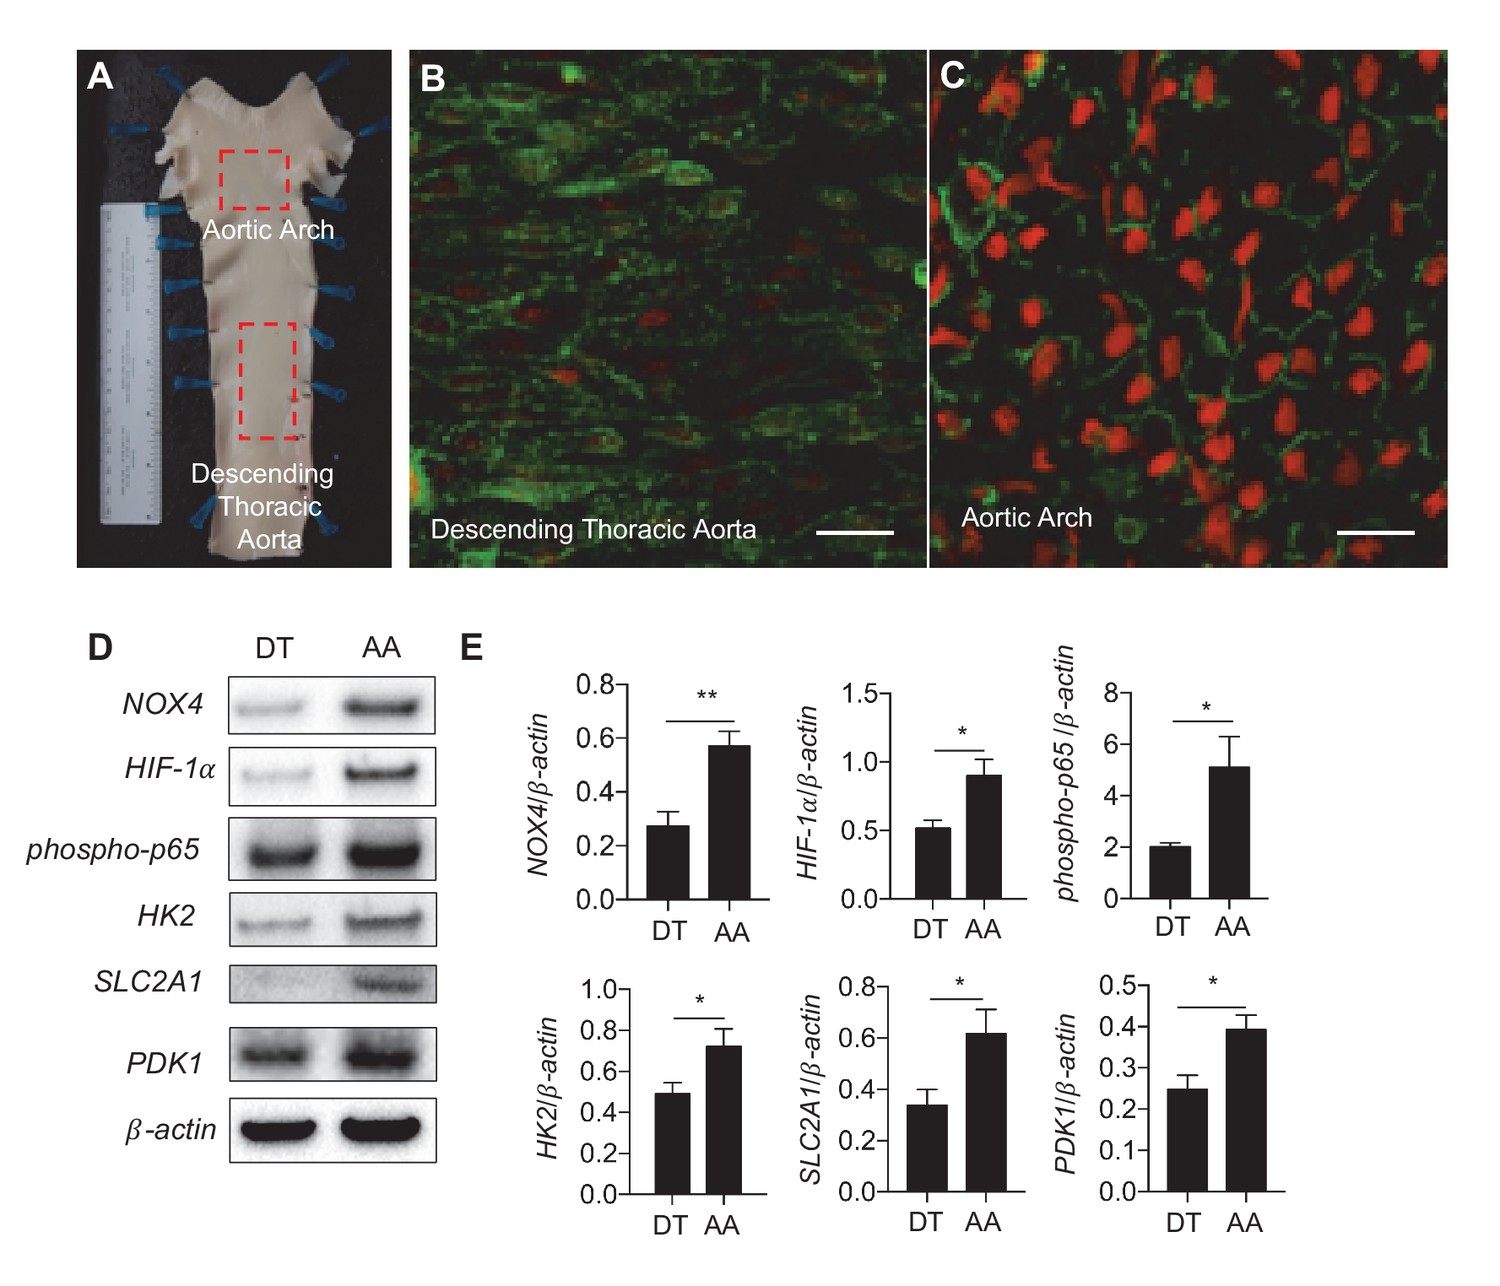
Athero-susceptible regions of aorta express higher levels of ROS and HIF-1α.
(A) Aortas were harvested from pigs due for slaughter in less than 10 min after sacrifice. The inner curvature (B) of the aortic arch (AA) or descending thoracic (DT) aorta (C) was cut out and immediately stained with dihydroethidium bromide (DHE) before fixation in cold 4% paraformaldehyde. The sections were then permeabilized and stained with lectin. Other aortas were dissected out and immediately washed with PBS before a #10 scalped was passed along the inner curve of the aorta or along the descending thoracic aorta. Endothelial cells were immediately stored in cold lysis buffer. (D) Western blotting for NOX4, HIF-1α, phospho-p65, HK2, SLC2A1, PDK1, and β-actin of AA and DT samples. (E) The Western blots are quantified for NOX4, HIF-1α, phospho-p65, HK2, SLC2A1, and PDK1 (n = 4). The AA region of the pig aortas have significantly more expression of all these enzymes. *p<0.05; **p<0.005 as determined by Student’s t-test. Data represent mean ± SEM. Bar is 10 microns.
Figure 7—figure supplement 1

NOX4 and HIF-1immunofluorescence in descending thoracic aorta (DT) and aortic arch (AA).
Mice were anesthetized and perfused with fixative prior to immunofluorescence staining. (A) NOX4 is has higher fluorescence in the AA than DT. (B) Quantification of fluorescence 26–50 cells per region per mouse. (C) HIF-1has higher nuclear fluorescence in AA than DT. (D) Quantification of HIF-1 nuclear fluorescence 37–64 cells per region per mouse. Scale bar: 10 μm. **p<0.005, ***p<0.0005 by non-parametric Kolmogorov-Smirnov test.
Author response image 1

Additional files
-
Source code 1
Image analysis algorithm.
- https://doi.org/10.7554/eLife.25217.038
Download links
A two-part list of links to download the article, or parts of the article, in various formats.
Downloads (link to download the article as PDF)
Open citations (links to open the citations from this article in various online reference manager services)
Cite this article (links to download the citations from this article in formats compatible with various reference manager tools)
HIF-1α is required for disturbed flow-induced metabolic reprogramming in human and porcine vascular endothelium
eLife 6:e25217.
https://doi.org/10.7554/eLife.25217


