Protein Phosphatase 1 inactivates Mps1 to ensure efficient Spindle Assembly Checkpoint silencing
- Universidade do Porto, Portugal
- Unidade de Biologia Experimental, FMUP - Faculdade de Medicina da Universidade do Porto, Portugal
- ICBAS - Instituto de Ciências Biomédicas Abel Salazar, Portugal
Figures
Figure 1 with 2 supplements
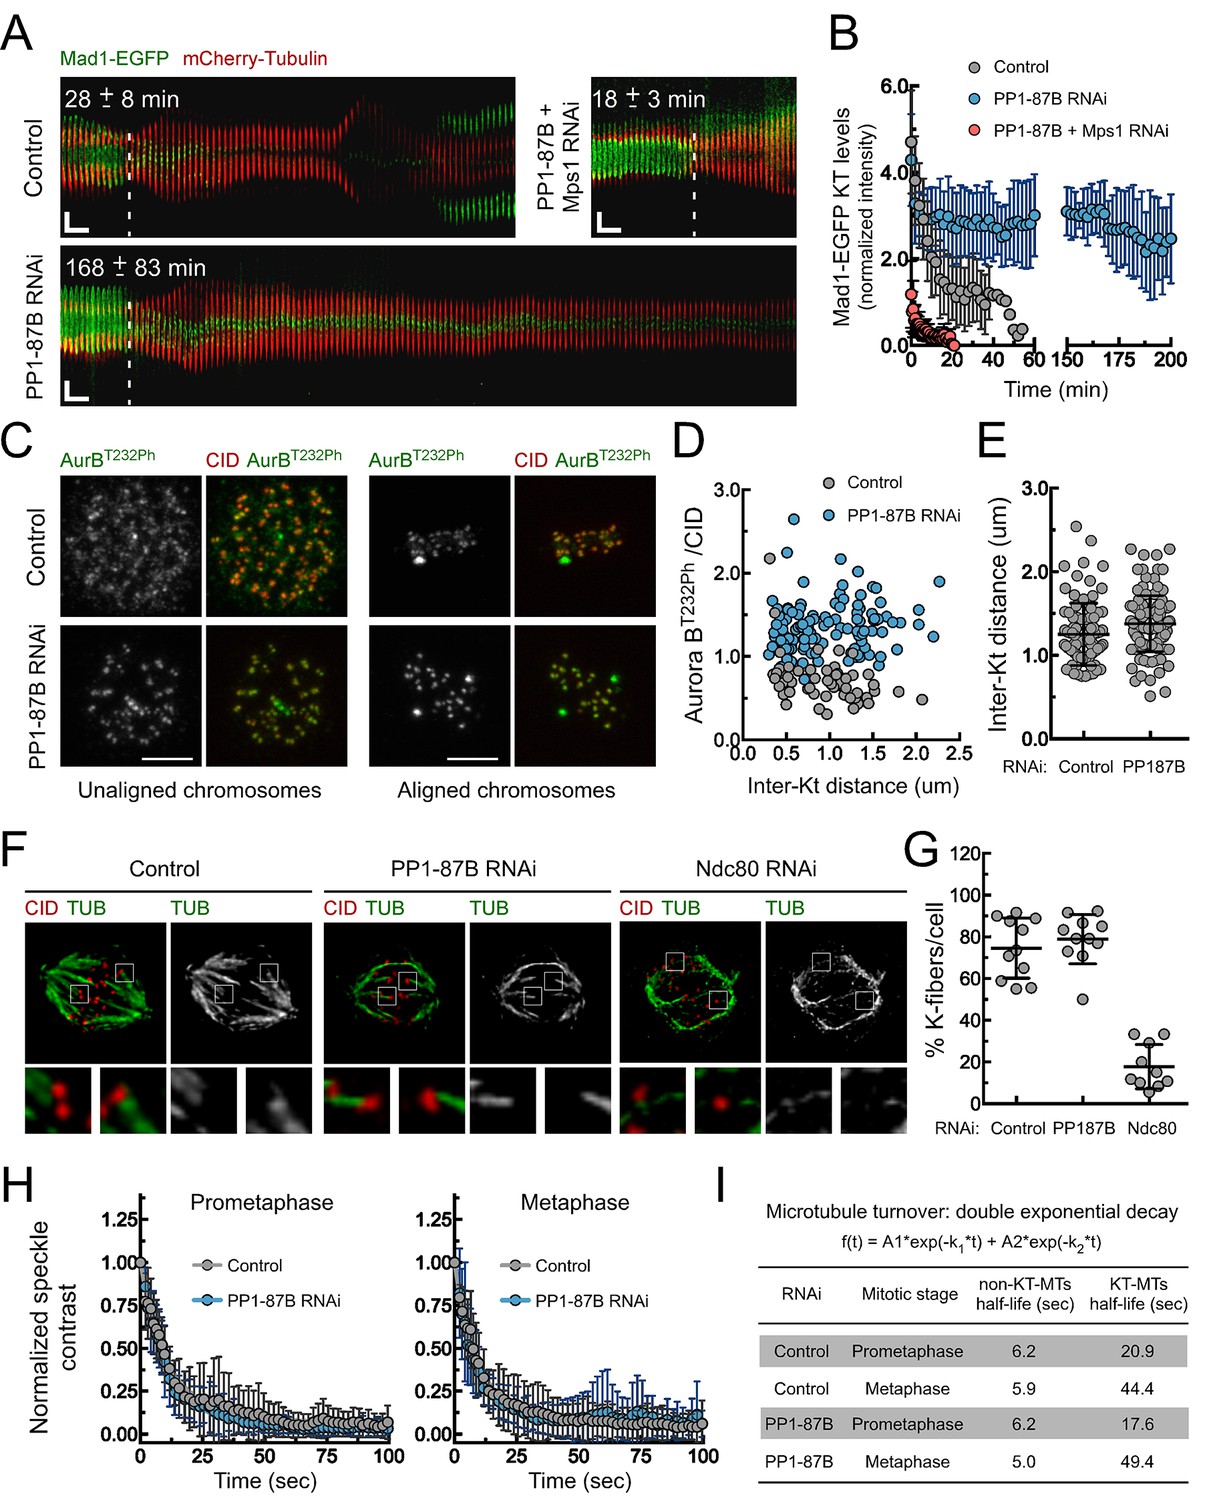
Depletion of PP1-87B results in a SAC-dependent metaphase delay despite stable kinetochore-microtubule attachments.
(A,B) Kymograph analysis of mitotic progression monitored by live-cell imaging (A) and corresponding quantification of Mad1-EGFP kinetochore levels (B) of control, PP1-87B depleted or Mps1 and PP1-87B co-depleted Drosophila S2 cells expressing mCherry-Tubulin and Mad1-EGFP under control of Mad1 promoter. The mean time from nuclear envelope breakdown to anaphase onset for each condition is displayed in the corresponding kymograph. Mad1-EGFP fluorescence intensities at kinetochores were corrected for cytosolic signal (N ≥ 9 cells for each condition). Vertical dashed line indicates the frame corresponding to nuclear envelope breakdown. Horizontal scale bar: 5 min. Vertical scale bar: 5 μm. (C,D) Representative immunofluorescence images (C) and corresponding quantifications (D) of inter-kinetochore distances and relative levels of Aurora B T232 phosphorylation (AurBT232Ph) at unaligned and aligned chromosomes in control and PP1-87B depleted S2 cells. AurBT232Ph relative levels were plotted over the inter-kinetochore distance measured as the distance between centroids of CID pairs. AurBT232Ph fluorescence intensities were determined relative to CID signal (N ≥ 58 kinetochore pairs for each condition). Scale bar: 5 μm. (E) Quantification of inter-kinetochore distances measured in chromosomes aligned at the metaphase plate of control and PP1-87B depleted S2 cells. Inter-kinetochore distances were measured as the distance between centroids of identified CID pairs (N ≥ 86 kinetochores for each condition). (F,G) Representative immunofluorescence images (F) and corresponding quantification (G) of cold-stable kinetochore fibers in control, PP1-87B and Ndc80 depleted S2 cells. CID immunolocalization was used as kinetochore reference. The insets display magnifications of the outlined regions. The graph represents the % of kinetochores attached to cold-stable microtubules per cell (N ≥ 10 cells for each condition). (H,I) Analysis of microtubules turnover rates by speckle contrast fadeout of GFP-α-Tubulin. (H) Contrast fadeout–time curves of GFP-α-Tubulin fluorescent speckles (lines) and their time point means (dots) measured in rectangular areas enclosing the spindle of control and PP1-87B-depleted S2 cells in prometaphase and metaphase. The rate of speckle contrast fadeout was calculated to obtain microtubule turnover rates. (I) Table showing microtubules half-lives of non-kinetochore- (non-KT-MTs) and kinetochore-microtubules (KT-MTs) of control and PP1-87B-depleted S2 cells determined by inducible speckle imaging in prometaphase and metaphase. The average speckle intensity squared-contrast at each time point was fit to a double-exponential curve A1*exp(-k1*t)+A2*exp(-k2*t), in which t is time, A1 represent the less stable population (non-KT-MTs) and A2 the more stable population (KT-MTs) with decay rates of k1 and k2, respectively. The turnover half-life for each population was calculated as ln2/k (N ≥ 7 metaphase cells for each condition). Data information: in (A), (B), (E), (G) and (H) data are presented as mean ± SD. Numerical source data for this figure are provided in Figure 1—source data 1.
-
Figure 1—source data 1
Numerical data for Figure 1.
- https://doi.org/10.7554/eLife.25366.003
Figure 1—figure supplement 1
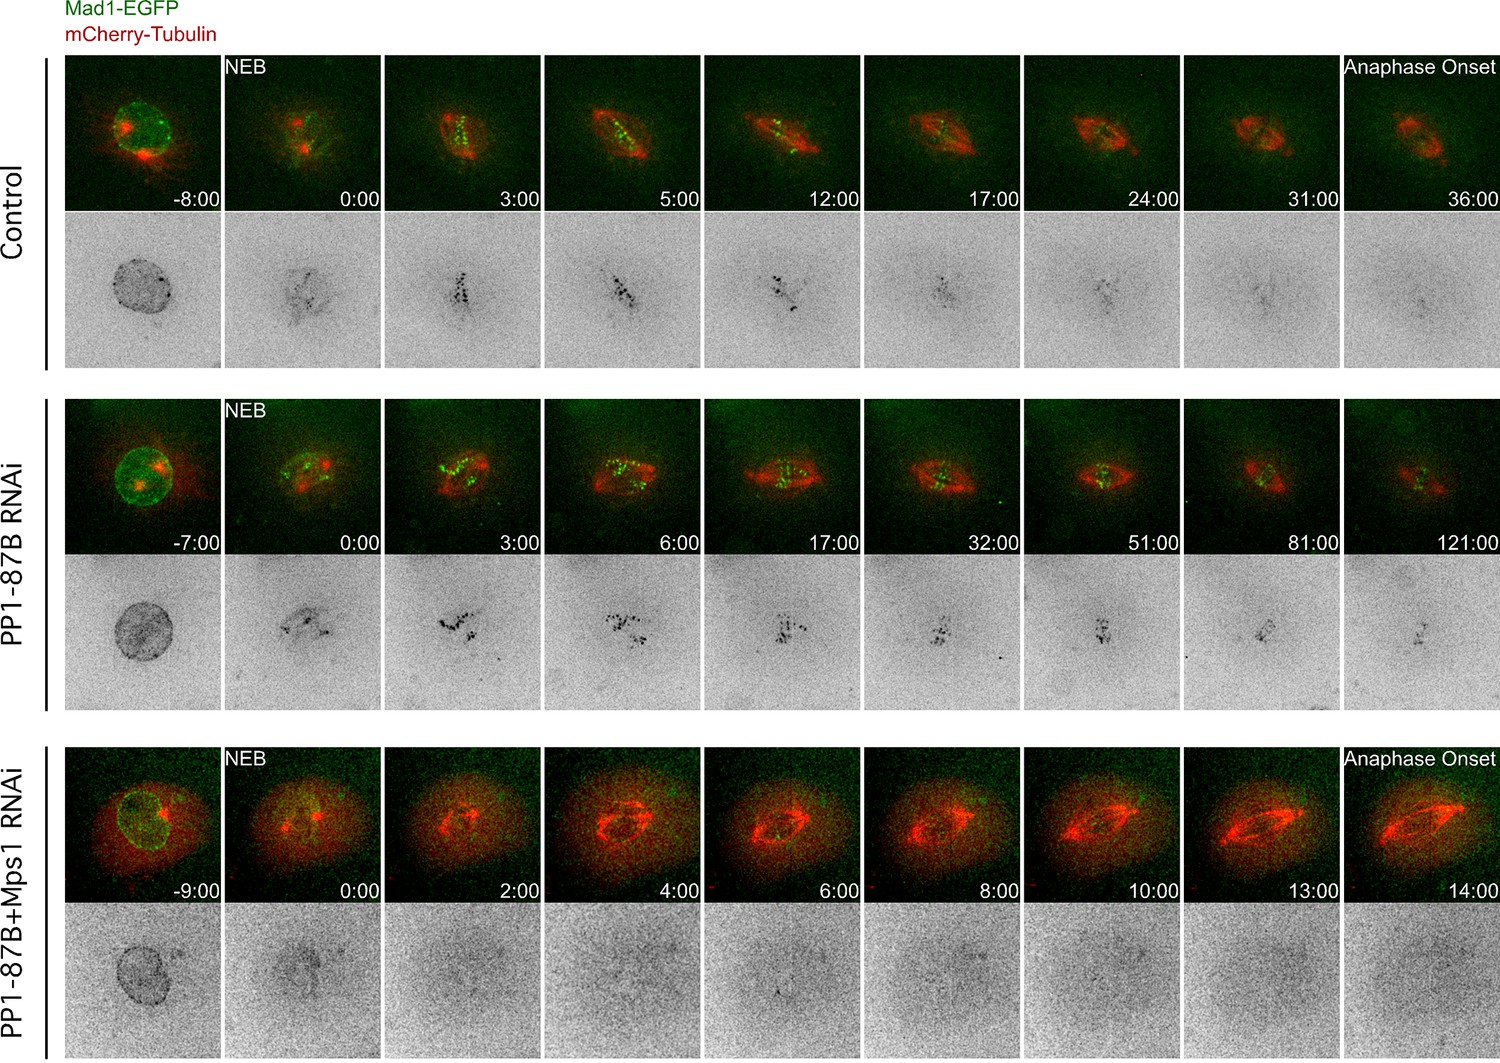
Mad1-EGFP localization pattern during mitosis in S2 cells depleted of PP1-87B.
Representative mitotic progression of control, PP1-87B depleted or Mps1 and PP1-87B co-depleted Drosophila S2 cells co-expressing Mad1-EGFP and mCherry-α-Tubulin. Mitotic progression was monitored by time-lapse microscopy. (NEB) nuclear envelope breakdown. Time is in min:sec.
Figure 1—figure supplement 2
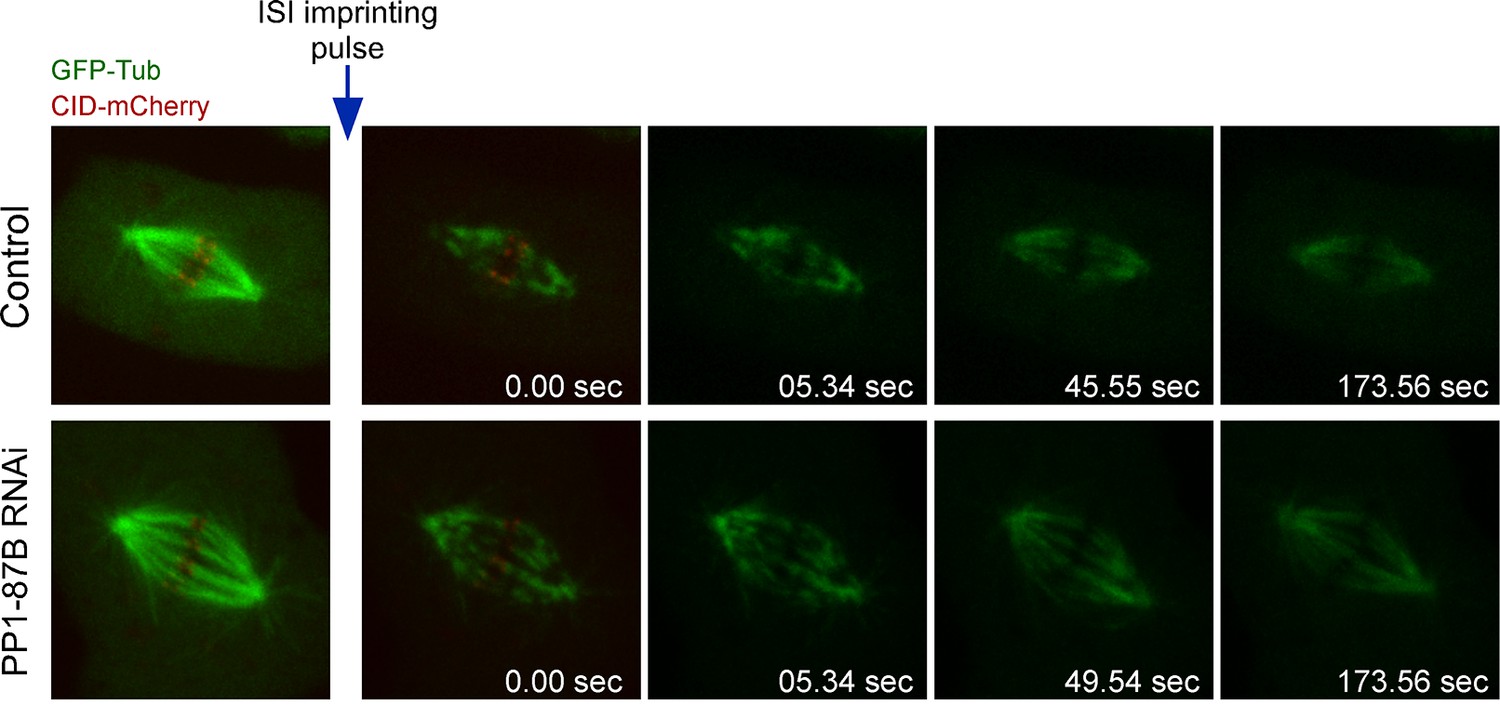
Analysis of microtubule turnover in control and PP1-87B depleted metaphase cells by speckle contrast fade-out.
Representative inducible speckle imaging (ISI) imprinting and progressive contrast fade-out of GFP–α-tubulin in control and PP1-87B depleted metaphase S2 cells. The observed speckle contrast fadeout is due to microtubule turnover. Time is sec.
Figure 2 with 3 supplements
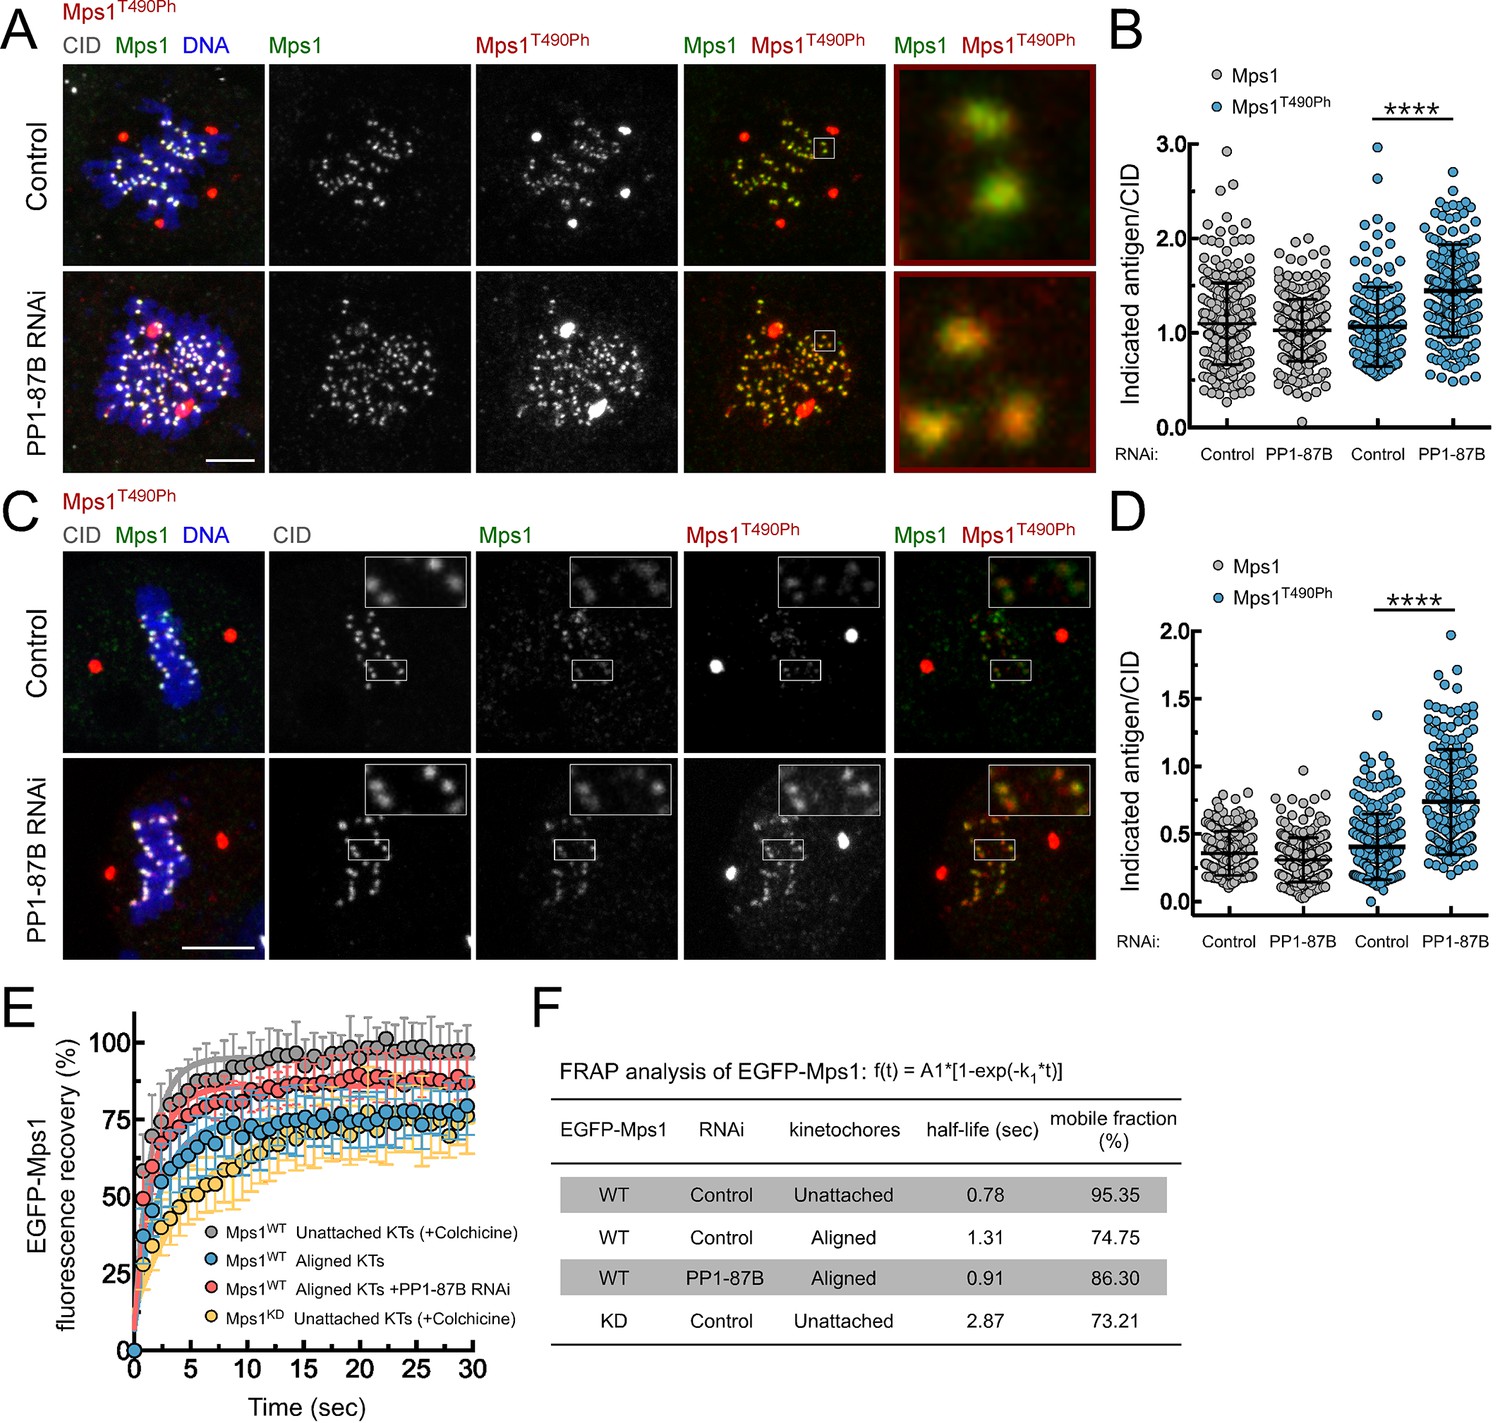
PP1-87B antagonizes Mps1 T-loop autophosphorylation at kinetochores of prometaphase and metaphase cells.
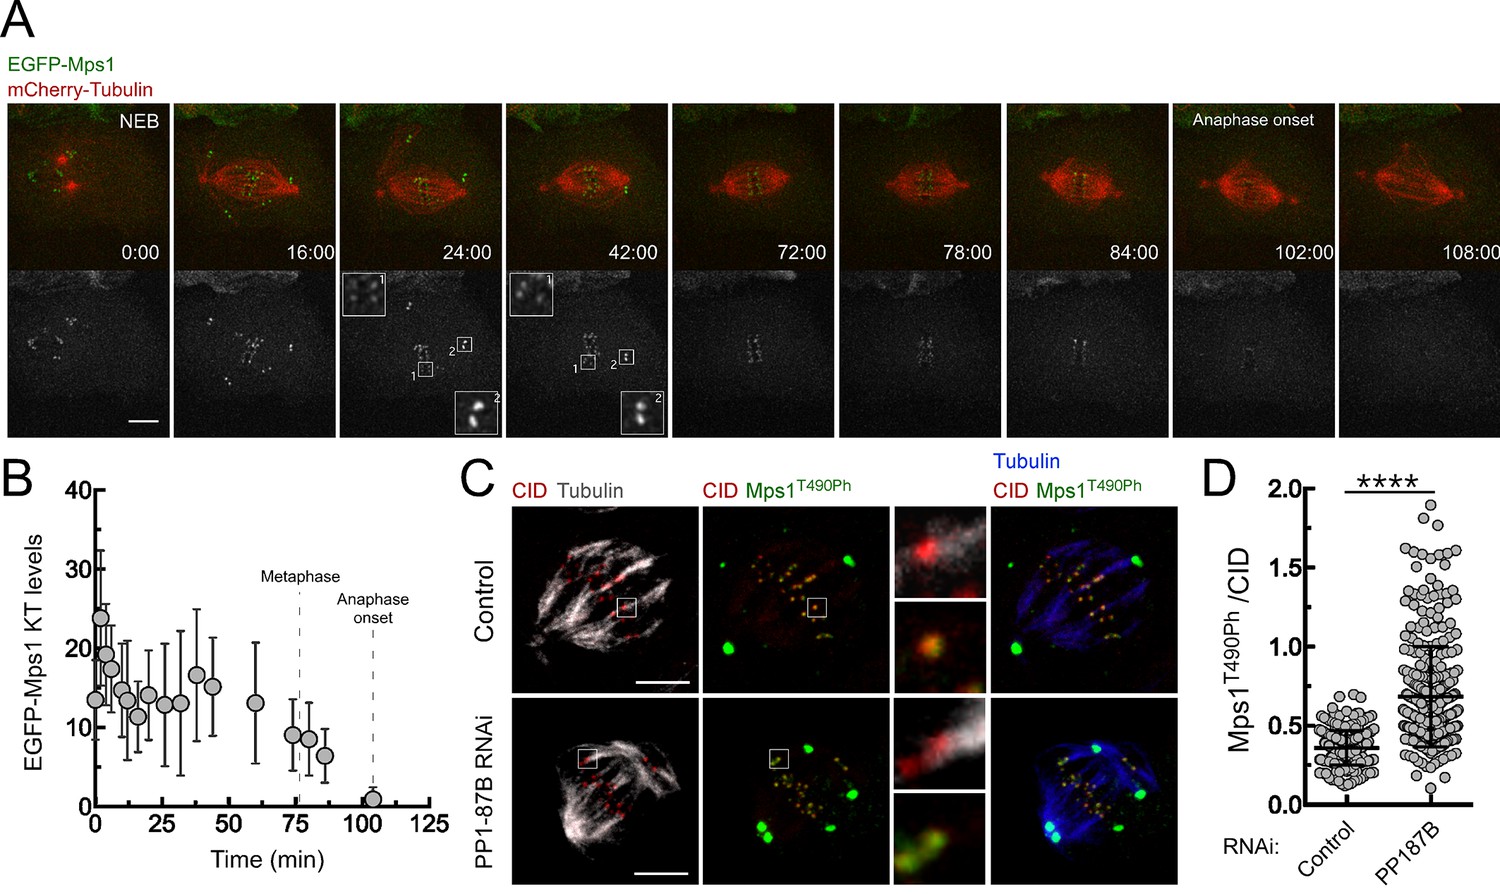
(A,B) Representative immunofluorescence images (A) and corresponding quantifications (B) of Mps1 T490 phosphorylation (Mps1T490Ph) and Mps1 relative levels at prometaphase kinetochores of control and PP1-87B depleted Drosophila S2 cells. The insets display magnifications of the outlined regions. Mps1T490Ph and Mps1 fluorescence intensities were determined relative to CID signal (N ≥ 252 kinetochores from at least 10 cells for each condition). Scale bar: 5 μm. (C,D) Representative immunofluorescence images (C) and corresponding quantifications (D) of Mps1 T490 phosphorylation (Mps1T490Ph) and Mps1 relative levels at metaphase kinetochores of control and PP1-87B depleted S2 cells. The insets display magnifications of the outlined regions. Mps1T490Ph and Mps1 fluorescence intensities were determined relative to CID signal (N ≥ 217 kinetochores from at least 15 cells for each condition). Scale bar: 5 μm. (E,F) FRAP analysis of EGFP-Mps1WT (wild type) and EGFP-Mps1KD (kinase dead) at unattached or metaphase-aligned kinetochores of control and PP1-87B depleted S2 cells. To generate unattached kinetochores, S2 cells were treated with colchicine (30 µM) for 2 hr prior to FRAP experiments (E) Graph displays recovery-time curves of EGFP-Mps1 fluorescence (lines) and their time point means (dots) after bleaching of individual kinetochores in the indicated conditions. (F) Table showing the recovery half-lives and the % of mobile EGFP-Mps1 population obtained after fitting the average fluorescence intensity at each time point to a single-exponential one-phase association curve (N ≥ 9 cells for each condition). Data information: in (B), (D) and (E) data are presented as mean ± SD. Asterisks indicate that differences between mean ranks are statistically significant, ****p<0.0001 (Mann-Whitney U test). Numerical source data for this figure are provided in Figure 2—source data 1.
-
Figure 2—source data 1
Numerical data for Figure 2.
- https://doi.org/10.7554/eLife.25366.012
Figure 2—figure supplement 1
PP1-87B antagonizes the T-loop autophosphorylation of Mps1 that remains associated with metaphase kinetochores stably attached to spindle microtubules.
(A) Detailed analysis of mitotic progression of Drosophila S2 cells expressing mCherry-α-Tubulin and EGFP-Mps1. EGFP-Mps1 was expressed under control of Mps1 cis-regulatory region and mitotic progression monitored by time-lapse microscopy. The insets display magnifications of the outlined regions. Time is in min:sec. (B) Quantification of EGFP-Mps1 kinetochores levels from (A). The average fluorescence intensity at kinetochores was corrected for the average EGFP-Mps1 signal in the cytoplasm. Time 0 min corresponds to nuclear envelope breakdown (NEB). Metaphase duration was defined by the length of time between the first still in which all kinetochore pairs were perfectly aligned at the cell equator (Metaphase) and anaphase onset. Dashed lines indicate the time from NEB to metaphase and to anaphase onset. (C,D) Representative immunofluorescence images (C) and corresponding quantifications (D) of Mps1 T490 phosphorylation (Mps1T490Ph) levels at metaphase kinetochores attached to cold-resistant microtubules bundles of control and PP1-87B depleted Drosophila S2 cells. The insets display magnifications of the outlined regions. Mps1T490Ph and Mps1 fluorescence intensities were determined relative to CID signal (N ≥ 270 kinetochores from at least 12 cells for each condition). Scale bar: 5 μm. Data information: in (B) and (D) data are presented as mean ± SD. Asterisks indicate that differences between mean ranks are statistically significant, ****p<0.0001 (Mann-Whitney U test).
Figure 2—figure supplement 2
Validation of a phospho-specific antibody against Drosophila Mps1 activating T-loop autophosphorylation.
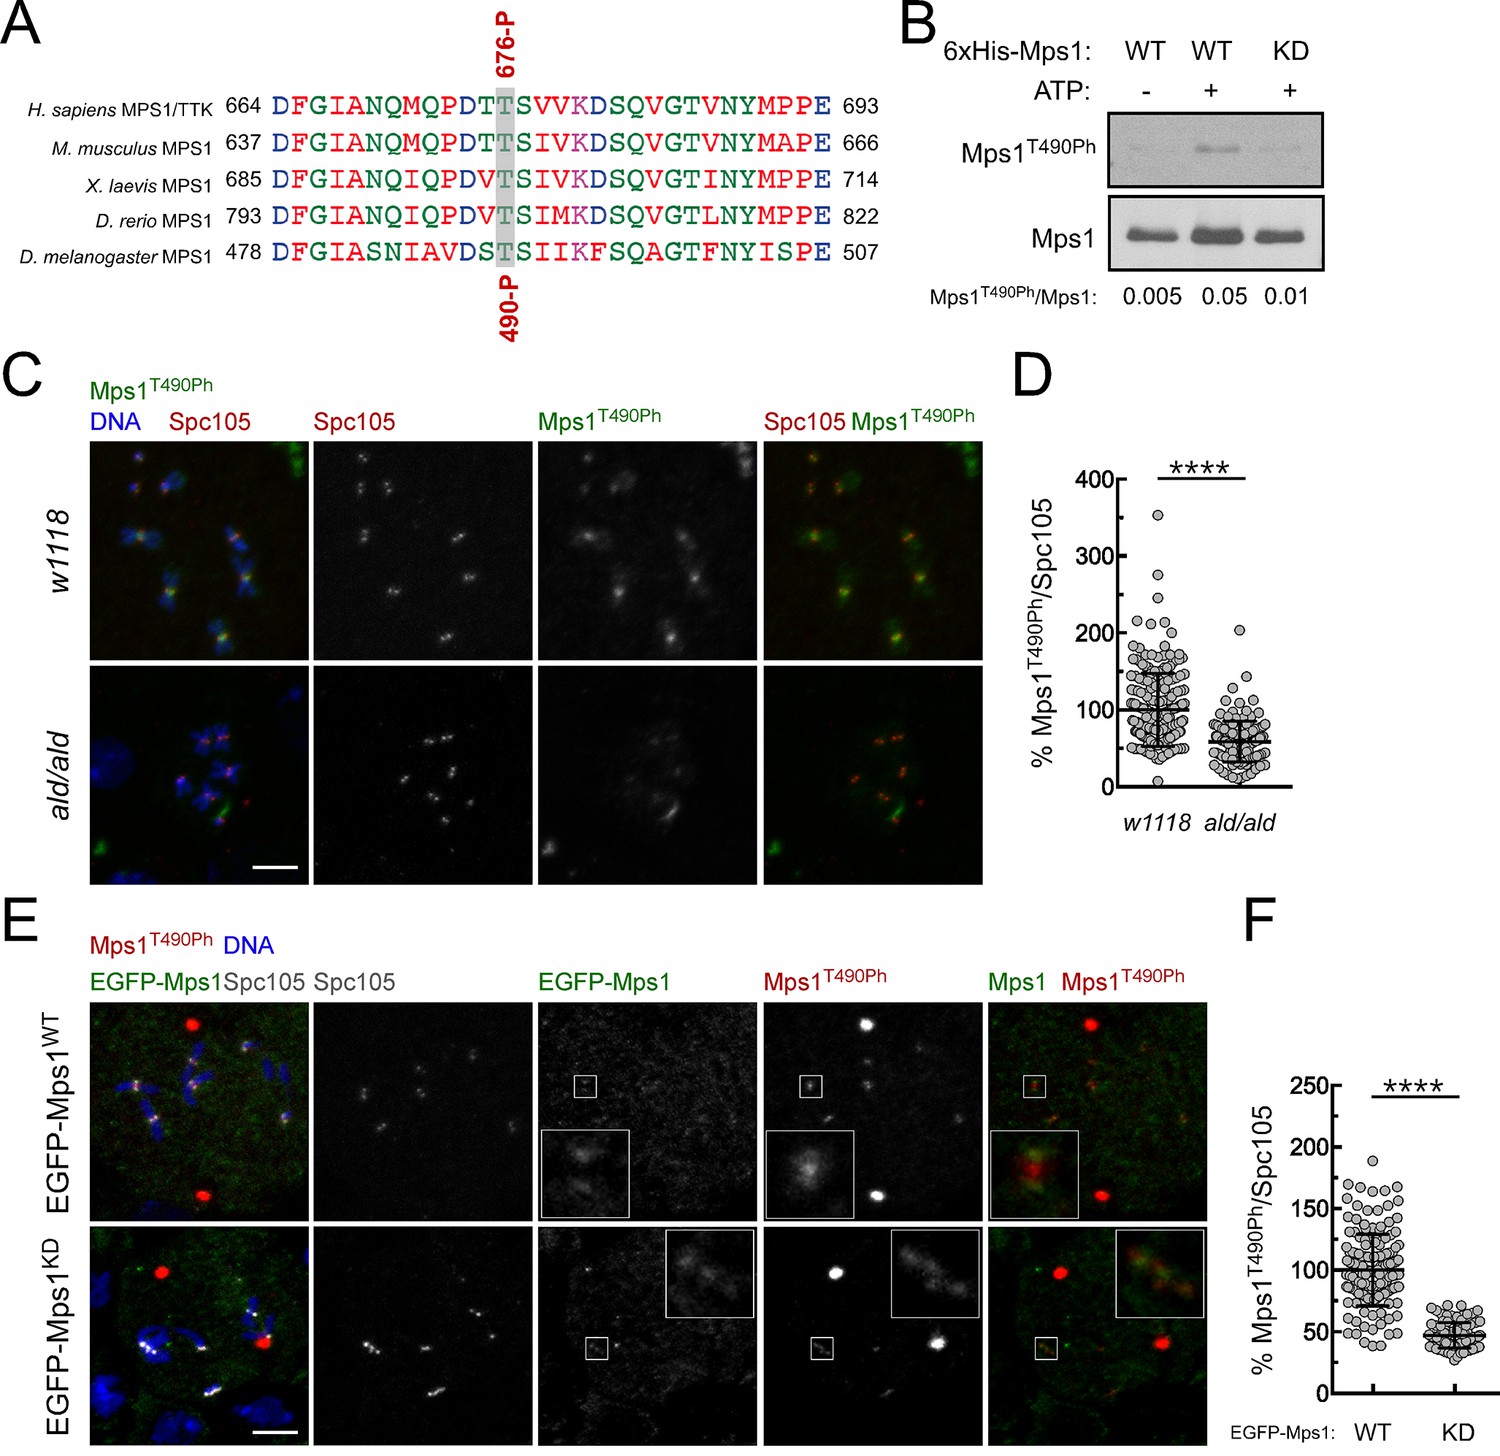
(A) Conservation among Mps1 T-loop residues. Clustal W alignments of T-loop residues of indicated Mps1 orthologues. The conserved Mps1 activating autophosphorylation threonine is highlighted in grey shading. The red numbers note specific residues for human Mps1/TTK (Thr676) and Drosophila Mps1 (Thr490), and P indicates phosphorylation. (B) In vitro autophosphorylation of Drosophila Mps1 detected by western blotting. Recombinant wild type (WT) and kinase dead (KD) versions of recombinant Drosophila Mps1 were incubated with ATP for 30 min and phosphorylation of T490 (Mps1T490Ph) probed with a phospho-specific antibody. The chemiluminescence signal intensity of Mps1T490Ph was determined relative to the signal of total Mps1. (C,D) Representative immunofluorescence images (C) and corresponding quantifications (D) of Mps1 T490 phosphorylation (Mps1T490Ph) at prometaphase kinetochores of third instar larval neuroblasts from w1118 and aldG4422 homozygous (ald/ald). Mps1T490Ph fluorescence intensities were determined relative to Spc105 signal and the mean values for control w1118 neuroblasts were set to 100% (N ≥ 135 kinetochores from at least 12 neuroblasts for each condition from two independent experiments). Scale bar: 5 μm. (E,F) Representative immunofluorescence images (E) and corresponding quantifications (F) of Mps1 T490 phosphorylation (Mps1T490Ph) at prometaphase kinetochores of third instar larval neuroblasts from aldG4422 homozygous expressing EGFP-Mps1WT (wild type) or EGFP-Mps1KD (kinase dead) under control of Mps1 cis-regulatory elements. The insets display magnifications of the outlined regions. Mps1T490Ph fluorescence intensities were determined relative to Spc105 signal and the mean values for neuroblasts expressing EGFP-Mps1WT were set to 100% (N ≥ 87 kinetochores from at least 10 neuroblasts for each condition from two independent experiments). Scale bar: 5 μm. Data information: in (D) and (F) data are presented as mean ± SD. Asterisks indicate that differences between mean ranks are statistically significant, ****p<0.0001 (Mann-Whitney U test).
Figure 2—figure supplement 3
Depletion of Sds22 affects Mps1 T-loop autophosphorylation.
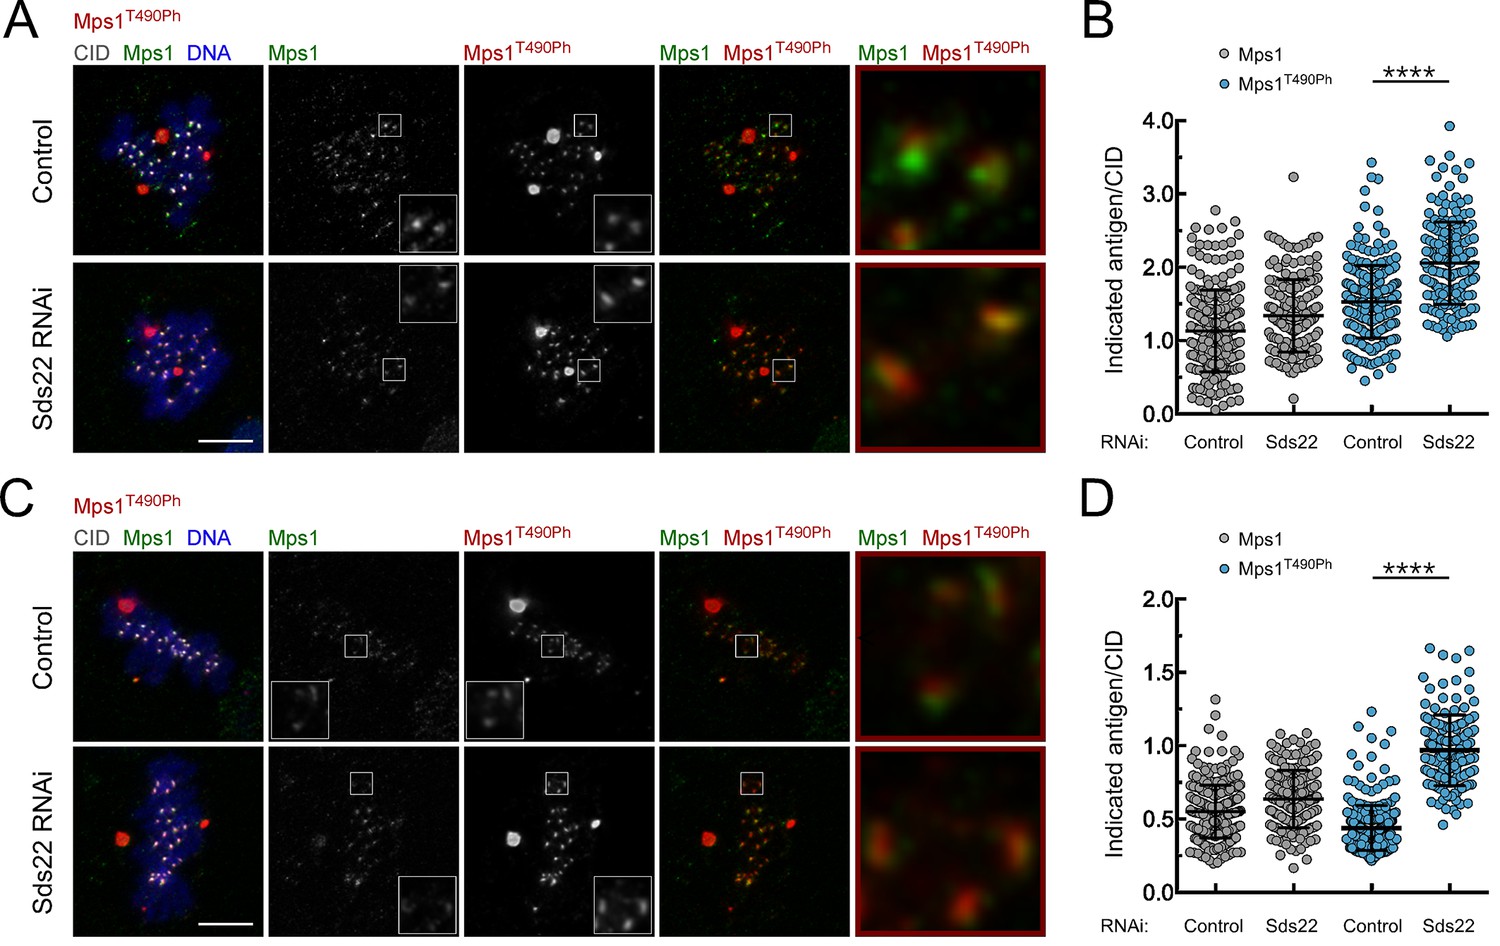
(A,B) Representative immunofluorescence images (A) and corresponding quantifications (B) of Mps1 T490 phosphorylation (Mps1T490Ph) and Mps1 relative levels at prometaphase kinetochores of control and Sds22 depleted S2 cells. The insets display magnifications of the outlined regions. Mps1T490Ph and Mps1 fluorescence intensities were determined relative to CID signal (N ≥ 177 kinetochores from at least 8 cells for each condition). Scale bar: 5 μm. (C,D) Representative immunofluorescence images (C) and corresponding quantifications (D) of Mps1 T490 phosphorylation (Mps1T490Ph) and Mps1 relative levels at metaphase kinetochores of control and Sds22 depleted S2 cells. The insets display magnifications of the outlined regions. Mps1T490Ph and Mps1 fluorescence intensities were determined relative to CID signal (N ≥ 186 kinetochores from at least 8 cells for each condition). Scale bar: 5 μm. Data information: in (B) and (D) data are presented as mean ± SD. Asterisks indicate that differences between mean ranks are statistically significant, ****p<0.0001 (Mann-Whitney U test).
Figure 3 with 3 supplements
PP1-87B/PP1-γ dephosphorylates Mps1 T-loop in vitro and in vivo.
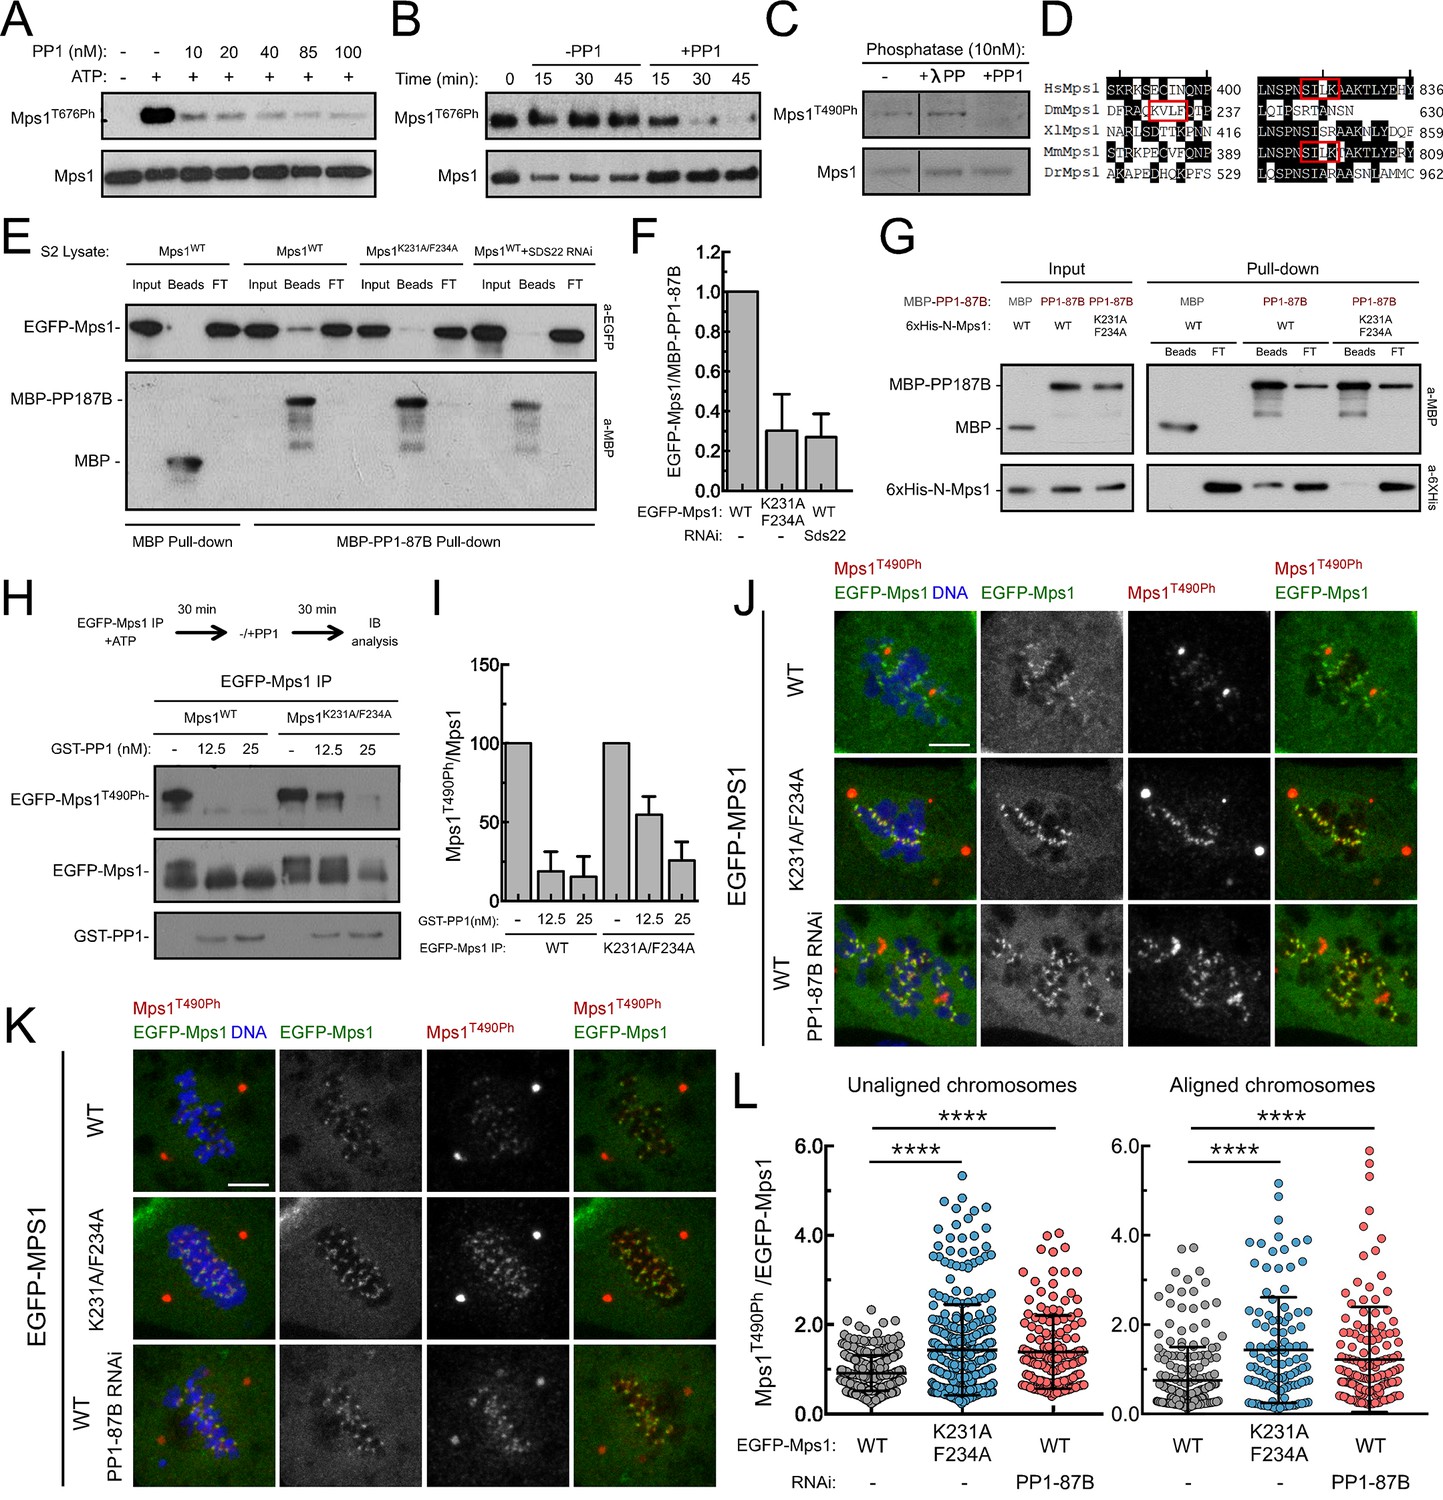
(A,B) Western blot analysis of Mps1/TTK T676 autophosphorylation. Recombinant human Mps1 was incubated during 30 min with increasing concentrations of recombinant human PP1-γ (A) or PP1-γ (42.7 nM) was added to previously active Mps1 and phosphorylation of Mps1 T676 (Mps1T676Ph) monitored over time (B). (C) Western blot analysis of Drosophila Mps1 T490 autophosphorylation. Recombinant Drosophila Mps1 was incubated during 30 min with 10 nM of recombinant human PP1-γ or λ-PP and phosphorylation of Mps1 T490 (Mps1T490Ph) monitored. (D) Clustal W alignments of amino acid residues of indicated Mps1 orthologues. Red boxes highlight putative PP1-docking motifs identified in silico by the Eukaryotic Linear Motif (ELM) resource. (E) MBP-PP1-87B pull-downs from total cell lysates of S2 cells expressing EGFP-Mps1WT or EGFP-Mps1K231A/F234A or EGFP-Mps1WT upon depletion of Sds22. Immobilized MBP was used as negative control. Input, beads and flow-through (FT) were probed by western blotting for the indicated proteins. (F) Quantification of Mps1 binding to PP1-87B from the pull-downs in (E). The chemiluminescence signal intensity of EGFP-Mps1 was determined relative to the signal of MBP-PP1-87B beads. The graph represents the quantification of relative levels of EGFP-Mps1 in MBP-PP1-87B pull-downs from at least two independent experiments. The values obtained for EGFP-Mps1WT from control cells were set to 1. (G) MBP-87B pull-downs of purified recombinant Mps1 N-terminus region (104–330 amino acids) harboring the wild-type (6xHis-N-Mps1WT) or mutated PP1-docking motif (6xHis-N-Mps1K231A/F234A). Immobilized MBP was used as negative control. Input, beads and flow-through (FT) were probed by western blotting for the indicated proteins. (H) Western blot analysis of EGFP-Mps1WT and EGFP-Mps1K231A/F234A T-loop dephosphorylation by PP1-γ. EGFP-Mps1WT and EGFP-Mps1K231A/F234A were immunoprecipitated from mitotic S2 lysates and incubated with ATP for 30 min to allow Mps1 T-loop autophosphorylation. Increasing concentrations of recombinant GST-PP1-γ were subsequently added to the reaction mixture and Mps1 T490 phosphorylation (Mps1T490Ph) assessed after 30 min. Immunoprecipitates were probed by immunoblotting (IB) for the indicated proteins. (I) Quantification of Mps1T490Ph levels from the dephosphorylation assay in (H). The chemiluminescence signal intensity of Mps1T490Ph was determined relative to the corresponding signal of EGFP-Mps1 immunoprecipitates. The values obtained for each control reaction were set to 100%. The graph represents the quantification of Mps1T490Ph relative levels from two independent experiments. (J–L) Representative immunofluorescence images (J,K) and corresponding quantifications (L) of Mps1 T490 phosphorylation (Mps1T490Ph) at kinetochores of unaligned (J) and aligned (K) chromosomes from S2 cells expressing EGFP-Mps1WT or EGFP-Mps1K231A/F234A and from PP1-87B depleted S2 cells expressing EGFP-Mps1WT. EGFP-Mps1 transgenes were expressed under the control of Mps1 cis-regulatory region (Althoff et al., 2012). Mps1T490Ph fluorescence intensities were determined relative to EGFP-Mps1 signal (N ≥ 150 unaligned kinetochores from at least 8 cells for each condition and N ≥ 111 aligned kinetochores from at least 7 cells for each condition). Scale bar: 5 μm. Data information: in (F), (I) and (L) data are presented as mean ± SD. Asterisks indicate that differences between mean ranks are statistically significant, ****p<0.0001 (Kruskal-Wallis, Dunn’s multiple comparison test). Numerical source data for this figure are provided in Figure 3—source data 1.
-
Figure 3—source data 1
Numerical data for Figure 3.
- https://doi.org/10.7554/eLife.25366.018
Figure 3—figure supplement 1
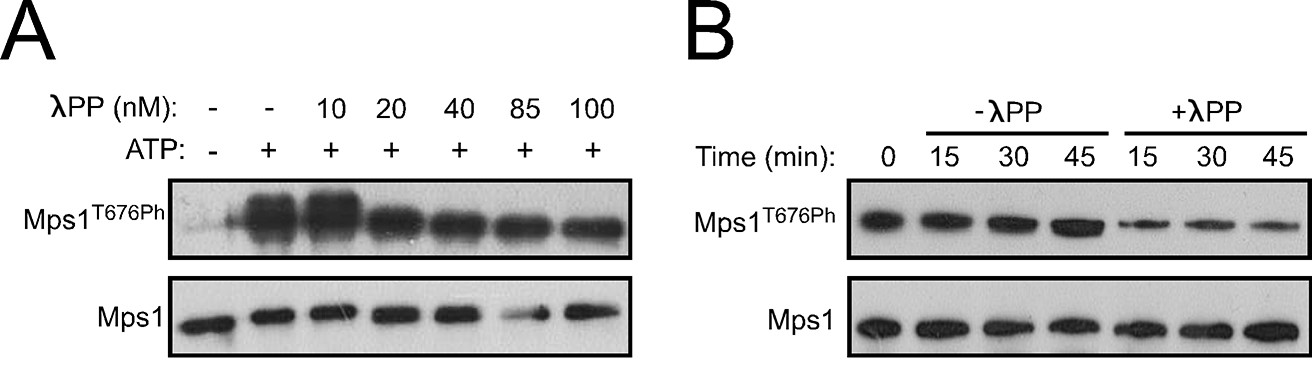
Specificity of Mps1 T-loop dephosphorylation in vitro.
(A,B) Western blot analysis of Mps1T676 autophosphorylation. Recombinant human Mps1 was incubated during 30 min with increasing concentrations of recombinant human λ-phosphatase (λPP) (A) or λ-PP (42.7 nM) was added to previously active Mps1 and phosphorylation of Mps1 T676 (Mps1T676Ph) monitored over time (B).
Figure 3—figure supplement 2
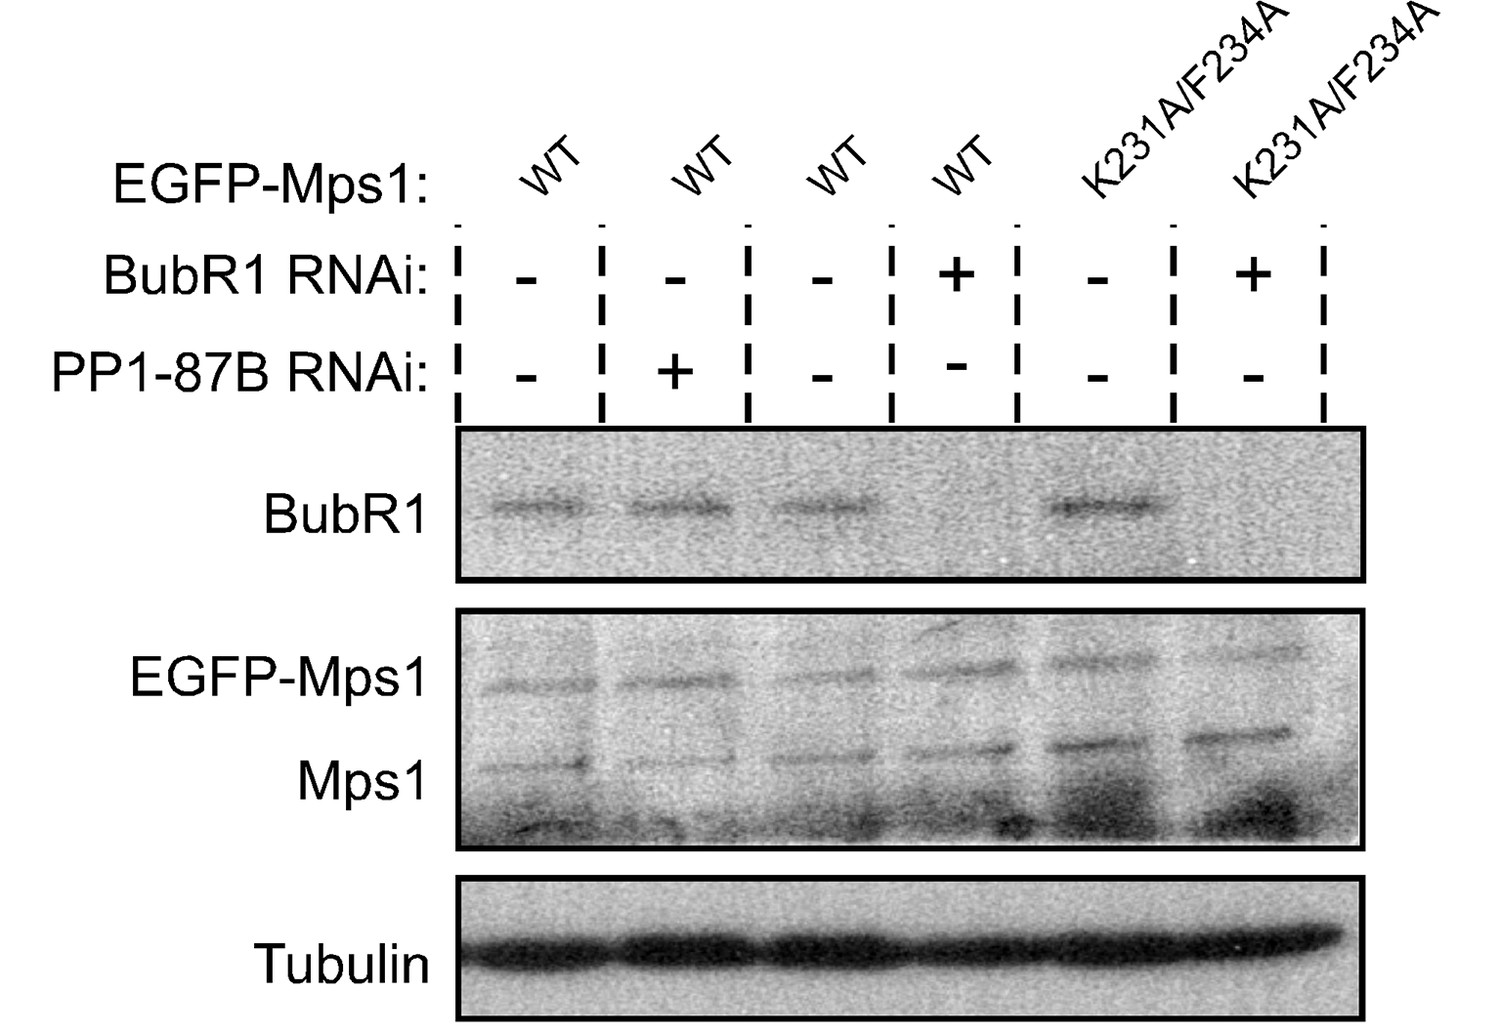
Western blotting analysis of S2 cells expressing EGFP-Mps1WT and EGFP-Mps1K231A/F234A.
Western blot of analysis of BubR1 depletion and of EGFP-Mps1WT and EGFP-Mps1K231A/F234A expression in Drosophila S2 cells used in the studies described in Figure 3J–L. α-Tubulin was used as loading control. Expression of EGFP-Mps1 transgenes was under control of Mps1 cis-regulatory region.
Figure 3—figure supplement 3
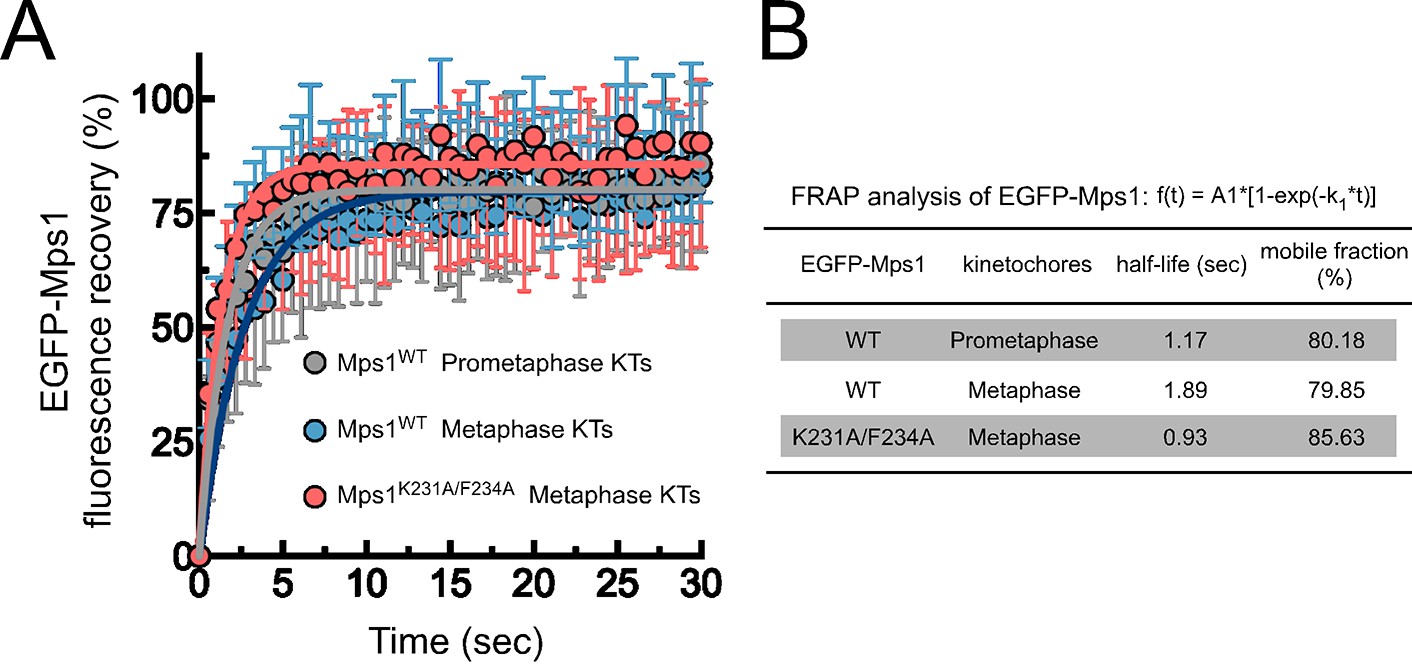
Mps1WT and Mps1K231A/F234A dynamics at kinetochores.
(A,B) FRAP analysis of EGFP-Mps1WT and EGFP-Mps1K231A/F234A at prometaphase and metaphase kinetochores. (A) Graph displays recovery-time curves of EGFP-Mps1 fluorescence (lines) and their time point means (dots) after bleaching of individual kinetochores in the indicated conditions. (B) Table showing the recovery half-lives and the % of mobile EGFP-Mps1 populations obtained after fitting the average fluorescence intensity at each time point to a single-exponential one-phase association curve (N ≥ 10 cells for each condition).
Figure 4 with 1 supplement
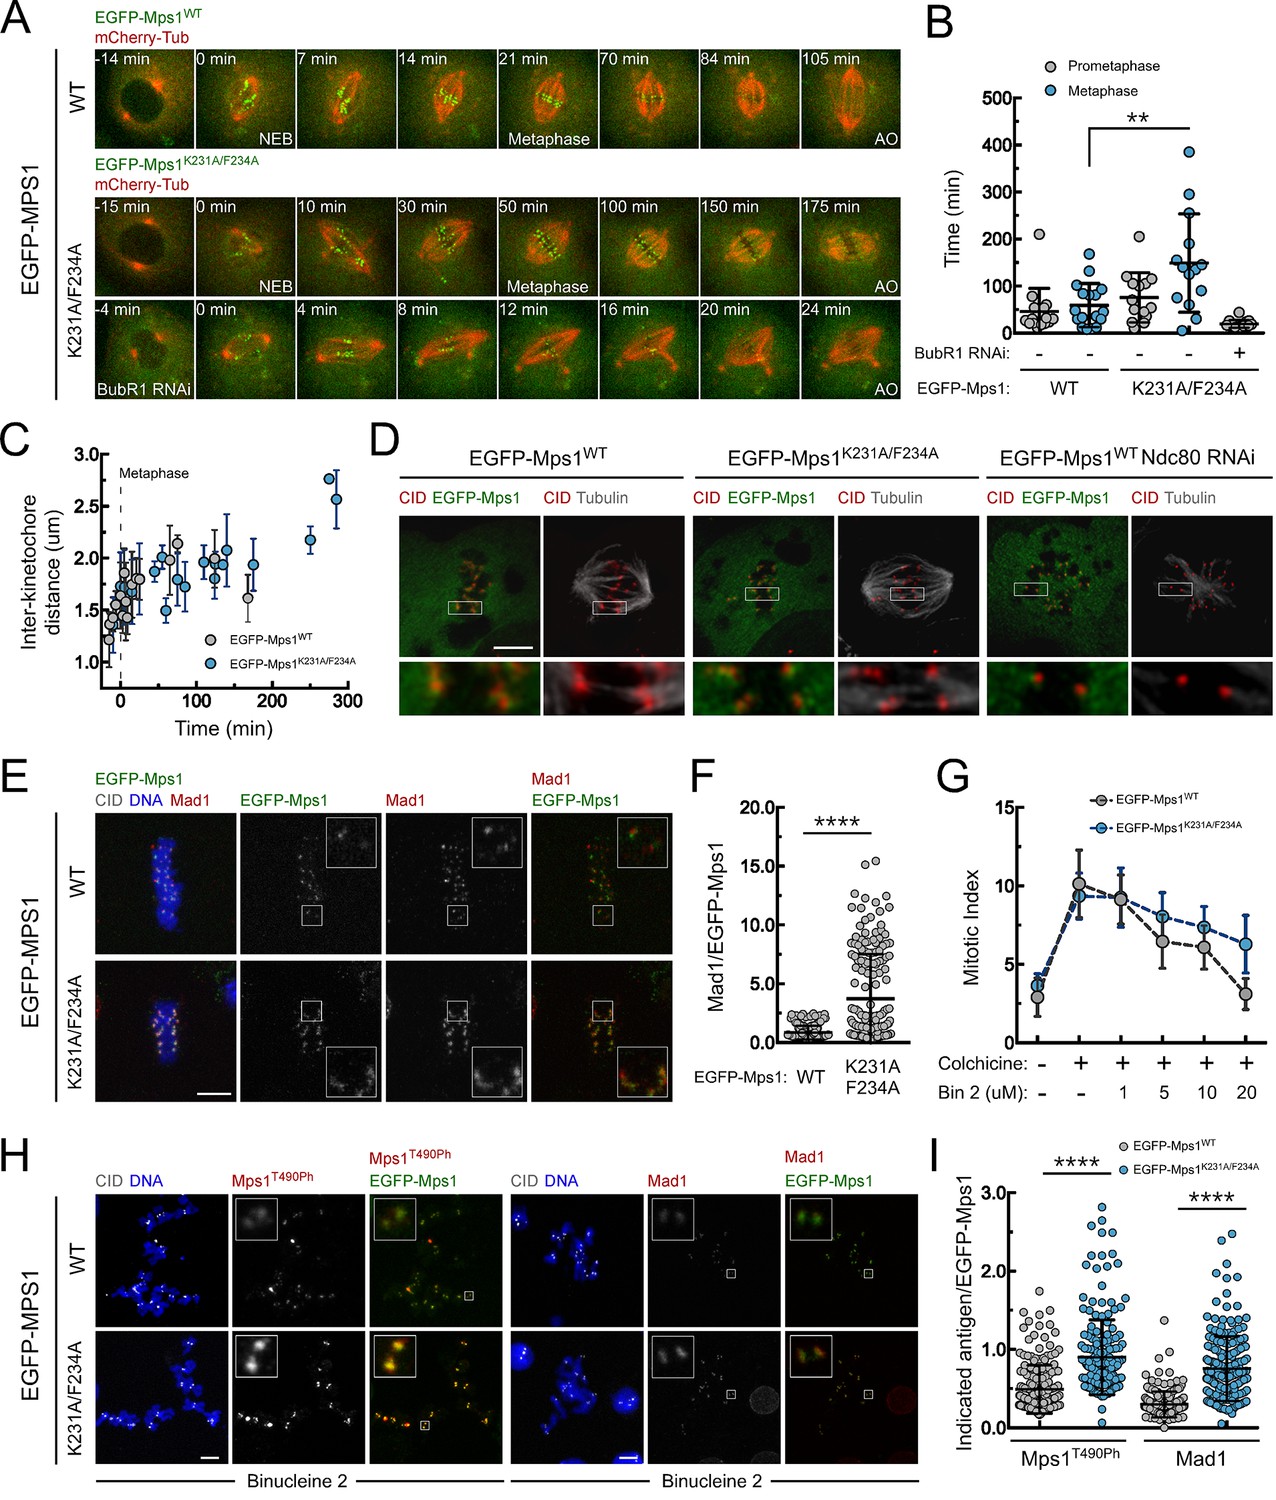
PP1-87B-mediated dephosphorylation of Mps1 T-loop renders the kinase inactive and is required for timely SAC silencing.
(A,B) Mitotic progression (A) and prometaphase and metaphase duration (B) of S2 cells expressing mCherry-α-Tubulin and EGFP-Mps1WT, EGFP-Mps1K231A/F234A or EGFP-Mps1K231A/F234A in a BubR1-depleted background. EGFP-Mps1 transgenes were expressed under control of Mps1 cis-regulatory region and mitotic progression monitored by time-lapse microscopy. The metaphase duration was defined by the length of time measured between the first still in which all kinetochore pairs were perfectly aligned at the metaphase plate (Metaphase) and anaphase onset (AO) (N ≥ 14 cells for each condition, from at least two independent experiments). (C) Quantification of inter-kinetochore distances throughout mitosis in S2 cells expressing EGFP-Mps1WT and EGFP-Mps1K231A/F234A. Inter-kinetochore distances were measured as the distance between centroids of identified EGFP-Mps1 pairs at selected prometaphase and metaphase time frames. Time 0 min corresponds to the first metaphase frame. (D) Representative immunofluorescence images of cold-stable kinetochore fibers in S2 cells expressing EGFP-Mps1WT, EGFP-Mps1K231A/F234A or EGFP-Mps1WT upon Ndc80 depletion. CID immunolocalization was used as kinetochore reference. The insets display magnifications of the outlined regions. Scale bar: 5 μm. (E,F) Representative immunofluorescence images (E) and corresponding quantifications (F) of Mad1 levels at metaphase kinetochores of S2 cells expressing EGFP-Mps1WT or EGFP-Mps1K231A/F234A. Mad1 fluorescence intensities were determined relative to EGFP-Mps1 signal (N ≥ 162 kinetochores from at least 10 cells for each condition). Scale bar: 5 μm. (G–I) Mitotic index (G), representative immunofluorescence images (H) and quantification of Mps1T490Ph and Mad1 levels at unattached kinetochores (I) of colchicine treated S2 cells expressing EGFP-Mps1WT or EGFP-Mps1K231A/F234A in the presence of Aurora B inhibitor, binucleine 2 (Bin2) for 2 hr. Mitotic index in (G) was determined through p-H3 staining of cultured cells incubated in the absence or presence of colchicine (30 µM) for 12 hr. Increasing concentrations of Bin2 were added to cultures 10 hr after colchicine and mitotic index determined 2 hr later. In (H and I) Mps1T490Ph and Mad1 fluorescence intensities were determined relative to EGFP-Mps1 signal in cells treated with Bin2 (20 µM) and colchicine as in (G). Proteasome inhibitor MG132 (20 µM) was added to cultured cells 1 hr prior to Bin2 incubation to prevent mitotic exit (N ≥ 185 kinetochores from at least 9 cells for each condition). Scale bar: 5 μm. Data information: in (B), (C), (F), (G) and (I) data are presented as mean ± SD. Asterisks indicate that differences between mean ranks are statistically significant, **p<0.05, ****p<0.0001 (Mann-Whitney U test). Numerical source data for this figure are provided in Figure 4—source data 1.
-
Figure 4—source data 1
Numerical data for Figure 4.
- https://doi.org/10.7554/eLife.25366.023
Figure 4—figure supplement 1
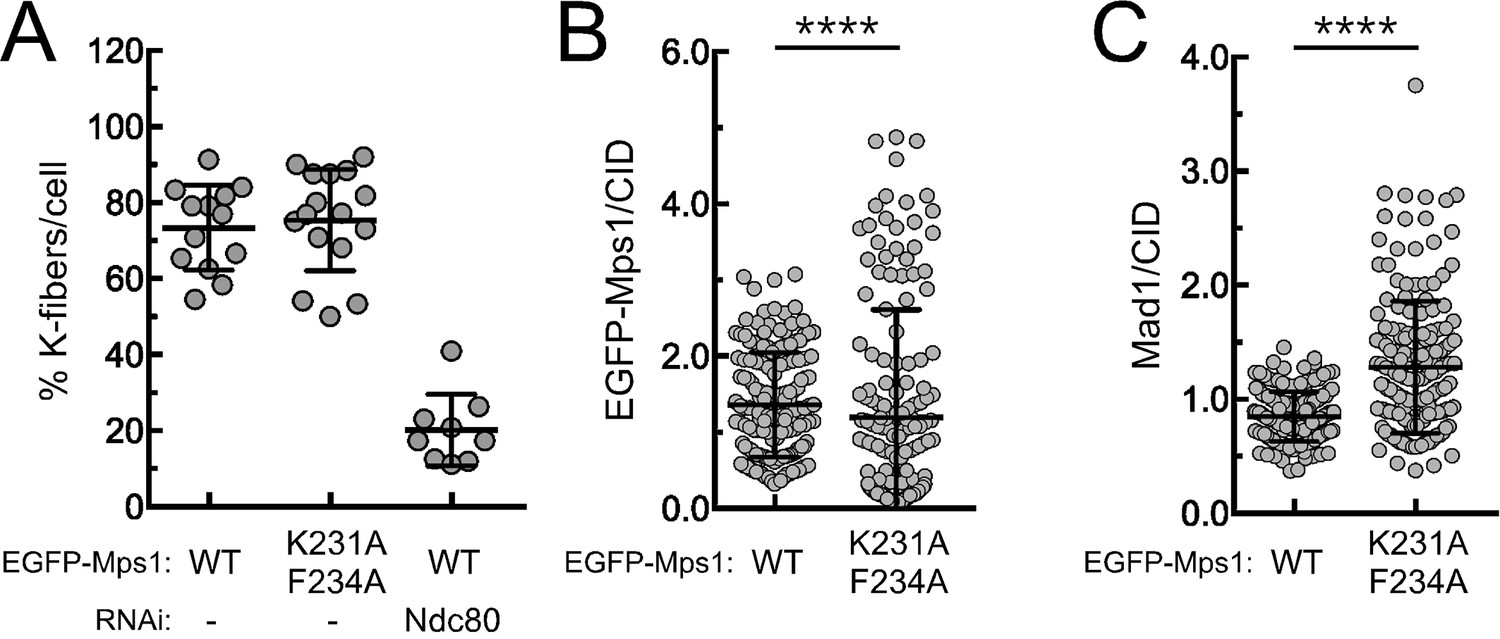
Stable attachments and Mad1 levels at metaphase kinetochores of S2 cells expressing EGFP-Mps1WT and EGFP-Mps1K231A/F234A.
(A) Quantification of cold-stable kinetochore fibers in S2 cells expressing EGFP-Mps1WT, EGFP-Mps1K231A/F234A and EGFP-Mps1WT upon Ndc80 depletion. The graph represents the % of kinetochores attached to cold-stable microtubules per cell (N ≥ 9 cells for each condition). (B,C) Quantifications of EGFP-Mps1WT, EGFP-Mps1K231A/F234A (B) and of Mad1 (C) levels at metaphase kinetochores of S2 cells expressing EGFP-Mps1WT or EGFP-Mps1K231A/F234A. EGFP-Mps1 and Mad1 fluorescence intensities were determined relative to CID signal (N ≥ 162 kinetochores from at least 10 cells for each condition). Scale bar: 5 μm. Data information: in (A–C) data are presented as mean ± SD. Asterisks indicate that differences between mean ranks are statistically significant, ****p<0.0001 (Mann-Whitney U test).
Figure 5 with 1 supplement
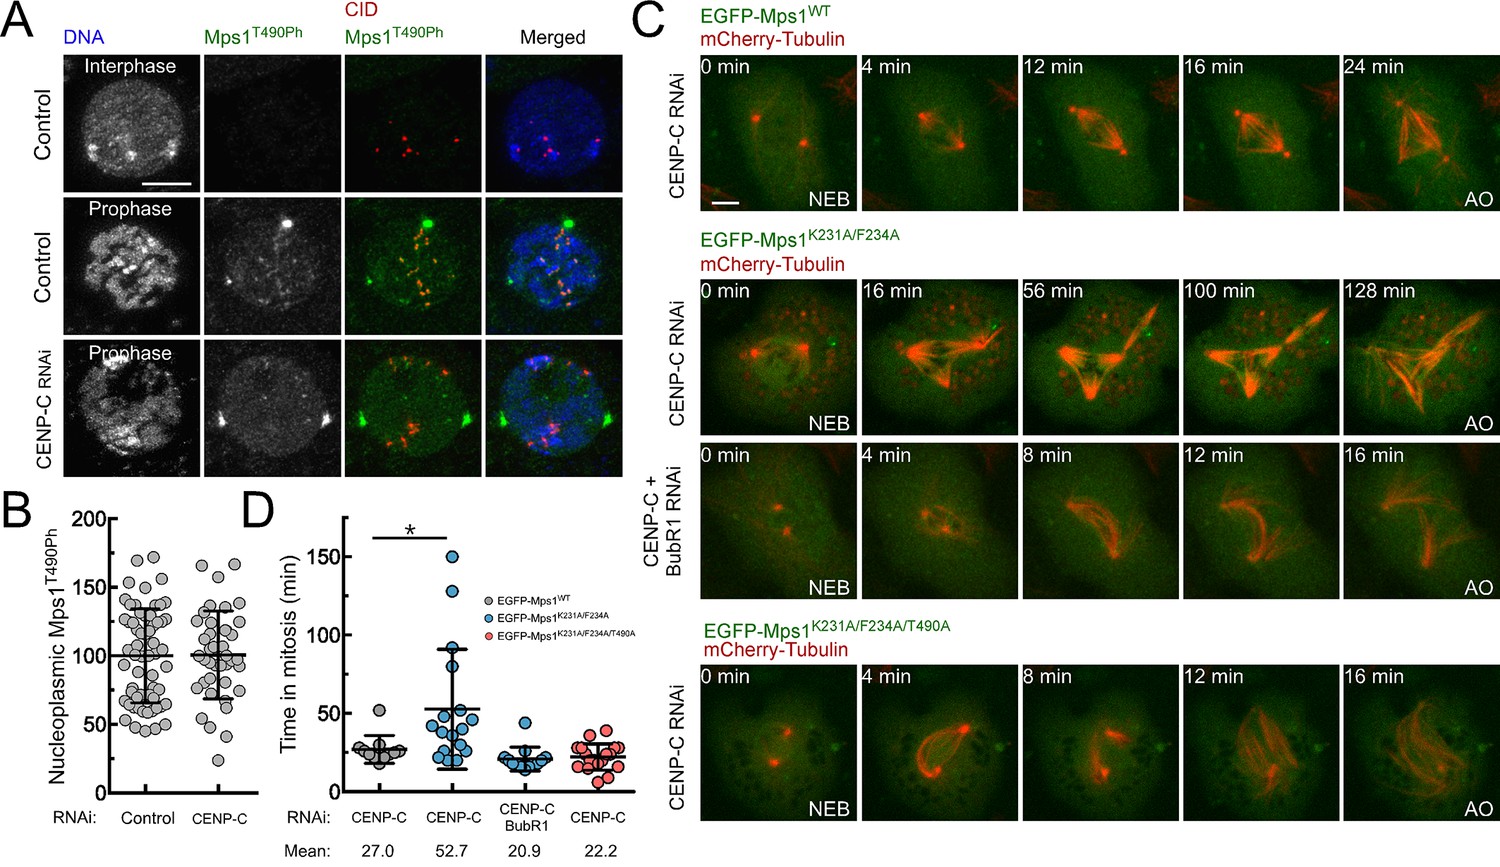
PP1-87B-mediated inactivation of cytosolic Mps1 is required for efficient SAC silencing and timely anaphase onset.
(A,B) Representative immunofluorescence images (A) and corresponding quantification (B) of Mps1T490Ph levels in the nucleoplasm of control and CENP-C depleted cells in prophase. Mean values for control cells were set to 100% (N ≥ 40 cells for each condition from four independent experiments). Scale bar: 5 μm. (C,D) mitotic progression (C) and mitotic timing (D) of CENP-C depleted S2 cells expressing mCherry-Tubulin and EGFP-Mps1WT, EGFP-Mps1K231A/F234A or EGFP-Mps1K231A/F234A/T490A under control of Mps1 cis-regulatory region. Mitotic progression was monitored through time-lapse microscopy and the mitotic timing was defined by the length of time between nuclear envelope breakdown (NEB) and anaphase onset (AO) (N ≥ 11 cells for each condition from at least two independent experiments). Scale bar: 5 μm. Data information: in (B) and (D) data are presented as mean ± SD. Asterisks indicate that differences between mean ranks are statistically significant, *p<0.05 (Mann-Whitney U test). Numerical source data for this figure are provided in Figure 5—source data 1.
-
Figure 5—source data 1
Numerical data for Figure 5.
- https://doi.org/10.7554/eLife.25366.029
Figure 5—figure supplement 1
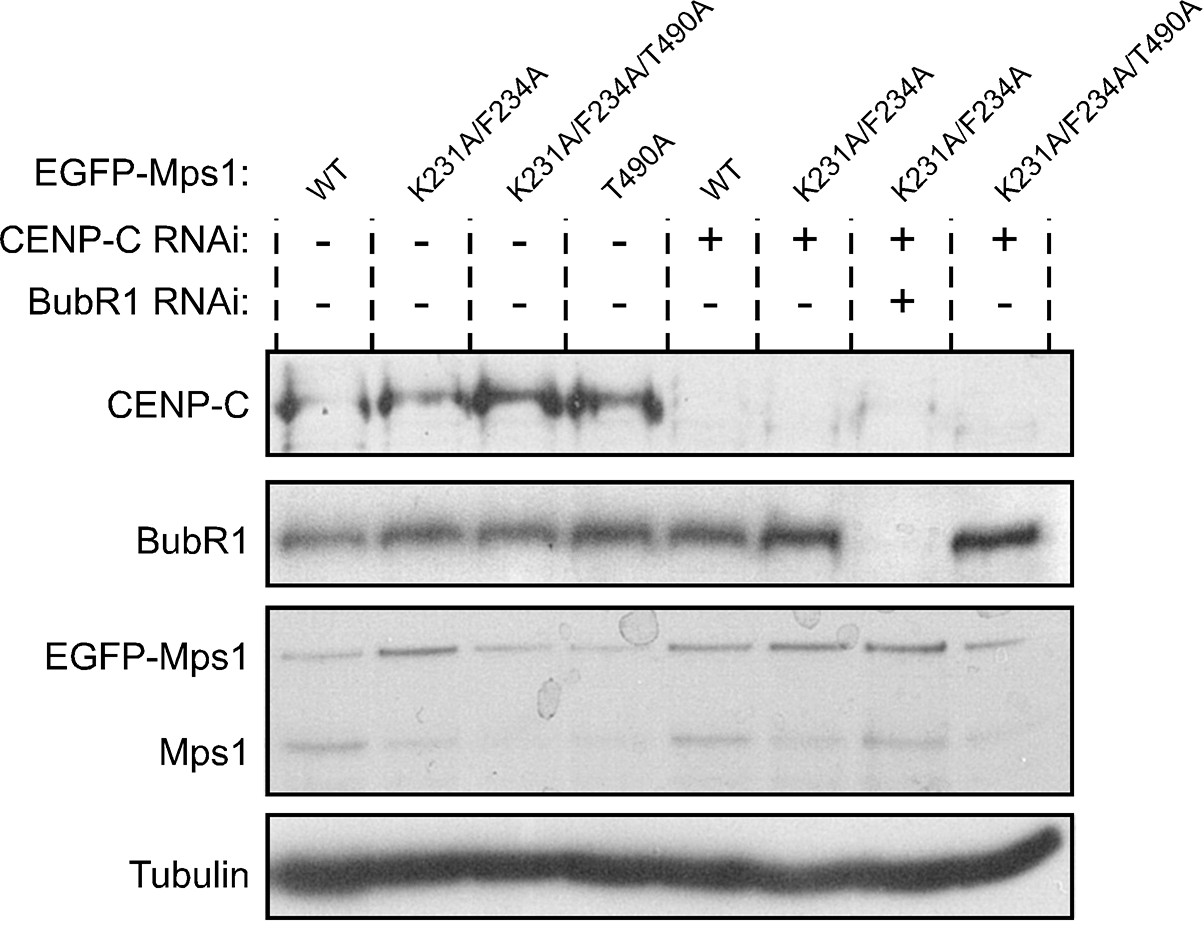
Western blotting analysis of EGFP-Mps1WT, EGFP-Mps1K231A/F234A and EGFP-Mps1K231A/F234A/T490A expression in CENP-C depleted S2 cells.
Western blot of analysis of CENP-C and BubR1 depletion and of EGFP-Mps1WT, EGFP-Mps1K231A/F234A and EGFP-Mps1K231A/F234A/T490A expression in S2 cells used in the studies described in Figure 5C. α-Tubulin was used as loading control. Expression of EGFP-Mps1 transgenes was under control of Mps1 cis-regulatory region.
Figure 6
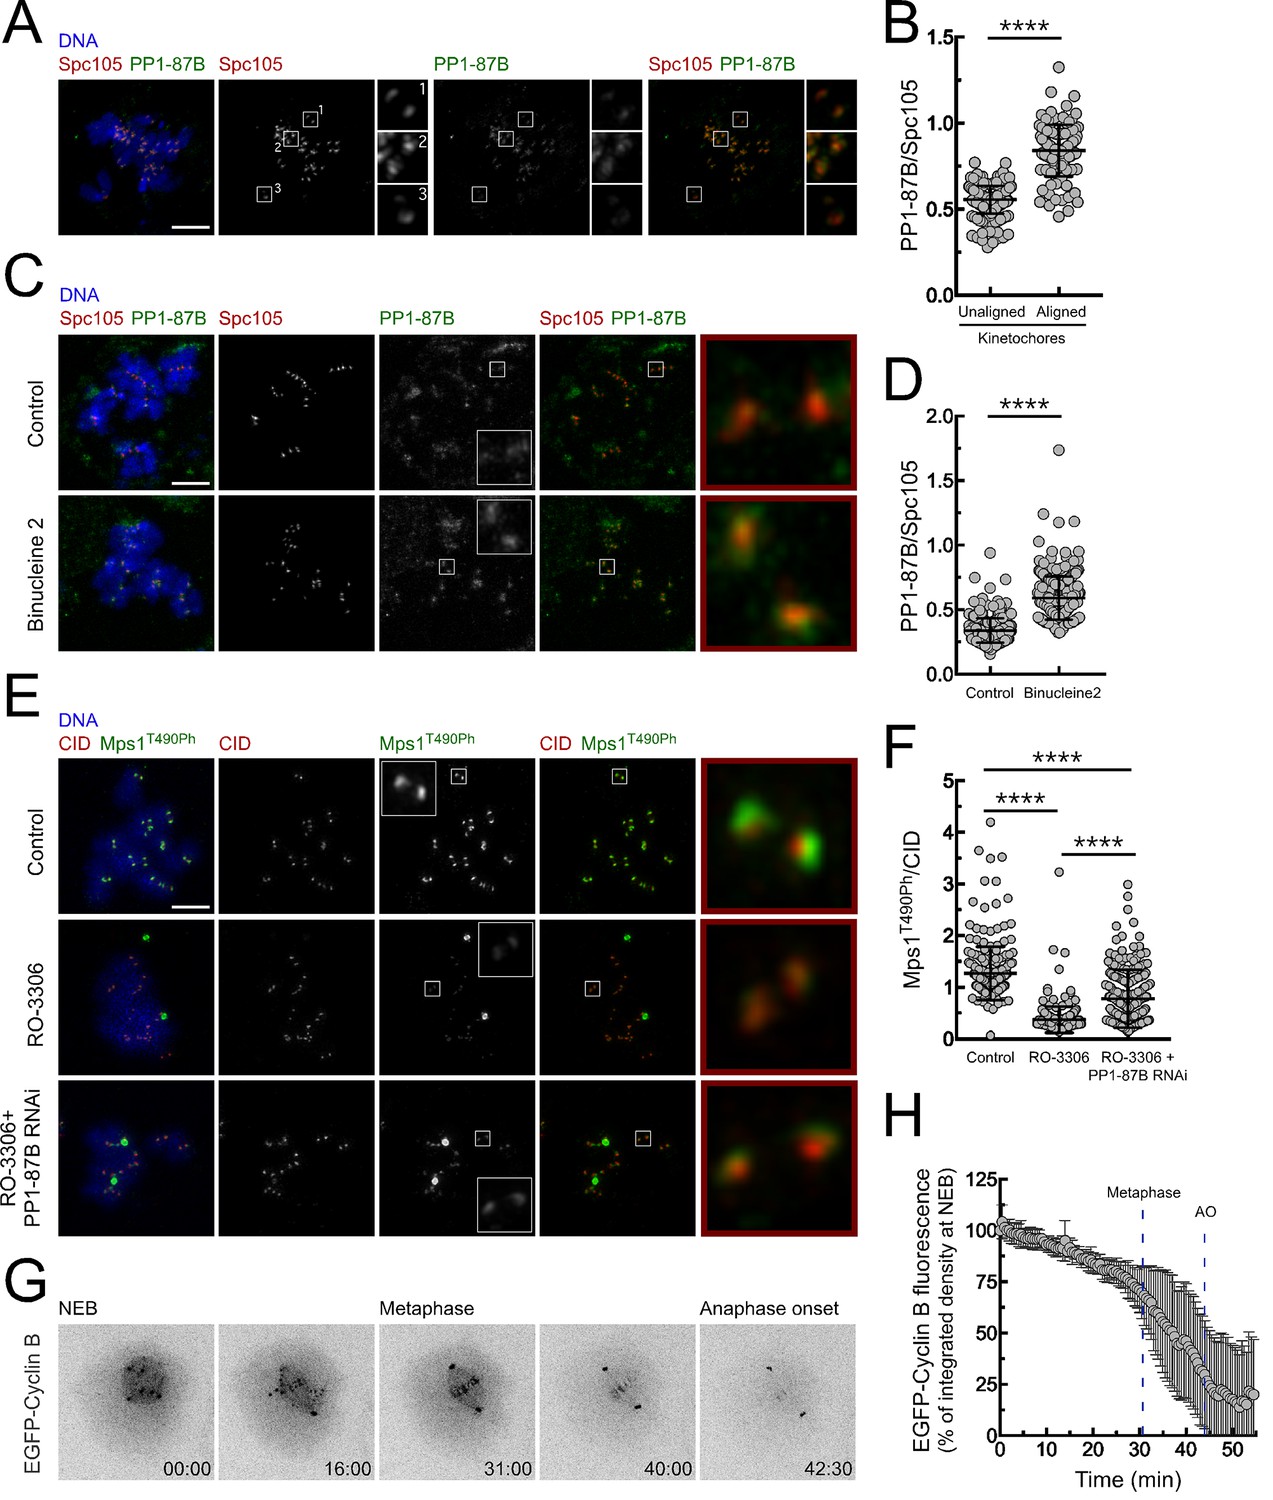
Regulation of PP1-87B activity during mitosis.
(A,B) Representative immunofluorescence images (A) and corresponding quantifications (B) of PP1-87B levels at kinetochores of unaligned and aligned chromosomes in S2 cells. PP1-87B fluorescence intensities were determined relative to Spc105 signal (N = 241 unaligned kinetochores and N = 110 aligned kinetochores from at least 6 cells). Scale bar: 5 μm. (C,D) Representative immunofluorescence images (C) and corresponding quantifications (D) of PP1-87B levels at unattached kinetochores of control and Binucleine 2-treated S2 cells. Cells were treated with MG132 (20 µM) for 1 hr followed by a 2 hr incubation with colchicine (30 µM) to generate unattached kinetochores. Binucleine 2 (20 µM) was added to cultures 30 min prior to colchicine treatment. PP1-87B fluorescence intensities were determined relative to Spc105 signal (N ≥ 282 kinetochores from at least 12 cells for each condition). Scale bar: 5 μm. (E,F) Representative immunofluorescence images (E) and corresponding quantifications (F) of Mps1T490Ph levels at unattached kinetochores of control and PP1-87B depleted cells in the presence of CDK1 inhibitor (RO-3306, 10 µM) for 1 hr. To generate unattached kinetochores cultured cells were incubated with colchicine (30 µM) for 2 hr. The insets display magnifications of the outlined regions. Mps1T490Ph fluorescence intensities were determined relative to CID signal (N ≥ 236 kinetochores from at least 10 cells for each condition). Scale bar: 5 μm. (G,H) Representative mitotic progression (G) and Cyclin B degradation profile (H) of S2 cells during an unperturbed mitosis. Mitotic progression of S2 cells expressing EGFP-Cyclin B was monitored by time-lapse microscopy and the integrated intensity of EGFP-Cyclin B fluorescence measured in all the frames. The values for EGFP-Cyclin B fluorescence at nuclear envelope breakdown (NEB) (time 0 min) were set to 100%. Dashed blue lines indicate the mean time from NEB to metaphase and to anaphase onset (AO) (N = 5 cells from a single experiment). Data information: in (B), (D), (F) and (H) data are presented as mean ± SD. Asterisks indicate that differences between mean ranks are statistically significant, ****p<0.0001 (Mann-Whitney U test). Numerical source data for this figure are provided in Figure 6—source data 1.
-
Figure 6—source data 1
Numerical data for Figure 6.
- https://doi.org/10.7554/eLife.25366.036
Figure 7

A model for regulation of Mps1 activation/inactivation in mitosis.
Proposed model for regulation of soluble- and kinetochore-Mps1 activation in mitosis. During prometaphase, Aurora B potentiates the recruitment of Mps1 to unattached kinetochores and phosphorylates KNL1/Spc105 to limit PP1 kinetochore association. This allows the accumulation of active Mps1 at unattached kinetochores to instate efficient MCC assembly. In parallel, high levels of active CDK1 repress PP1 activity in the cytoplasm, which prevents the dephosphorylation and consequently inactivation of soluble Mps1. Active Mps1 in the cytoplasm promotes the assembly and/or prevents the disassembly of APC/C inhibitory complexes through mechanisms that are yet to be described. Cytoplasmic-and kinetochore generated MCC orchestrated by Mps1 cooperate to ensure efficient APC/C inhibition during unperturbed early mitosis. End-on attachment of microtubules mediated by the Ndc80 complex and KNL1 prevent the recruitment of Mps1 and exert tension across kinetochores and/or impose alterations on kinetochore architecture. Under these conditions, phosphorylation of KNL1 by Aurora B is minimal, and PP1 becomes enriched at bioriented kinetochores, where it dephosphorylates and inactivates the remaining residual pool of Mps1. Declining levels of active CDK1 allow PP1 to auto-activate and repress Mps1 activity in the cytoplasm, hence ensuring efficient SAC silencing and prompt anaphase onset.
Videos
Video 1
Mitotic progression of Drosophila S2 cells expressing Mad1-EGFP and mCherry-α-Tubulin (related to Figure 1A,B and Figure 1—figure supplement 1).
Mitotic progression of S2 cells co-expressing mCherry-α-Tubulin (red) and Mad1-EGFP (green) was monitored by spinning disk confocal microscopy. Each frame represents a maximal intensity projection acquired every 60 s. NEB corresponds to time 0:0. Time is shown minutes.
Video 2
Mitotic progression of PP1-87B depleted Drosophila S2 cells expressing Mad1-EGFP and mCherry-α-Tubulin (related to Figure 1A,B and Figure 1—figure supplement 1).
Mitotic progression of S2 cells depleted of PP1-87B co-expressing mCherry-α-Tubulin (red) and Mad1-EGFP (green) was monitored by spinning disk confocal microscopy. Video illustrates the prolonged metaphase duration with Mad1-EGFP present at kinetochores of bioriented chromosomes in PP1-87B depleted cells. Each frame represents a maximal intensity projection acquired every 60 s. NEB corresponds to time 0:0. Time is shown minutes.
Video 3
Mitotic progression of PP1-87B and Mps1 depleted Drosophila S2 cells expressing Mad1-EGFP and mCherry-α-Tubulin (related to Figure 1A,B and Figure 1—figure supplement 1).
Mitotic progression of S2 cells co-depleted of PP1-87B and Mps1 co-expressing mCherry-α-Tubulin (red) and Mad1-EGFP (green) was monitored by spinning disk confocal microscopy. Video illustrates that Mps1 depletion abolishes the prolonged metaphase delay and Mad1-EGFP accumulation at bioriented kinetochores observed in PP1-87B depleted cells. Each frame represents a maximal intensity projection acquired every 60 s. NEB corresponds to time 0:0. Time is shown minutes.
Video 4
Inducible speckle imaging (ISI) in a metaphase spindle of a control S2 cell expressing GFP-α-Tubulin and CID-mCherry (related to Figure 1H,I and Figure 1—figure supplement 2).
The Video illustrates ISI imprinting and progressive contrast fade-out of GFP–α-tubulin in a control metaphase spindle. The observed speckle contrast fadeout of tubulin is due to microtubule turnover. The time between frames is variable and is presented on the corresponding excel source data file.
Video 5
Inducible speckle imaging (ISI) in a metaphase spindle of a PP1-87B depleted S2 cell expressing GFP-α-Tubulin and CID-mCherry (related to Figure 1H,I and Figure 1—figure supplement 2).
The Video illustrates ISI imprinting and progressive contrast fade-out of GFP–α-tubulin in a PP1-87B depleted metaphase spindle. The observed speckle contrast fadeout of tubulin is due to microtubule turnover. The time between frames is variable and is presented on the corresponding excel source data file.
Video 6
Mitotic progression of Drosophila S2 cells expressing EGFP-Mps1WT and mCherry-α-Tubulin (related to Figure 2—figure supplement 1A,B).
Mitotic progression of S2 cells expressing mCherry-α-Tubulin (red) and EGFP-Mps1WT (green) monitored by spinning disk confocal microscopy. Each frame represents a maximal intensity projection acquired every 2 min. NEB corresponds to time 0:0. Time is shown minutes.
Video 7
Mitotic progression of Drosophila S2 cells expressing EGFP-Mps1WTand mCherry-α-Tubulin (related to Figure 4A,B).
Mitotic progression of S2 cells expressing mCherry-α-Tubulin (red) and EGFP-Mps1WT (green) monitored by spinning disk confocal microscopy. Each frame represents a maximal intensity projection acquired every 7 min. NEB corresponds to time 0:0. Time is shown minutes.
Video 8
Mitotic progression of Drosophila S2 cells expressing EGFP-Mps1K231A/F234A and mCherry-α-Tubulin (related to Figure 4A,B).
Mitotic progression of S2 cells expressing mCherry-α-Tubulin (red) and EGFP-Mps1K231A/F234A (green) monitored by spinning disk confocal microscopy. Video illustrates the prolonged metaphase delay. Each frame represents a maximal intensity projection acquired every 5 min. NEB corresponds to time 0:0. Time is shown minutes.
Video 9
Mitotic progression of BubR1-depleted Drosophila S2 cells expressing EGFP-Mps1K231A/F234A and mCherry-α-Tubulin (related to Figure 4A,B).
Mitotic progression of S2 cells depleted of BubR1 and expressing mCherry-α-Tubulin (red) and EGFP-Mps1 K231A/F234A (green) monitored by spinning disk confocal microscopy. Video illustrates that the prolonged metaphase duration caused by the expression of EGFP-Mps1K231A/F234A is SAC-dependent. Each frame represents a maximal intensity projection acquired every 4 min. NEB corresponds to time 0:0. Time is shown minutes.
Video 10
Mitotic progression of CENP-C depleted Drosophila S2 cells expressing EGFP-Mps1WT and mCherry-α-Tubulin (related to Figure 5C,D).
S2 cells depleted of CENP-C expressing mCherry-α-Tubulin (red) and EGFP-Mps1WT (green) monitored by spinning disk confocal microscopy. Each frame represents a maximal intensity projection acquired every 4 min. NEB corresponds to time 0:0. Time is shown minutes.
Video 11
Mitotic progression of CENP-C depleted Drosophila S2 cells expressing EGFP-Mps1K231A/F234A and mCherry-α-Tubulin (related to Figure 5C,D).
S2 cells depleted of CENP-C expressing mCherry-α-Tubulin (red) and EGFP-Mps1K231A/F234A (green) monitored by spinning disk confocal microscopy. Video illustrates that impairing the interaction between Mps1 and PP1-87B delays mitotic exit in kinetochore-null cells. Each frame represents a maximal intensity projection acquired every 4 min. NEB corresponds to time 0:0. Time is shown minutes.
Video 12
Mitotic progression of Drosophila S2 cells co-depleted of CENP-C and BubR1 expressing EGFP-Mps1K231A/F234A and mCherry-α-Tubulin (related to Figure 5C,D).
S2 cells co-depleted of CENP-C and BubR1 expressing mCherry-α-Tubulin (red) and EGFP-Mps1K231A/F234A (green) monitored by spinning disk confocal microscopy. Video illustrates that the depletion of BubR1 from kinetochore-null cells expressing EGFP-Mps1K231A/F234A accelerates anaphase onset. Each frame represents a maximal intensity projection acquired every 4 min. NEB corresponds to time 0:0. Time is shown minutes.
Video 13
Mitotic progression of CENP-C depleted Drosophila S2 cells expressing EGFP-Mps1K231A/F234A/T490A and mCherry-α-Tubulin (related to Figure 5C,D).
S2 cells depleted of CENP-C expressing mCherry-α-Tubulin (red) and EGFP-Mps1K231A/F234A/T490A (green) monitored by spinning disk confocal microscopy. Video illustrates that the extended mitotic timing in kinetochore-null cells expressing EGFP-Mps1K231A/F234A requires Mps1 T-loop phosphorylation. Each frame represents a maximal intensity projection acquired every 4 min. NEB corresponds to time 0:0. Time is shown minutes.
Video 14
Mitotic progression of Drosophila S2 cells expressing EGFP-Cyclin B. (related to Figure 6G,H).
S2 cells expressing mCherry-α-Tubulin (red) and EGFP-Cyclin B (green) monitored by spinning disk confocal microscopy. Each frame represents a maximal intensity projection acquired every 30 s. NEB corresponds to time 0:0. Time is shown minutes.
Download links
A two-part list of links to download the article, or parts of the article, in various formats.
Downloads (link to download the article as PDF)
Open citations (links to open the citations from this article in various online reference manager services)
Cite this article (links to download the citations from this article in formats compatible with various reference manager tools)
Protein Phosphatase 1 inactivates Mps1 to ensure efficient Spindle Assembly Checkpoint silencing
eLife 6:e25366.
https://doi.org/10.7554/eLife.25366


