A cellular mechanism for inverse effectiveness in multisensory integration
- Brown University, United States
- Bard College, Unied States
- Roger Williams University, United States
Figures
Figure 1
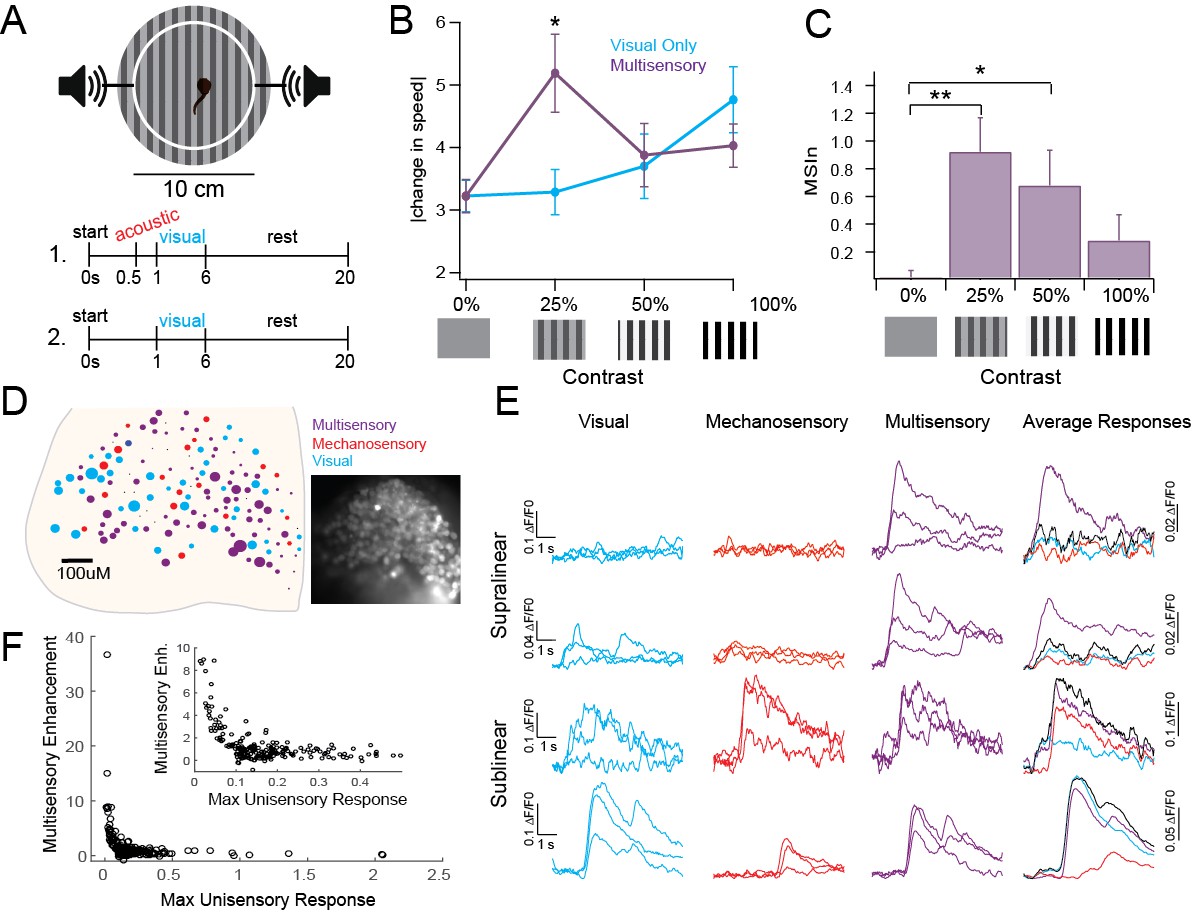
Inverse effectiveness persists at behavioral and network levels.
(A) Diagram of behavioral experiment showing timing of auditory and visual stimulus delivery, see Methods for details. (B). Change in swimming speed in response to visual stimuli of varying contrasts, with and without subthreshold acoustic prestimulus. Notice that multisensory enhancement is only observed with low saliency stimuli. Mean and SD are plotted. Unisensory: 0%: 3.22 ± 0.25, 25%: 3.29 ± 0.36 cm/s, 50%: 3.7 ± 0.51, 100%: 4.76 ± 0.53 cm/s. Multisensory: 0%: 3.22 ± 0.27, 25%: 5.19 ± 0.62 cm/s, 50%: 3.88 ± 0.51 cm/s, 100%: 4.03 ± 0.34 cm/s. n = 37 tadpoles each receiving visual and multisensory stimuli across every randomly assigned contrast. Two-way analyses for Visual Condition Vs. Multisensory condition: 0%: p>0.999, t(144)=0.005431; 25%: p=0.0013, t(144)=3.684; 50%: p=0.9948, t(144)=0.3431; 100%: p=0.4994, t(144)=1.416. (C) MSIn for each contrast level. All individual responses, as well as mean and interquartile range are plotted. Mean and SD: 0%: 0.018 ± 0.05, 25%: 0.92 ± 0.244, 50%: 0.68 ± 0.25, 100%: 0.28 ± 0.18. n = 37 tadpoles as described in Figure 1B legend. One-way analyses for MSIn: 0% Vs. 25%: p=0.002, q(36)=3.703; 0% Vs. 50%: p=0.0345, q(36)=2.613; 0% Vs. 100%: p=0.3981, q(36)=1.357. (D) Distribution of cells across one tectum coded by response type and intensity. Color indicates primary modality; size indicates size of largest response. Inset: Fluorescent image of OGB1-AM loaded tectum. (E) Example responses to unisensory and multisensory stimuli indicating different types of multisensory interactions. (F) Plot of single modality response vs MSIn across 231 ROIs shows IE. Exponential fit = a(b*x); a = 27.21 (21.93, 32.5), b = −41.03 (−47.85,–34.21), Adjusted R2 = 0.575.
-
Figure 1—source data 1
Data for Figure 1.
Excel table contains raw data points used to generate figure, organized by panel.
- https://doi.org/10.7554/eLife.25392.003
Figure 2

Inverse effectiveness is not dependent on inhibition.
(A) Maximum unisensory responses in spike output plotted against MSIn in Stage 49 tadpoles in control (n = 40, cells) conditions and with GABA-R blocker (n = 22; picrotoxin). Despite the apparent boost in MSI for the picrotoxin group across all response sizes, the decay trend for inverse effectiveness remains intact and similar to the control group. Curves represent a single exponential decay fit using the least-squares method.
-
Figure 2—source data 1
Data for Figure 2.
Excel sheet contains raw data points used to generate figure.
- https://doi.org/10.7554/eLife.25392.005
Figure 3

NMDAR activation mediates MSI.
(A) Evoked synaptic responses produced either by a visual stimulus only, a mechanosensory stimulus only, or paired stimuli with a 50 ms interval. Pairing small, subthreshold responses results in large MSI. (B) Average MSIn for suprathreshold (MSIn = 0.12 ± 0.035, n = 10 cells) and subthreshold stimuli (MSIn = 4.34 ± 1.176, n = 6 cells, p=0.0002, Mann-Whitney U = 0). (C) Comparison of arithmetic sum of evoked subthreshold visual and hindbrain responses to evoked crossmodal responses in control and with NMDAR antagonist, APV (50 mM). (D) NMDAR-blocked cells exhibit significant lower levels of MSIn as compared to control cells (Control MSIn = 4.34 ± 1.18, n = 6 cells, NMDAR-block MSIn = 1.11 ± 0.43, n = 10 cells, p=0.016, Mann-Whitney U = 8). (E) Comparison of the linear sum of evoked visual and hindbrain responses (V+H) against the actual evoked crossmodal response (VH). Line indicates linearity. Values above and below diagonal show supralinear and sublinear multisensory responses, respectively. Notice that the APV group more closely approaches linearity. (F) Example loose-cell attached spike recordings to different stimulus conditions with and without APV. Note that NMDAR-blocked cells exhibit stunted supralinear multisensory responses. (G) Comparison of the linear sum of evoked visual and hindbrain spiking responses (V+H) against the actual evoked crossmodal response (VH). (H) Tadpoles in different experimental groups demonstrated different levels of behavioral MSI (ANCOVA F(2,50)=4.1, p=0.02 after adjustment for tadpole responsiveness to unisensory acoustic stimuli: covariate F(1,50)=6.1, p=0.02). In the pharmacological control group, MSI for low-contrast stimuli (0.12 ± 0.13; n = 15) was significantly higher than both zero (one-sample t-test p=0.005), and MSI for high-contrast visual stimuli (−0.10 ± 0.31, n = 23; post-ANCOVA Tukey HSD test p=0.03). The effect of MSI for low-contrast visual stimuli after pharmacological blockade of NMDA receptors with MK801 was close to zero (0.04 ± 0.21, n = 15), and was not significantly different from control MSI for either low- or high-contrast stimuli (Tukey HSD p>0.2).
-
Figure 3—source data 1
Source data for Figure 3.
Excel sheet contains individual data points used to generate figure, organized by panel.
- https://doi.org/10.7554/eLife.25392.007
Download links
A two-part list of links to download the article, or parts of the article, in various formats.
Downloads (link to download the article as PDF)
Open citations (links to open the citations from this article in various online reference manager services)
Cite this article (links to download the citations from this article in formats compatible with various reference manager tools)
A cellular mechanism for inverse effectiveness in multisensory integration
eLife 6:e25392.
https://doi.org/10.7554/eLife.25392


