RNA-dependent chromatin association of transcription elongation factors and Pol II CTD kinases
- Max Planck Institute for Biophysical Chemistry, Germany
- Center for Innovative Medicine and Science for Life Laboratory, Novum, Karolinska Institutet, Sweden
Figures
Figure 1 with 1 supplement

Many elongation factors (EFs) bind RNA in vivo.
PAR-CLIP signal strength for EFs varies. The barplots show log2 fold-enrichments of transcript-averaged PAR-CLIP signals over the averaged PAR-CLIP signal for initiation factor TFIIB, which shows background RNA binding. Averaged PAR-CLIP signals were calculated by taking mean transcript PAR-CLIP signals averaged over all mRNAs, which were filtered to be 800–5000 nt long and at least 150 nt away from neighboring transcripts (2532 mRNAs). Heat plots averaged over mRNA transcripts of the corresponding PAR-CLIP signals are shown in Figure 1—figure supplement 1A.
Figure 1—figure supplement 1
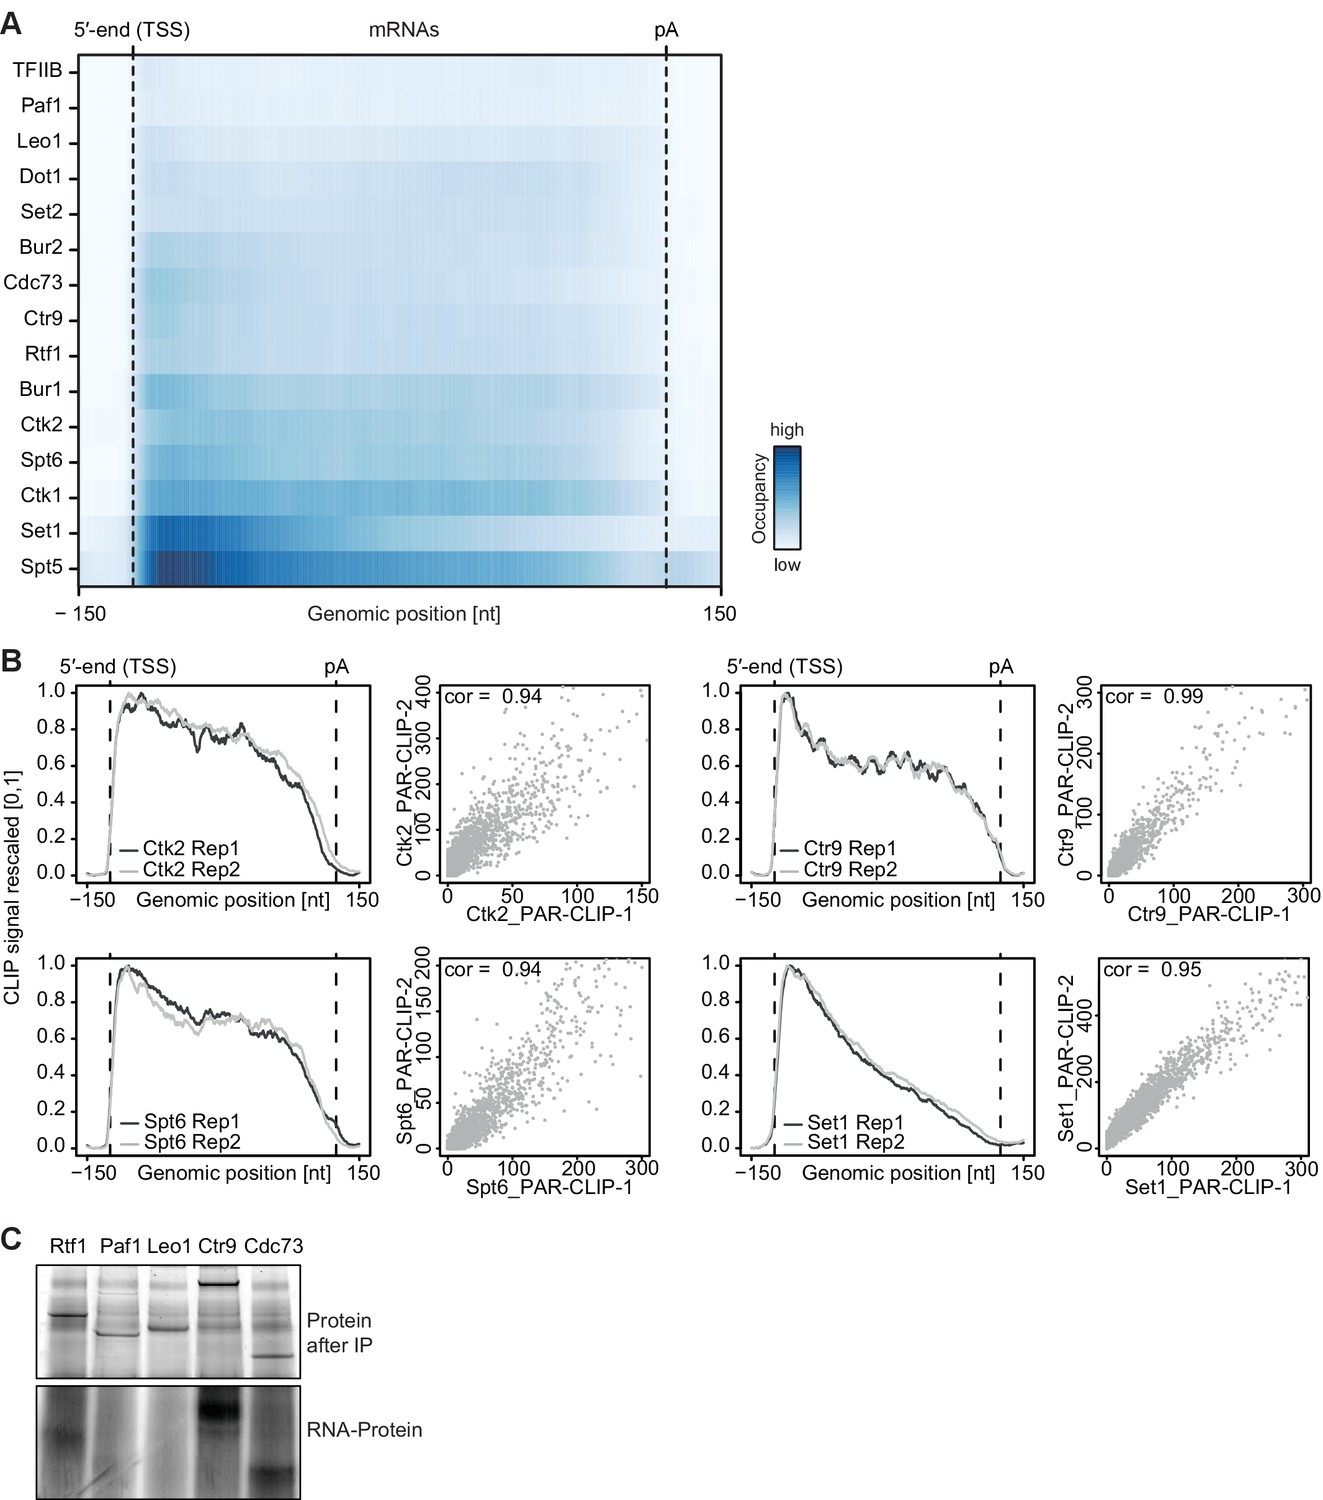
Confirmatory information on PAR-CLIP experiments.
(A) Smoothed, raw PAR-CLIP signals (as measured by the number of PAR-CLIP U-to-C transitions per U site) over a set of 2532 selected mRNAs were aligned at their 5′-end (TSS), scaled to a common length, then averaged (Materials and methods). The color code shows the PAR-CLIP signal relative to the maximum PAR-CLIP signal of all profiles (dark blue). Since PAR-CLIP signals of Set1 and Spt5 were much higher than those of other EFs, Set1 and Spt5 occupancies were divided by a factor of 1.5 and 3, respectively, for visualization purposes. (B) Replicate measurements show very high correlations. Comparison of PAR-CLIP replicate measurements for Ctk2, Ctr9, Spt6 and Set1. Smoothed, averaged PAR-CLIP profiles and scatterplots comparing the number of observed crosslinking sites per transcript for all mRNAs shown in (A) using Pearson correlation are shown. (C) Confirmation that Paf1C interacts with RNA through its subunits Rtf1, Ctr9 and Cdc73. (top) SDS PAGE analysis of RNA binding to Paf1C subunits after IP (Coomassie stain). Paf1C subunits can be individually pulled down with IgG beads against the C-terminal TAP tag of each of the five Paf1C subunits. (bottom) SDS-PAGE analysis of radioactively labeled RNA that was co-precipitated with Paf1C subunits. Only subunits Rtf1, Ctr9 and Cdc73 show detectable co-precipitation with RNA, showing that PAR-CLIP signals are subunit-specific.
Figure 2 with 1 supplement
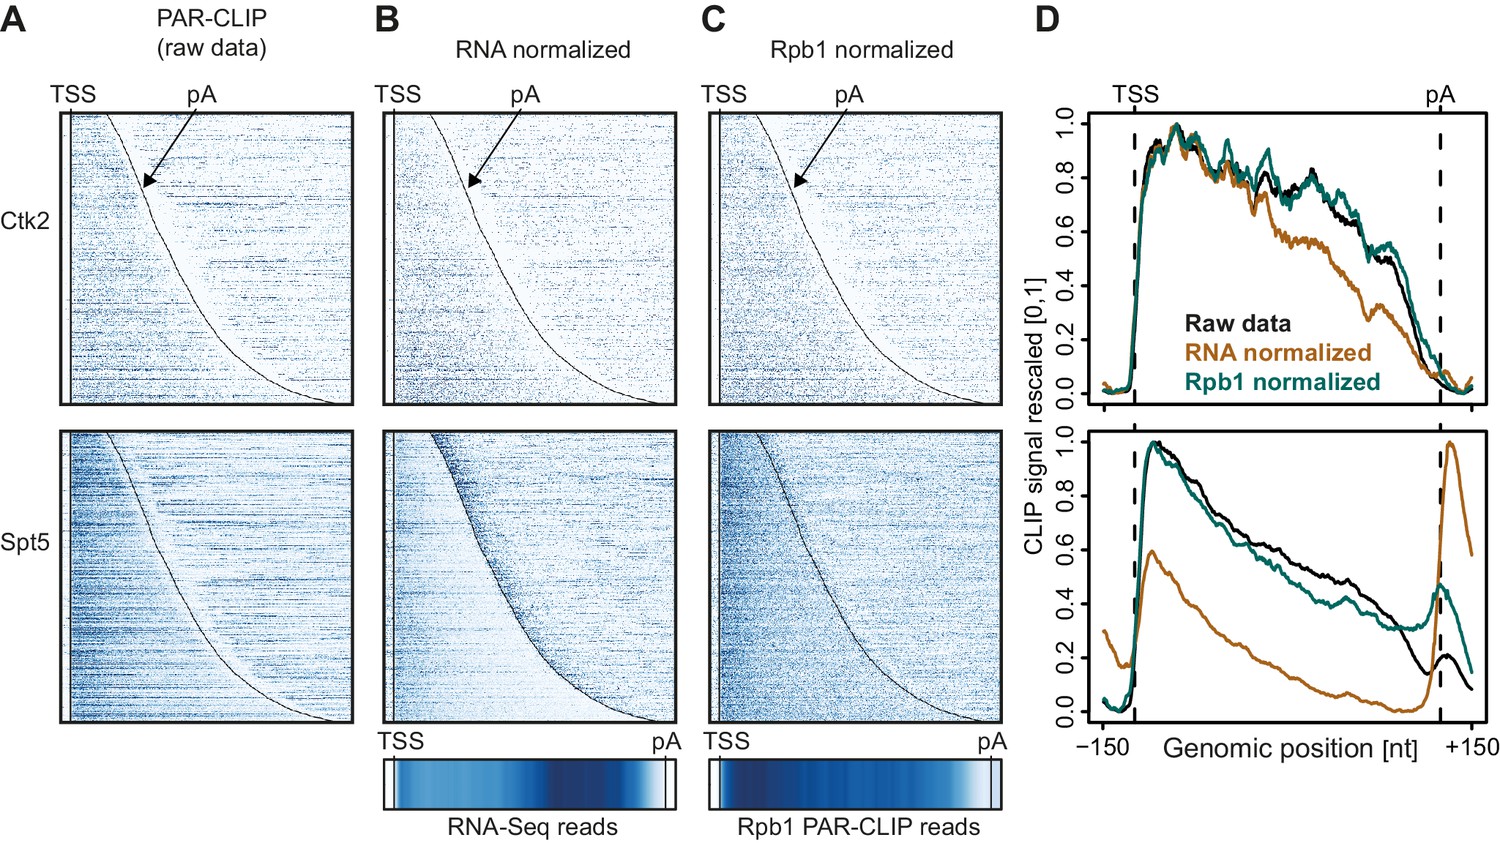
Normalization of PAR-CLIP data shown for two representative EFs, Ctk2 (top) and Spt5 (bottom).
(A) Smoothed, raw RNA-binding strength as measured by the number of PAR-CLIP U-to-C transitions per U site for all mRNAs sorted by length and aligned at their RNA 5′-end (transcription start site, TSS). (B) Relative occupancy estimated by dividing the number of U-to-C transitions for each U site by the RNA-Seq signal at the corresponding genomic position for all mRNAs. A heat map showing the transcript-averaged RNA-Seq reads for all mRNAs scaled to the same length is shown below. (C) Relative occupancy estimated by dividing the number of U-to-C transitions for each U site by the Rpb1 PAR-CLIP signal at the corresponding genomic position for all mRNAs. A heat map showing the transcript-averaged Rpb1 PAR-CLIP reads for all mRNAs scaled to the same length is shown below. (D) Smoothed, raw and normalized PAR-CLIP signals as shown in A-C but averaged over all mRNAs. Before averaging RNA occupancy profiles were aligned at the RNA 5′-end and length-scaled such that the 5′-ends and pA sites coincided.
Figure 2—figure supplement 1
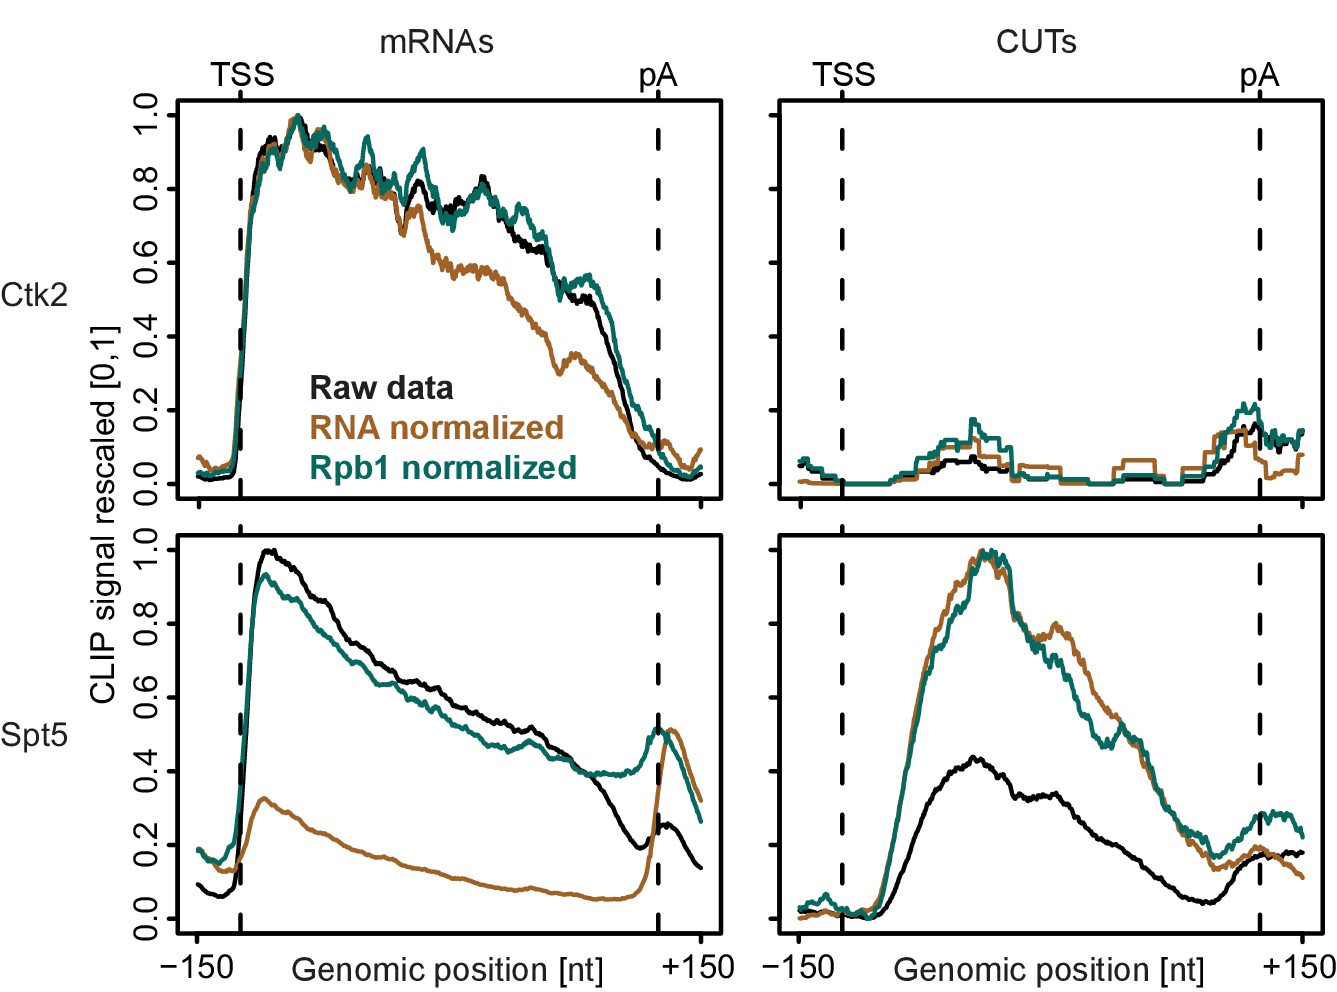
Normalization of PAR-CLIP data shown for two representative EFs, Ctk2 (top) and Spt5 (bottom), at mRNAs (left) versus CUTs (right).
Smoothed, raw and normalized PAR-CLIP signals as shown in Figure 2D but averaged over mRNAs (left) and CUTs (right). After normalization, average mRNA and CUT profiles were rescaled together, setting the maximum occupancy to one and the minimum occupancy to 0. This shows that after Pol II PAR-CLIP normalization Spt5 signals are equally high at mRNAs and CUTs, while no RNA normalization leads to less Spt5 signal at CUTs (due to less transcription of CUTs) and total RNA normalization leads to increased Spt5 levels at CUTs (due to decreased detection of unstable transcripts). Since Spt5 binds Pol II immediately downstream of initiation, differences in Spt5 RNA binding between mRNAs and CUTs would not be expected, arguing that Pol II normalization helps to correctly interpret the data.
Figure 3 with 1 supplement

mRNA-binding profiles of EFs.
(A) Smoothed, transcript-averaged Pol II normalized PAR-CLIP occupancy profiles of EFs centered around the transcript 5′-end (transcription start site, TSS) [−150 nt to +400 nt] and pA site [−400 nt to +150 nt] of a set of 2532 filtered mRNAs (compare Figure 1). Only factors with average RNA-binding occupancies > 2 fold above background are shown. The Spt5 PAR-CLIP profile reveals a peak downstream of the pA site that is discussed in detail elsewhere (Baejen et al., 2017). The color code shows the occupancy relative to the maximum occupancy per profile (dark blue). (B) EFs bind to pre-mRNA. Processing indices (PIs) measure preferential binding of factors to uncleaved pre-mRNA with respect to cleaved RNA, computed as log2 odds ratios uncleaved versus cleaved RNA bound by the factor (Materials and methods). The PIs for Pab1 and Pub1, as typical factors binding mature mRNA (Baejen et al., 2014), are shown for comparison. (C) Colocalization of factor crosslinking sites on transcripts. Euclidean distances between pairwise colocalization measures were subjected to average-linkage hierarchical clustering (Materials and methods). The cluster dendrogram shows similarities in crosslinking locations on transcripts between EFs and published RNA processing factors (Baejen et al., 2014; Schulz et al., 2013).
Figure 3—figure supplement 1
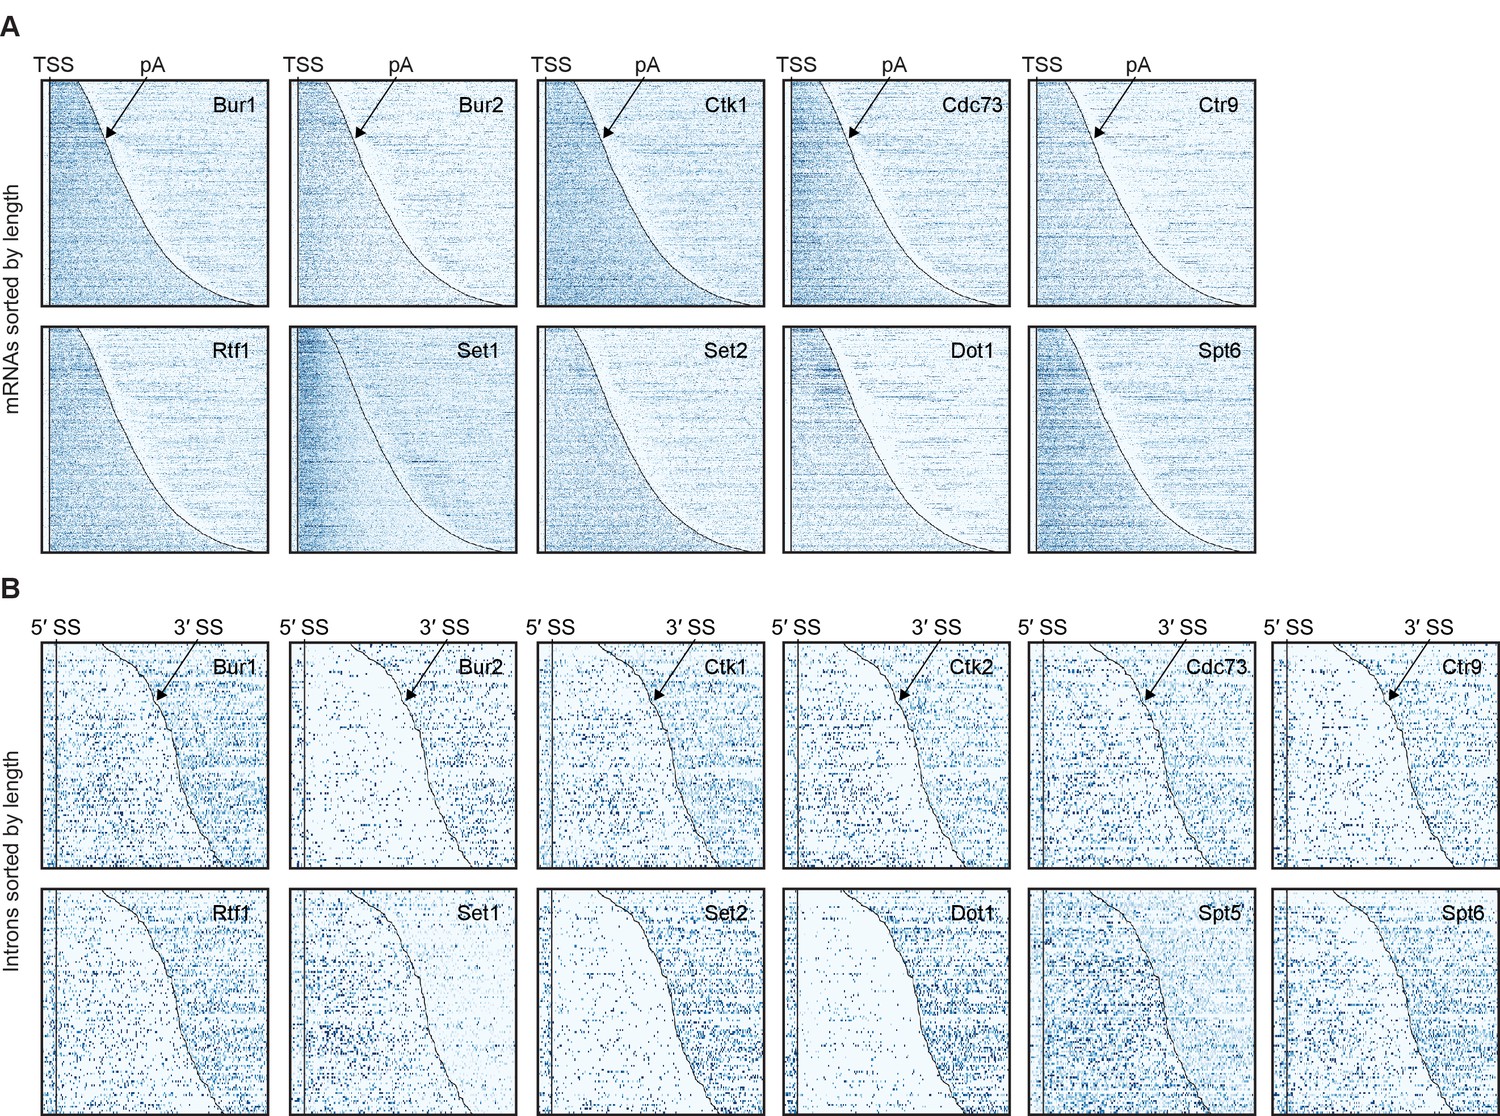
Non-averaged elongation factor RNA occupancies over mRNAs and introns.
(A) Transcript-wise Pol II normalized elongation factor PAR-CLIP occupancies. Smoothed occupancy profiles derived from PAR-CLIP data for a set of 2532 selected mRNAs. Transcripts were sorted by length and aligned at their 5′-end (transcription start site, TSS). Plots for Ctk2 and Spt5 are shown in Figure 2C. (B) Smoothed Pol II normalized PAR-CLIP occupancy profiles over all introns. Each line represents an intron, and introns were sorted by length and aligned at their 5′ splice site (5′SS). Only introns of lengths between 150 and 650 nt are shown.
Figure 4 with 1 supplement
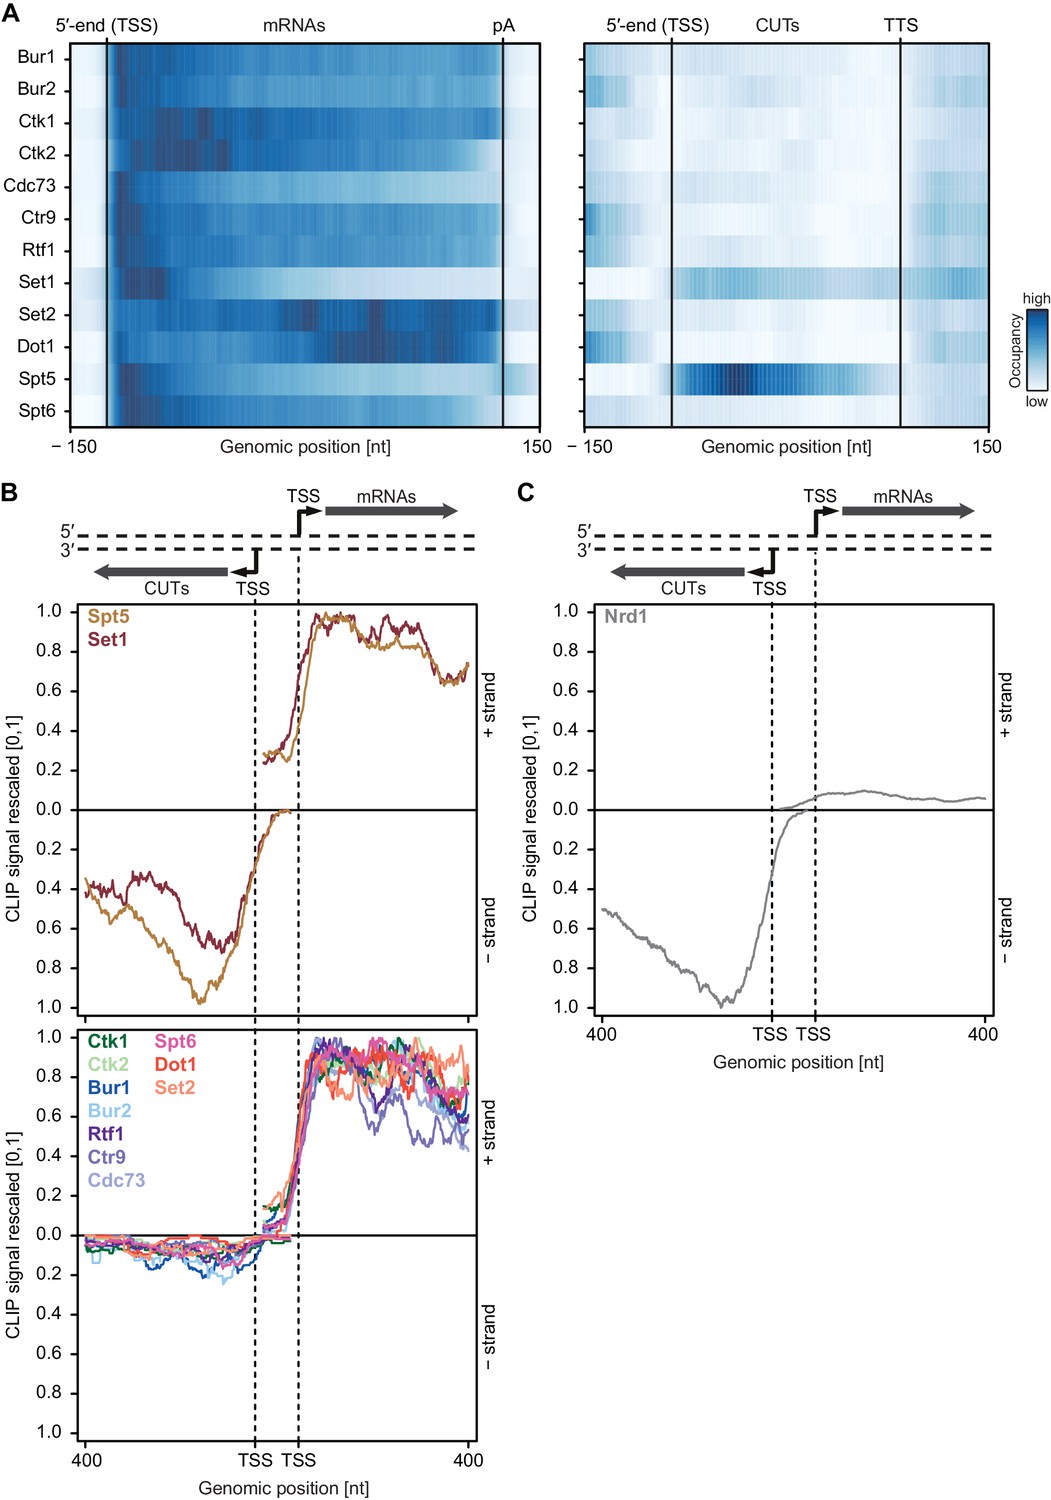
Asymmetric distribution of EFs at coding and non-coding transcripts.
(A) PAR-CLIP occupancies over mRNAs (left) and non-coding CUTs (right). Smoothed, averaged Pol II normalized RNA occupancy profiles were aligned at the RNA 5′-end (transcription start site, TSS) and scaled to a common length. The color code shows the occupancy relative to the maximum occupancy per factor over both transcript classes (dark blue) (see also Figure 4—figure supplement 1A). (B) and (C) PAR-CLIP occupancies at selected bidirectional promoters. Smoothed, averaged Pol II normalized RNA occupancy profiles for sense mRNA (right) and divergent CUT (left) were centered around their 5′-end (TSS) [−75 nt to +400 nt]. We considered only bidirectional promoters producing mRNAs and CUTs that did not overlap with any other transcripts in the depicted region. After normalization, average mRNA and CUT profiles were rescaled, setting the maximum occupancy to one and the minimum occupancy to 0 (see also Figure 4—figure supplement 1B and C).
Figure 4—figure supplement 1
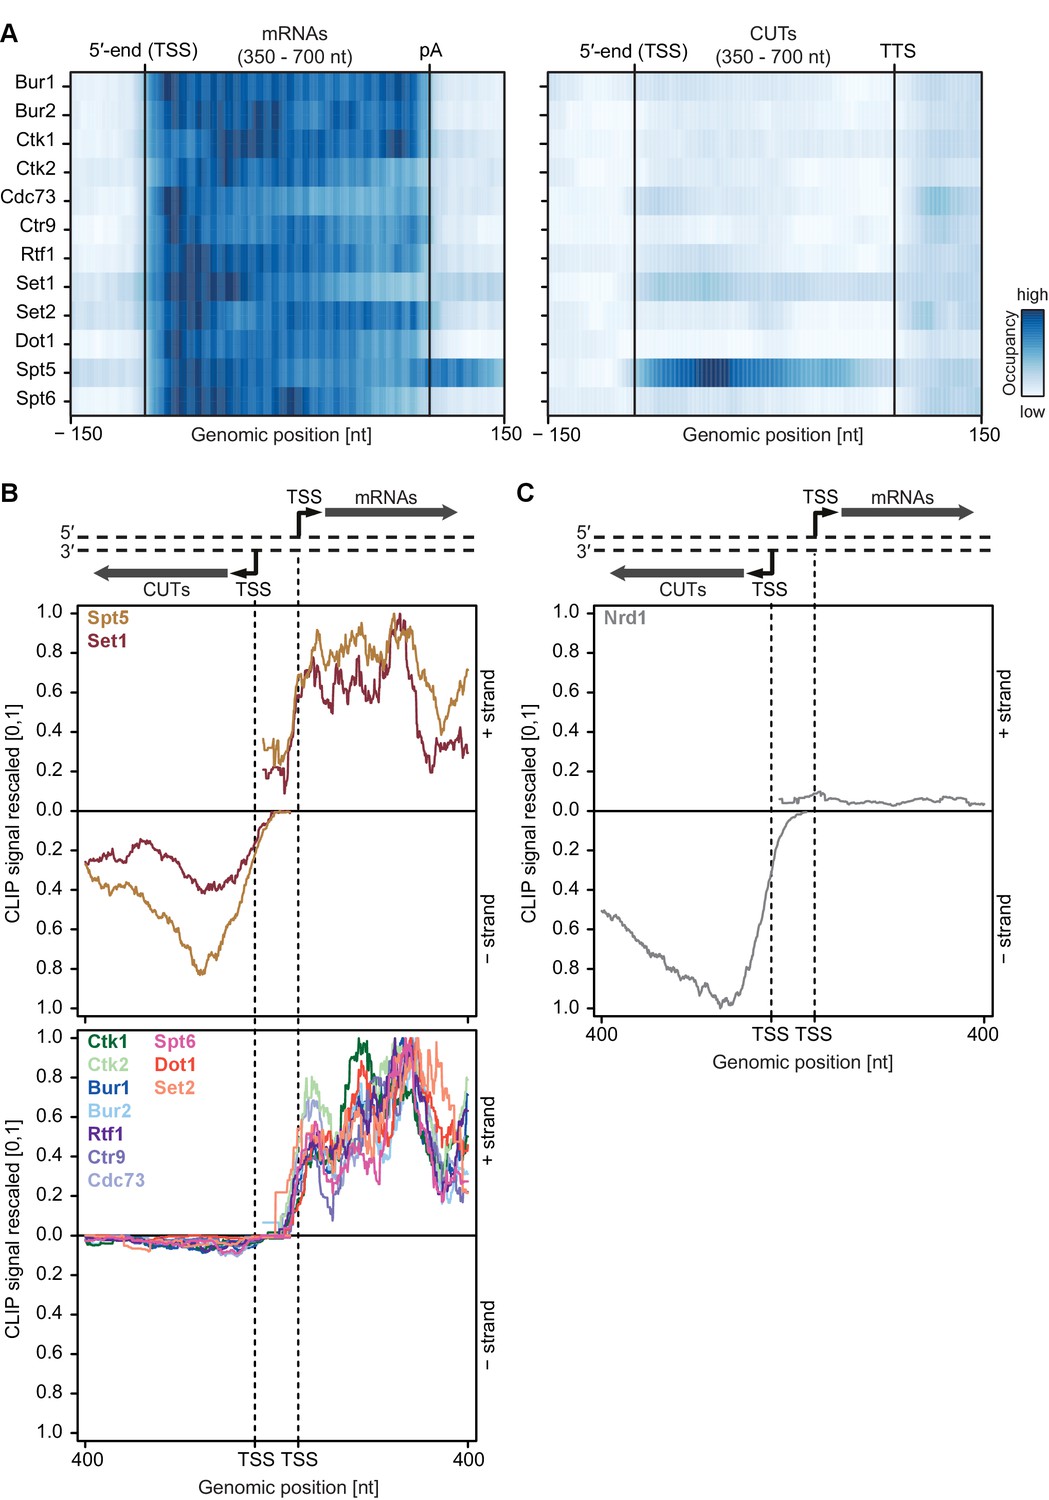
Asymmetric distribution of EFs at coding and non-coding transcripts of similar length.
(A) PAR-CLIP occupancy heat plot similar to that shown in Figure 4A, but with mRNAs and CUTs selected to be of similar lengths, 350–700 nt. (B) and (C) PAR-CLIP occupancy profiles for elongation factors as in Figure 4B and C, with sense mRNAs and divergent antisense CUTs of similar lengths, 350–700 nt, selected from bidirectional promoters.
Figure 5
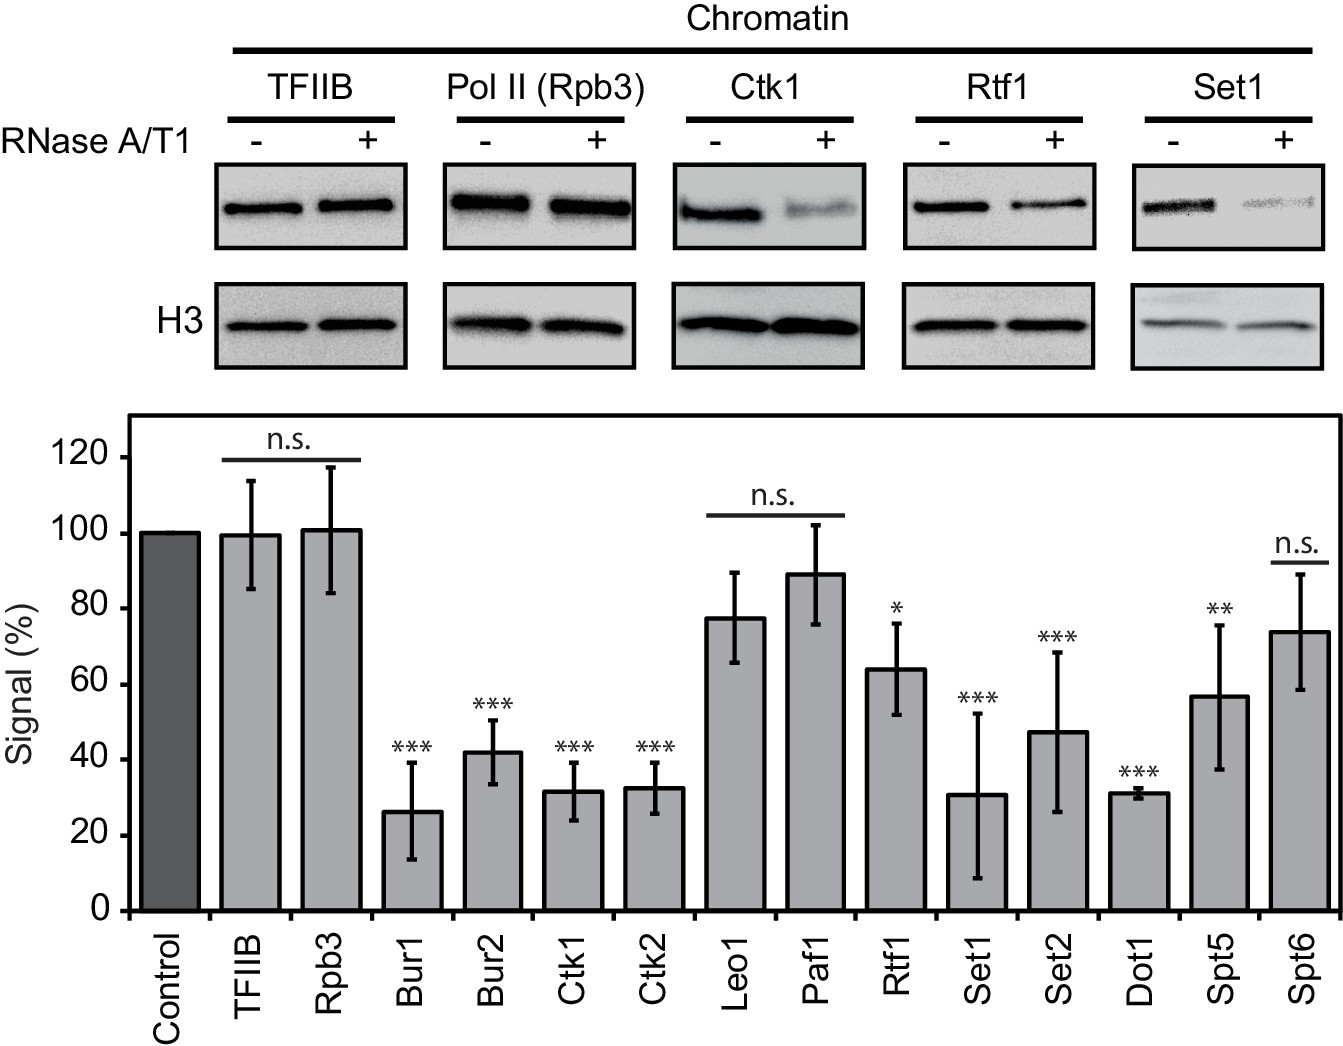
Chromatin association of EFs depends on RNA.
Western blot analysis (top) and quantitative densitometry (bottom) of exemplary EFs bound to chromatin before and after treatment with RNase A/T1 mix. H3 was used as loading control. Densitometry data are expressed as mean ± SD from two to three independent experiments. *p<0.05; **p<0.01; ***p<0.001; n.s. = not significant (one-way ANOVA Dunnett post-hoc test).
Figure 6 with 1 supplement
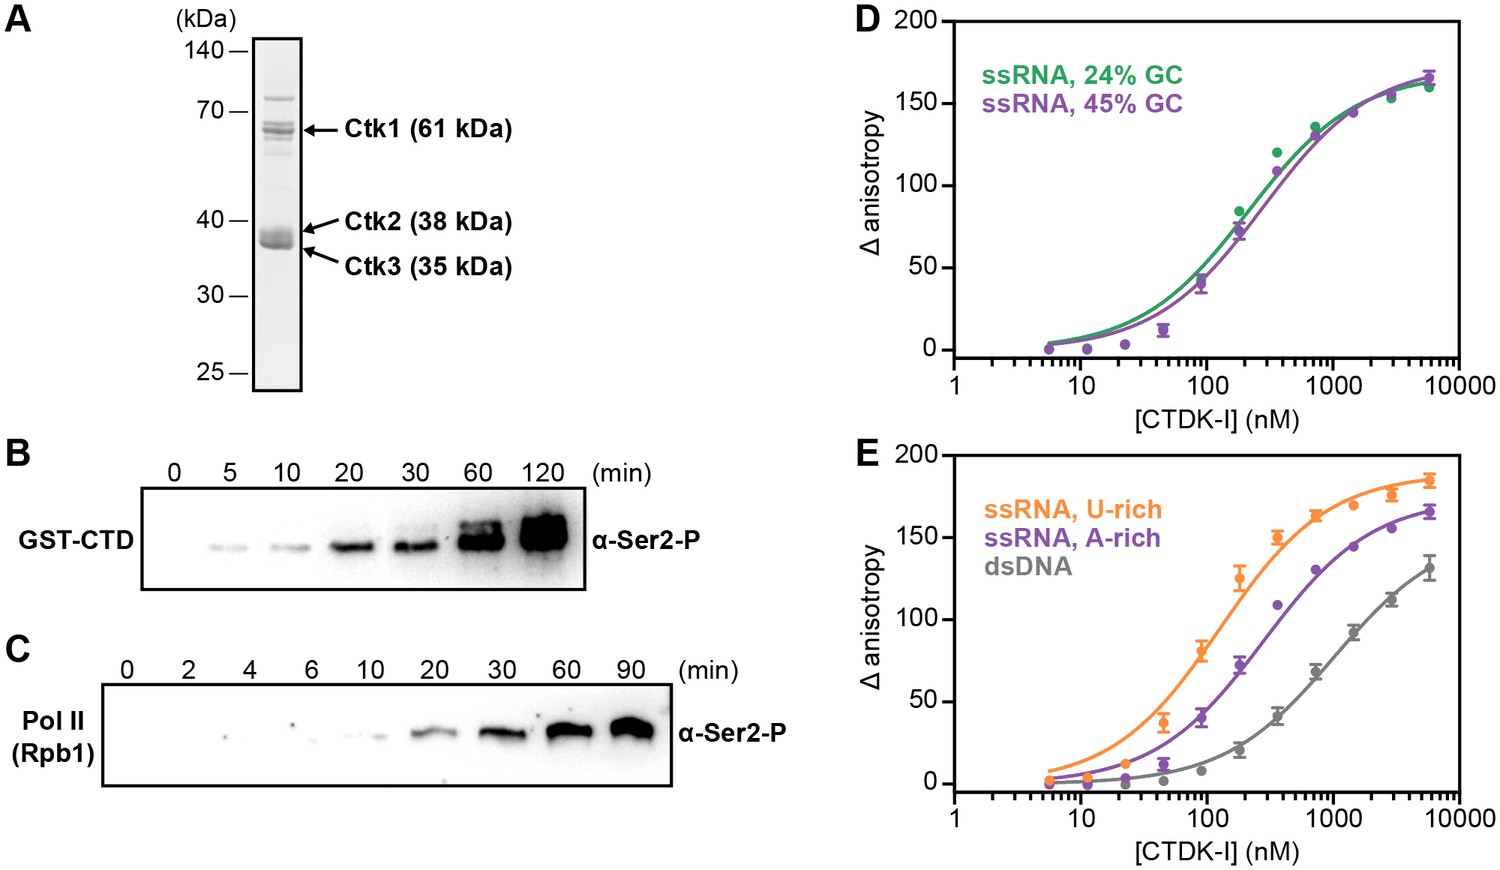
Recombinant CTDK-I complex is active and binds RNA in vitro.
(A) The three-subunit CTDK-I complex from S. cerevisiae was recombinantly expressed in insect cells and purified to homogeneity. The purified complex was run on a 4–12% gradient sodium dodecyl sulfate polyacrylamide gel electrophoresis (SDS-PAGE) and stained with Coomassie blue. (B) Purified human GST-CTD (10 µM) was incubated with 0.4 µM CTDK-I and 3 mM ATP. Time points were taken at 0 (no ATP), 5, 10, 20, 30, 60 and 120 min and CTDK-I activity was determined by western blot analysis using an antibody that recognizes the Ser2 phosphorylated form of the CTD of Pol II. Molecular mass of GST-CTD is ~70 kDa. (C) Purified and dephosporylated Pol II (2 µM) from S. cerevisiae was incubated with 0.4 µM CTDK-I and 3 mM ATP. Time points were taken at 0 (no ATP), 2, 4, 6, 10, 20, 30, 60 and 90 min and CTDK-I activity was determined as in (B). Molecular mass of the CTD containing subunit of Pol II, Rpb1, is ~200 kDa. (D) Increasing concentrations (0–5.8 µM) of the complete CTDK-I kinase complex were incubated with 8 nM of a 24% GC (green line; Kd,app(nM) = 210 ± 18) and with a 45% GC (purple line; Kd,app(nM) = 277 ± 21) ssRNA sequences. Binding was determined by relative change in fluorescence anisotropy. Data was fit with a single site binding equation. Error bars reflect the standard deviation from three experimental replicates. (E) Increasing concentrations (0–5.8 µM) of the complete CTDK-I kinase complex were incubated with 8 nM of a U-rich ssRNA (orange line; Kd,app(nM) = 123 ± 10), an A-rich ssRNA (purple line; Kd,app(nM) = 277 ± 21) and a dsDNA (grey line; Kd,app(nM) = 1007 ± 67) sequences. Binding strength, data fitting and standard deviation was determined as in (D).
Figure 6—figure supplement 1
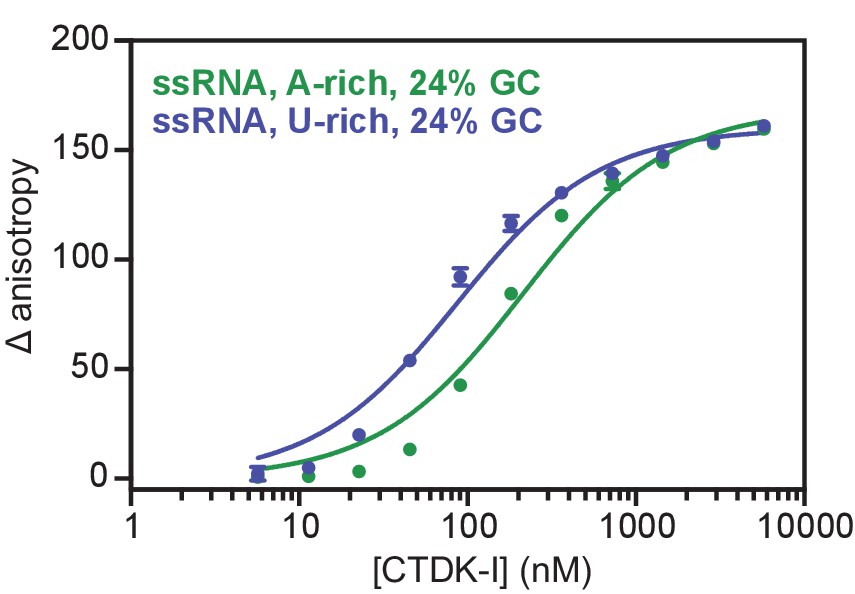
Recombinant and active CTDK-I complex binds preferentially U-rich ssRNA in vitro.
Binding of CTDK-I to U- and A-rich ssRNA sequences with 24% GC. Increasing concentrations (0–5.8 µM) of the full-length CTDK-I kinase complex were incubated with 8 nM of a U-rich ssRNA (blue line; Kd,app(nM) = 83 ± 6) and an A-rich ssRNA (green line; Kd,app(nM) = 210 ± 18) sequences. Binding strength, data fitting and standard deviation was determined as in Figure 6D.
Figure 7 with 1 supplement
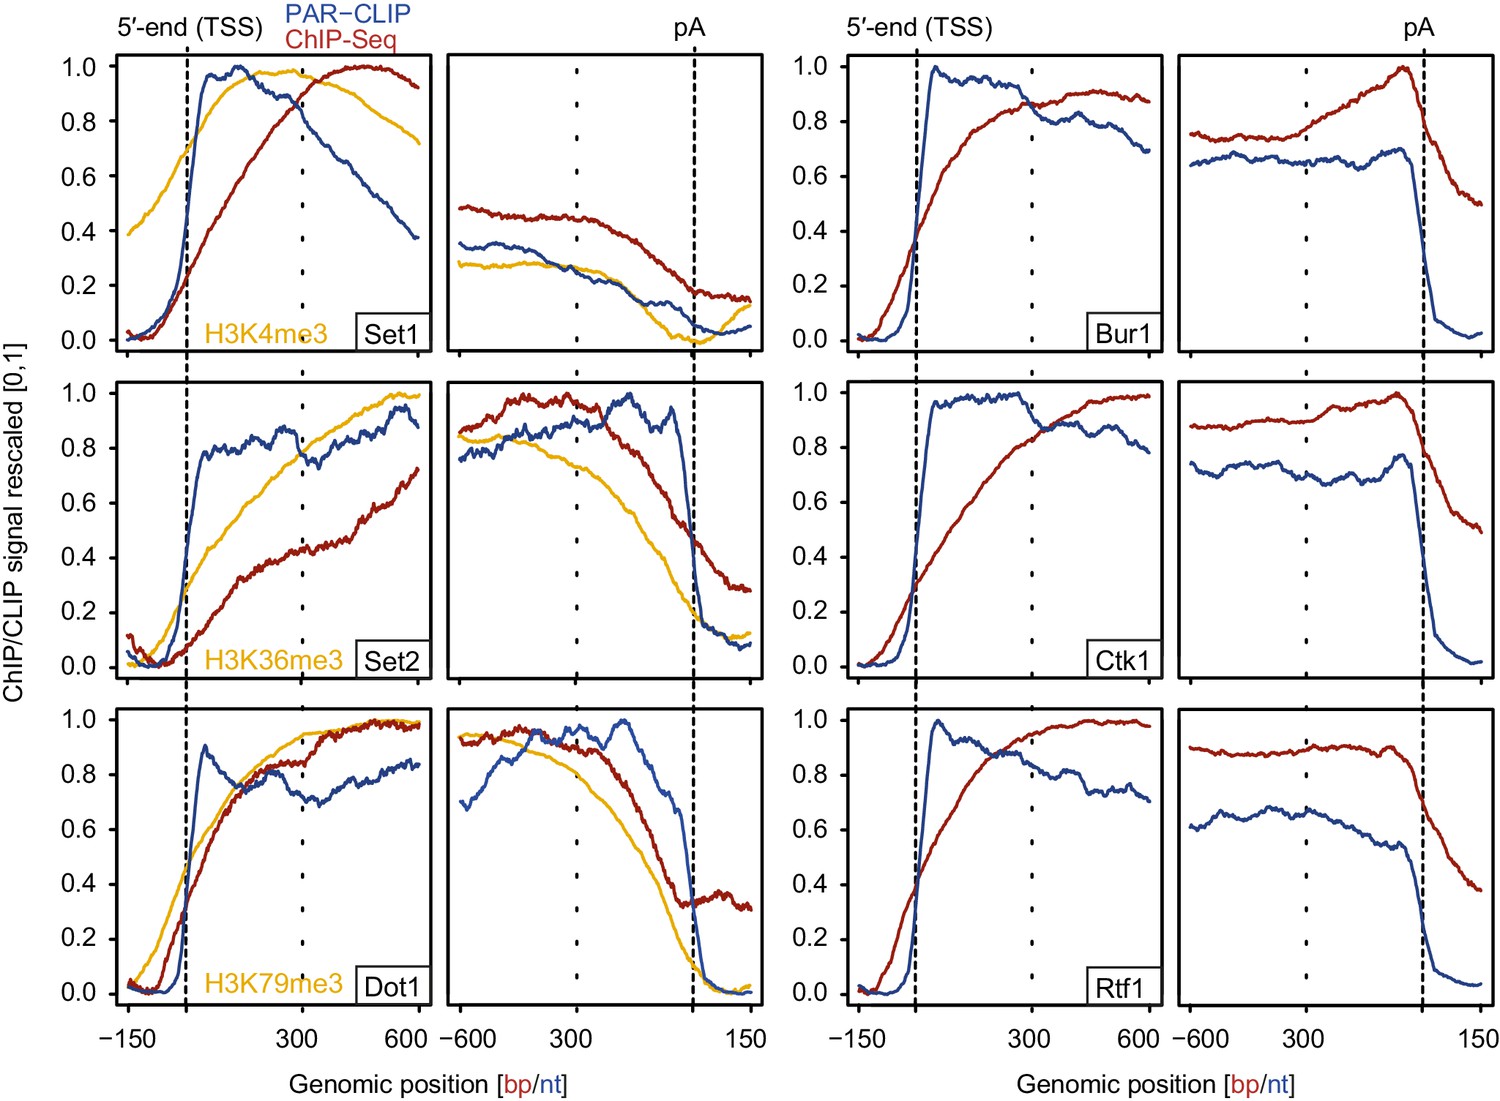
Comparison of PAR-CLIP and ChIP-Seq occupancy profiles.
Averaged ChIP-Seq (red) and PAR-CLIP (blue) occupancy profiles of EFs and ChIP-Seq of the histone marks H3K4me3, H3K79me3 and H3K36me3 (yellow) centered around TSSs [−150 bp to +600 bp] and pA sites [−600 bp to +150 bp] individually normalized to range between 0 and 1.
Figure 7—figure supplement 1
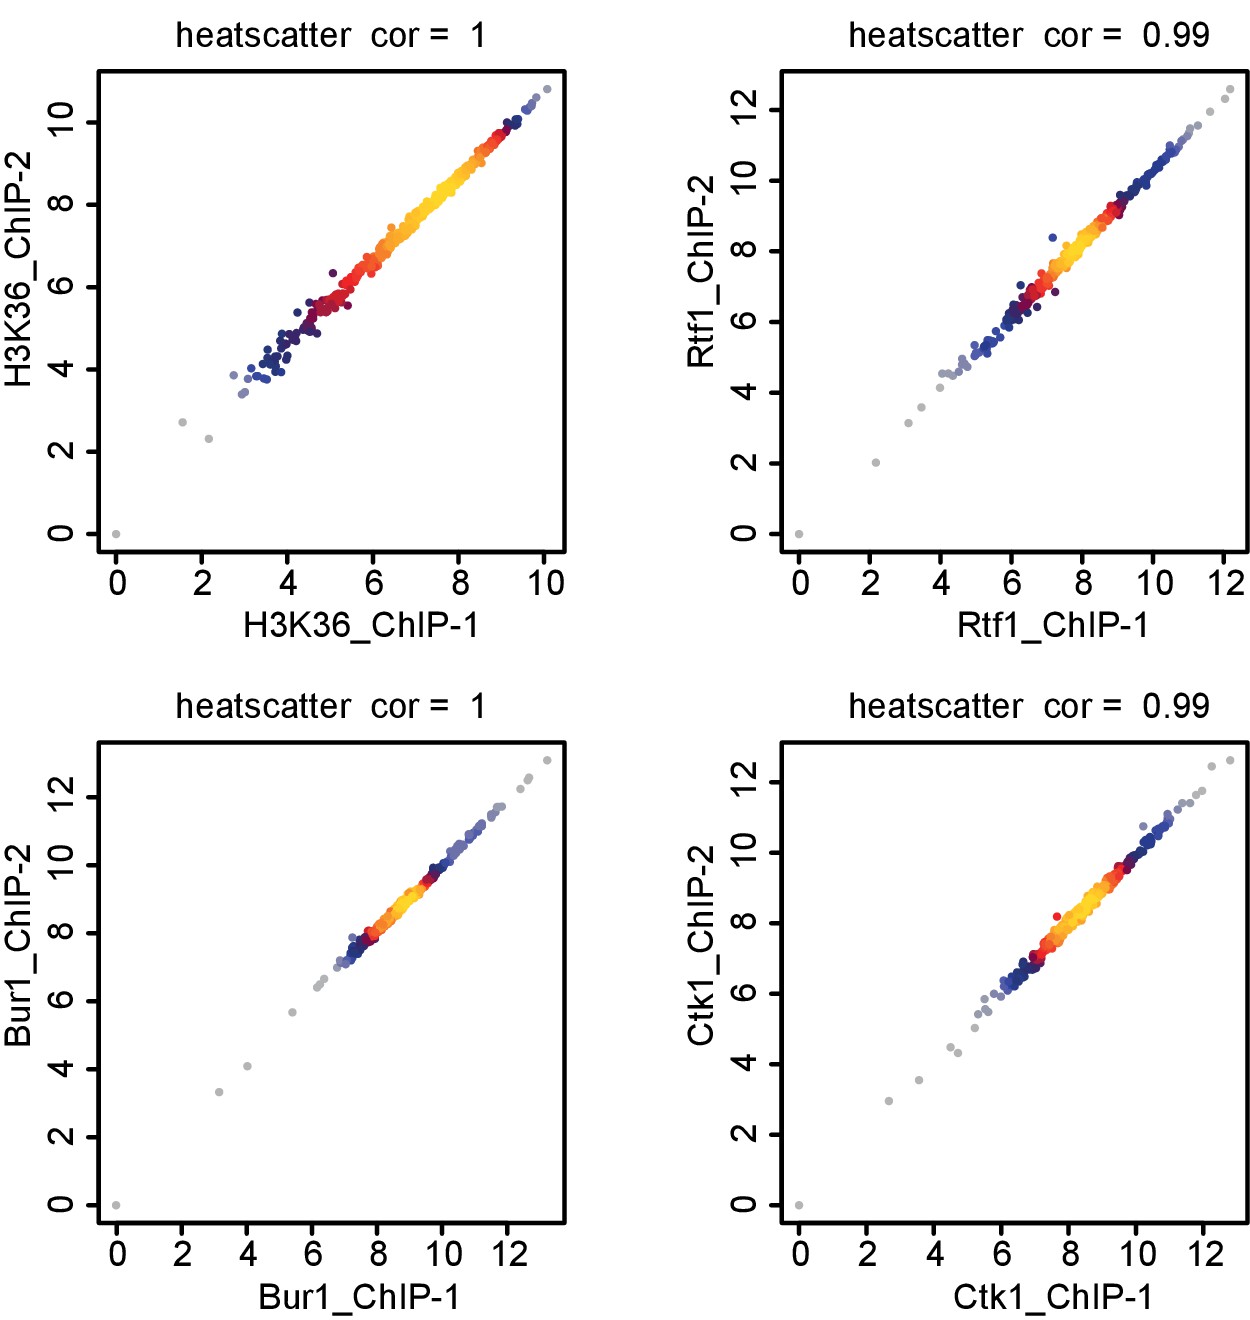
Comparison of replicate measurements for ChIP-Seq.
Comparison of ChIP-Seq IP replicate measurements for elongation factors Bur1, Ctk1 and Rtf1 and histone methylation mark H3K36me3. The scatterplots compare average log2 read counts of all transcripts shown in Figure 7 using Spearman correlation.
Figure 8

Deletion of Set1 RRMs impairs its recruitment to genes.
(A) Western blot analysis of Set1-TAP (top) and Rpb3 (bottom) in a Set1-TAP strain (left), a strain lacking the first 579 amino acids of Set1 (ΔRRM-Set1-TAP; middle) and a ΔPaf1 Set1-TAP strain (right); bands are shown for biological duplicates of yeast cell cultures before formaldehyde crosslinking. Set1 was detected using an antibody directed against its C-terminal TAP tag. As a control, Pol II was detected using an antibody against the Rpb3 subunit in all three strains. (B) Schematic localization of gene regions analyzed via ChIP-qPCR. Set1 recruitment was monitored at one gene region of ADH1 (1) and two different gene regions of ILV5 (2 and 3), PDC1 (4 and 5) and PMA1 (6 and 7). (C) ChIP analysis reveals that Set1 occupancy is reduced in ΔPaf1 cells (ΔPaf1 Set1-TAP) as well as in a truncated version of Set1 that lacks its RRM domains (ΔRRM-Set1-TAP). ChIP data are expressed as mean ± SD from two independent experiments. *p<0.05; **p<0.01 (two sample t-test).
Tables
Table 1
PAR-CLIP analysis of elongation factors (EFs).
| EF | Complex* | Number of crosslink sites† |
|---|---|---|
| Bur1 | BUR kinase complex | 77931 |
| Bur2 | 46293 | |
| Ctk1 | CTDK-I | 129352 |
| Ctk2 | 98993 | |
| Cdc73 | Paf1C | 57603 |
| Ctr9 | 55807 | |
| Leo1 | 27665 | |
| Paf1 | 20742 | |
| Rtf1 | 60068 | |
| Set1 | COMPASS | 189723 |
| Set2 | 68875 | |
| Dot1 | 42848 | |
| Spt5‡ | DSIF | 517568 |
| Spt6 | 93902 | |
| TFIIB§ | 16686 |
-
*DSIF, DRB sensitivity inducing factor; CTDK, C-terminal domain kinase; Paf1C, Paf1 complex; COMPASS, Complex Proteins Associated with Set1.
-
†Average number of crosslink sites with p-values<0.005.
-
§Initiation factor, used to determine the level of RNA background crosslinking
Additional files
-
Supplementary file 1
Sequences of primer pairs used for ChIP-qPCR.
YER: Heterochromatic region on chromosome V. Sequences of primer pairs used for strain generation.
- https://doi.org/10.7554/eLife.25637.017
Download links
A two-part list of links to download the article, or parts of the article, in various formats.
Downloads (link to download the article as PDF)
Open citations (links to open the citations from this article in various online reference manager services)
Cite this article (links to download the citations from this article in formats compatible with various reference manager tools)
RNA-dependent chromatin association of transcription elongation factors and Pol II CTD kinases
eLife 6:e25637.
https://doi.org/10.7554/eLife.25637


