Physiological and pathophysiological control of synaptic GluN2B-NMDA receptors by the C-terminal domain of amyloid precursor protein
- Institut de Pharmacologie Moléculaire et Cellulaire, Centre National de la Recherche Scientifique, Université de Nice Sophia Antipolis, France
- Ludwig-Maximilians-University Munich, Germany
- Neurocentre Magendie, France et Université de Bordeaux, France
Figures
Figure 1

Construction and expression of AAVs.
(A) AAV constructs: AICD or AICD-NLS were inserted downstream of the CMV promoter and β-globin intron and upstream of an IRES-GFP sequence. ITR: inverted terminal repeats; P-CMV: cytomegalovirus promoter; IRES: internal ribosomal entry site; hrGFP: human recombinant green fluorescent protein. AICD-NES, AICDY682, APLP1–ICD and APLP2-ICD were constructed in this same AAV vector by replacing the AICD cassette with these other cDNAs. (B) Diagram shows schematic of in vivo viral transduction protocol. Photos show low-magnification (x4; top panels) and high-magnification (x60; bottom panels) images of CA1 area of hippocampal slice (left panels show DIC images; right panels show GFP fluorescence) prepared from rat transduced in vivo with AICD-AAV-GFP.(C) Single cell semi-quantitative PCR on cytoplasms of CA1 pyramidal neurons transduced with either GFP, AICD or AICD-NLS viruses. Single cell quantification is reported as 1/Ct and plotted in a box and whisker plot where the horizontal lines represent the median, the box limits delineate the lower and upper quartiles (25% and 75%) and the whiskers are set at minimum and maximum values, for each group. GFP expression was similar on all three groups of cells (left side of panel). Using primers against the C-terminal domain of APP, we detected low levels of mRNA in GFP neurons and higher levels in AICD and AICD-NLS neurons (right side of panel).
Figure 2

AICD increases NMDAR, but not AMPAR, transmission in CA1 pyramidal neurons.
(A) Scatter dot plot graph shows AMPAR/NMDAR ratios from GFP, AICD, AICD-NLS, AICD-NES, AICDY682G, APLP1-ICD and APLP2-ICD neurons, as indicated. Each dot represents one neuron. Traces show sample AMPAR EPSCs (−60 mV) and NMDAR EPSCs + AMPAR EPSCs (+40 mV) from the different populations of infected neurons. AMPAR/NMDAR ratios were calculated by taking measurements at times indicated (AMPAR, point 1; NMDAR, point 2). (B) Example traces of mEPSC recordings from GFP, AICD or AICD-NLS neurons as indicated. (C) Mean frequency, (D) Mean amplitude of AMPAR mEPSCs from GFP, AICD or AICD-NLS neurons. (E) DIC (top panel) and GFP fluorescence (bottom panel) images of a representative example of a pair of infected (AICD-NLS) and non-infected neighbor neurons. (F) Comparison of the amplitude of AMPAR EPSCs from GFP or AICD-NLS neurons with neighboring uninfected neurons. For each pair, the AMPAR EPSC amplitude of the GFP or AICD-NLS neuron is plotted against its uninfected neighbor. Overlays of sample EPSCs from infected (black trace) and uninfected neighboring cells (grey trace) are shown. (G) Average percent change of AMPAR EPSC of GFP and AICD-NLS neurons relative to neighboring uninfected control neurons (normalized to 100%). (H) Same as (F) but for NMDAR EPSCs. (I) Same as (G) but for NMDAR EPSCs. *p<0.05; **p<0.01. Full statistical analysis is detailed in Supplementary file 1.
Figure 3
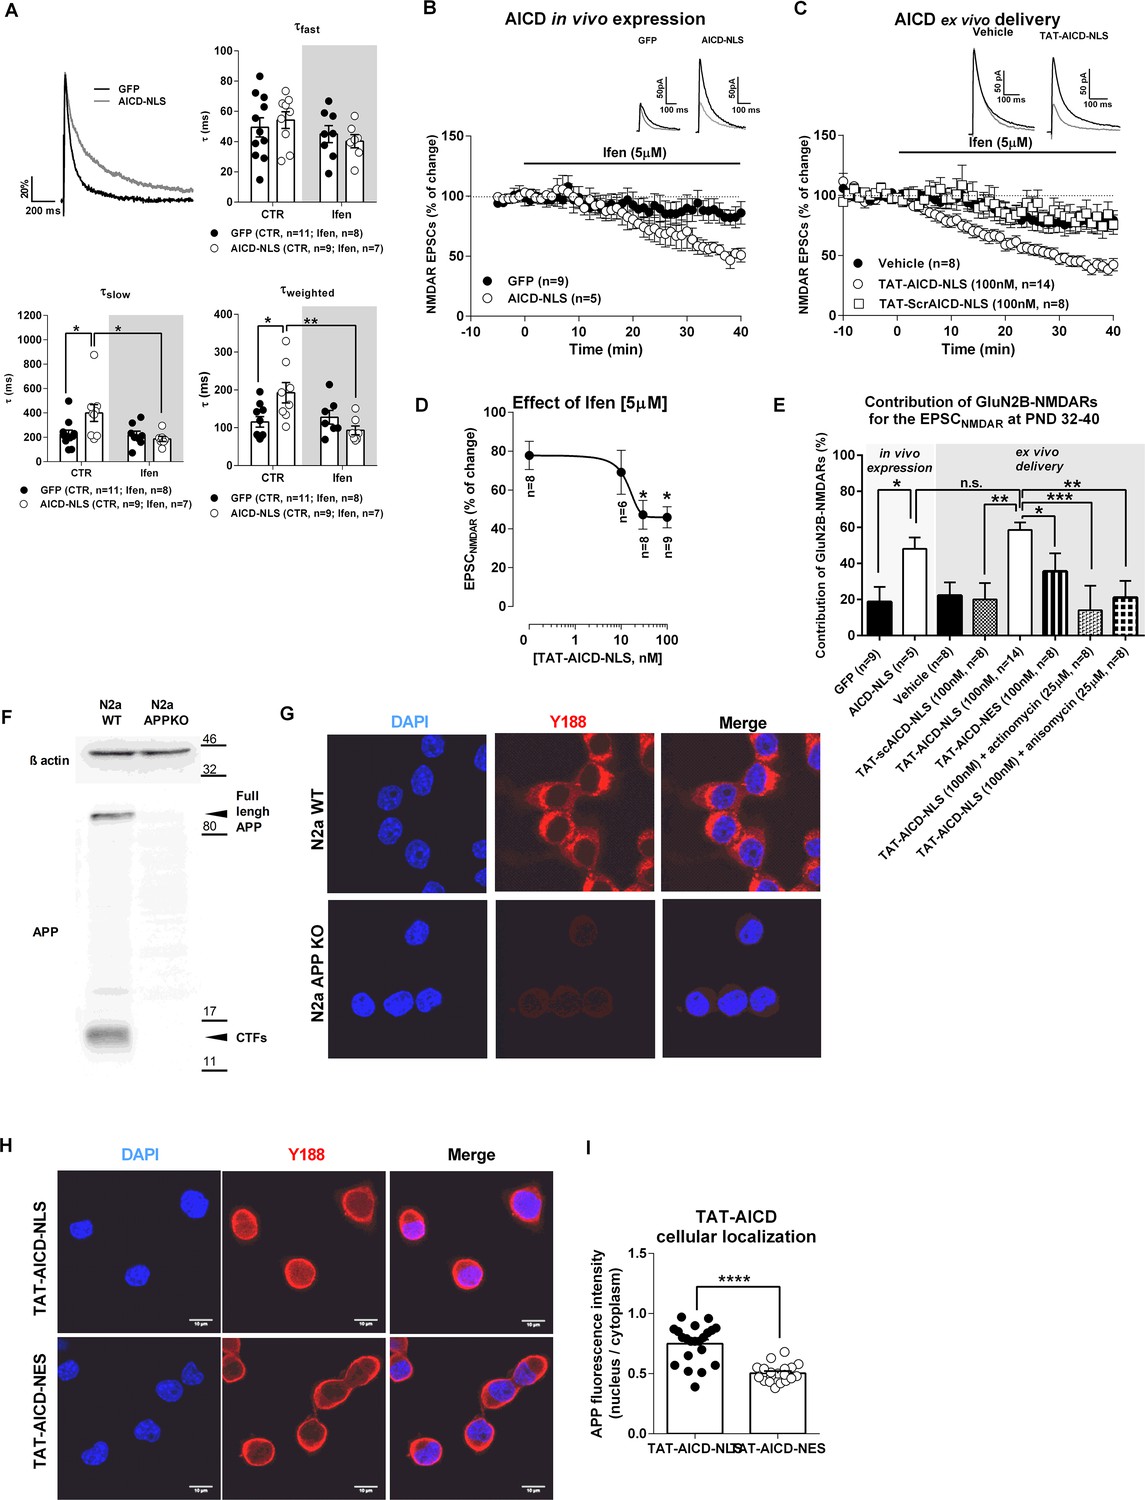
AICD increases synaptic GluN2B currents.
(A) In the upper left corner, we show a comparison of representative whole-cell patch-clamp recordings of pharmacologically-isolated NMDAR EPSCs, normalized to the peak amplitude (in %), from GFP (black line) and AICD-NLS (grey line) neurons, illustrating differences in deactivation kinetics. The other three panels show scatter dot plot graphs with the τfast, τslow and τweighted constants, respectively, for NMDAR EPSC deactivation time course in GFP and AICD-NLS neurons before (control; CTR) and after ifenprodil (Ifen; 5 μM) application. (B) Time course of ifenprodil effect on NMDAR EPSC amplitude. Traces show sample EPSCNMDAR recorded before (black trace) and after 40 min of Ifenprodil (5 μM) perfusion (grey trace) in GFP and AICD-NLS neurons. (C) Time course of ifenprodil effect on NMDAR EPSC amplitude in hippocampal slices incubated with vehicle, TAT-AICD-NLS (100 nM) and TAT-scrAICD-NLS (100 nM). Traces show sample EPSCNMDAR recorded before (black trace) and after 40 min of Ifenprodil (5 μM) perfusion (grey trace) in vehicle and TAT-AICD-NLS neurons. (D) Effect of ifenprodil (5 μM) on hippocampal slices pre-incubated with different concentrations of TAT-AICD-NLS (0, 10, 30 and 100 nM). The line represents the nonlinear regression analysis of the data, with IC50 ~13.88 ± 1.65 nM. (E) Bars graph showing the contribution of GluN2B-NMDARs for the EPSCNMDAR at PND 32–40 in different conditions, as indicated. (F) Representative immunoblot of samples of N2a cells WT or KO for APP (APPKO). APP was detected by antibody against C-terminal domain (Y188) and actin was used as loading control. (G) Representative example of N2a-WT and N2a APPKO cells immunostained for APP with Y188. Nuclei were stained with DAPI. (H) Representative example of N2a-APPKO cells, pre-incubated with TAT-AICD-NLS or TAT-AICD-NES for one hour were immunostained for APP with Y188. Nuclei were stained with DAPI. (I) The ratio of mean APP fluorescence in nucleus/cytoplasm was quantified in N2a-APPKO cells pre-incubated with either TAT-AICD-NLS (n = 55) or TAT-AICD-NES (n = 50). Each dot in B, C, D represents one single neuron. *p<0.05; **p<0.01; ***p<0.001; ****p<0.0001. Full statistical analysis is detailed in Supplementary file 1 .
Figure 4
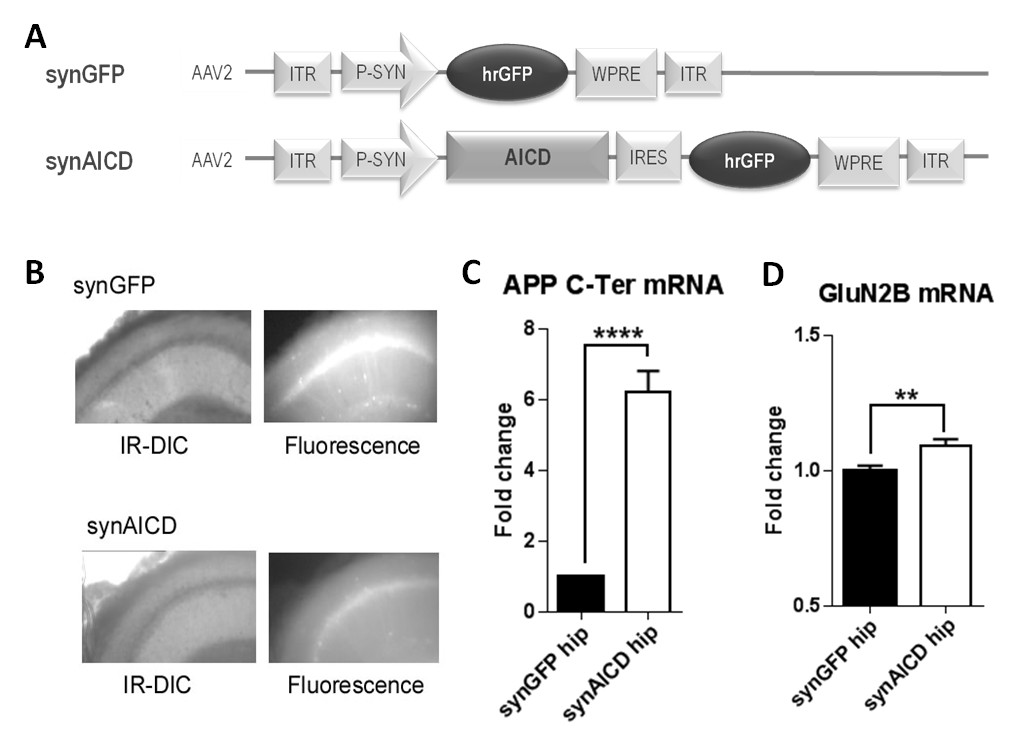
AICD regulates GluN2B mRNA levels.
(A) Diagrams of AAV constructs representing synGFP and synAICD viruses, which exhibit specific expression of AICD in neurons with high transduction efficiencies. AICD was inserted downstream of the synapsin promoter and upstream of the hrGFP sequence via an IRES linker. ITR: inverted terminal repeats; P-SYN: synapsin promoter; IRES: internal ribosomal entry site; hrGFP: human recombinant green fluorescent protein; WPRE: Woodchuck Hepatitis Virus Post-transcriptional Regulatory Element. (B) Photos show low-magnification (x4) images of CA1 area of hippocampal slice (left panels show IR-DIC images; right panels show GFP fluorescence) prepared from rat injected in vivo with synGFP and synAICD, as indicated. (C) Fold change in APP mRNA expression (detection of C-terminal domain of APP; APP C-Ter) and in (D) GluN2B mRNA expression in hippocampi expressing synGFP (GFP hip; 18 hippocampi) or synAICD (AICD hip; 19 hippocampi) as quantified by quantitative PCR (normalization to two house-keeping genes Rpl13A and Ywhaz). **p<0.01. ****p<0.0001. Full statistical analysis is detailed in Supplementary file 1.
Figure 5
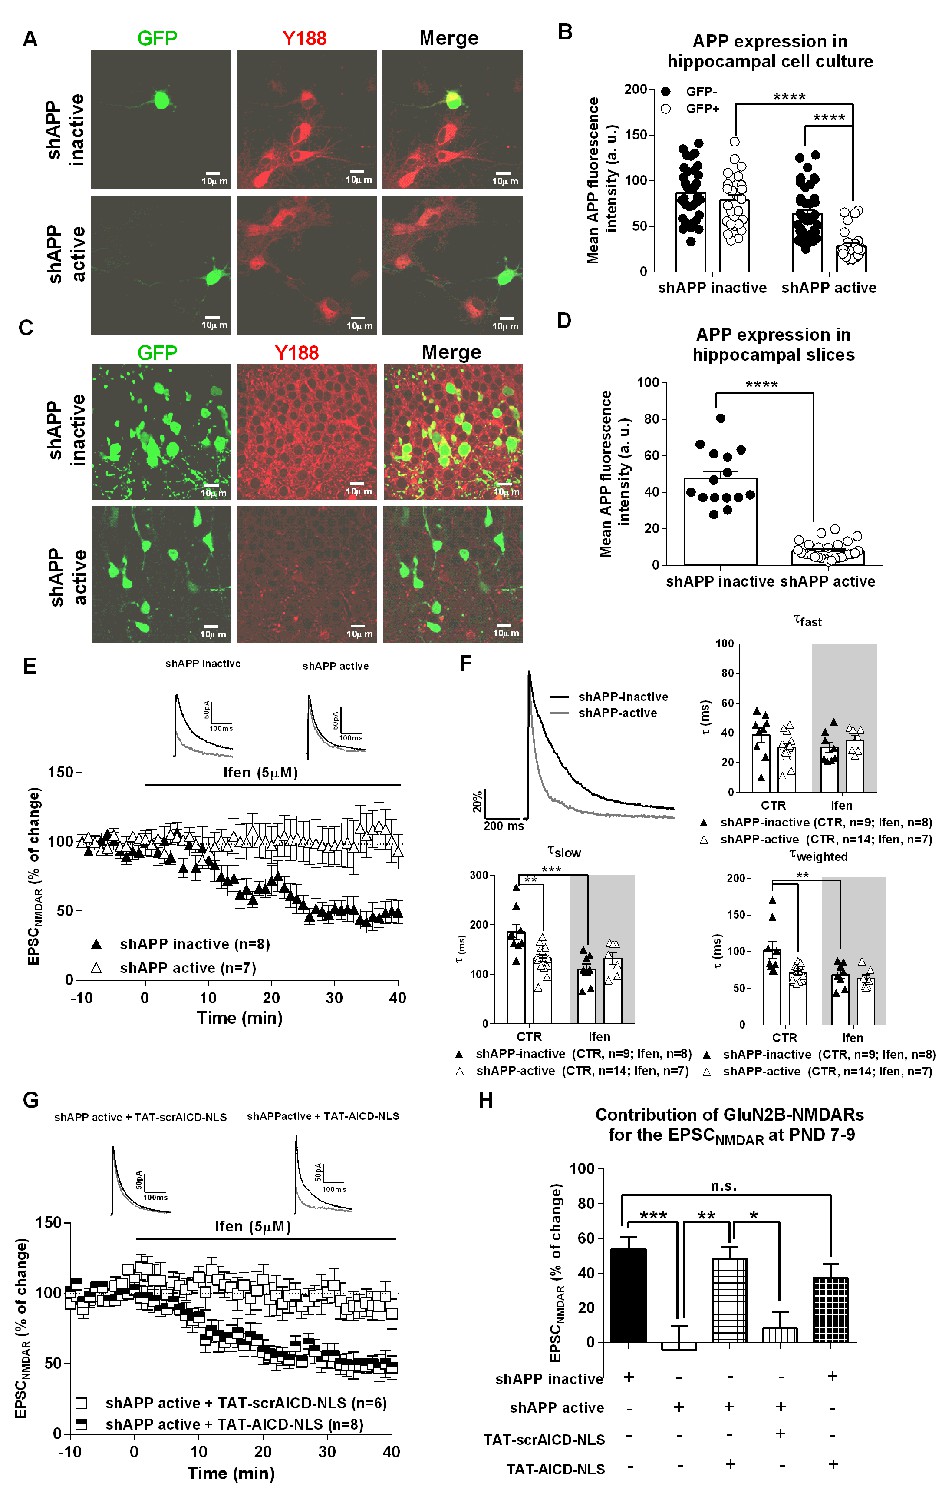
APP knock-down eliminates synaptic GluN2B NMDARs, an effect rescued by nuclear AICD delivery.
(A) Representative examples of hippocampal neurons in culture co-transfected with either shAPP inactive or shAPP active and GFP and immunostained for GFP and APP C-terminal domain (Y188). (B) Quantification of APP C-Terminal domain immunostaining in GFP+ (transduced neurons) and neighbor GFP- (non-transduced neurons) in hippocampal neuronal cultures expressing either shAPP inactive or shAPP active shown in (A). (C) Representative example of hippocampal slices of PND 7-9 mice, previously co-electroporated in utero with either shAPP inactive + GFP or shAPP active + GFP at E14.5, were immunostained for GFP and APP C-terminal domain (Y188). (D) Quantification of APP C-Terminal domain immunostaining in GFP+ neurons in hippocampal slices after in utero electroporation expressing either shAPP inactive or shAPP active shown in (C). (E) Time course of ifenprodil effect on pharmacologically-isolated NMDAR EPSC amplitude in CA1 pyramidal neurons of PND7-9 mice after being in utero electroporated at E14.5 with shAPP inactive or shAPP active, as indicated. Traces show sample EPSCNMDAR recorded before (black trace) and after 40 min of Ifenprodil (5 μM) perfusion (grey trace) in neurons. (F) In the upper left corner, we show a comparison of representative NMDAR EPSCs at PND7-9, normalized to the peak amplitude (in %), in shAPP-inactive (black line) and shAPP-active (grey line) neurons, illustrating differences in deactivation kinetics. The other three panels show scatter dot plot graphs with the τfast, τslow and τweighted constants, respectively, for NMDAR EPSC deactivation time course in shAPP-inactive and shAPP-active neurons before (control; CTR) and after ifenprodil (Ifen; 5 μM) application. (G) Time course of ifenprodil effect on NMDAR EPSC amplitude on shAPP active neurons pre-incubated with TAT-AICD-NLS (100 nM) or TAT-scrAICD-NLS (100 nM). Traces show sample EPSCNMDAR recorded before (black trace) and after 40 min of Ifenprodil (5 μM) perfusion (grey trace) in shAPP active/TAT-scrAICD-NLS and shAPP active/TAT-AICD-NLS neurons. (H) Bars graph showing the contribution of GluN2B-NMDARs for the EPSCNMDAR at PND7-9 in different conditions, as indicated. *p<0.05; **p<0.01; ***p<0.001; ****p<0.0001. Full statistical analysis is detailed in Supplementary file 1.
Figure 6
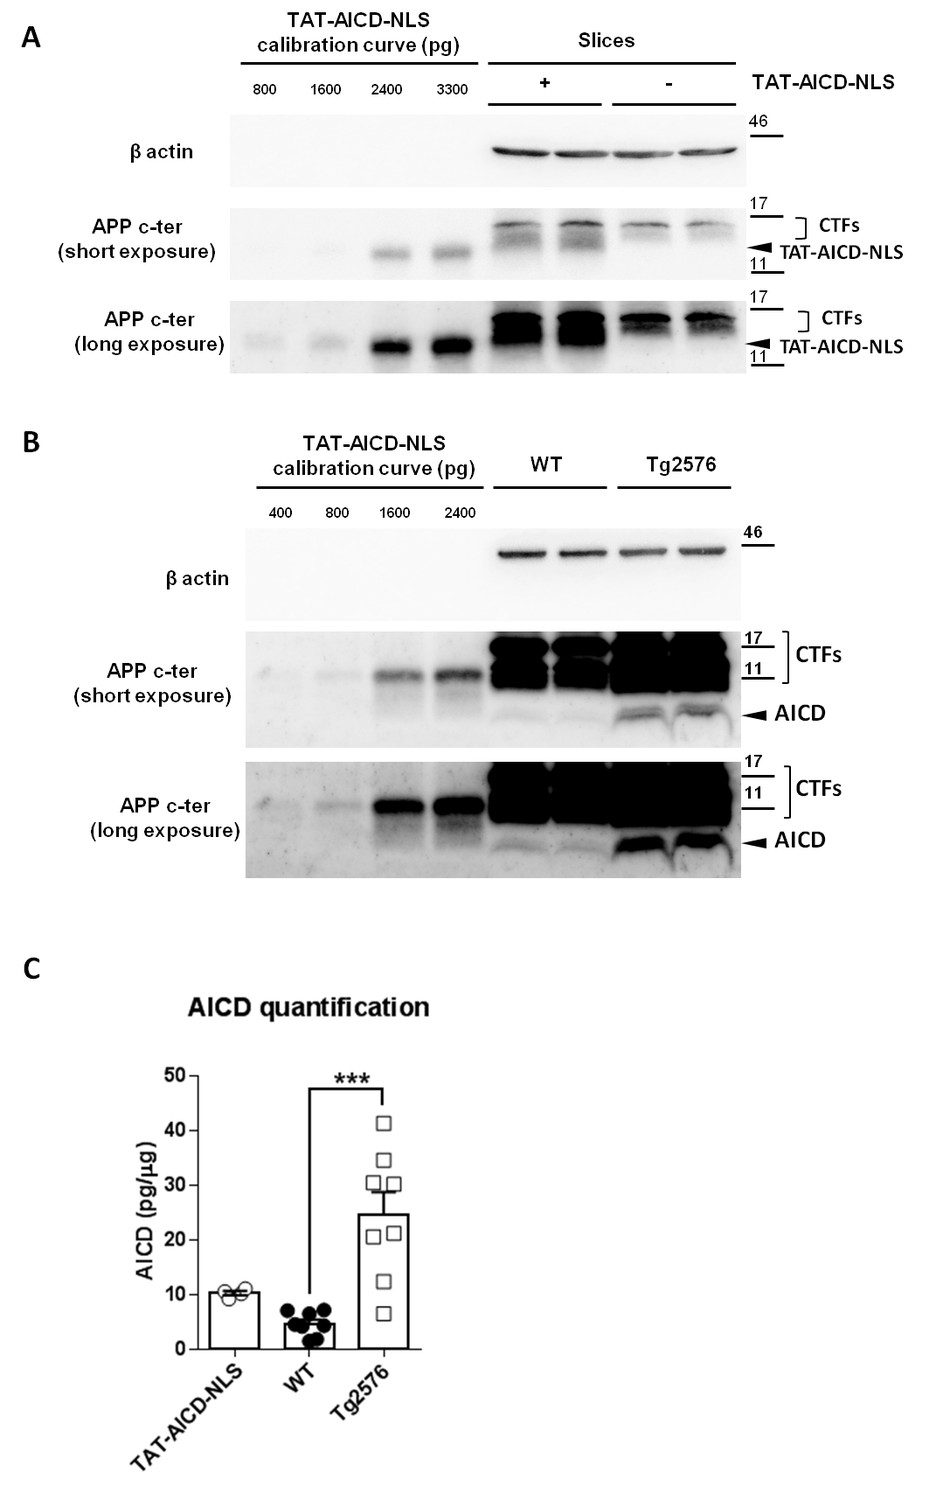
Physiological and pathological levels of AICD in brain.
(A) Representative immunoblot of two samples of hippocampal slices with or without two hours of TAT-AICD-NLS (100 nM) processed for APP C-terminal detection (Y188 antibody) and actin (as loading control). Short and long exposures for Y188 are shown. (B) Representative immunoblot of two samples of lysates of cortices from 5 months old wild type control (WT) mice (physiological adult AICD levels) and APP transgenic littermates (Tg2576, pathological AICD levels) processed for APP C-terminal detection (Y188 antibody) and actin (as loading control). Short and long exposures for Y188 are shown. (C) After normalization to actin, AICD mass was quantified (pg/μg of tissue lysate) relative to the TAT-AICD-NLS calibration curve. N = 4 for hippocampal slices pre-incubated with TAT-AICD-NLS; N = 8 for WT Control brains; N = 8 for Tg2576 brains. ***p<0.001. Full statistical analysis is detailed in Supplementary file 1.
Figure 7
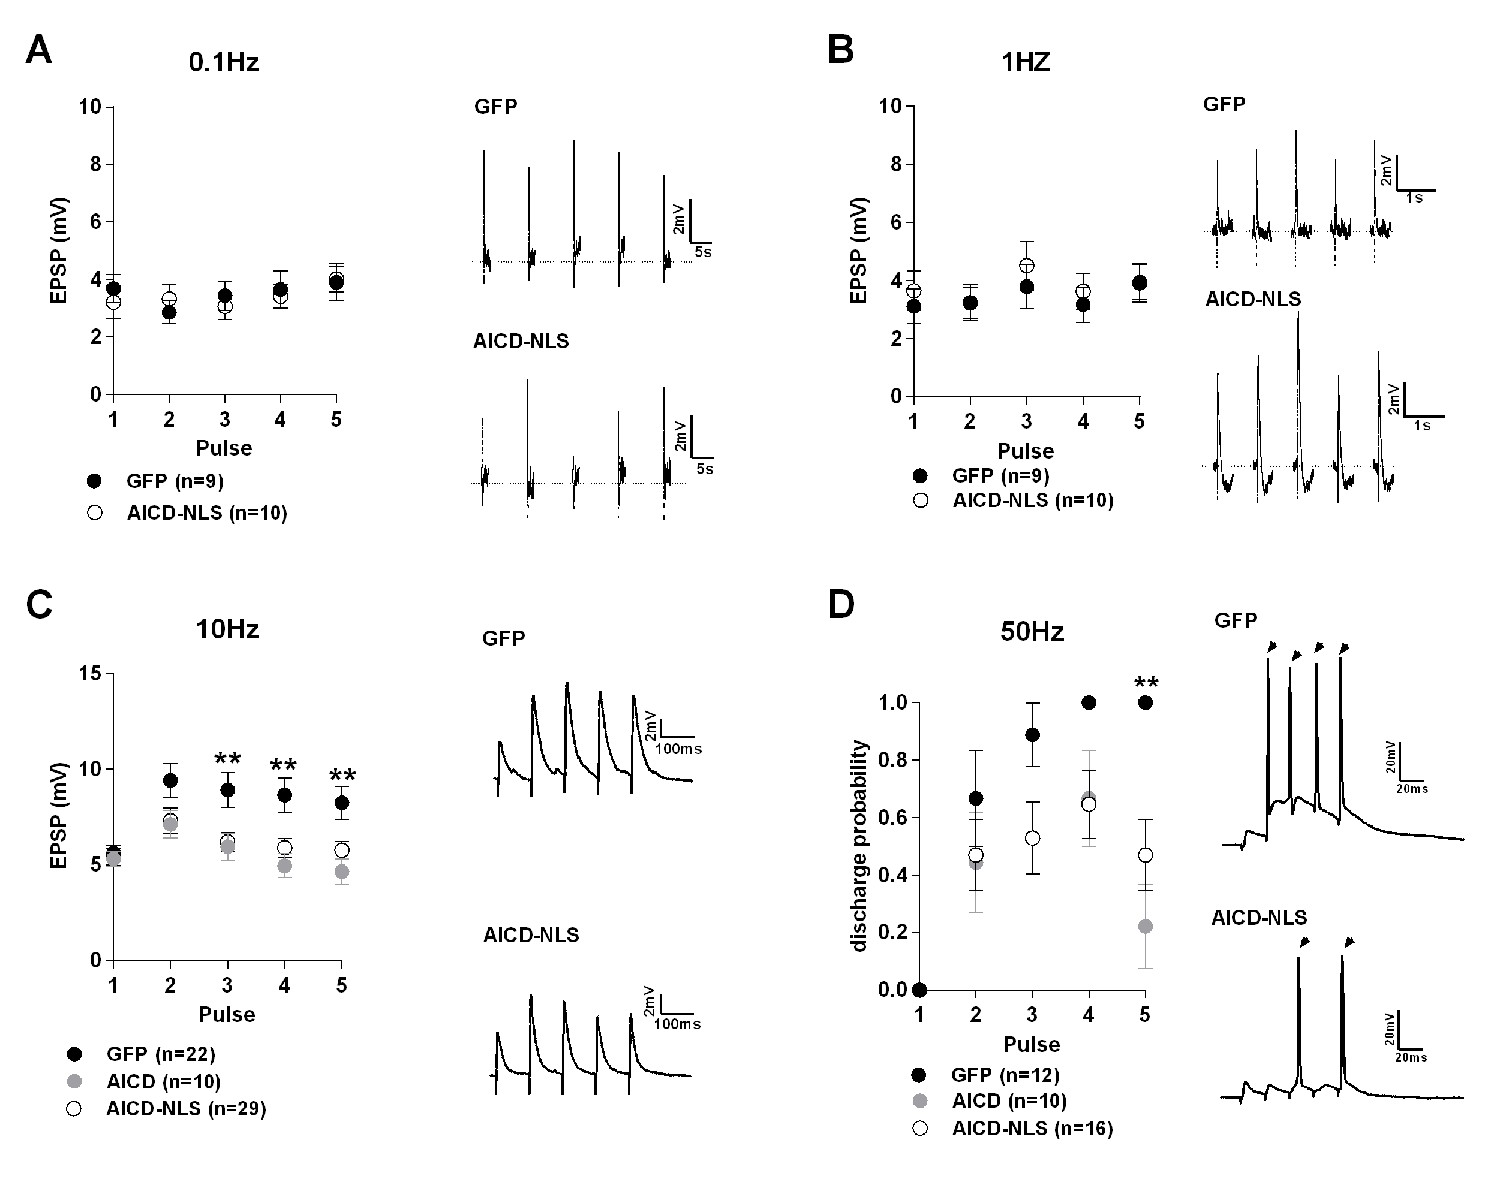
Synaptic signal integration and discharge probability are perturbed in AICD neurons.
(A, B and C) Panels show absolute amplitude values of five consecutive EPSPs induced at the following frequencies: (A) 0.1 Hz, (B) 1 Hz, (C) 10 Hz. Traces show representative EPSCs recorded from GFP, AICD and AICD-NLS neurons. (D) Panel shows discharge probability of GFP, AICD and AICD-NLS neurons in response to a 50 Hz stimulation. Representative traces illustrating the failure in spike transfer in AICD-NLS neurons when compared to GFP neurons are shown. Arrows indicate the occurrence of action potentials. **p<0.01. Full statistical analysis is detailed in Supplementary file 1.
Figure 8

AICD perturbs synaptic signal integration and discharge probability by affecting the NMDAR-SK channel coupling.
(A) Scheme of the NMDAR-SK channel coupling. Briefly, (I) When activated, NMDAR are permeable to Ca2+, leading to its intracellular increase. This Ca2+ activates the close-by SK channels, which open and allow the exit of K+. (II) This hyperpolarizes the membrane and NMDAR become blocked again by Mg2+. (B) Time course of apamin (100 nM) effect on EPSP amplitude recorded from GFP or AICD-NLS neurons in control conditions or from AICD-NLS neurons in presence of Ifenprodil (Ifen; 5 µM). Traces show the average of 30 EPSPs acquired before (black traces) and after apamin application (grey traces) in a GFP neuron and in an AICD-NLS neuron. (C) Scatter dot plot graph represents changes in EPSP amplitude in GFP and AICD-NLS neurons normalized to baseline values (100%, before apamin wash-in) in absence (CTR) or in presence of Ifenprodil (Ifen; 5 µM). (D, E and F, G) Panels show rescue of signal integration (10 Hz) and discharge probability (50 Hz) by partial blockade of GluN2B subunits by ifenprodil (300 nM) or blockade of SK channels by apamin (100 nM), as indicated. Representative traces illustrating the failure and rescue in spike transfer in AICD-NLS neurons when compared to GFP neurons are shown. Arrows indicate the occurrence of action potentials. Each dot in C represents one single neuron. *p<0.05; **p<0.01; ***p<0.001. Full statistical analysis is detailed in Supplementary file 1.
Figure 9 with 2 supplements
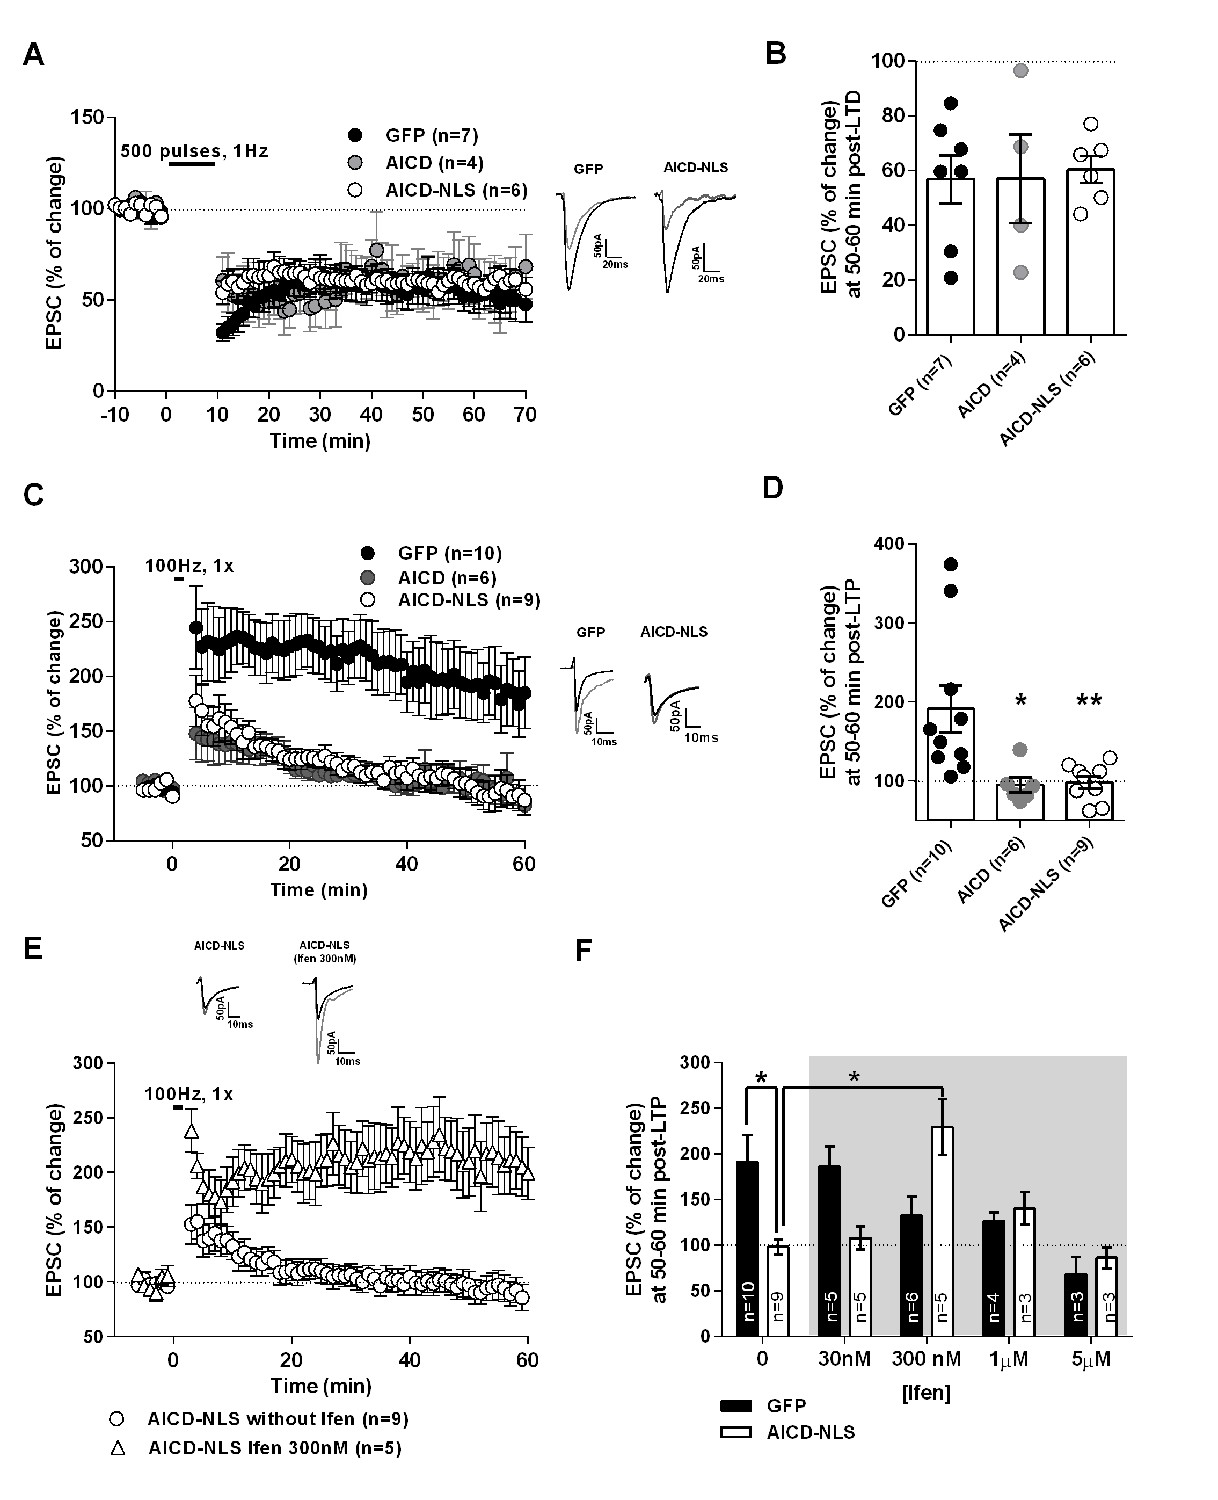
Increased AICD production spares LTD but impairs LTP, an effect rescued by partial blockade of GluN2B.
(A) Summary graphs of EPSC amplitude pre- and post-LTD induction (−45 mV, 500 pulses, 1 Hz), elicited in GFP, AICD and AICD-NLS neurons. Sample EPSC traces pre-LTD (black) and 50–60 min post-LTD (grey) induction are shown. (B) Average LTD magnitude (at 50–60 min post-LTD induction) normalized to pre-LTD baseline values (100%) in GFP, AICD and AICD-NLS neurons. (C) Summary graphs of EPSC amplitude pre- and post-LTP induction (−10 mV, 100 Hz, 1 s) elicited in GFP, AICD and AICD-NLS neurons. Sample EPSC traces pre-LTP (black) and 50–60 min post-LTP (grey) induction are shown. (D) Average LTP magnitude (at 50–60 min post-LTP induction) normalized to pre-LTP baseline values (100%) in GFP, AICD and AICD-NLS neurons. (E) Panel shows summary graphs of EPSCs amplitude pre- and post-LTP induction (−10 mV, 100 Hz, 1 s) elicited in AICD-NLS neurons with or without 300 nM ifenprodil in vitro bath application. (F) Panel illustrates average LTP magnitude (at 50–60 min post-LTP induction) normalized to pre-LTP baseline values (100%) during 0 to 5 µM in vitro bath application of ifenprodil (Ifen). Each dot in (B) and (D) represents one neuron. *p<0.05; **p<0.01. Full statistical analysis is detailed in Supplementary file 1.
Figure 9—figure supplement 1

AICD and GFP neurons exhibit different EPSC response profiles during LTP induction, but not during LTD induction.
(A) Summary graph of percent change in EPSC slope (normalized to slope value of first pulse as 100%) for first 50 stimuli (S1–S50) during LTD induction protocol (−45 mV, 500 pulses, 1 Hz) in neurons transduced with the indicated viruses. (B) Average percent change in EPSC slope obtained during last 10 pulses (normalized to slope value of first pulse as 100%) of LTD induction in GFP and AICD-NLS neurons. n.s.: non significant. (C) Summary graph of percent change in EPSC slope (normalized to slope value of first pulse as 100%) for first 50 stimuli (S1–S50) during LTP induction protocol (−10 mV, 100 Hz, 1 s) in neurons transduced with the indicated viruses in absence or presence of 300 nM infenprodil. (D) Average percent change in EPSC slope obtained during last 10 pulses (normalized to slope value of first pulse as 100%) of LTP induction in neurons transduced with the indicated viruses in absence or presence of 300 nM infenprodil (Ifen). See Supplementary file 1 for full statistics.
Figure 9—figure supplement 2
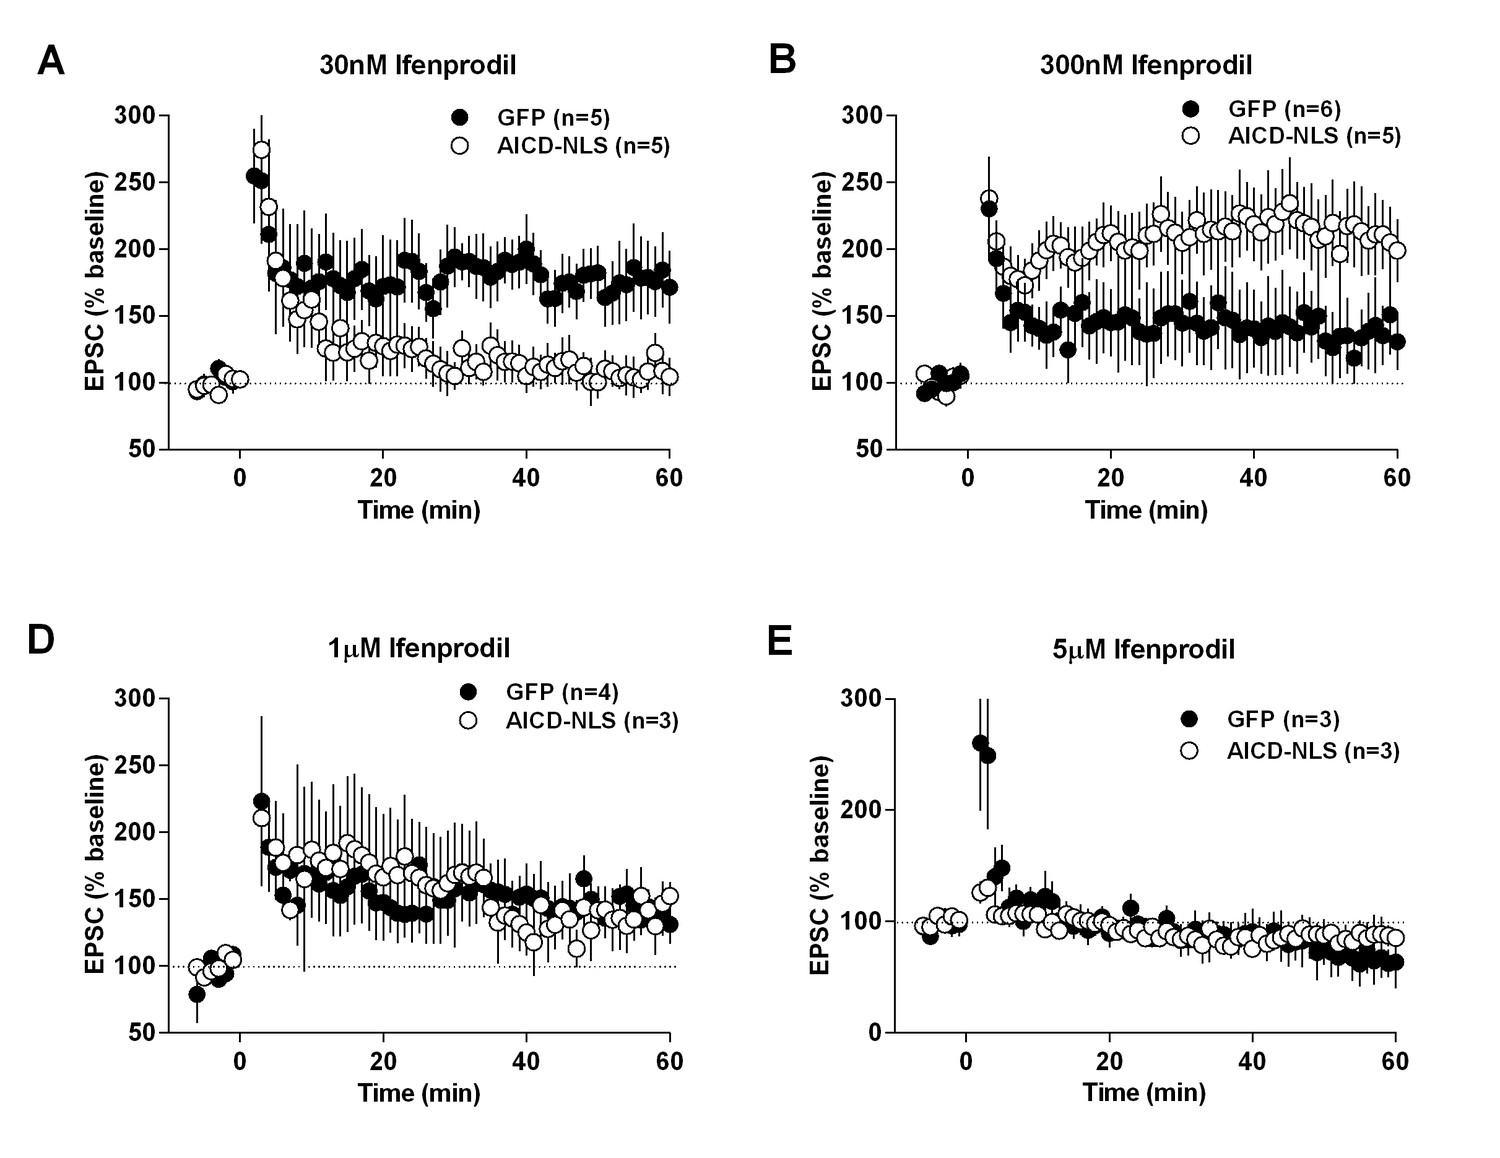
Ifenprodil affects LTP in a concentration-dependent manner, which is altered in neurons expressing AICD-NLS.
LTP of EPSC amplitude, induced by high-frequency stimulation (−10 mV, 100 Hz, 1 s), measured in GFP and AICD-NLS neurons in presence of ifenprodil: (A) 30 nM, (B) 300 nM, (C) 1 µM and (D) 5 µM. Summary bar graphs of these experiments are shown in Figure 9F of main manuscript and statistical analysis is detailed in Supplementary file 1.
Additional files
-
Supplementary file 1
Statistics.
(A) AICD increases NMDAR, but not AMPAR, transmission in CA1 pyramidal neurons. (B) AICD regulates synaptic currents mediated by increasing synaptic GluN2B contribution. (C) Statistics (AICD regulates GluN2B mRNA levels). (D) APP knock down eliminates synaptic GluN2B NMDARs, an effect rescued by nuclear AICD delivery. (E) Physiological and pathological levels of AICD in the brain. (F) AICD perturbs synaptic signal integartion and discharge probability. (G) AICD perturbs synaptic signal integration and discharge probability by affecting the NMDAR-SK2 channel coupling. (H) LTP, but not LTD, is impaired in AICD neurons, a phenotype rescued by partial blockade of GluN2B subunits.
- https://doi.org/10.7554/eLife.25659.013
Download links
A two-part list of links to download the article, or parts of the article, in various formats.
Downloads (link to download the article as PDF)
Open citations (links to open the citations from this article in various online reference manager services)
Cite this article (links to download the citations from this article in formats compatible with various reference manager tools)
Physiological and pathophysiological control of synaptic GluN2B-NMDA receptors by the C-terminal domain of amyloid precursor protein
eLife 6:e25659.
https://doi.org/10.7554/eLife.25659


