Tandem hnRNP A1 RNA recognition motifs act in concert to repress the splicing of survival motor neuron exon 7
- Eidgenössische Technische Hochschule Zürich, Switzerland
- Sorbonne Paris Cité, France
- Institut de biologie physico-chimique, France
Figures
Figure 1 with 2 supplements
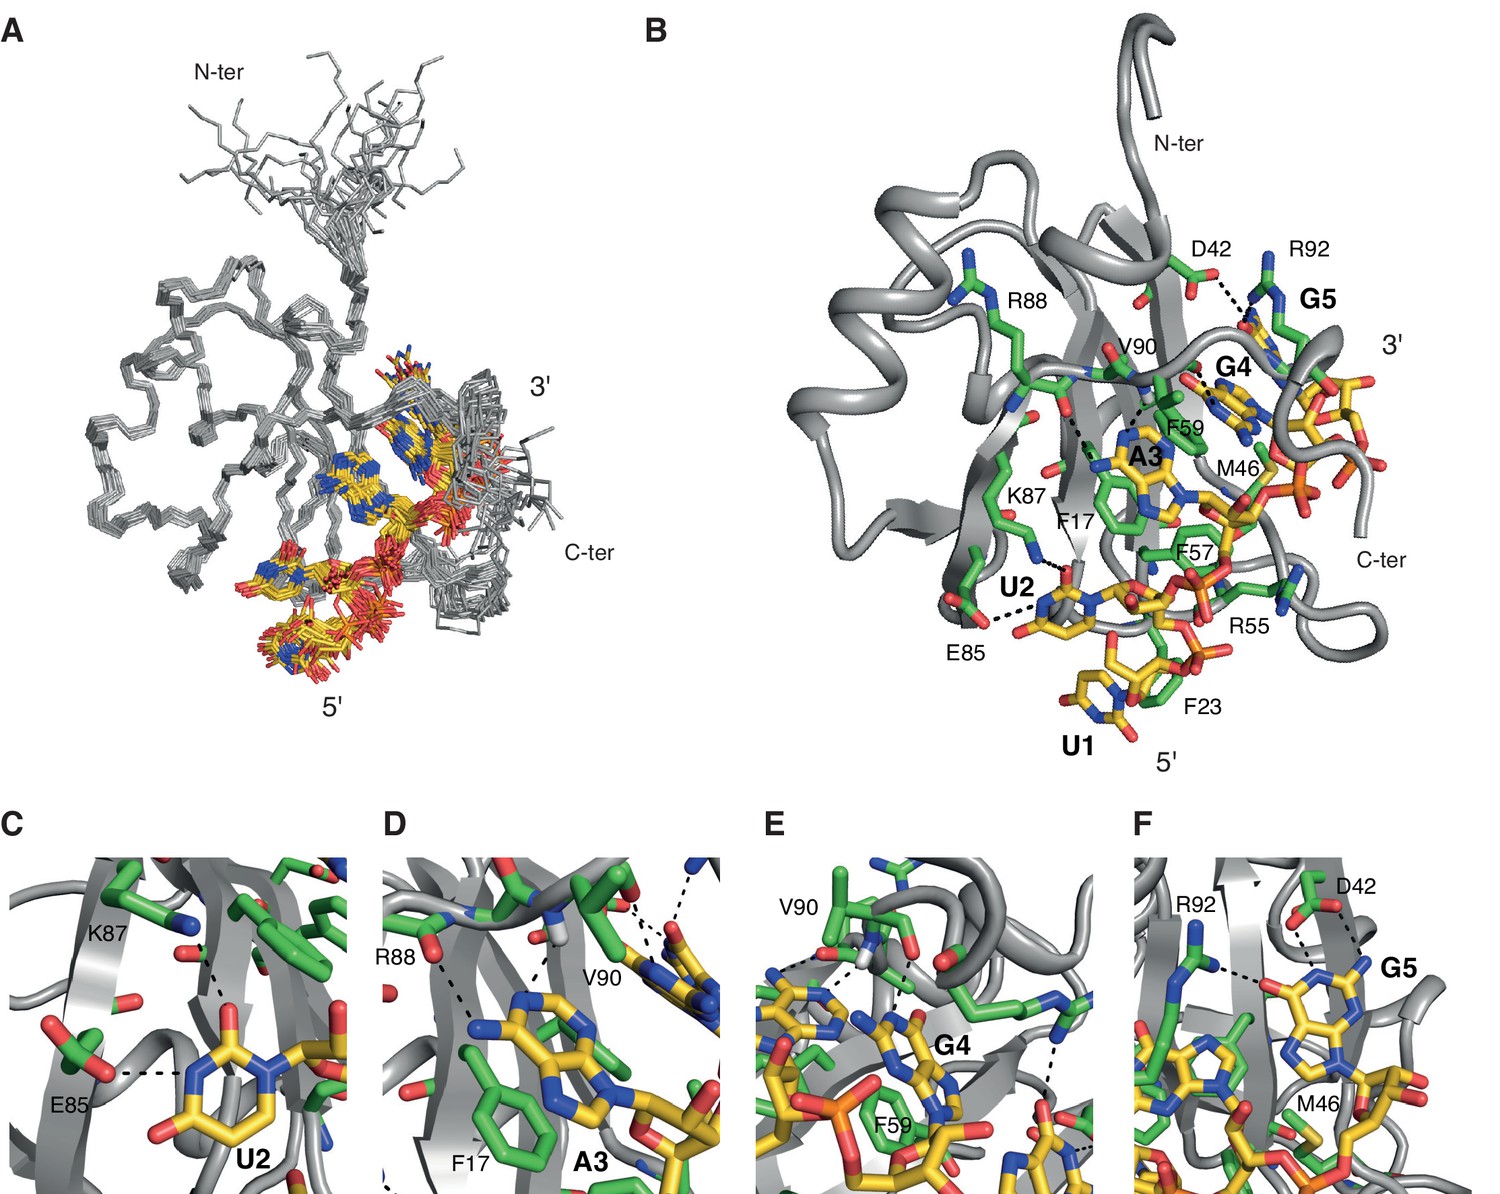
Overview of the solution structure of hnRNP A1 RRM1 bound to 5´-UUAGGUC-3´ RNA.
(A) NMR ensemble. Overlay of the 20 final structures superimposed on the backbone of the structured part (11-92) and represented as a ribbon trace (N, Cα, C´). The not-well-defined nucleotides U6 and C7 are omitted for a better overview. The RNA is shown in stick representation with the carbon atoms in yellow, nitrogen in blue, phosphate in orange and oxygen in red. (B) Cartoon drawing of a representative structure of the NMR ensemble. Residues with important roles in RNA binding are shown as sticks, with the carbon atom in green. All other atoms have the same color code as in panel A. (C–F) Close-up views of each single nucleotide recognition by hnRNP A1 RRM1. Representation and colors are similar to panel B. Residues with important roles in RNA binding are labeled.
Figure 1—figure supplement 1
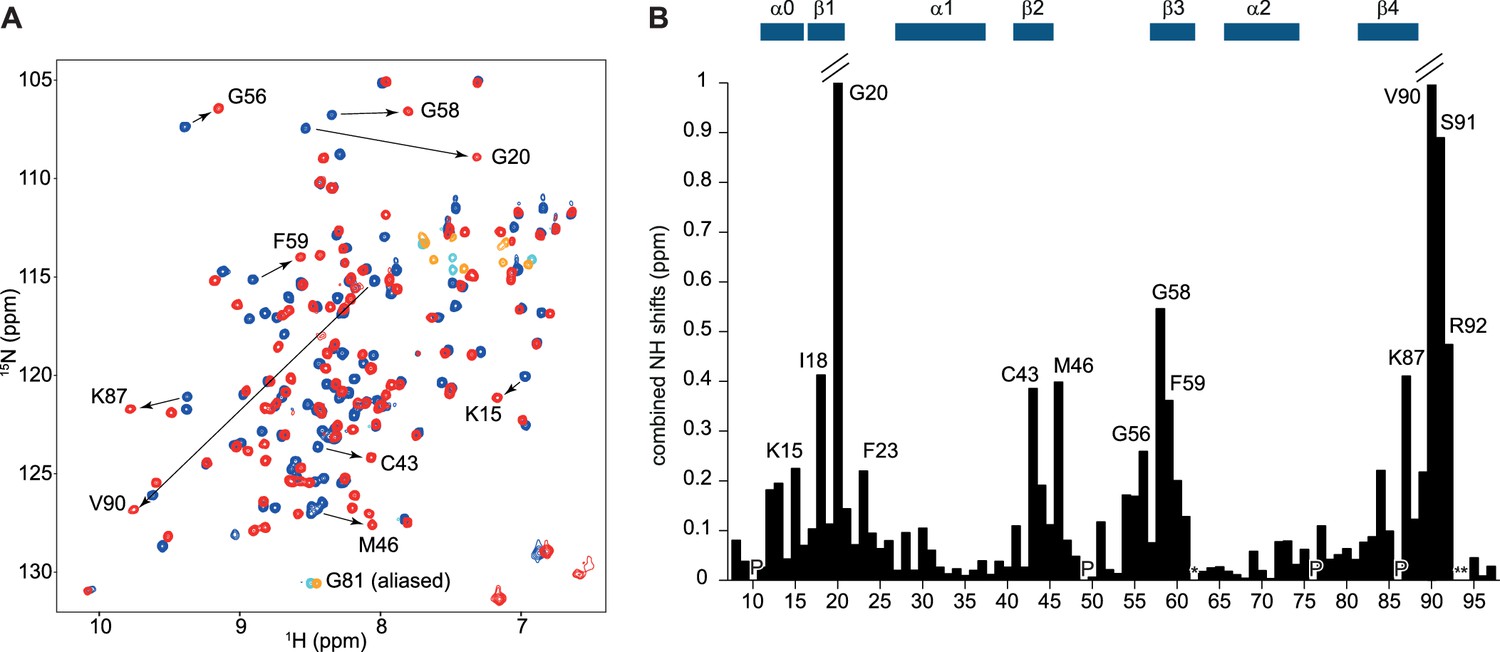
Overview of the titration of 5´-UUAGGUC-3´to hnRNP A1 RRM1.
(A) NMR titration of hnRNP A1 RRM1 with the 5´-UUAGGUC-3´ RNA. Overlay of a 2D (15N,1H)-HSQC of the free form in blue and the bound form at a 1:1 ratio in red. Aliased peaks are colored in cyan (free) and orange (bound). Residues with large chemical shift perturbations are highlighted with an arrow. (B) Plot of the combined backbone NH chemical shift perturbation of hnRNP A1 RRM1 upon binding to the 5´-UUAGGUC-3´ RNA. Residues with large chemical shift perturbations are labeled on the histogram. (P) corresponds to proline residues and (*) to missing amide signals in either the free or bound form. Secondary structure elements are depicted above the histogram.
Figure 1—figure supplement 2
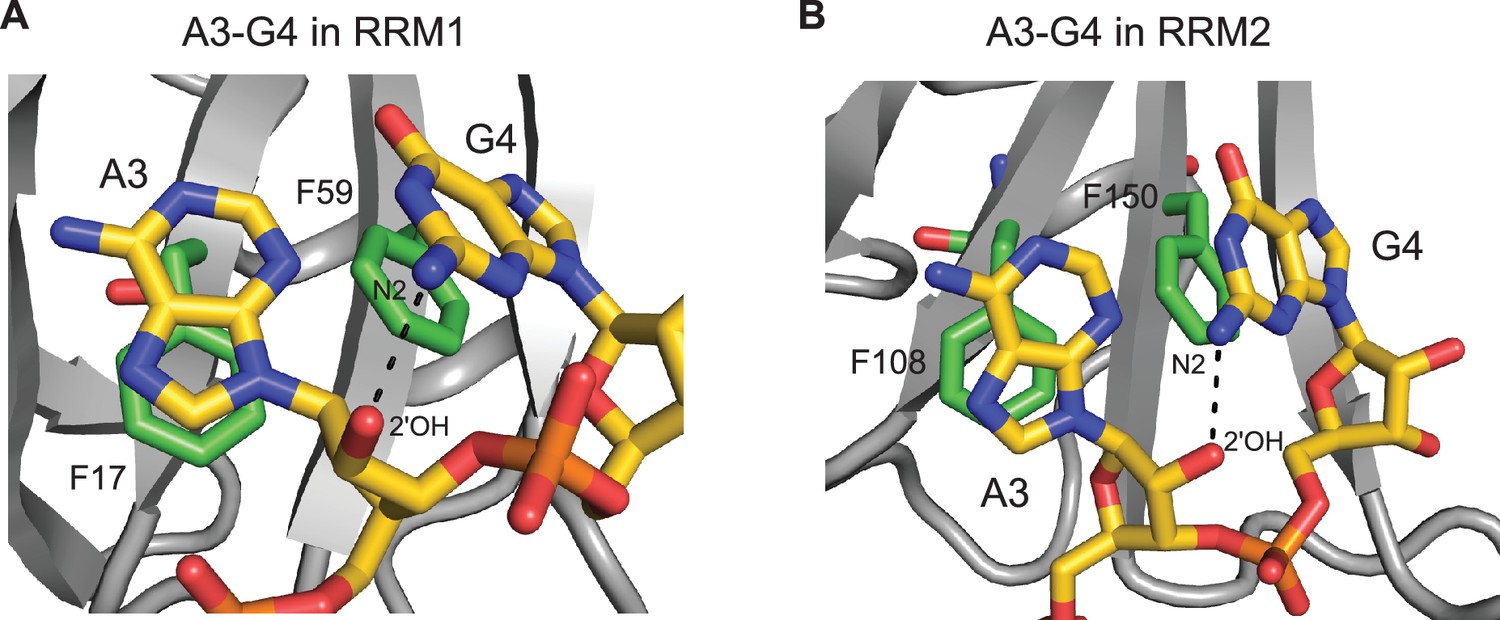
Intramolecular hydrogen bond within the AG dinucleotide constituting the core of the hnRNP A1 RRMs binding motif.
Intramolecular hydrogen bond within the AG dinucleotide in the structure of (A) hnRNP A1 RRM1 bound to 5´-UUAGGUC-3´ RNA; or (B) hnRNP A1 RRM2 bound to 5´-UCAGUU-3´ RNA. The intramolecular hydrogen bond occurs between the N2 exocyclic amino-group of G4 and the 2´-hydroxyl group of the A3 ribose. This intramolecular hydrogen bond is specific of RNA oligonucleotides and is therefore not found in the structures of UP1 bound to DNA oligonucleotides.
Figure 2 with 2 supplements
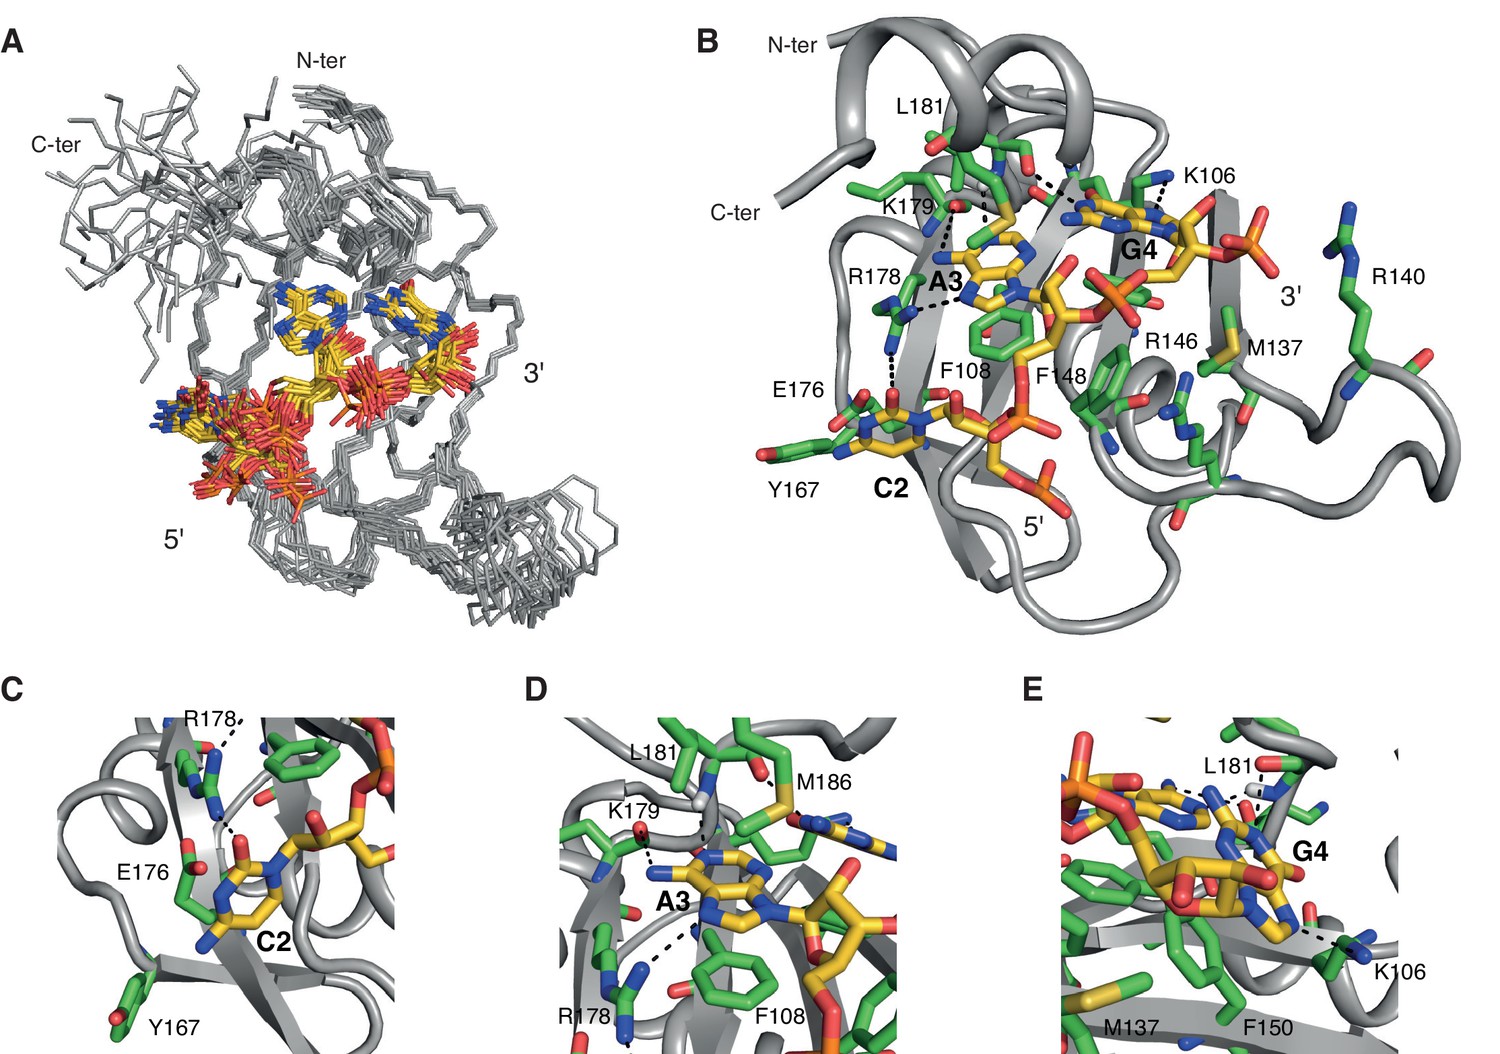
Overview of the solution structure of hnRNP A1 RRM2 bound to 5´-UCAGUU-3´ RNA.
(A) NMR ensemble. Overlay of the 20 final structures superimposed on the backbone of the structured part (103-112, 115-139, 144-187) and represented as a ribbon trace (N, Cα, C´). The not-well-defined N- and C-terminal residues as well as nucleotides U1, U5 and U6 are omitted for a better overview. The RNA is shown in stick representation with the carbon atoms in yellow, nitrogen in blue, phosphate in orange and oxygen in red. (B) Cartoon drawing of a representative structure of the NMR ensemble. Residues with important roles in RNA binding are shown as sticks, with the carbon atom in green. All other atoms have the same color code as in panel A. (C–E) Close-up views of each single nucleotide recognition by hnRNP A1 RRM2. Representation and colors are similar to panel B. Residues with important roles in RNA binding are labeled.
Figure 2—figure supplement 1
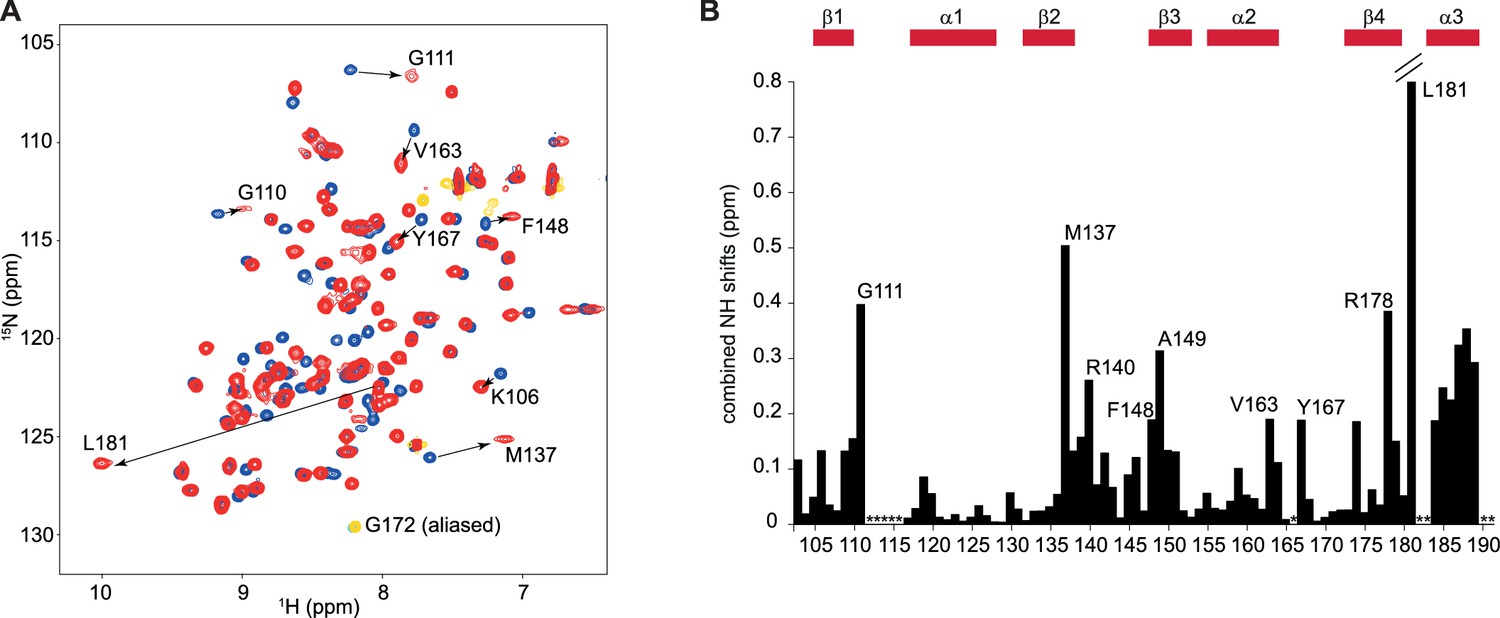
Overview of the titration of 5´-UCAGUU-3´to hnRNP A1 RRM2.
(A) NMR titration of hnRNP A1 RRM2 with the 5´-UCAGUU-3´ RNA. Overlay of a 2D (15N,1H)-HSQC of the free form in blue and the bound form at a 1:1 ratio in red. Aliased peaks are colored in cyan (free) and orange (bound). Residues with large chemical shift perturbations are highlighted with an arrow. (B) Plot of the combined backbone NH chemical shift perturbation of hnRNP A1 RRM2 upon binding to the 5´-UCAGUU-3´ RNA. Residues with large chemical shift perturbations are labeled on the histogram. (*) corresponds to missing amide signals in either the free or bound form. Secondary structure elements are depicted above the histogram.
Figure 2—figure supplement 2
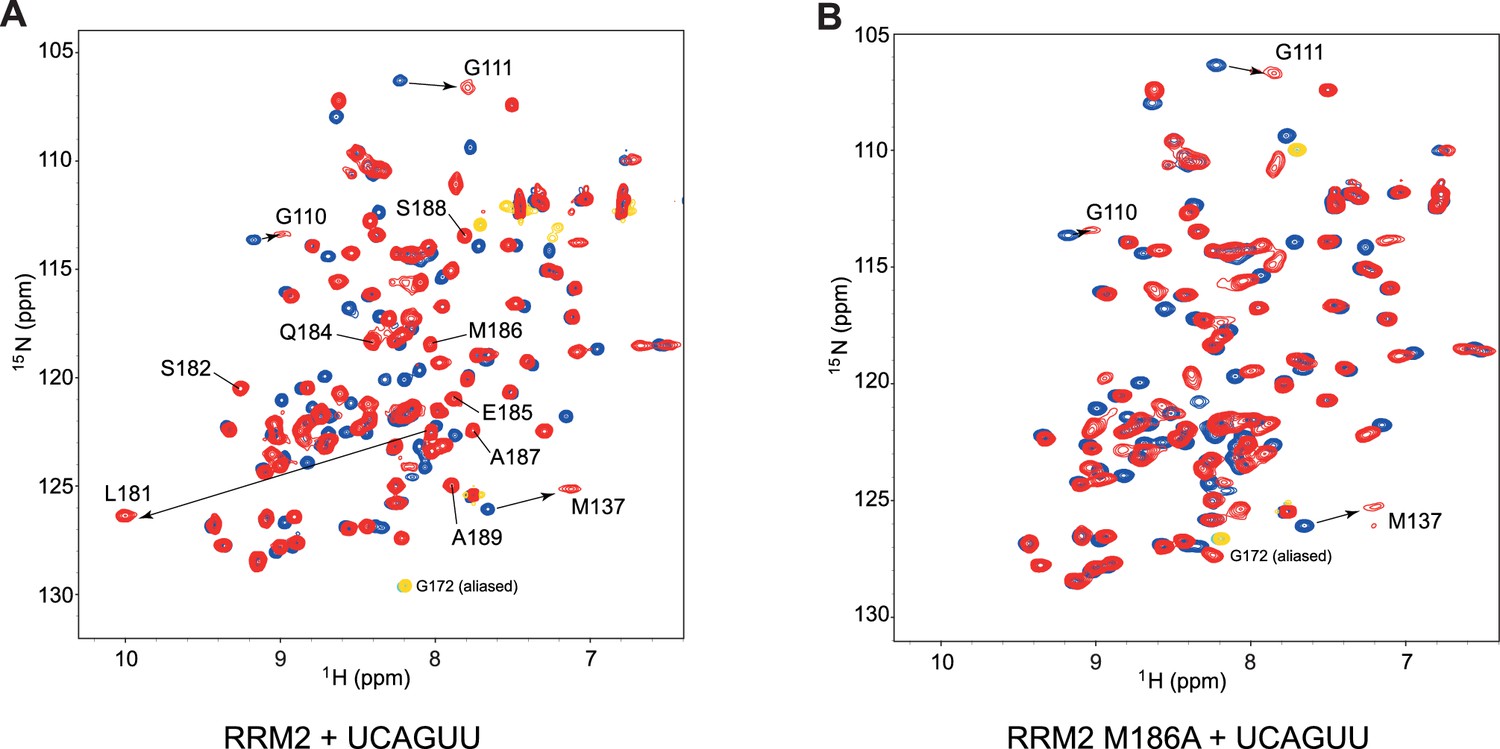
The side chain of methionine 186 drives most of the C-terminal helix α3 folding upon RNA-binding.
(A) Overlay of (15N,1H)-HSQCs of free RRM2 (in blue) and of RRM2 bound to 1.0 eq of 5´-UCAGUU-3´ RNA (in red). In addition to chemical shift changes due to direct contact with the RNA, residues at the C-terminal end of RRM2 experience large chemical shift perturbation due to the structuration of a C-terminal α-helix (Ser182-Ala189). (B) Overlay of (15N,1H)-HSQCs of free RRM2-M186A variant (in blue) and of RRM2-M186A bound to 1.0 eq of 5´-UCAGUU-3´ RNA (in red). Although binding on the β-sheet surface still occurs (see residues Gly110, Gly111 and Met137), the structuration of the C-terminal helix α3 is extremely perturbed (signals of residues Ser182-Ala189 do not appear at the same position in the spectrum).
Figure 3 with 2 supplements

Titration of ISS-N1 variants to UP1 R140A variant.
Overlays of 2D (15N,1H)-HSQC spectra of the free UP1 R140A variant (blue) and UP1 R140A in the presence of 1 equivalent of ISS-N1 variants (red). The region shown in a close-up is shown on the respective panel (E–H). Residues pointed out for RRM1 in the text are marked in panels (F) and (H). NMR signals can be obtained at a good linewidth for the complex of UP1 R140A + ISS-N1-u25g. (A) UP1 R140A (0.3 mM) + ISS-N1 WT. (B) UP1 R140A (0.3 mM) + ISS-N1-14g25g. (C) UP1 R140A (0.3 mM) + ISS-N1-c14g. (D) UP1 R140A (0.3 mM) + ISS-N1-u25g. (E–H) Close-up view of the region boxed on panels A–D).
Figure 3—figure supplement 1

Sequence and localization of the cis-acting element ISS-N1 in the SMN2 intron 7.
(A) Sequence of the region around the ISS-N1 in the intron 7 of SMN2 (Hua et al., 2008; Singh et al., 2006). The ISS-N1 is boxed in red, with the two AG dinucleotides constituting the core of the hnRNP A1 binding sites in italic. Exonic sequences are in upper case, whereas intronic sequences are in lower case. (B) ISS-N1 oligonucleotides wild-type and variants (c14g, u25g and 14g25g) used in NMR studies. Residue numbering such as used in this manuscript corresponds to the residue number from the 5´ splice-site and is present above the sequences. The 5´ GGA sequence that allows high in vitro transcription efficiency is in gray. The two AG dinucleotides constituting the core of the hnRNP A1 binding sites are in bold. They are separated by a spacer of 9 nucleotides.
Figure 3—figure supplement 2
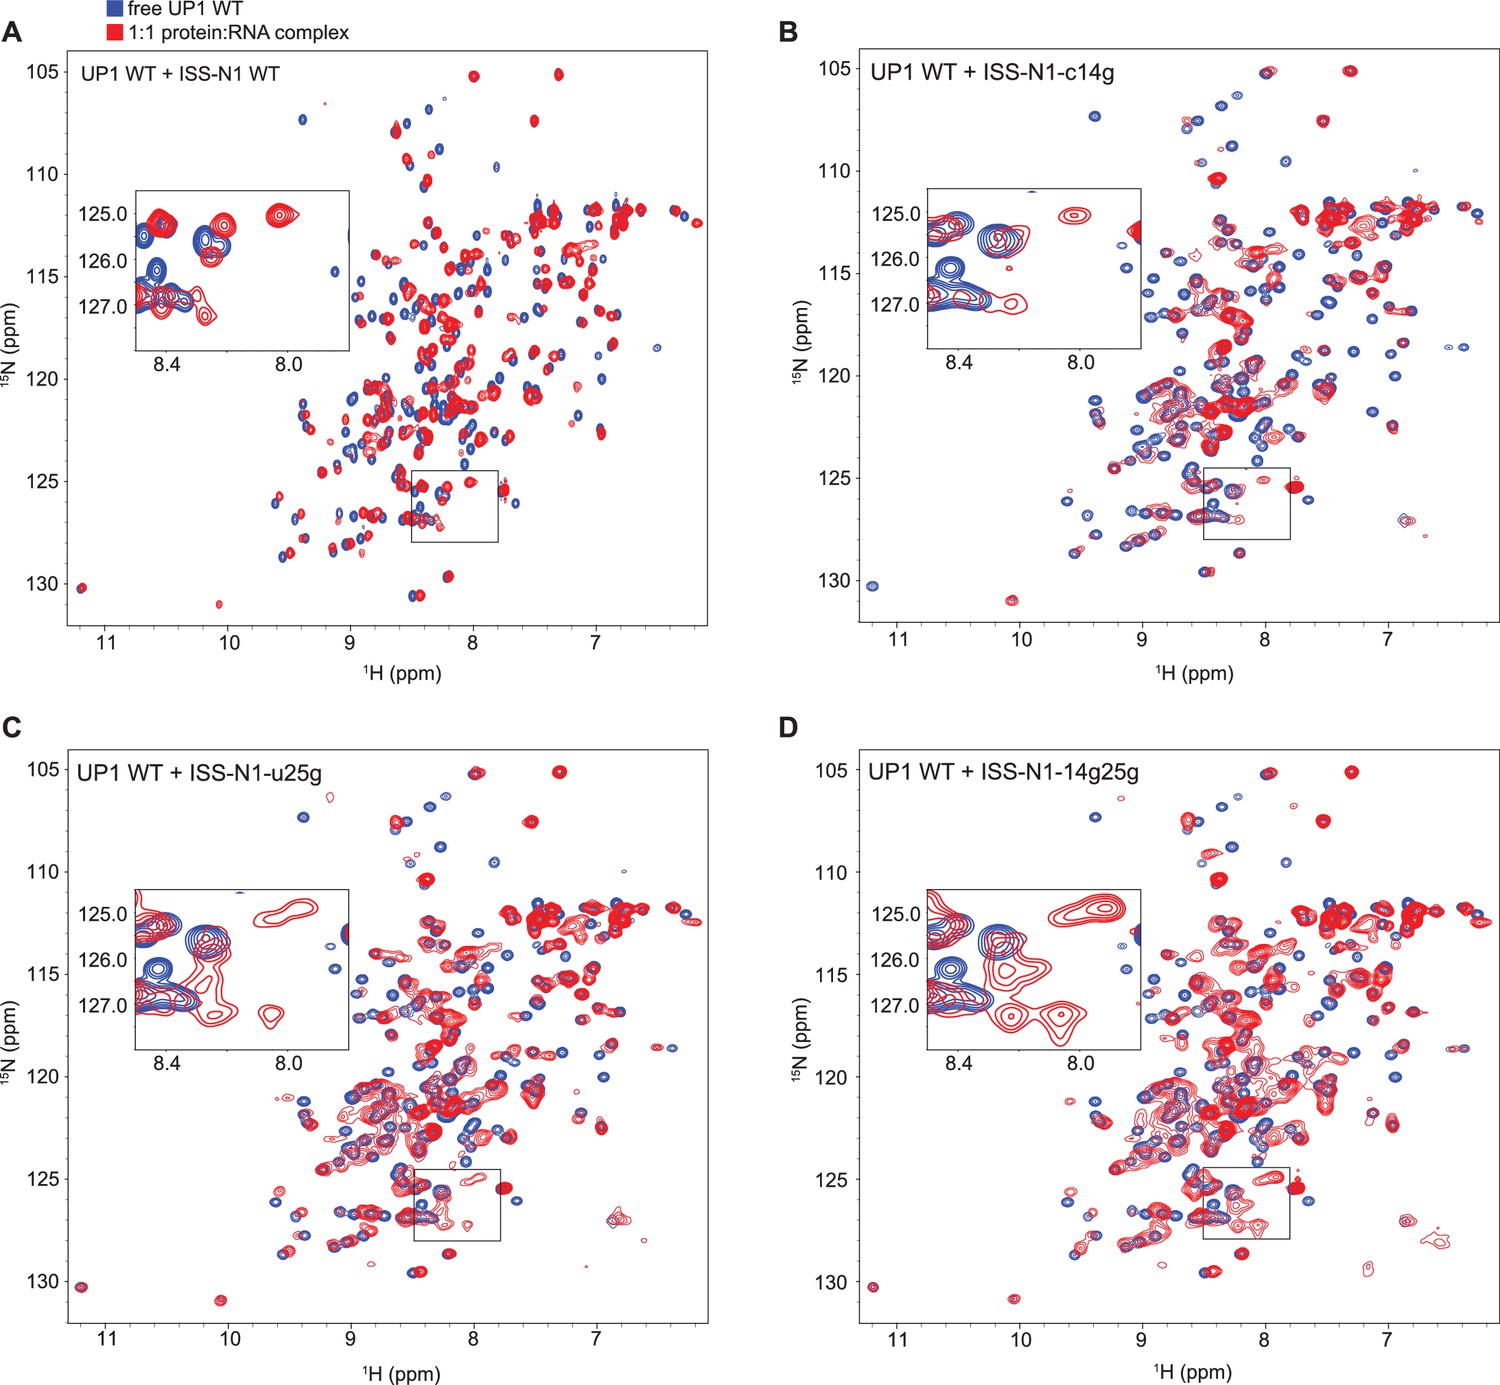
Titration of ISS-N1 variants to UP1 wild-type.
Overlays of 2D (15N,1H)-HSQC spectra of the free UP1 (blue) and UP1 in the presence of 1 equivalent of ISS-N1 variants (red). The region shown in a close-up is marked by a box. (A) UP1 WT (0.4 mM) + ISS-N1 WT. (B) UP1 WT (0.2 mM) + ISS-N1-c14g. (C) UP1 WT (0.2 mM) + ISS-N1-u25g. (D) UP1 WT (0.2 mM) + ISS-N1-14g25g.
Figure 4 with 3 supplements
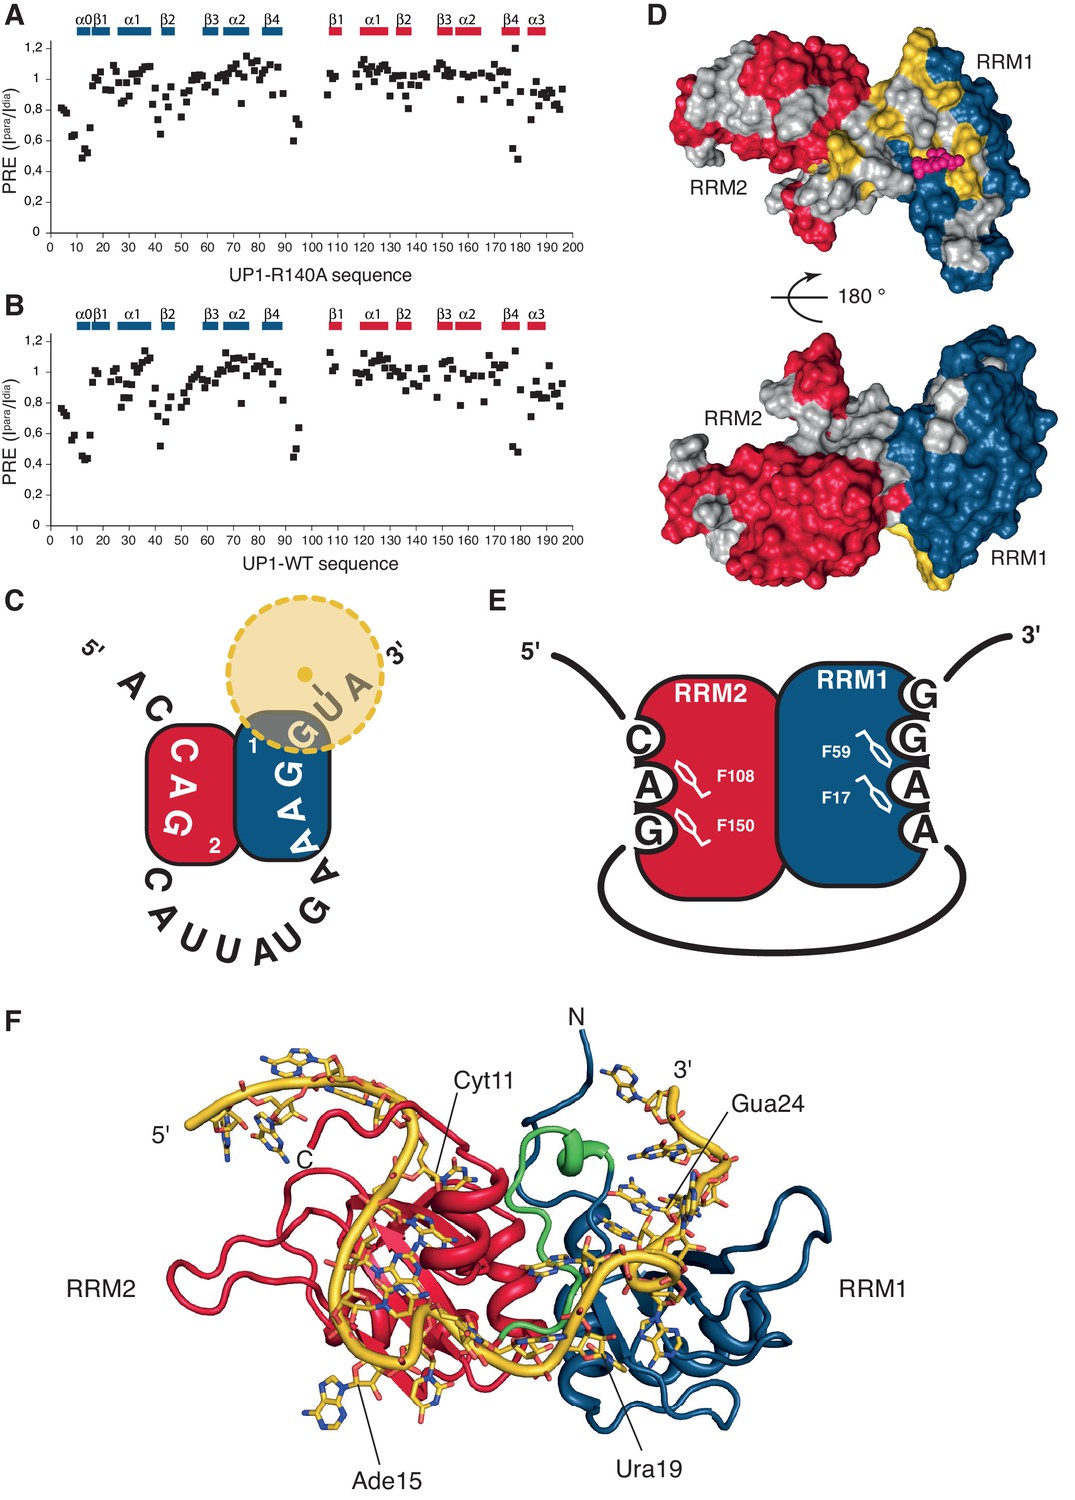
HnRNP A1 RRMs are looping out RNA with RRM2 binding the 5´-motif and RRM1 the 3´-motif.
(A–B) Paramagnetic relaxation enhancement (PRE) data from a spin label attached to a 4-thio-U nucleotide near the 3´-end of the ISS-N1 for (A) UP1-R140A protein bound to the modified ISS-N1 and (B) UP1-WT bound to the same modified ISS-N1. Secondary structure elements are drawn above the histograms. (C) Schematic representation of the modified ISS-N1 binding to hnRNP A1 RRMs. RRM2 is in red, and RRM1 in blue. The RNA sequence is written from the 5´-end to the 3´-end. The spin label is attached to a 4-thio-U located just after the RRM1 binding motif (AAGG). The spin label is represented as a yellow dot, and the PRE effect symbolized with a faint halo in yellow. (D) Surface representation of the residues in UP1-WT affected by the presence of the spin label near the 3´-end of the modified ISS-N1 RNA. The surface of hnRNP A1 RRMs is represented in red and blue for RRM2 and RRM1, respectively. Residues for which PRE data is not available due to a missing assignment in the bound form or due to severe signal overlaps are colored in gray in order to make them not appear as ‘not affected’. Residues with a ratio of the intensity in the oxidized or paramagnetic state over the intensity in the reduced or diamagnetic state (Ipara/Idia) lower than 0.7 are colored in yellow. For facilitating the structural interpretation of the PRE data, the positions of the O4 atoms of the U6 residue within the NMR bundle of hnRNP A1 RRM1 bound to 5´-UUAGGUC-3´ (this study) are shown as pink spheres. The spin label attached to the 4-thio-U in the modified ISS-N1 should sample the space around this approximate position. (top) front view. (bottom) 180 ° rotation, back view. (E) Schematic representation of hnRNP A1 RRMs binding to the modified ISS-N1-u25g RNA. RRM2 is in red, and RRM1 in blue. RRM2 binds the 5´ motif and accommodates three nucleotides (CAG), with the AG dinucleotide being stacked onto F108 and F150 of the RNP2 and RNP1 motifs, respectively. RRM1 binds the 3´ motif and accommodates four nucleotides (AAGG), with the central AG dinucleotide being stacked onto F17 and F59 of the RNP2 and RNP1 motifs, respectively. (F) Structural model of the ISS-N1-u25g bound to UP1-R140A. Modeling was performed as described in the Appendix 2. RRM2 is in red, RRM1 in blue, and the inter-RRM linker in green. The ISS-N1-u25g RNA is in yellow. Some nucleotides are labeled in order to appreciate the path of the RNA on the RRMs. Please note that the path of the RNA-spacer between the 5´ and 3´ motifs is not restrained by experimental constraints. The present structural model therefore illustrates one possible path of the ISS-N1 on the RRMs and should not be seen as the unique conformation adopted by the RNA spacer.
Figure 4—figure supplement 1
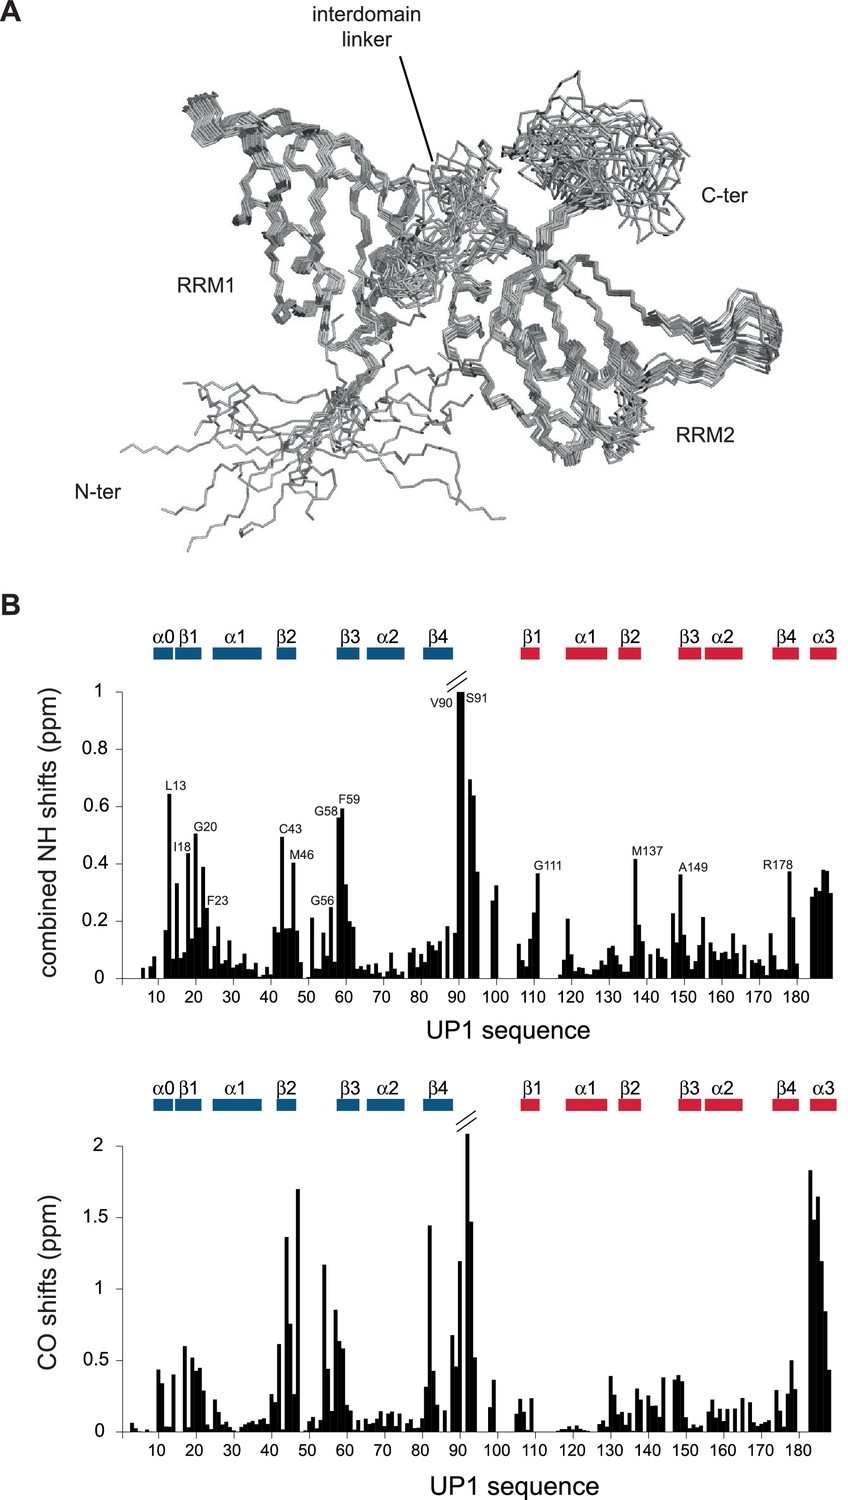
UP1 structure and chemical shift perturbation upon binding to the ISS-N1 RNA.
(A) Structure of the UP1-R140A protein variant in its bound form to the ISS-N1-u25g variant. The bundle represents the 20 structures with the lowest violation energy. The structures were calculated with 92% proton assignment and 4261 NOE-derived distance restraints. RRM1, RRM2, and the inter-RRM linker are labeled. (B) Chemical shift perturbation of the UP1-R140A protein resonances upon binding to the ISS-N1-u25g variant. (top) Backbone amide chemical shift difference. Some residues with the largest shifts are labeled on the histogram. (bottom) Backbone carbonyl chemical shift difference. Secondary structure elements are illustrated above the histograms.
Figure 4—figure supplement 2
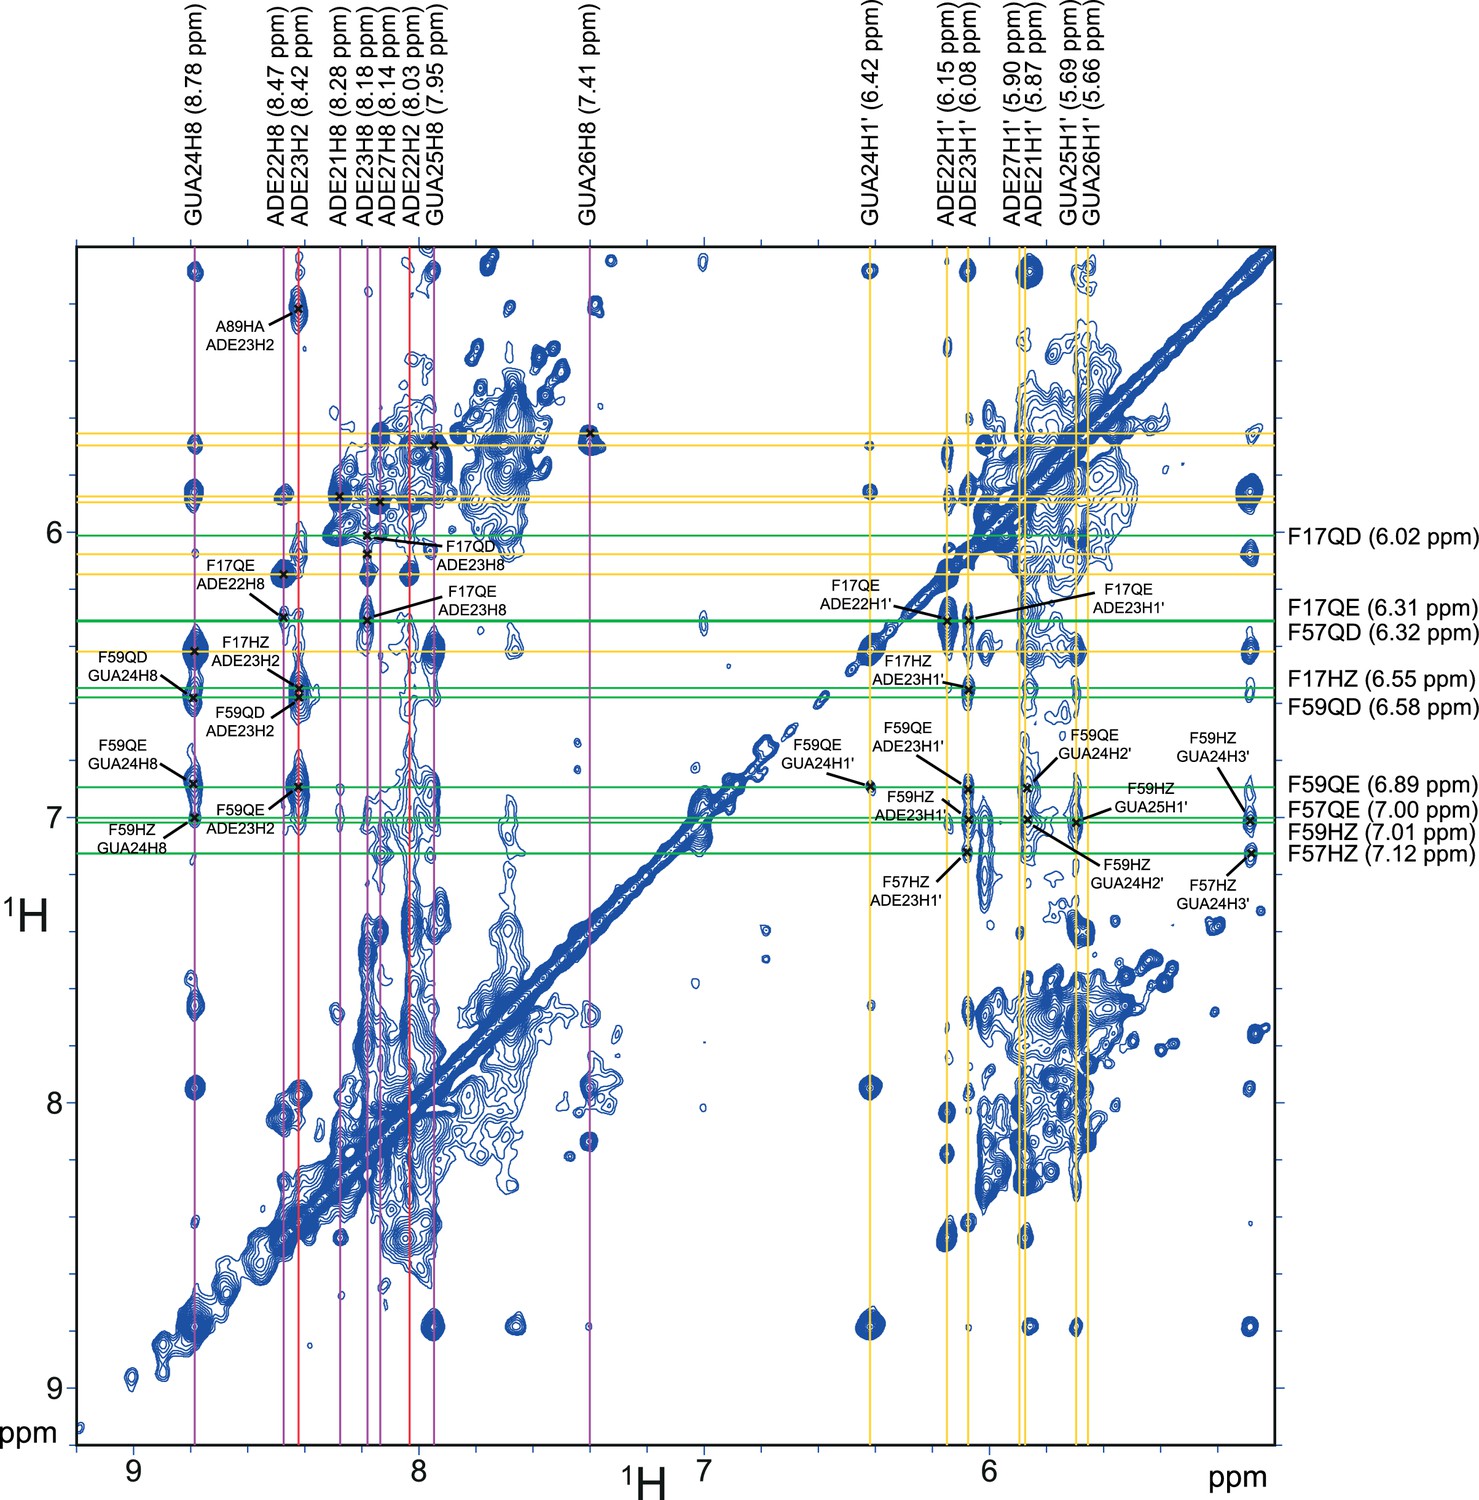
Summary of the intermolecular NOE between the ISS-N1-u25g RNA and the phenylalanine residues of the RNP1/RNP2 motifs of hnRNP A1 RRM1.
Part of the F2-filtered 2D-(1H,1H)-NOESY. The horizontal dimension is 13C-filtered such as only the resonances from the unlabeled RNA appear. The vertical dimension is not filtered, meaning both the RNA and the protein resonances appear. Resonances from the RNA are labeled above the spectrum, with aromatic H8 protons in pink, aromatic H2 protons in red and anomeric H1´ protons in yellow. The intra-residue H8 to H1´ correlations are marked with a black cross in the aromatic/anomeric region. Resonances from the phenylalanines of the RNP1/RNP2 motifs of RRM1 (i.e. F17/F57/F59) are labeled on the right side of the spectrum. Intermolecular NOEs between these aromatics and the RNA are marked with a black cross and labeled on the spectrum.
Figure 4—figure supplement 3
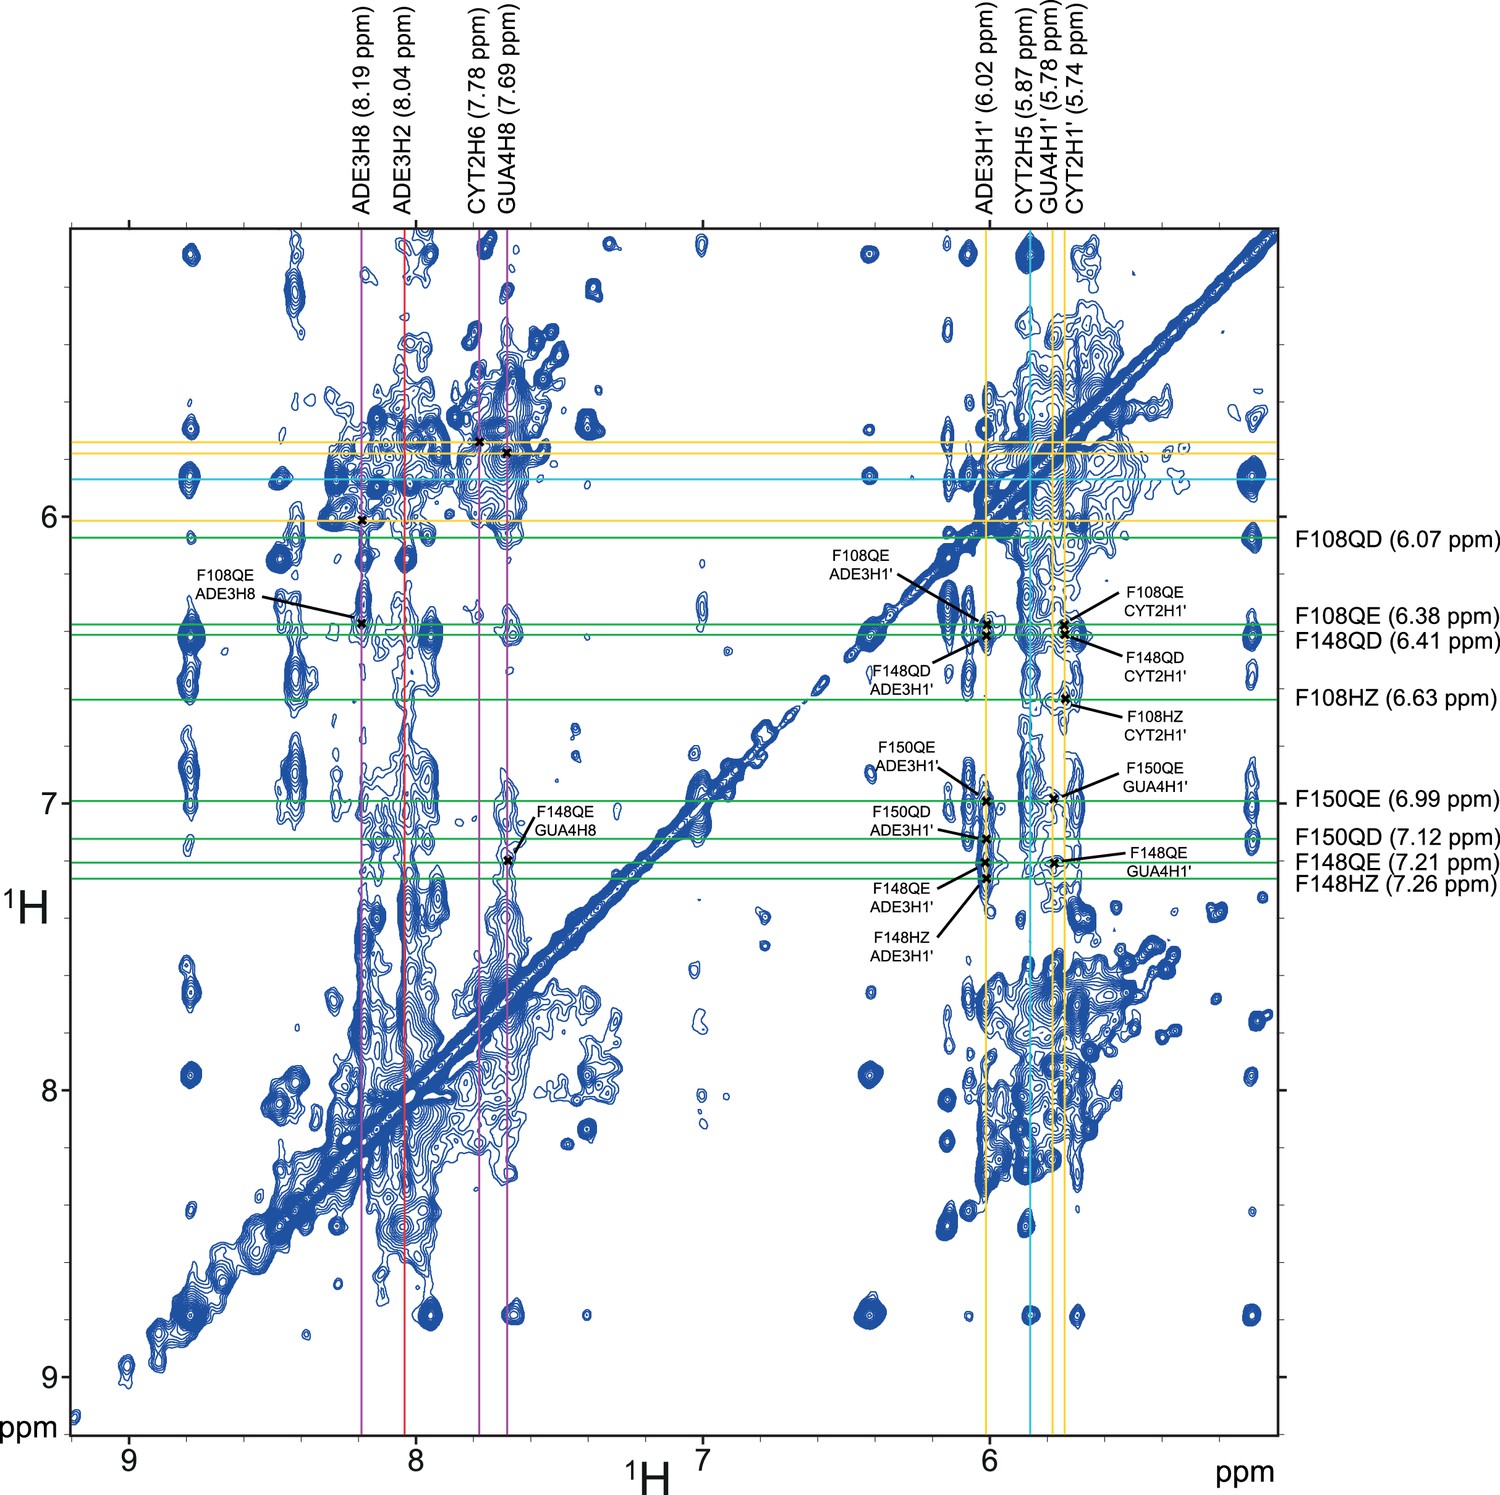
Summary of the intermolecular NOE between the ISS-N1-u25g RNA and the phenylalanine residues of the RNP1/RNP2 motifs of hnRNP A1 RRM2.
Part of the F2-filtered 2D-(1H,1H)-NOESY. The horizontal dimension is 13C-filtered such as only the resonances from the unlabeled RNA appear. The vertical dimension is not filtered, meaning both the RNA and the protein resonances appear. Resonances from the RNA are labeled above the spectrum, with aromatic H8 and H6 protons in pink, aromatic H2 protons in red, aromatic H5 protons in cyan and anomeric H1´ protons in yellow. The intra-residue H8/H6 to H1´ correlations are marked with a black cross in the aromatic/anomeric region. Resonances from the phenylalanines of the RNP1/RNP2 motifs of RRM2 (i.e. F108/F148/F150) are labeled on the right side of the spectrum. Intermolecular NOEs between these aromatics and the RNA are marked with a black cross and labeled on the spectrum.
Figure 5 with 4 supplements
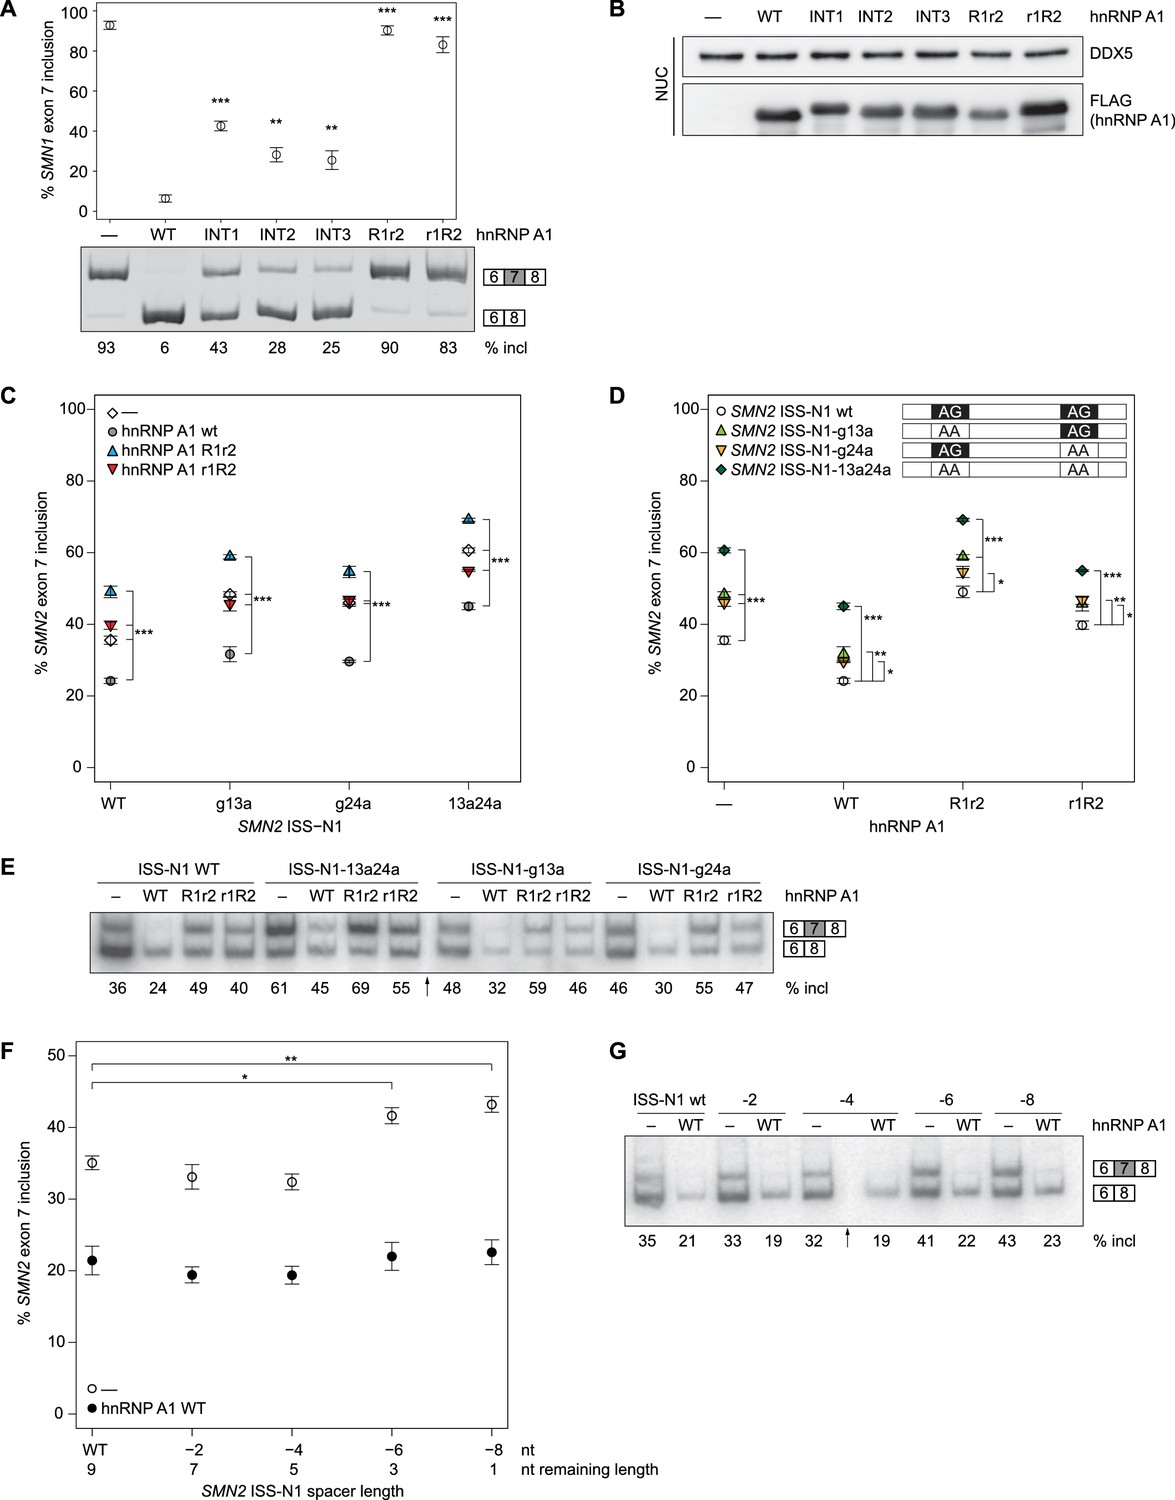
SMN splicing repression depends on hnRNP A1 organization and the bipartite ISS-N1 motif.
(A) Data from alternative splicing assay in HEK293T cells. Top panel, quantification of exon 7 inclusion in SMN1 upon overexpression of wild-type or mutant hnRNP A1. Bottom panel, PAGE with PCR products used for quantification. (B) Western Blot of nuclear extracts used in A. (C, D) Quantification of exon 7 inclusion in SMN2 in relation to overexpression of wild-type or mutant hnRNP A1 (C) or to mutation of the hnRNP A1 binding sites in the ISS-N1 (D). Both figures (C) and (D) contain are different representations of the same data. (E) Radioautography of PAGE with PCR products used for quantification in (C, D).The separation between two individual gels is indicated by an arrow. (F) Quantification of exon 7 inclusion in SMN2 in relation to the spacer length in-between the two hnRNP A1 binding sites within the ISS-N1. The wild-type ISS-N1 has a spacer length of 9 nt. (G) Radioautography of PAGE with PCR products used for quantification in (F). The separation between two individual gels is indicated by an arrow. Data information: All data points represent the mean of the biological replicates. Error bars correspond to the S.E.M. (B) **p=0.00113 (INT2), p=0.00360 (INT3), ***p<0.001; (C) ***p<0.001; (D) *p<0.5, **p<0.01, ***p<0.001; (F) *p=0.01176, **p=0.00287. All tested with one-way ANOVA (WT = 0), for panel (C, D) SMN2 wt co-transfections n = 4, otherwise n = 3. The mean of the replicate is always given below the corresponding PAGE for a better readability. If not otherwise indicated 0.5 µg hnRNP A1 were co-transfected with 1 µg of the mini-gene.
-
Figure 5—source data 1
PAGE quantification for SMN exon 7 inclusion (%).
- https://doi.org/10.7554/eLife.25736.023
Figure 5—figure supplement 1
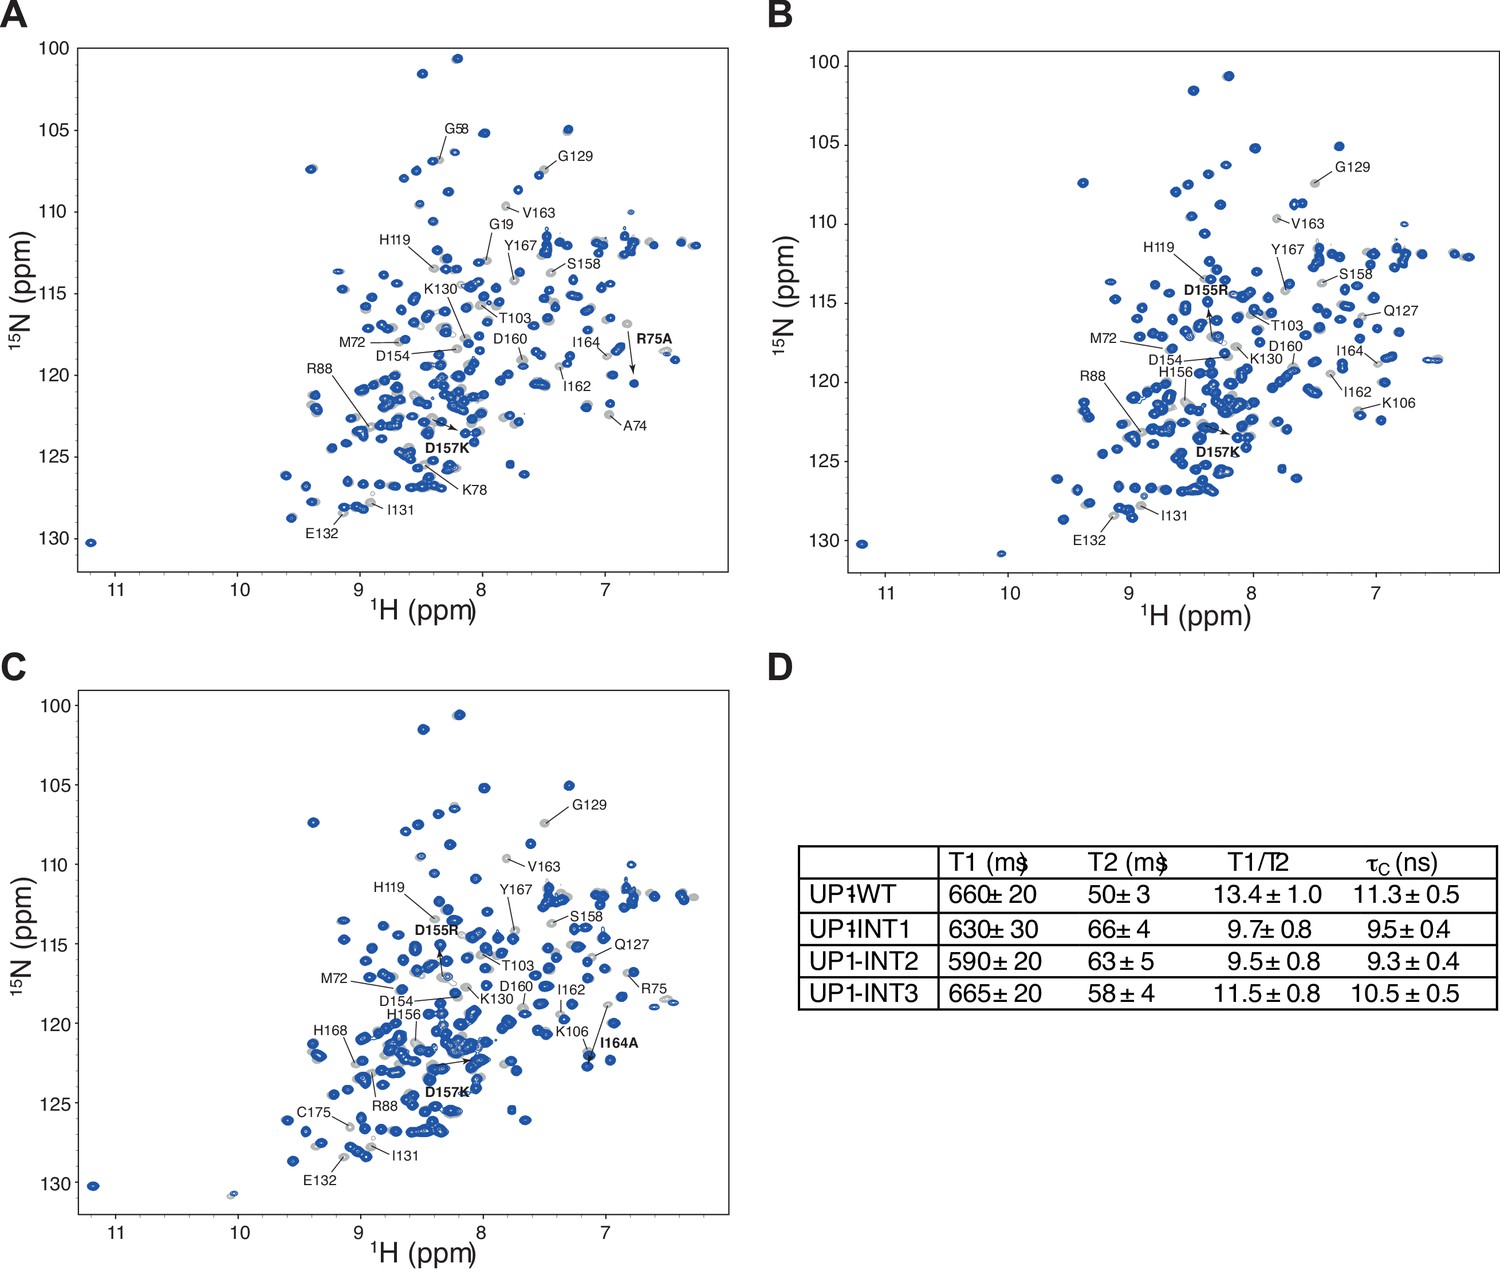
Protein mutants disrupt the inter-RRM interface.
(A) Overlay of (15N,1H)-HSQCs of wild-type UP1 (in gray) and of UP1-INT1 (D157K +R75A) double-mutant (in blue). (B) Overlay of (15N,1H)-HSQCs of wild-type UP1 (in gray) and of UP1-INT2 (D155R +D157K) double-mutant (in blue). (C) Overlay of (15N,1H)-HSQCs of wild-type UP1 (in gray) and of UP1-INT3 (D155R +D157K+I164A) triple-mutant (in blue). The mutants are designed to disrupt the inter-RRM interface by removing the two salt-bridges at the interface, namely the R75:D155 and the R88:D157 salt-bridges. (D) 15N T1, T2 and overall correlation time (τC) of UP1 wild-type (UP1-WT) and UP1-INT1, UP1-INT2 and UP1-INT3 inter-RRM interface mutants. Transverse relaxation time T2 is increased in UP1-INTs mutants as compared with UP1-WT. This indicates a faster tumbling of the single RRMs in the double mutant than tumbling as one unit in the wild-type UP1, confirming that the RRM-RRM interaction is perturbed. The UP1-INT2 mutant appears to be the most affected mutant.
Figure 5—figure supplement 2
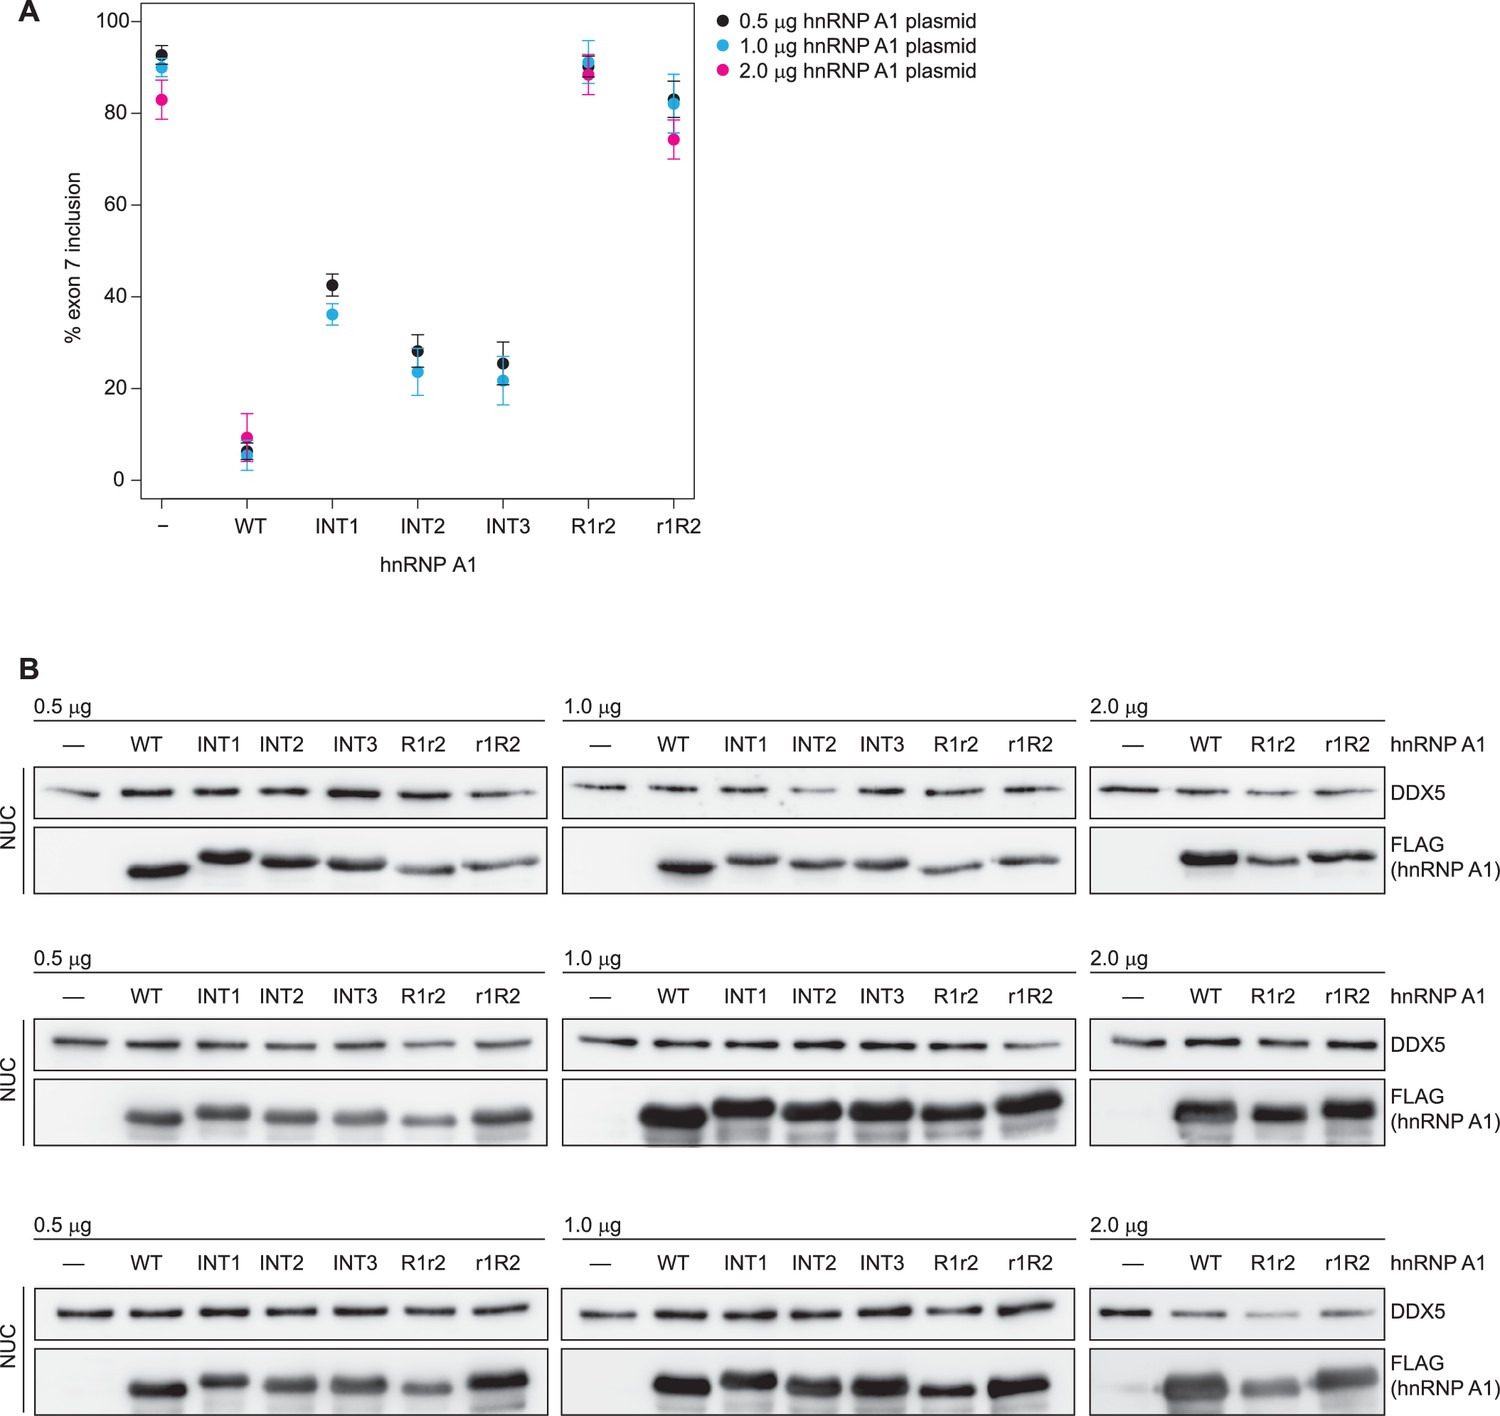
No dose dependency of hnRNP A1 overexpression.
(A) Data from alternative splicing assay in HEK293T cells. Quantification of exon 7 inclusion in SMN1 upon overexpression of wild-type or mutant hnRNP A1. 0.5 µg, 1 µg, or 2 µg pCGFLAG-hnRNP A1 WT/mutant were cotransfected with 1 µg pSMN1. SMN1 exon 7 inclusion remains stable regardless of increased hnRNP A1 overexpression. (B) Western Blots of nuclear extracts used in (A).
Figure 5—figure supplement 3

Western blots for SMN2 exon 7 splicing experiments in HEK293T cells.
(A) Western Blots of nuclear extracts used in Figure 5C–E. (B) Western Blots of nuclear extracts used in Figure 5F,G.
Figure 5—figure supplement 4
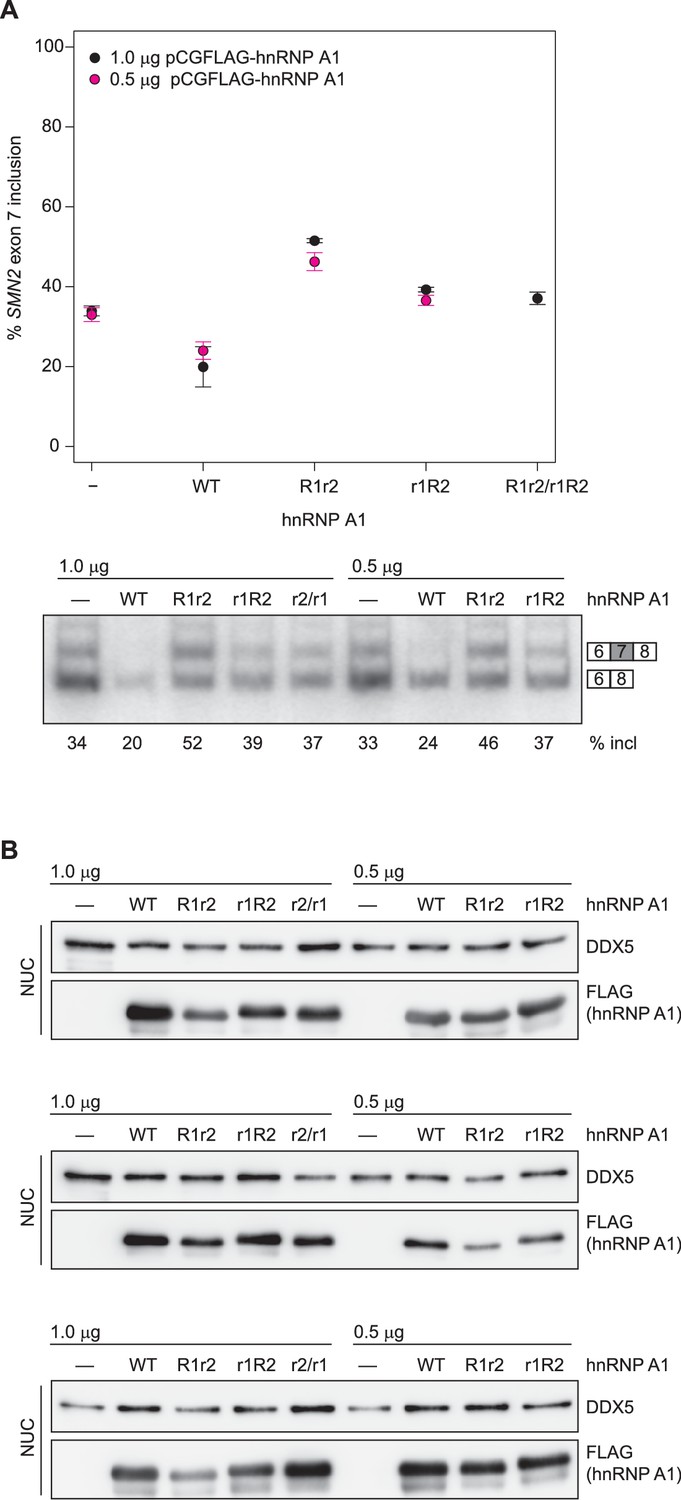
hnRNP A1 RRM mutants can not complement each other in SMN2 splicing assay.
(A) Data from alternative splicing assay in HEK293T cells. Quantification of exon 7 inclusion in SMN2 upon overexpression of wild-type or mutant hnRNP A1. HnRNP A1 R1r2 and r1R2 were independently as well as co-transfected. The mutants cannot complement each other as evidenced by same SMN exon 7 inclusion rate as for independent transfection of hnRNP A1 r1R2. (B) Western Blots of nuclear extracts used in (A).
Figure 6
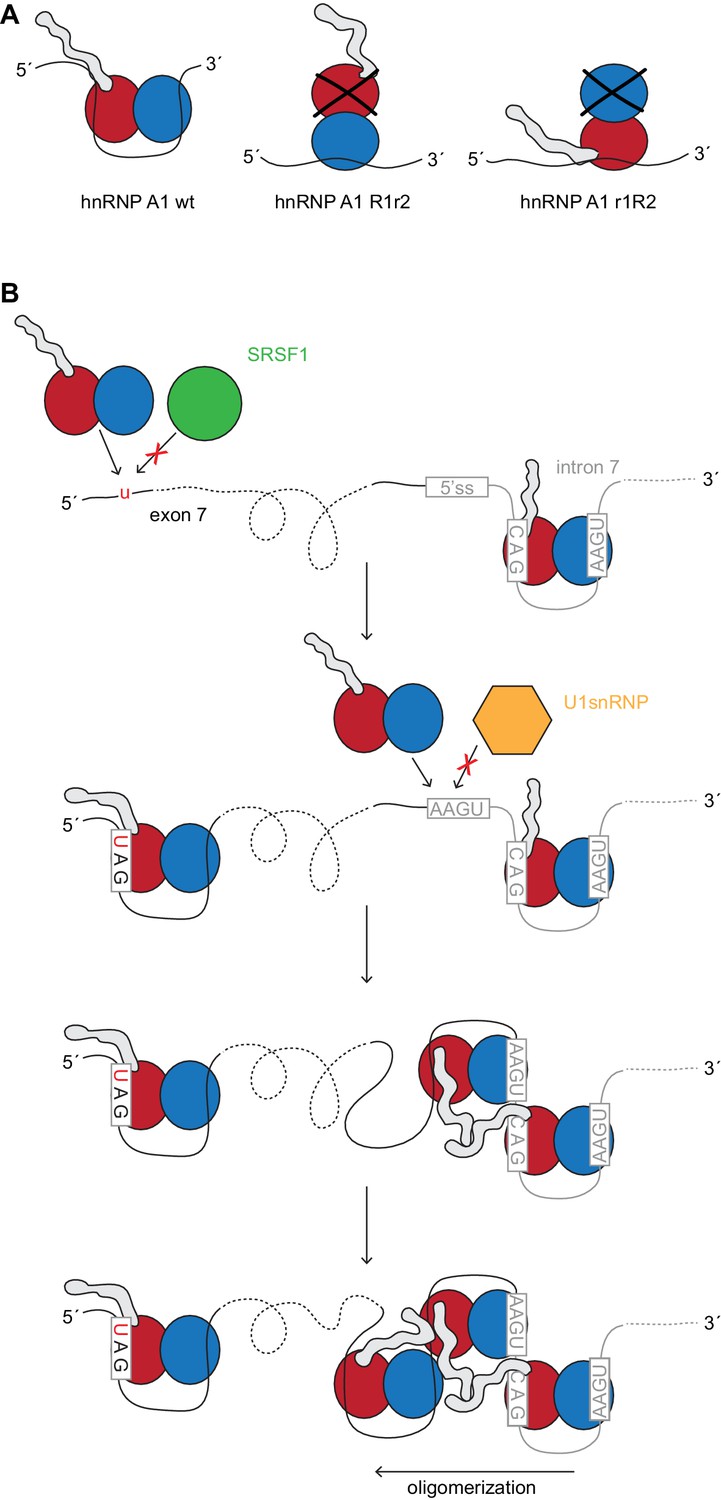
HnRNP A1 splicing repression and its dependency.
(A) Model of hnRNP A1 mutants R1r2 and r1R2. Owing to the protein’s topology the glycine-rich tail will be closer or further away from the pre-mRNA. Our data suggests that splicing repression depends on RRM2 RNA binding which might bring the glycine-rich domain closer to the RNA and/or other protein factors. (B) Model of hnRNP A1 assembly on the SMN2 exon 7 and intron 7. Starting at the ISS-N1 hnRNP A1 could oligomerize along the 3´-to-5´ direction. The G-rich tail can interact with other hnRNP A1 molecules. Binding sites are given by the U1 snRNA binding site and the C6-to-T mutation at the start of exon 7.
Appendix 1—figure 1
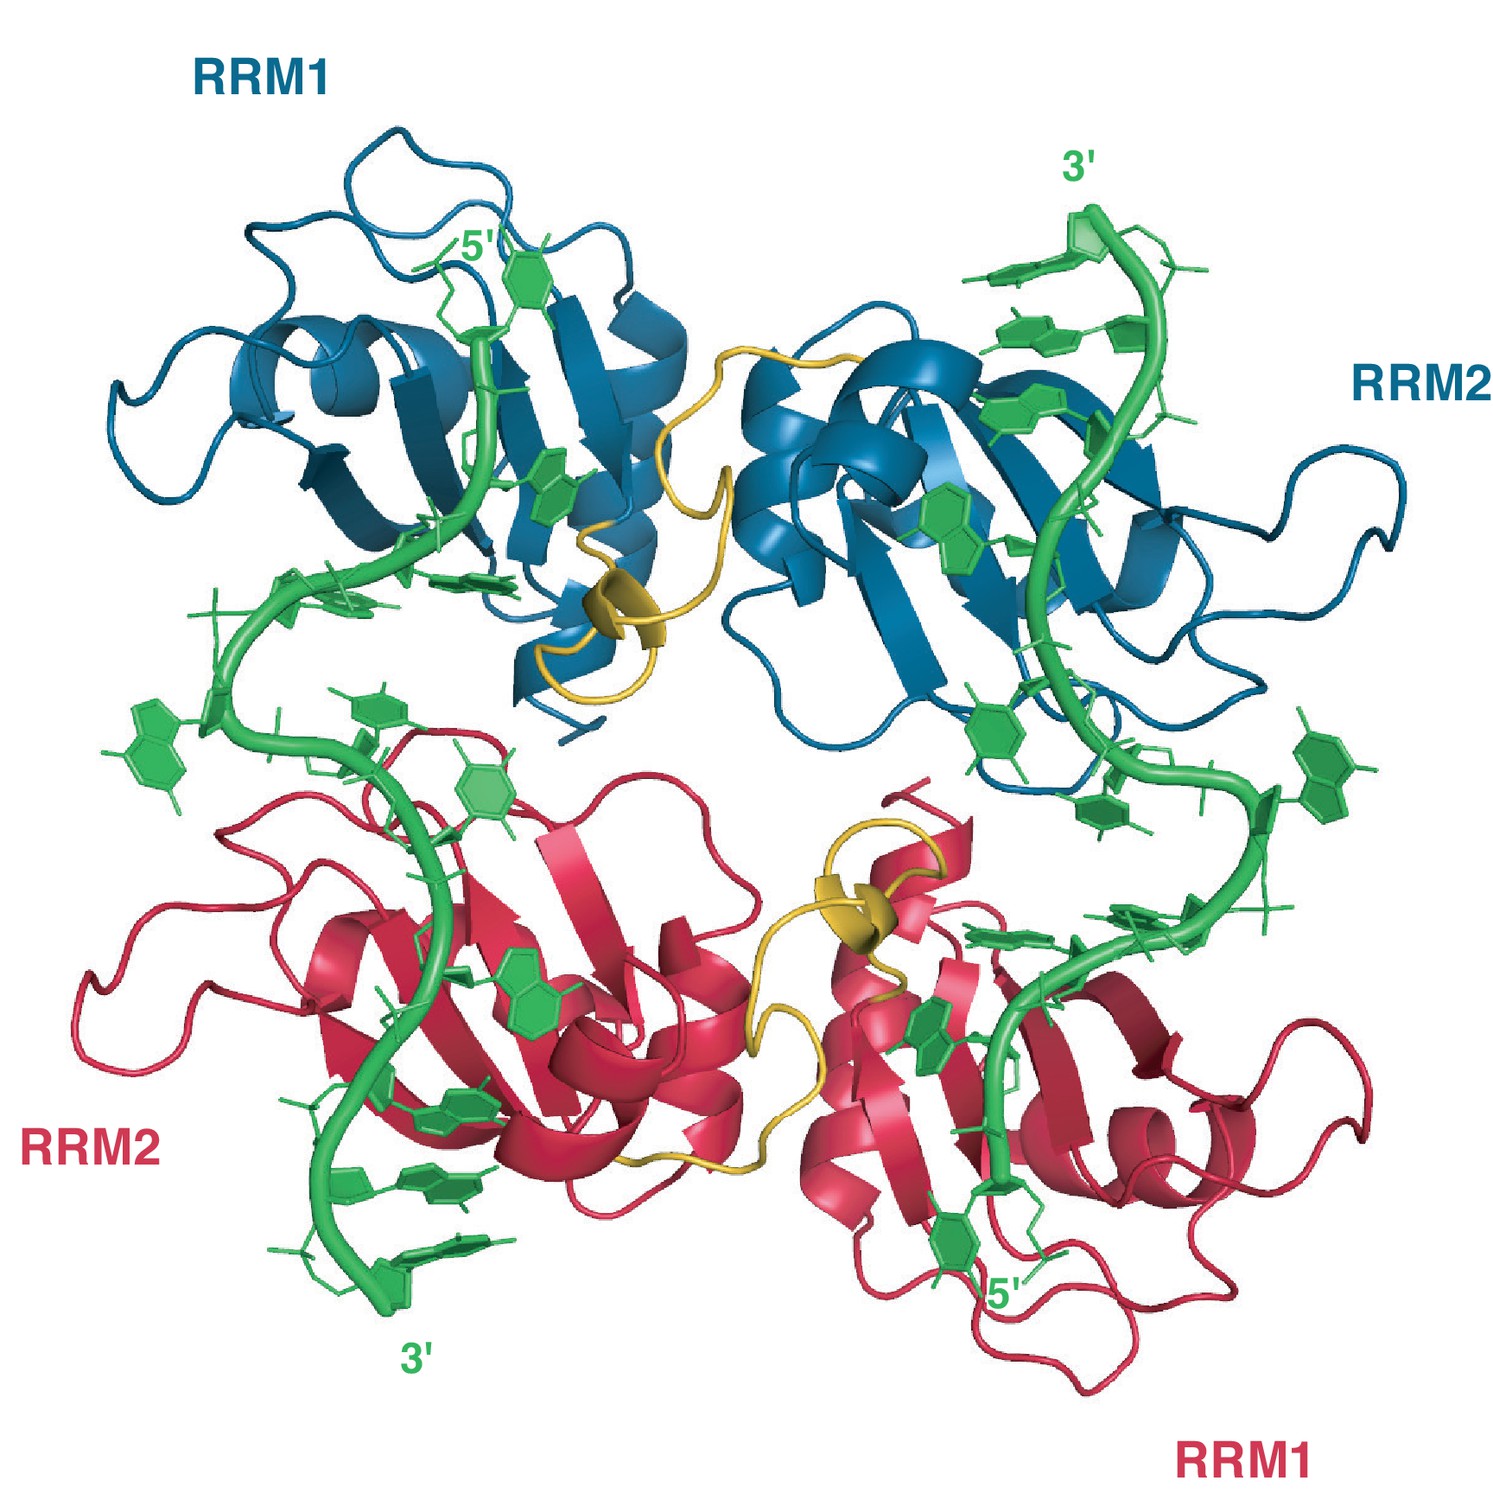
Crystallographic structure of hnRNP A1 RRMs (UP1) bound to telomeric DNA repeats.
In this structure, one single-stranded DNA molecule consisting of 2 repeats of the TTAGGG motif is bound by two distinct UP1 molecules (one in red, one in blue) that are related by a crystallographic symmetry (C2 axis pointing perpendicular to the plan of the figure). RRM1 binds the 5´ end of the DNA and RRM2 the 3´ end. The inter-RRM linker (residues 89 to 105) is in yellow. PDB ID code 2UP1 (Ding et al., 1999).
Tables
Table 1
NMR experimental restraints and structural statistics.
| RRM1+UUAGGUC | RRM2+UCAGUU | |||
|---|---|---|---|---|
| Protein | RNA | Protein | RNA | |
| Distance restraints | ||||
| Total NOE (intramolecular) | 2356 | 87 | 2083 | 59 |
| Intra-residue | 395 | 63 | 369 | 45 |
| Sequential | 609 | 24 | 450 | 14 |
| Medium range (|i-j|<5 residues) | 522 | 0 | 424 | 0 |
| Long range (|i-j|≥5 residues) | 830 | 0 | 840 | 0 |
| Hydrogen bonds (intramolecular) | 22 | 0 | 21 | 0 |
| Protein-RNA intermolecular NOE | 117 | 111 | ||
| Protein-RNA intermolecular hydrogen bonds | 2 | 2 | ||
| Distance restraints violations (mean ± s.d.) | ||||
| Number of NOE violations > 0.2 Å | 1.9 ± 1.2 | 3.1 ± 1.0 | ||
| Maximum NOE violation (Å) | 0.25 ± 0.05 | 0.27 ± 0.04 | ||
| Dihedral angle restraints | ||||
| Sugar pucker | 4 | 4 | ||
| Dihedral violations (mean ± s.d.) | ||||
| Number of dihedral violations > 5° | 0 | 0 | ||
| Maximum dihedral violation (°) | 0.04 ± 0.16 | 0.47 ± 0.86 | ||
| R.m.s.d. from mean structure (Å) | ||||
| Protein* | ||||
| Backbone | 0.40 ± 0.11 | 0.45 ± 0.08 | ||
| Heavy atoms | 0.83 ± 0.10 | 0.78 ± 0.07 | ||
| RNA† | ||||
| Heavy atoms | 0.62 ± 0.13 | 0.78 ± 0.14 | ||
| Deviation from ideal geometry (mean ± s.d.) | ||||
| Bond lengths (Å) | 0.0037 ± 0.0001 | 0.0035 ± 0.0001 | ||
| Bond angles (°) | 0.51 ± 0.02 | 0.49 ± 0.01 | ||
| Impropers (°) | 1.13 ± 0.09 | 1.22 ± 0.06 | ||
| Ramachandran analysis | ||||
| Most favored region | 85.9% | 83.1% | ||
| Allowed region | 13.6% | 16.6% | ||
| Disallowed region | 0.5% | 0.2% | ||
| CING Red/Orange/Green scores | ||||
| R/O/G (%) | 18/28/54 | 21/25/54 | ||
-
*Protein r.m.s.d. was calculated using residues 11–92 for RRM1 and 103–112, 115–139, 144–187 for RRM2;
-
†RNA r.m.s.d. was calculated using residues 2–5 for RNA bound to RRM1 and 2–4 for the RNA bound to RRM2.
Table 2
Evaluation of residues involved in RNA recognition.
| RRM1 + 5´-UUAGGUC-3´ | |||
|---|---|---|---|
| RRM1 | Kd (nM) | Affinity loss | N |
| wild-type | 292 ± 17 | 1 | 0.93 ± 0.05 |
| 288 ± 16 | 0.99 ± 0.05 | ||
| F23A | 225 ± 13 | 0.7 | 1.07 ± 0.05 |
| 193 ± 11 | 0.98 ± 0.05 | ||
| D42A | 787 ± 42 | 3 | 0.93 ± 0.05 |
| R55A | >10’000 | >50 | 1 |
| R92A | 1000–5000 | >5 | 1.08 ± 0.05 |
| RRM2 + 5´-UCAGUU-3´ | |||
|---|---|---|---|
| RRM2 | Kd (nM) | Affinity loss | N |
| wild-type | 541 ± 33 | 1 | 1.04 ± 0.05 |
| R140A | 1000–5000 | >2 | 1.07 ± 0.05 |
| Y167F | 513 ± 30 | ~1 | 0.99 ± 0.05 |
| E176Q | 237 ± 15 | 0.4 | 1.01 ± 0.05 |
| M186A | 1630 ± 45 | 3 | 0.96 ± 0.05 |
-
Values are reported as means ± standard error (S.E.). The uncertainties on the fitted parameters were estimated from the data spread and from the uncertainty of the protein concentration determination (5%). Kd: dissociation constant in nM. Affinity loss: ratio between Kd of the mutant and Kd of the wild-type. N: number of sites.
Table 3
Evaluation of RNA specificity and affinity.
| RRM1 WT | RRM1 F23A | RRM1 D42A | RRM1 R92A | |
|---|---|---|---|---|
| UUAGGUC | 288 ± 16 (0.99 ± 0.05) | 225 ± 13 (1.07 ± 0.05) | 787 ± 42 (0.93 ± 0.05) | 1000–5000 (1.08 ± 0.05) |
| UAGGUC | 625 ± 35 (0.96 ± 0.05) | 602 ± 34 (0.91 ± 0.05) | ||
| UUUUAGGUC | 159 ± 9 (0.90 ± 0.05) | 130 ± 8 (0.91 ± 0.05) | ||
| UCAGGUC | 543 ± 33 (0.90 ± 0.05) | |||
| UUAGUU | 3000–9000 (0.97 ± 0.05) | 1000–5000 (1.07 ± 0.05) | >10’000 (1) | |
| UCAGUU | >10’000 (1) | |||
| UAAGUU | 3000–9000 (0.97 ± 0.05) | |||
| UGAGUU | 3000–9000 (0.99 ± 0.05) |
| RRM2 WT | RRM2 R140A | RRM2 E176Q | RRM2 Y167F | RRM2 M186A | |
|---|---|---|---|---|---|
| UCAGUU | 541 ± 33 (1.04 ± 0.05) | 1000–5’000 (1.07 ± 0.05) | 237 ± 15 (1.01 ± 0.05) | 513 ± 30 (0.99 ± 0.05) | 1630 ± 45 (0.96 ± 0.05) |
| UUAGUU | 125 ± 9 (1.04 ± 0.05) | 433 ± 26 (1.10 ± 0.05) | 286 ± 12 (0.99 ± 0.05) | 118 ± 9 (0.95 ± 0.05) | 253 ± 15 (1.00 ± 0.05) |
| UUAGGUC | 64 ± 8 (1.09 ± 0.05) | 195 ± 12 (1.01 ± 0.05) | 116 ± 39 (1.01 ± 0.05) | ||
| UCAGGUC | 129 ± 11 (1.01 ± 0.05) | 862 ± 47 (0.92 ± 0.05) | 132 ± 29 (0.93 ± 0.05) | ||
| UAAGUU | 543 ± 31 (1.04 ± 0.05) | 1000–5’000 (0.97 ± 0.05) | 429 ± 27 (0.94 ± 0.05) | ||
| UGAGUU | 546 ± 31 (0.93 ± 0.05) | 1000–5’000 (1) | 324 ± 20 (1.01 ± 0.05) | ||
| UAGGUC | 98 ± 8 (1.01 ± 0.05) | 685 ± 40 (1.01 ± 0.05) | 227 ± 14 (1.07 ± 0.05) |
-
Dissociation constant (Kd) for RRM1 and RRM2 wild-type and mutants, respectively. Values are reported as means ± standard error (S.E.). The uncertainties on the fitted parameters were estimated from the data spread and from the uncertainties of the protein concentration determination (5%). A dissociation constant range instead of a value is given where no sufficient saturation could be reached for the measurement conditions. The dissociation constants are given in nM. The number of sites N is given in parenthesis.
-
Table 3—source data 1
ITC data for evaluation of RNA specificity and affinity of the RRMs of hnRNP A1.
- https://doi.org/10.7554/eLife.25736.011
Table 4
Isolated RRMs compared with RRMs in the context of UP1.
| UP1 R1r2 | RRM1 | UP1 r1R2 | RRM2 | |||||
|---|---|---|---|---|---|---|---|---|
| Kd (nM) | N | Kd (nM) | N | Kd (nM) | N | Kd (nM) | N | |
| UUAGGUC | 47 ± 2 | 1.02 ± 0.05 | 288 ± 16 | 0.99 ± 0.05 | 56 ± 4 | 1.02 ± 0.05 | 64 ± 8 | 1.09 ± 0.05 |
| UCAGGUC | 171 ± 12 | 0.97 ± 0.05 | 543 ± 33 | 0.90 ± 0.05 | 178 ± 11 | 0.90 ± 0.05 | 129 ± 11 | 1.01 ± 0.05 |
| UUAGUU | 105 ± 8 | 1.05 ± 0.05 | 3000–9000 | 0.97 ± 0.05 | 142 ± 9 | 0.99 ± 0.05 | 125 ± 9 | 1.04 ± 0.05 |
| UCAGUU | 578 ± 40 | 1.11 ± 0.05 | >10’000 | 1 | 637 ± 39 | 1.05 ± 0.05 | 541 ± 33 | 1.04 ± 0.05 |
| UAAGUU | 658 ± 44 | 1.05 ± 0.05 | 3000–9000 | 0.97 ± 0.05 | 685 ± 42 | 1.01 ± 0.05 | 543 ± 31 | 1.04 ± 0.05 |
| UGAGUU | 654 ± 50 | 1.09 ± 0.05 | 3000–9000 | 0.99 ± 0.05 | 625 ± 41 | 1.04 ± 0.05 | 546 ± 31 | 0.93 ± 0.05 |
-
Values are reported as means ± standard error (S.E.). The uncertainties on the fitted parameters were estimated from the data spread and from the uncertainty of the protein concentration determination (5%). A Kd range instead of a value is given where no sufficient saturation could be reached for the measurement conditions. Kd: dissociation constant in nM. N: number of sites.
-
Table 4—source data 1
ITC measurements of protein variants with 5´-UUAGUU-3´.
- https://doi.org/10.7554/eLife.25736.013
-
Table 4—source data 2
ITC data for evaluation of RNA specificity and affinity of the RRMs of hnRNP A1 in the context of UP1.
- https://doi.org/10.7554/eLife.25736.014
Appendix 1—table 1
Sequences of the RNA oligonucleotides for which NMR titrations with either RRM1 or RRM2 have been performed and the corresponding NMR exchange regime.
| RNAs tested with RRM1 | RNAs tested with RRM2 | ||||
|---|---|---|---|---|---|
| Sequence | Number of nucl. | Exchange regime | Sequence | Number of nucl. | Exchange regime |
| UUAGGUC | 7 nt | slow | UUAGGUC | 7 nt | fast |
| UUAGGGA | 7 nt | fast | UUAGGGA | 7 nt | fast |
| CAGCAU | 6 nt | fast | CAGCAU | 6 nt | fast |
| UGAAAGU | 7 nt | fast | UGAAAGU | 7 nt | fast |
| UCAGGUC | 7 nt | fast | UCAGGUC | 7 nt | fast |
| UCAGUU | 6 nt | fast | UCAGUU | 6 nt | slow |
| UUUUAGGU | 8 nt | intermediate | UCAGGG | 6 nt | fast |
| CGUAGGU | 7 nt | intermediate | UUAGUU | 6 nt | intermediate |
| UAGGUC | 6 nt | fast | UAGGUC | 6 nt | fast |
Appendix 2—table 1
Summary of the assigned proton chemical shifts of the ISS-N1-u25g RNA bound to UP1-R140A protein variant (at 303 K). Nucleotides with partial or complete assignment are in bold letters in the following sequence: 5´-GGACCAGCAUUAUGAAAGGGA-3´.
| Nucleotide | Atom | Chemical shift (ppm) |
|---|---|---|
| CYT11 | H1´ H5 H6 | 5.74 5.87 7.78 |
| ADE12 | H1´ H2 H8 | 6.02 8.04 8.19 |
| GUA13 | H1´ H8 | 5.78 7.69 |
| ADE21 | H1´ H2 H8 | 5.87 8.04 8.28 |
| ADE22 | H1´ H2 H8 | 6.15 8.03 8.47 |
| ADE23 | H1´ H2 H5´/H5´´ H8´ | 6.08 8.42 2.92/3.68 8.18 |
| GUA24 | H1´ H2´ H3´ H4´ H8 | 6.42 5.86 5.09 4.59 8.78 |
| GUA25 | H1´ H8 | 5.69 7.95 |
| GUA26 | H1´ H8 | 5.66 7.41 |
| ADE27 | H1´ H2 H8 | 5.90 8.02 8.14 |
Appendix 2—table 2
Summary of the assigned intermolecular-NOE between the ISS-N1-u25g RNA and the UP1-R140A protein variant. These NOEs were observed in the 2D 13C F2-filtered (1H,1H)-NOESY or the 3D 13C F1-edited, F3-filtered [1H; 13C; 1H] NOESY-HSQC or in both spectra. The intensity of the reported intermolecular-NOE peaks are classified regarding their signal/noise ratio as follows: - weak: 7 ≤ S/N <12 - middle: 12 ≤ S/N <25 - strong: 25 ≤ S/N <45 - very strong: 45 ≤ S/N.
| Nucleotide | Atom | Protein residue and atom | Intensity of inter-NOE |
|---|---|---|---|
| CYT11 | H1´ | F108QE F108HZ F148QD | weak weak middle |
| H5 | E176HB2 E176HB3 E176QG R178QD | middle middle strong middle | |
| ADE12 | H1´ | F108QE M137QE F148QD F148QE F148HZ F150QD F150QE A180QB L181QD1 L181QD2 K183QB K183QG K183QE | weak middle middle middle middle middle middle middle weak weak weak weak middle |
| H2 | R178QD A180QB L181QD1 L181QD2 | strong strong strong very strong | |
| H8 | F108QE E176HB2 E176HB3 E176QG R178QD A180QB L181QD1 L181QD2 | weak middle middle strong strong strong middle very strong | |
| GUA13 | H1´ | M137QE F148QE F150QE | very strong weak weak |
| H8 | K106QE M137HG2 M137QE F148QE F150QE K183QE | weak middle strong weak weak middle | |
| ADE22 | H1´ | F17QE G19HA3 F57HB2 F57HB3 F57QD | very strong weak weak weak strong |
| H8 | F17QE | weak | |
| ADE23 | H1´ | F17QE F17HZ M46QE F57HZ F59QE F59HZ | middle middle middle middle middle middle |
| H2 | F17HZ M46QE F59HB2 F59HB3 F59QD F59QE A89HA A89QB V90HB | strong middle middle middle strong strong middle very strong middle | |
| H8 | F17QD F17QE | middle middle | |
| GUA24 | H1´ | M46QE F59QE | very strong weak |
| H2´ | M46QE F59QE F59HZ | very strong middle middle | |
| H3´ | M46QE F57HZ F59QD F59HZ | very strong middle middle middle | |
| H4´ | V44QG1 M46QE | middle very strong | |
| H8 | M46QE F57QE F59QD F59QE F59HZ | very strong middle middle middle middle | |
| GUA25 | H1´ | V44HB V44QG1 V44QG2 M46QE F59QD F59HZ | middle very strong very strong very strong weak middle |
| H8 | M46QE | very strong |
Appendix 2—table 3
List of the RNAs used for in vitro structural studies and in cell splicing assays.
| ISS-N1 WT | (gga)CCAGCAUUAUGAAAGUGC/A |
|---|---|
| ISS-N1-c14g | (gga)CCAGgAUUAUGAAAGUGC |
| ISS-N1-u25g | (gga)CCAGCAUUAUGAAAGgGC |
| ISS-N1-14g25g | (gga)CCAGgAUUAUGAAAGgGC |
| ISS-N1-g13a | CCAaCAUUAUGAAAGUGA |
| ISS-N1-g24a | CCAGCAUUAUGAAAaUGA |
| ISS-N1-13a24a | CCAaCAUUAUGAAAaUGA |
| ISS-N1 −2 | CCAGCAUUA-AAAGUGA |
| ISS-N1 −4 | CCAGCAU-AAAGUGA |
| ISS-N1 −6 | CCAGCA-AAGUGA |
| ISS-N1 −8 | CCAGC-AGUGA |
Download links
A two-part list of links to download the article, or parts of the article, in various formats.
Downloads (link to download the article as PDF)
Open citations (links to open the citations from this article in various online reference manager services)
Cite this article (links to download the citations from this article in formats compatible with various reference manager tools)
Tandem hnRNP A1 RNA recognition motifs act in concert to repress the splicing of survival motor neuron exon 7
eLife 6:e25736.
https://doi.org/10.7554/eLife.25736


