Sexual dimorphism in striatal dopaminergic responses promotes monogamy in social songbirds
- City University of New York, United States
- Weill Cornell Medicine, United States
- Graduate Center of the City University of New York, United States
- Houston Methodist Research Institute, United States
Figures
Figure 1

Delayed PET of dopamine neurotransmission in response to song stimuli.
Adult zebra finches were injected with the D2 receptor tracer [11C]raclopride. Immediately after the injection, birds were either kept for 20 min in quiet conditions or exposed to novel conspecific songs. Each bird was tested in both conditions. PET scan was performed immediately afterwards, in groups of four.
Figure 2

Song reinforcement assay.
An apparatus for testing the amount of aversive air puffs birds were willing to receive in exchange for hearing songs. Birds voluntarily perched next to a window through which they could see a video of a singing bird. Videos were presented either silently (control) or accompanied with song playbacks. When the infrared beam detected the bird perching next to the window, aversive air puffs were delivered in random (unpredictable) intervals (with a likelihood of 12.5% s).
Figure 3 with 3 supplements
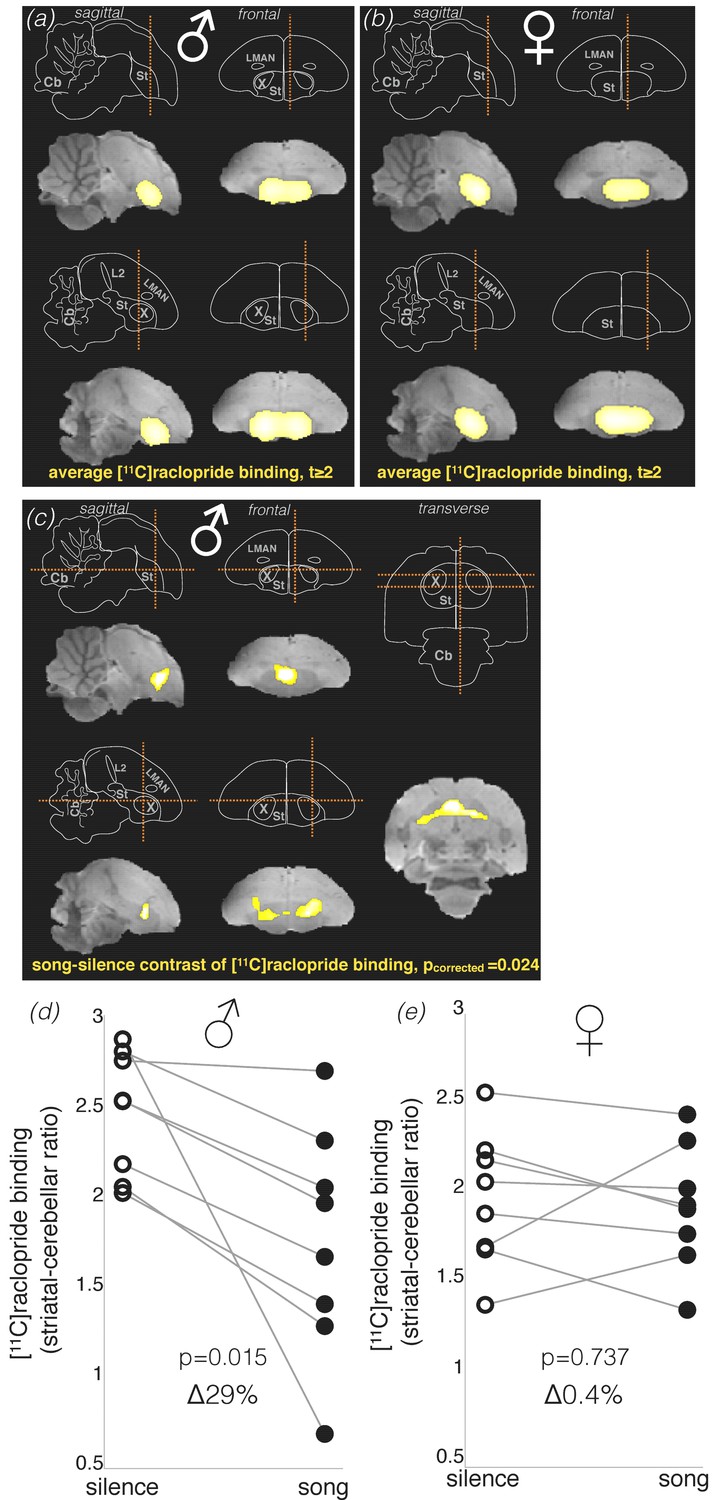
Dopamine neurotransmission in response to song stimuli in unmated males and females.
Brain schemas in (a–c) show: cerebellum (Cb), auditory field L (L2), striatum (St), and song control nuclei Area X (X) and lateral magnocellular nucleus of the anterior nidopallium (LMAN). Section planes are shown as dashed orange lines. (a & b) Bright yellow areas represent the Statistical Parametric Map (SPM, intensity threshold at t ≥ 2) for averaged [11C]raclopride binding potential in males (a) and females (b) (n = 8 in both groups). SPM is shown over the brain template magnetic-resonance image. In both males and females [11C]raclopride binding was restricted to the striatum. (c) SPM of the difference in dopamine neurotransmission as detected by [11C]raclopride binding in song and silence conditions in males. SMP reveals significantly lower level of [11C]raclopride binding in response to hearing novel conspecific songs in males (pair-wise t statistic, cluster-level pcorrected = 0.024), which indicates higher dopamine neurotransmission in this condition. Significant difference was detected in one cluster within the dorsal striatum, mostly outside Area X. (d) Analysis of individual changes in [11C]raclopride binding in males, comparing song vs. silence. (e) Same for females. As no significant cluster was found in females, males’ cluster was used as a mask to produce individual values of [11C]raclopride binding within the same area.
Figure 3—figure supplement 1
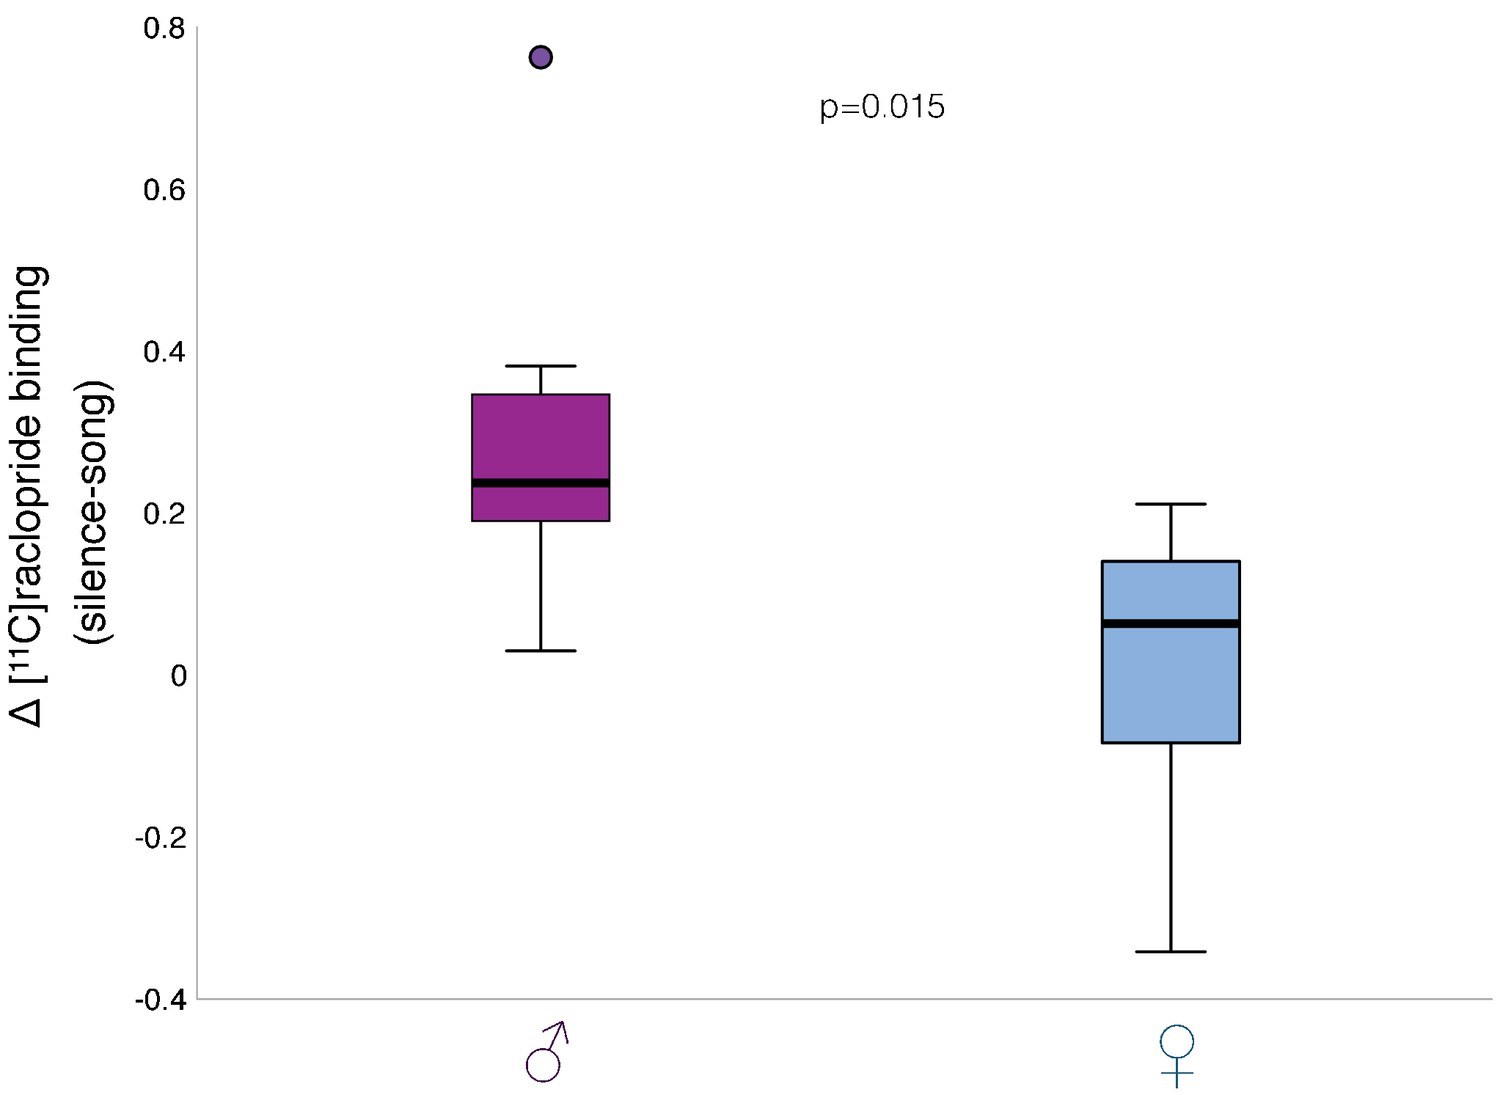
Change in dopamine neurotransmission after song playbacks in males and females.
Comparison of [11C]raclopride binding change (song-silence) values between males and females confirmed significant difference in dopamine neurotransmission between sexes further (p=0.015, t-test). Box-and-whisker plot shows median values, first and third quartiles (box), lowest and highest data within 1.5 interquartile range (whiskers), and an outlier (dot) in the male group.
Figure 3—figure supplement 2
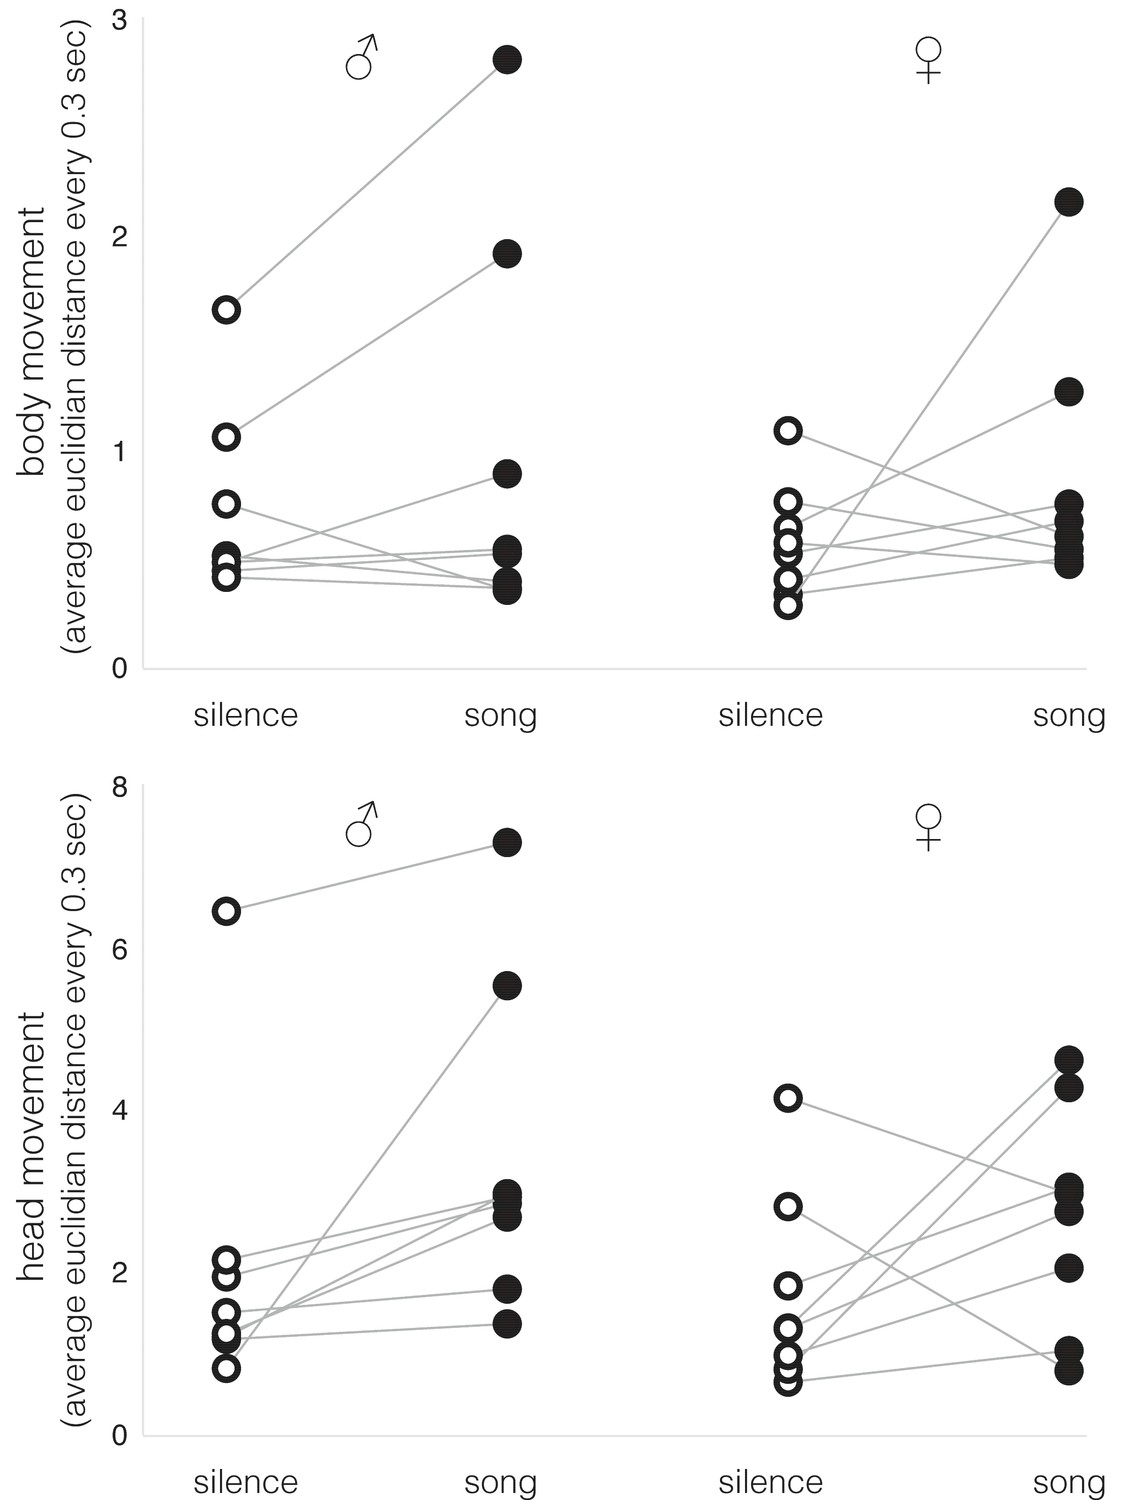
Body and head movements during song playbacks or silence in males and females.
Individual data of whole body (top) or head (bottom) movements in males and females (n = 8; see Table 1 and 2 for statistics). Average Euclidian distance every 0.3 s was measured in the video recordings.
Figure 3—figure supplement 3
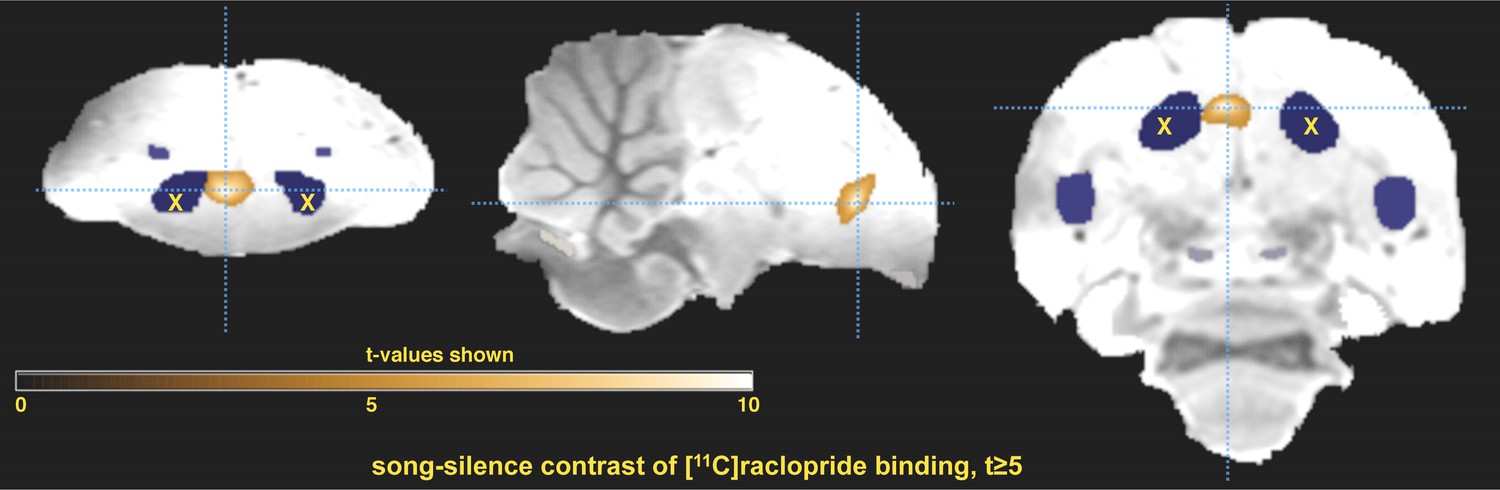
Statistic parametric map (SPM) of differential striatal [11C]raclopride binding in male zebra finches at increased threshold.
The cluster of voxels with significantly lower level of [11C]raclopride binding in males in response to hearing novel conspecific song is shown here at an increased threshold of significance compared to Figure 3 (t ≥ 5, pair-wise t statistic). The image is centered around the peak value of differential binding, dashed light-blue lines show section planes. SPM is laid over magnetic-resonance image of zebra finch brain template. Song system nuclei (shades of blue) were identified using the 3D atlas of the zebra finch brain (Poirier et al., 2008). Area X (X), the striatal component of the song system, did not overlap with the cluster of significant differential binding at this increased threshold, while the peak value appeared in the medial striatum. A frontal (left), a sagittal (middle) and a transverse (right) section are shown.
Figure 4

Song reinforcement in unmated males and females.
Rate of air puffs (per hour) birds received during song playback and silent sessions: in males (left) and females (right) (n = 8 and n = 4, respectively; p-values for paired t-test shown).
Figure 5 with 1 supplement
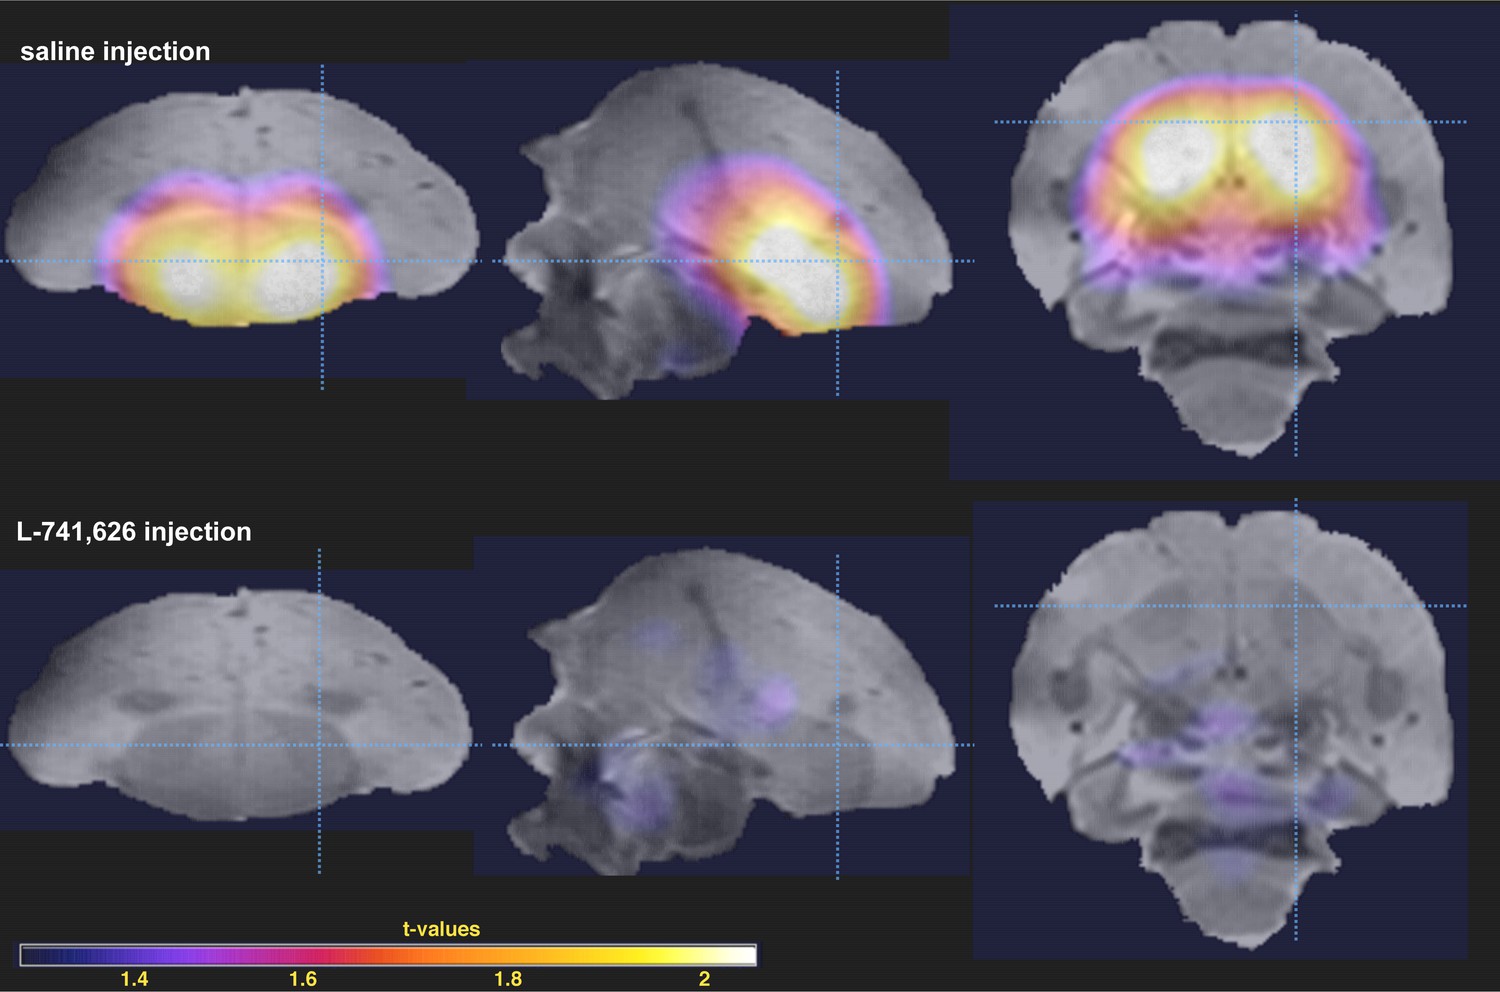
Blockage of D2 receptor binding activity by L-741,626.
Statistical parametric map of average [11C]raclopride binding is shown over the zebra finch brain template magnetic-resonance image: after saline injection (top) and L-741,626 injection (bottom) (n = 2 in both conditions; t-values on the insert). Sagittal (left), frontal (middle) and transverse (right) sections are shown; dashed light-blue lines show section planes.
Figure 5—figure supplement 1
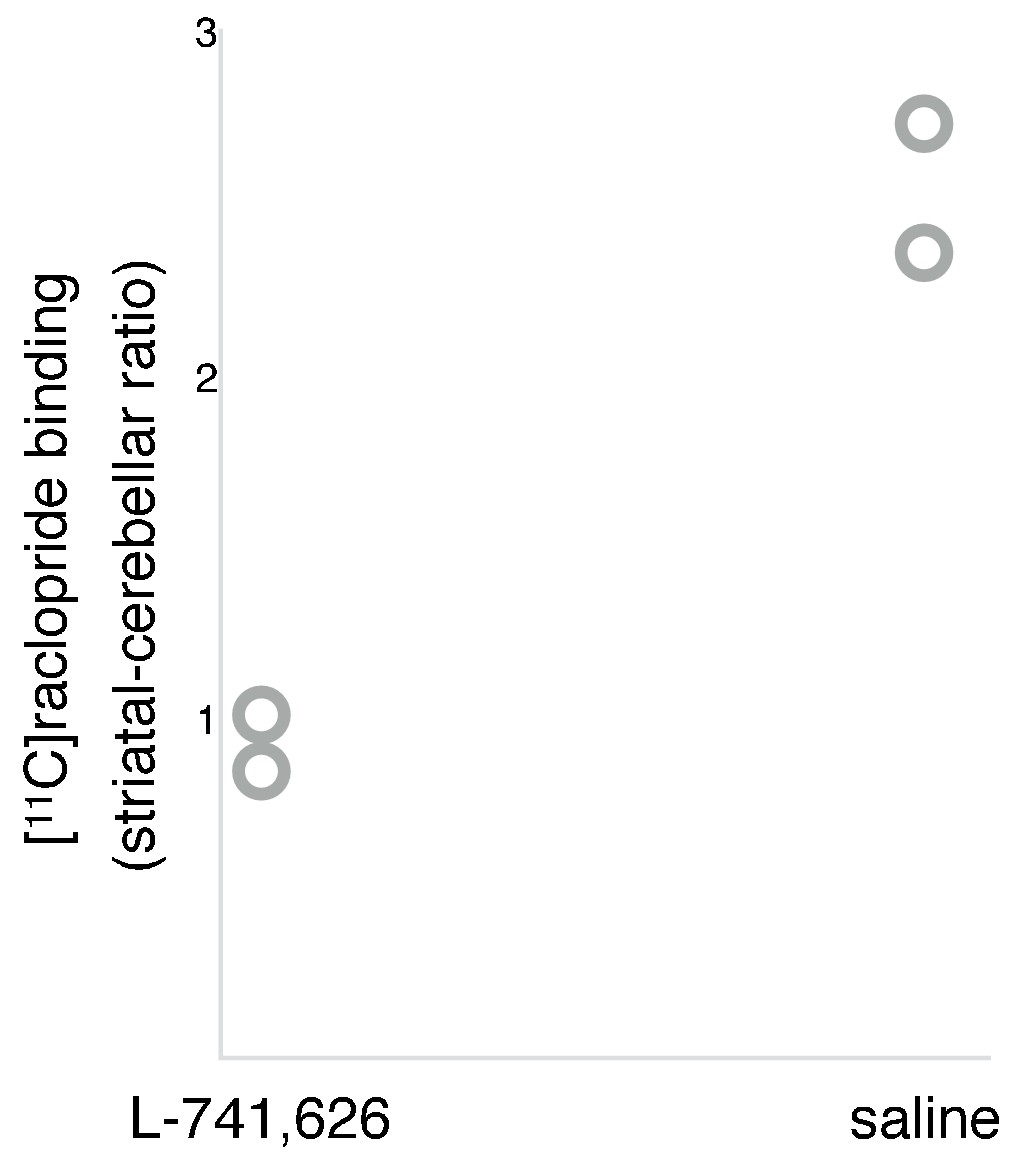
L-741,626 activity at the striatal D2 receptors in zebra finches.
Comparison of the individual values of [11C]raclopride binding potential in the striatum in two males after L-741,626 injection and two males after sham injection (saline) demonstrates high levels of L-741,626 binding to D2 receptors in the striatum.
Figure 6
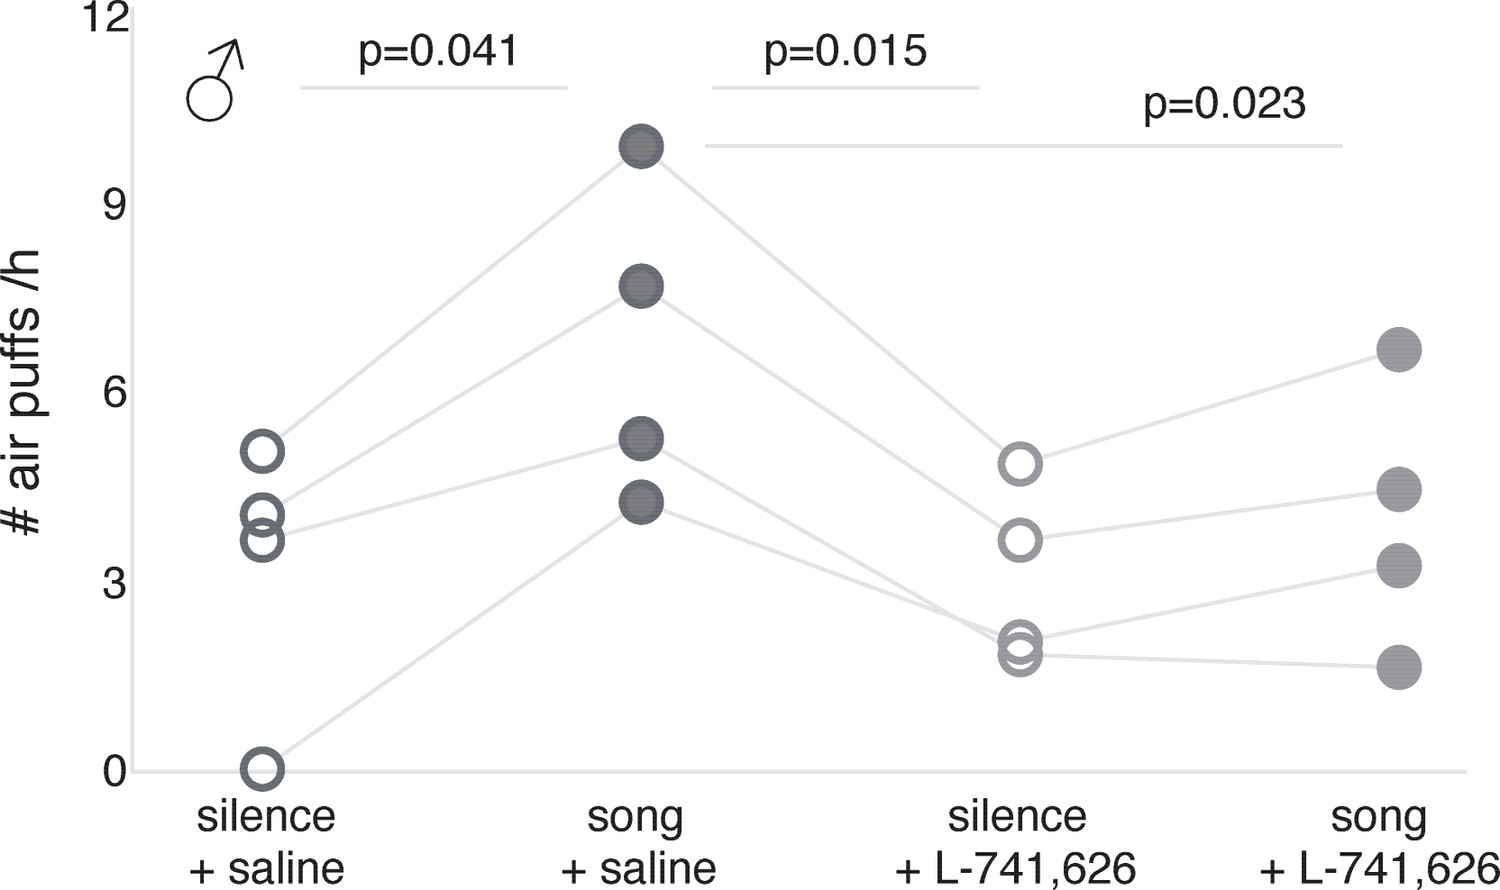
Song reinforcement after dopamine receptor blockage.
Number of air puffs (per hour) birds received during silent and song playback sessions: after saline injection (left); after L-741,626 injection (right) (n = 4; significant p-values are shown for general linear model for repeated measurements; see Table 3 for statistics).
Figure 7 with 1 supplement
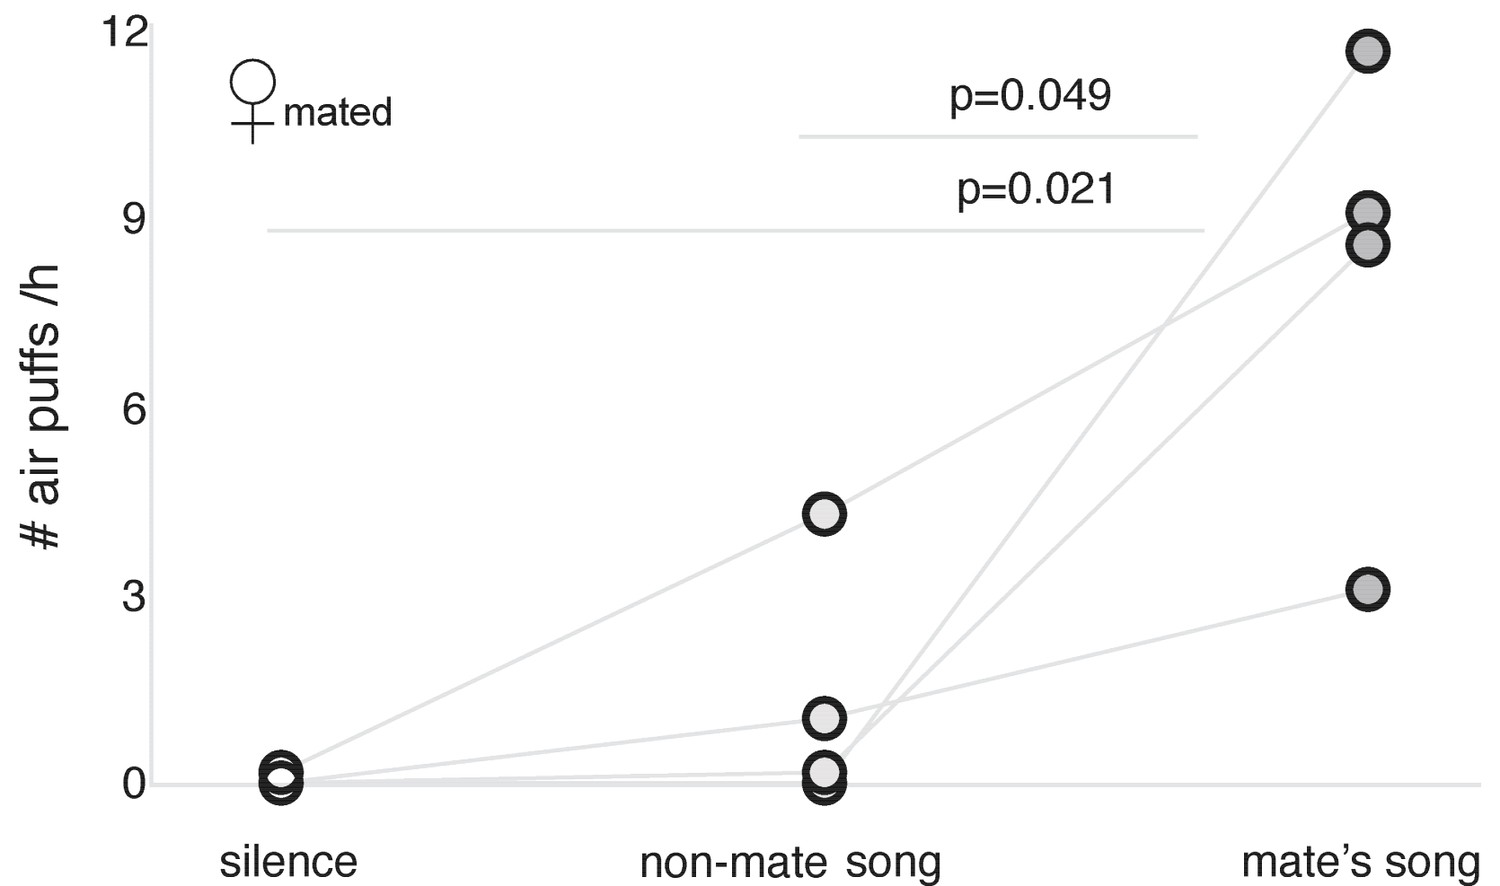
Song reinforcement in mated females.
Number of air puffs (per hour) mated females received in exchange for silence, non-mate song (from male mated with another female), and mate’s song (n = 4; significant p-values are shown for general linear model for repeated measurements; see Table 4 for statistics).
Figure 7—figure supplement 1
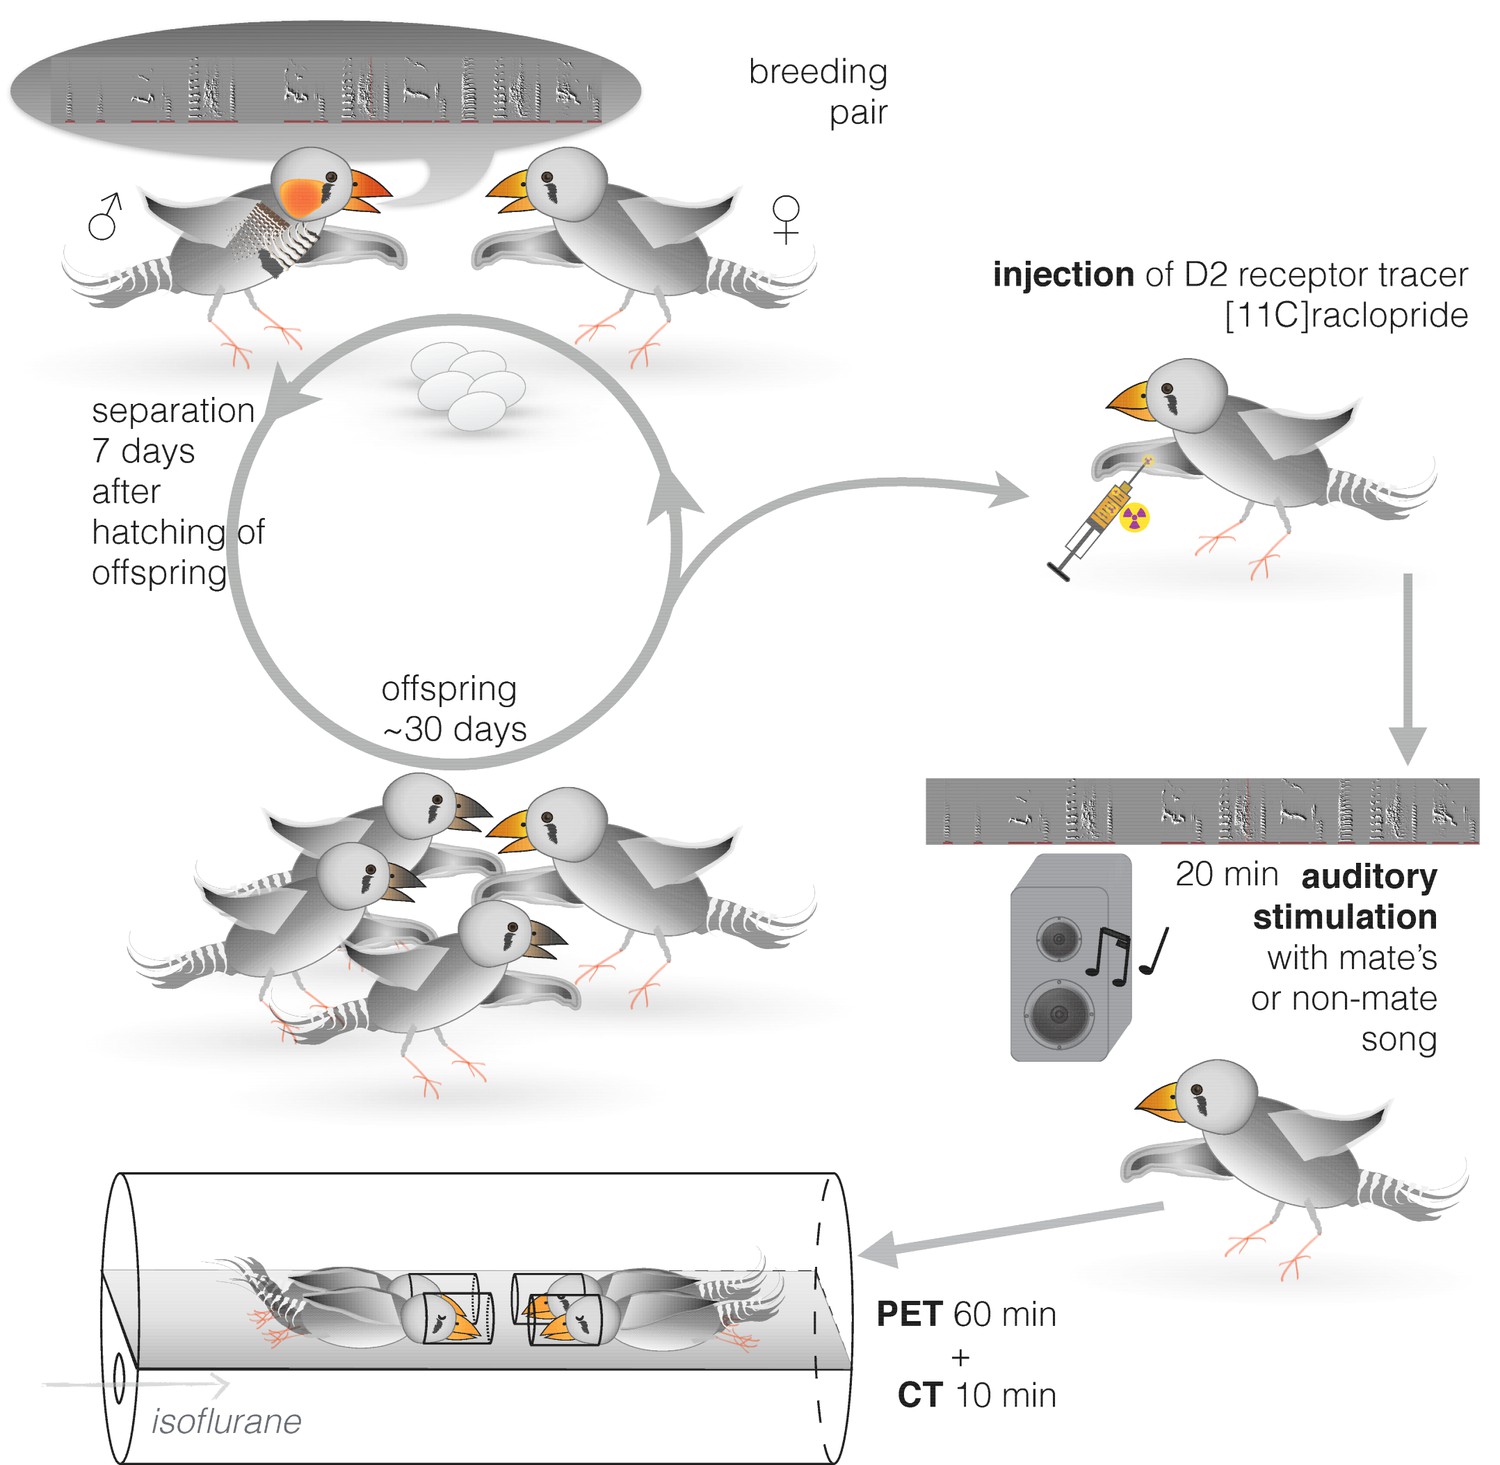
Experimental procedures for measuring dopamine neurotransmission in female zebra finches in response to their mates’ songs.
Each adult female zebra finch was paired for at least several months with a male zebra finch, with whom they produced ≥ 4 clutches of offspring, throughout synchronized breeding cycles (one pair shown, but four females were scanned at a time). In the first week after their offspring hatched, the females were kept together with their mates; then they were moved together with offspring to the nursery room, in the absence of adult males. In a regular cycle, the females were returned to their mates at 30 days after offspring’s hatching. For the experiment, we used females shortly before their return to the mates. The PET procedure was similar to the one shown in Figure 1, with the exception that here the animals were exposed to song recordings of either their mates or unfamiliar males.
Figure 8

Dopamine neurotransmission in response to song stimuli in mated females.
(a) Brain schemas as in Figure 3a,b. Statistical parametric map (SPM, intensity threshold at t ≥ 2) for average [11C]raclopride binding is shown over the zebra finch brain template magnetic-resonance image. (b) SPM of the difference in [11C]raclopride binding in response to non-mate song and mate’s song in mated females (n = 6; pair-wise t statistic, p<0.05). This cluster, however, did not survive correction for multiple comparisons (pcorrected = 0.6, paired t-test corrected for multiple comparisons). (c) Individual changes in [11C]raclopride binding in this insignificant cluster in mated females, non-mate song vs. mate’s song. Supplementary information.
Tables
Table 1
Results of statistical tests to address the differences in body movement in zebra finch males and females in different conditions: in silence or during conspecific song playbacks.
Average Euclidian distance every 0.3 s was measured in the videos for the center of body mass. Bold-face numbers indicate significance levels p≤0.05.
| Box's Test of Equality of Covariance Matrices | Box's M | F | df1 | df2 | p-value |
|---|---|---|---|---|---|
| 13.334 | 3.756 | 3 | 35280 | 0.01 |
| Multivariate Tests (Pillai’s Trace) | value | F | p-value |
|---|---|---|---|
| body movement | 0.175 | 2.968 | 0.107 |
| body movement * sex | 0.02 | 0.21 | 0.886 |
| Tests of Between-Subjects Effects | df | F | p-value |
| sex | 1 | 0.249 | 0.626 |
Table 2
Results of statistical tests to address the differences in head movement in zebra finch males and females in different conditions: in silence or during conspecific song playbacks.
Average Euclidian distance every 0.3 s was measured in the videos for the position of the beak. Bold-face numbers indicate significance levels p≤0.05.
| Box's Test of Equality of Covariance Matrices | Box's M | F | df1 | df2 | p-value |
|---|---|---|---|---|---|
| 4.004 | 1.128 | 3 | 35280 | 0.336 |
| Multivariate tests (Pillai’s Trace) | Value | F | p-value |
|---|---|---|---|
| head movement | 0.348 | 7.468 | 0.016 |
| head movement * sex | 0.016 | 0.225 | 0.643 |
| Tests of Between-Subjects Effects | df | F | p-value |
| sex | 1 | 0.598 | 0.454 |
Table 3
Results of statistical tests to address the differences in tolerance to air puffs in zebra finch males in different conditions: in silence or during conspecific song playbacks after saline injections, or same after injection of dopamine receptor antagonist L-741,626.
Bold-face numbers indicate significance levels p≤0.05.
| Mauchly's Test of Sphericity | Mauchly's W | df | χ² | p-value |
|---|---|---|---|---|
| # air puffs/h | 0.022 | 5 | 6.604 | 0.318 |
| Tests of Within-Subjects effects | df | F | p-value |
|---|---|---|---|
| # air puffs/h | 3 | 7.96 | 0.007 |
| pair-wise post-hoc LSD tests | p-value |
|---|---|
| song + saline vs silence + saline | 0.041 |
| song + saline vs silence + L-741,626 | 0.015 |
| song + saline vs song + L-741,626 | 0.023 |
| silence + saline vs silence + L-741,626 | 0.814 |
| silence + saline vs song + L-741,626 | 0.394 |
| song + L-741,626 vs silence + L-741,626 | 0.122 |
Table 4
Results of statistical tests to address the differences in tolerance to air puffs in mated zebra finch females in different conditions: in silence and during playbacks of songs of unfamiliar males or their mates.
Bold-face numbers indicate significance levels p≤0.05.
| Mauchly's Test of Sphericity | Mauchly's W | df | χ² | p-value |
|---|---|---|---|---|
| # air puffs/h | 0.484 | 2 | 1.453 | 0.484 |
| Tests of Within-Subjects Effects | df | F | p-value |
|---|---|---|---|
| # air puffs/h | 2 | 13.139 | 0.006 |
| pair-wise post-hoc LSD tests | p-value |
|---|---|
| mate’s song vs silence | 0.021 |
| mate’s song vs non-mate song | 0.049 |
| non-mate song vs silence | 0.259 |
Additional files
-
Transparent reporting form
- https://doi.org/10.7554/eLife.25819.020
Download links
A two-part list of links to download the article, or parts of the article, in various formats.
Downloads (link to download the article as PDF)
Open citations (links to open the citations from this article in various online reference manager services)
Cite this article (links to download the citations from this article in formats compatible with various reference manager tools)
Sexual dimorphism in striatal dopaminergic responses promotes monogamy in social songbirds
eLife 6:e25819.
https://doi.org/10.7554/eLife.25819


