Substrate transport and anion permeation proceed through distinct pathways in glutamate transporters
- University of Pittsburgh, United States
- National Institute of Mental Health, National Institutes of Health, United States
Figures
Figure 1 with 1 supplement
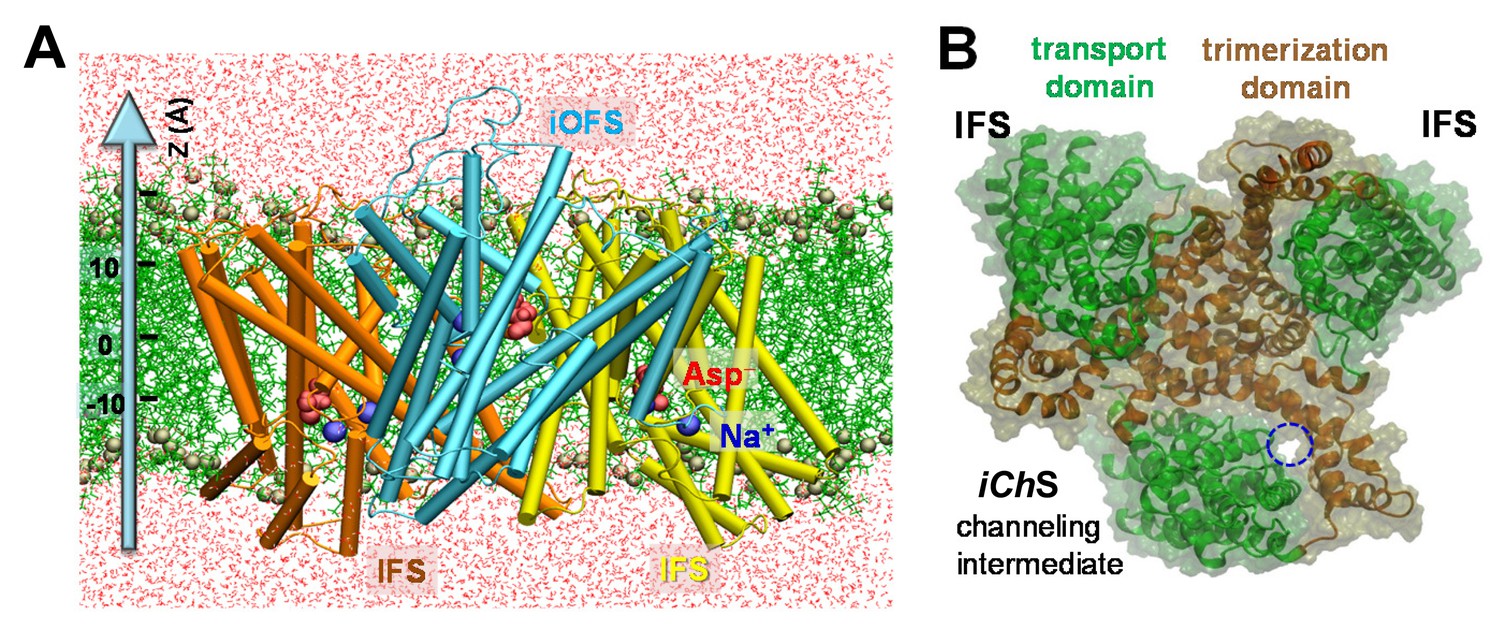
Structure of archaeal transporter GltPh and computationally predicted anion-conducting channel.
(A) Structure of GltPh that captured one of the protomers in an iOFS. The structure is embedded here into POPC membrane bilayer and solvated by 0.1 M NaCl solution (not shown). The substrates (aspartate) and co-transported Na+ ions resolved in the crystal structure are shown in red space-filling representation and blue spheres, respectively. POPC lipids are represented by green lines with their phosphorus atoms shown in tan spheres. Water molecules are shown in red dots. Z-axis directs from the intracellular to extracellular solution. (B) Top view of the GltPh trimer with one subunit in the anion-channeling state (iChS). A continuous channel (blue dashed circle) was intermittently formed as the iOFS protomer reconfigured toward the IF state.
Figure 1—figure supplement 1
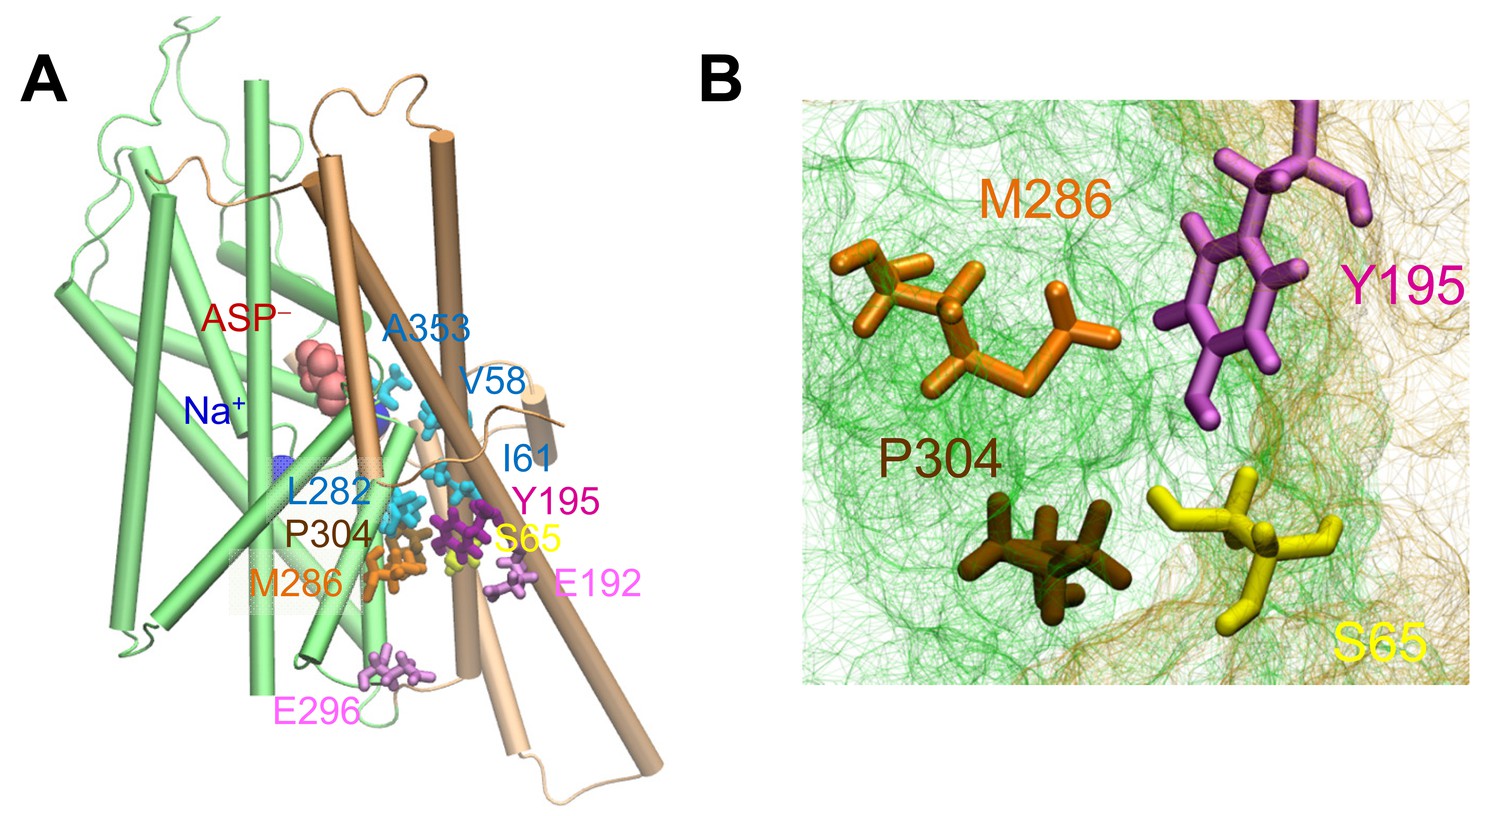
The putative anion pore proposed in the iOFS (Verdon and Boudker, 2012) shows a constriction zone near S65, Y195, M286 and P304.
(A) Side view of suggested pore-lining residues. S65, Y195, M286 and P304 are shown in yellow, purple, orange and tan sticks, respectively. Other hydrophobic residues are shown in cyan sticks, charged and polar, in pink sticks, the bound aspartate is in red space filling, and sodium ions in dark blue spheres. (B) Intracellular view of the constriction zone formed by S65, Y195, M286 and P304. Snapshot was taken from equilibrated iOFS conformer.
Figure 2 with 1 supplement
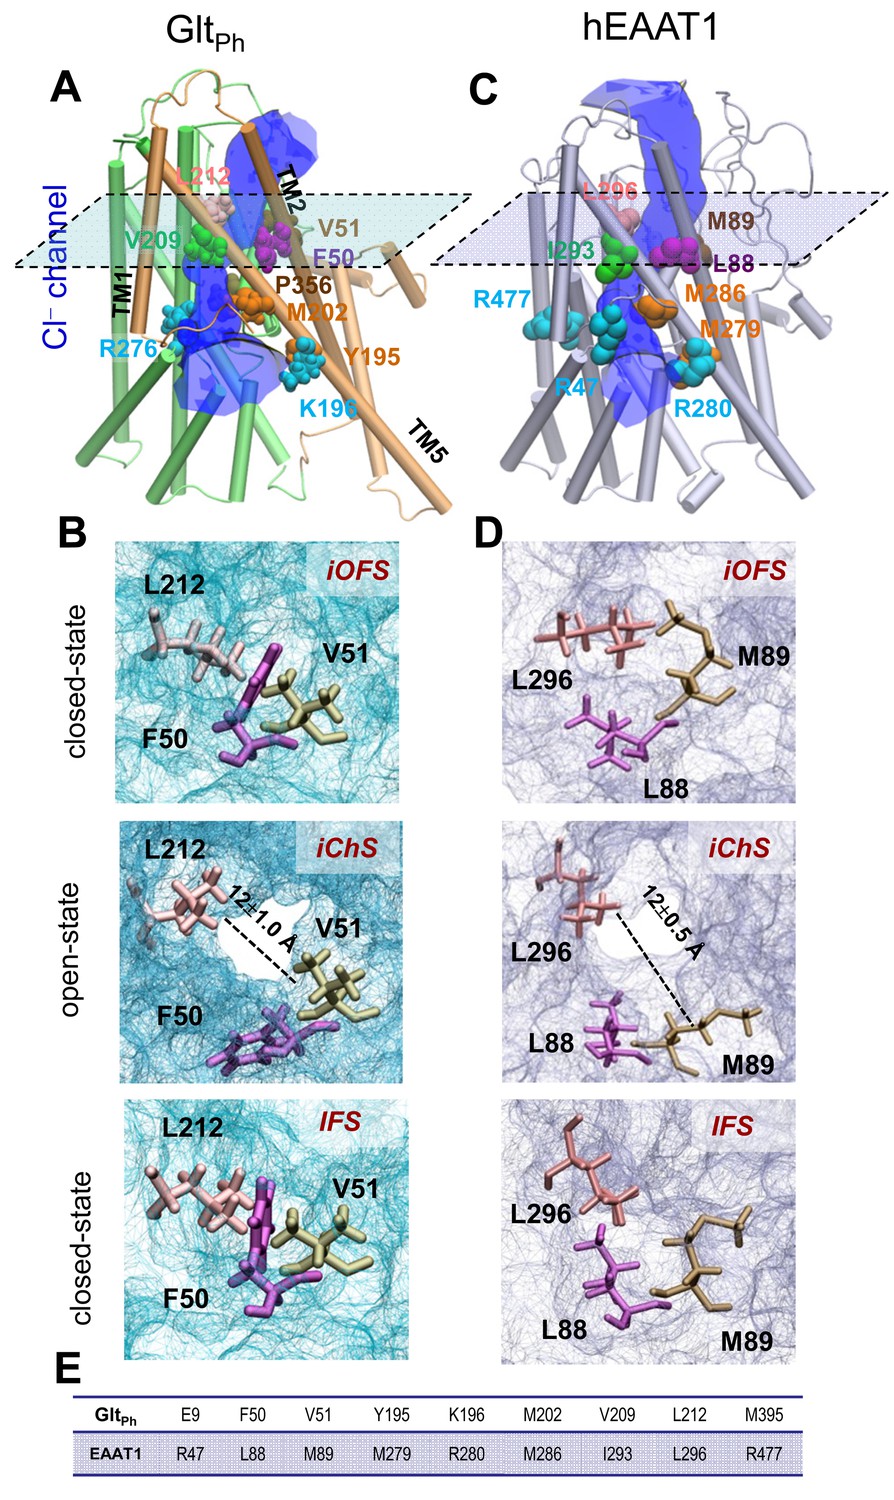
Opening of a channel upon transition of the transporter from iOFS to inward-facing state (IFS) observed for GltPh and EAAT1.
Side view of the channeling intermediate iChS in (A) GltPh and (C) EAAT1. The channel (blue) is at the interface between the transport (green) and trimerization (brown) domains. (B and D) Representation of pore forming residues in the iOFS (upper panel: closed-channel state), the iChS (middle panel: open-channel state) and the IFS (lower panel: closed-channel state) of (B) GltPh and (D) EAAT1. Note that the center-of-mass distance between L212 and V51 is increased from 7.5 ± 0.5 Å (closed-channel state) to 12.0 ± 1.0 Å (open-channel state) in GltPh; and that between L296 and M89 is increased from 7.0 ± 0.5 Å (closed-channel state) to 12.5 ± 1.0 Å (open-channel state) in EAAT1. (E) List of selected orthologous residues between EAAT1 and GltPh.
Figure 2—figure supplement 1
The hydrated channel was similarly observed in the presence of either two or three bound Na+ ions together with the substrate (aspartate in GltPh).
(A) Binding pause of Na3, stabilized after 10 ns equilibration of the iOFS conformer onto which the third Na+ ion has been docked onto GltPh, near the position revealed in the crystal structure of GltTK resolved in the presence of aspartate and three sodium ions. Na3 is coordinated by T92, S93, N310, M311 and D312. (B) Water channel (shown in semi-transparent gray CPK format) was transiently formed during the transition of the transporter from iOFS to IF state. The mechanism of transition is similar to that observed in the simulations performed with two bound Na+ ions.
Figure 3 with 1 supplement
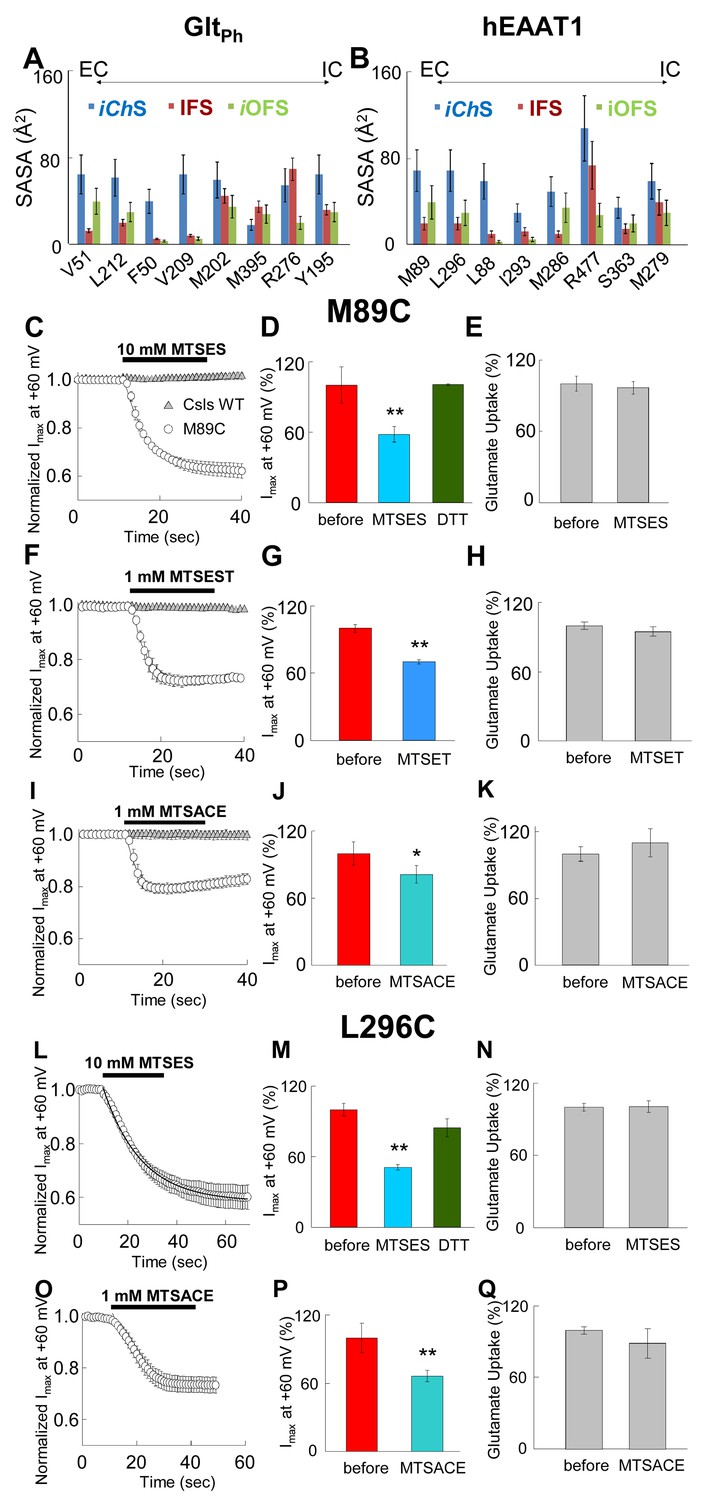
Accessibility of EAAT1 pore-forming residues to solvent and MTS-reagents.
(A–B) Representation of residue solvent-accessible surface area (SASA) for several residues predicted by our simulations to line the water accessible and chloride permeable pathway in the different conformational states: intermediate channeling (iChS, blue), inward-facing (IFS, dark red) and intermediate outward-facing (iOFS, green). The SASA was estimated for GltPh (A) and hEAAT1 (B). (C–Q) The left panels represent the averaged current amplitudes obtained at a constant pulse at +60 mV to monitor modification rates of the different MTS-reagents used (n > 4). The bars in the center panels show the current amplitude at +60 mV before (red bars) and after (different blue bars) 3 min of the application of the MTS-reagents (n > 6). For the case of MTSES (D and M), the current amplitude was measured after application of 1 mM DTT following the application of 10 mM MTSES (green bars; n > 3). The right panels show a bar graph representation of the radiolabeled glutamate uptake before and 3 min after the application of the reagents at saturating concentrations of glutamate (200 nM radiolabeled Glu- and 500 µM cold Glu-) (n > 20). Panels C) to K) represent oocytes expressing M89C, while L) to Q) represent oocytes expressing L296C. For panels C), (F) and I), the application of the MTS-reagents is compared in oocytes expressing M89C (open circles) and cysteineless (Csls) WT (grey triangles, n > 3). All modification experiments were done in at least two batches of oocytes.
Figure 3—figure supplement 1
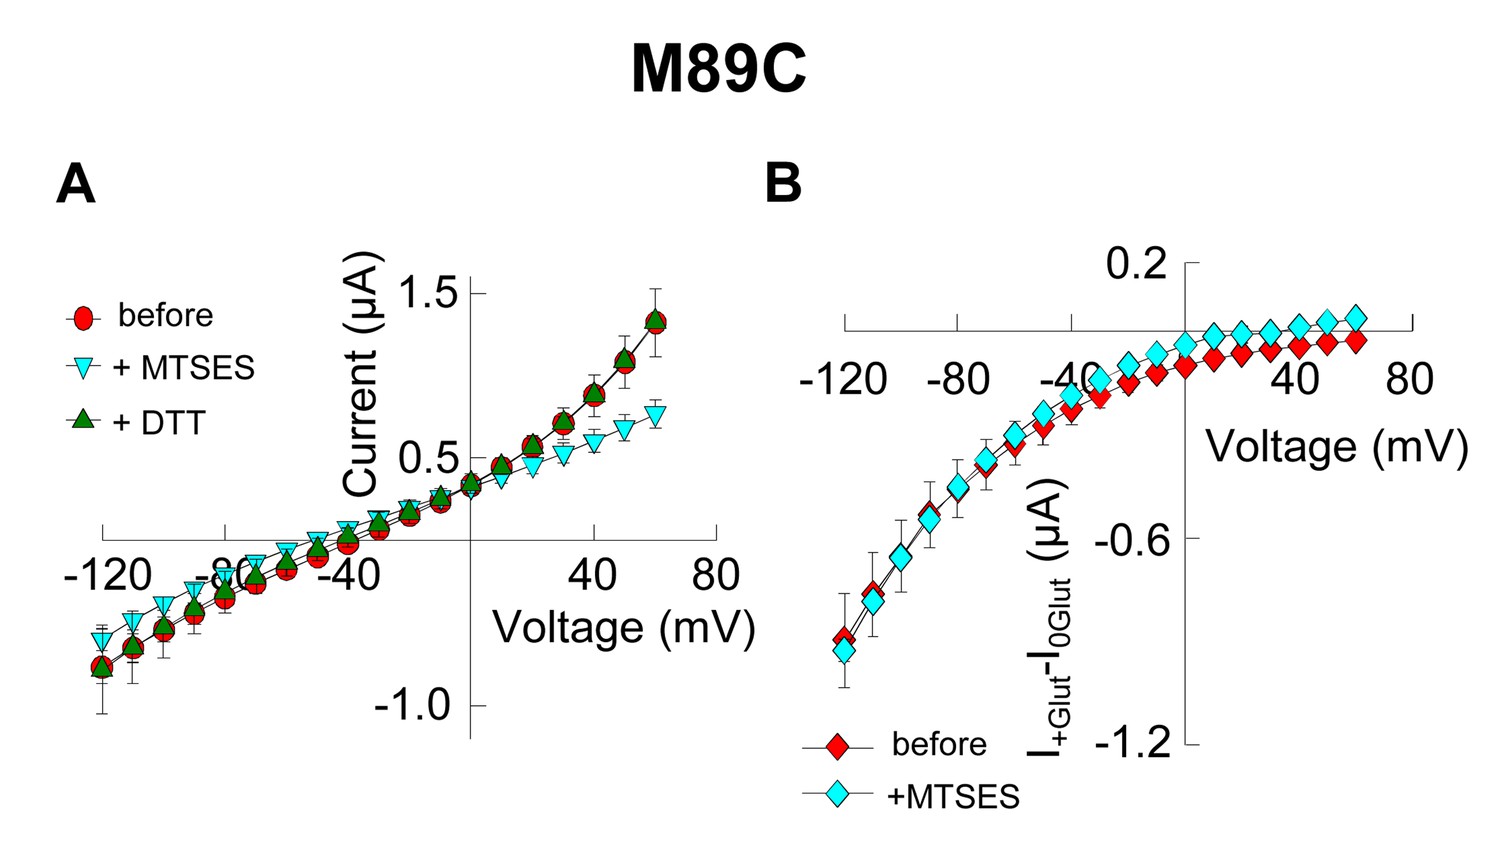
Application of 10 mM MTSES decreases anion current without affecting substrate transport.
(A) Averaged current-voltage relationship obtained from oocytes expressing the mutant M89C in a NaNO3-based solution before application (red circles), after application of 10 mM MTSES (light blue triangles) and after application of 1 mM DTT following MTSES. (B) Averaged current-voltage relationship measured in oocytes expressing M89C in a NaCl-based solution before (red diamonds) and after (light blue diamonds) application of 10 mM MTSES. The current in the absence of glutamate (I0Glut) was subtracted from the current in its presence (I+Glut) to obtain the glutamate induced current. The negligible current at +60 mV suggest that the chloride current is very small, therefore the current measured at negative potentials is mainly substrate transport current.
Figure 4
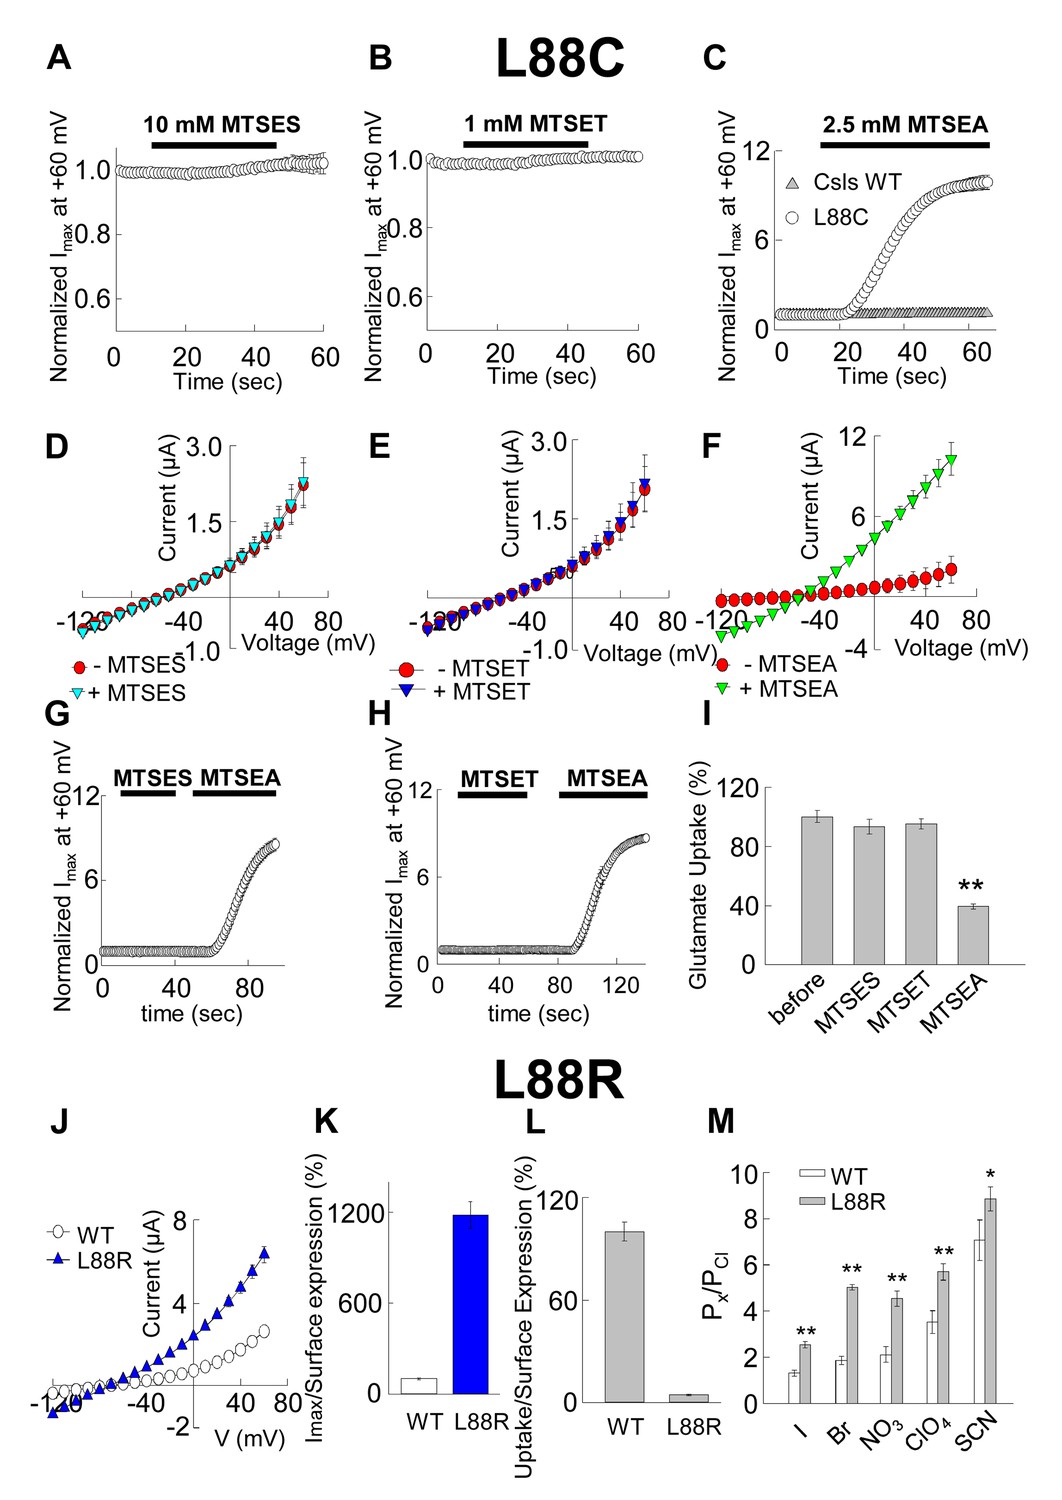
Accessibility and permeation properties for EAAT1 L88.
(A–C) Averaged normalized current amplitude measured at constant voltage (+60 mV) in oocytes-expressing L88C. The voltage pulse was continuously applied at 1 s intervals to monitor the effect of the application of 10 mM MTSES (A, n = 4), 1 mM MTSET (B, n = 4) or 2.5 mM MTSEA (C, n = 6) on the anion conductance. The black horizontal bar represents the application duration of MTS-reagent. Panel C shows the averaged normalized current amplitude measured in oocytes expressing Csls WT (grey triangles, n = 3) in response to an identical application of MTSEA. (D–F) Averaged current-voltage relationships measured in the same cells showed in (A–C) before (red circles) and after (green inverted triangles) application of the different MTS-reagents. (G–H) Averaged normalized current amplitude measured at a constant voltage at +60 mV in oocytes expressing L88C to monitor the modification of MTSEA after a previous application of MTSES (G) or MTSET (H). (I) Radiolabeled glutamate uptake measured in oocytes expressing L88C before and after incubation with the different MTS-reagents for the same time and under the same ionic conditions used in A–C. At least 25 oocytes were included for each group. Background radiolabeled glutamate accumulation measured in water-injected oocytes was subtracted from each group. (J) Current-voltage relationship measured in oocytes expressing WT EAAT1 (open circles, n = 10) or L88R (blue triangles, n = 12). (K) The maximum current amplitude at +60 mV from panel J was normalized by surface expression to reflect the actual difference in current amplitude. (L) The same surface expression was used to normalize radiolabeled glutamate uptake measured in oocytes-expressing WT EAAT1 (n = 20) or L88R (n = 22). For the surface expression, equal groups of 10 oocytes were used and the experiment was repeated two times in two different batches of oocytes. (M) Relative permeability ratios measured in oocytes-expressing WT EAAT1 (n = 7) or L88R (n = 8).
Figure 5 with 1 supplement
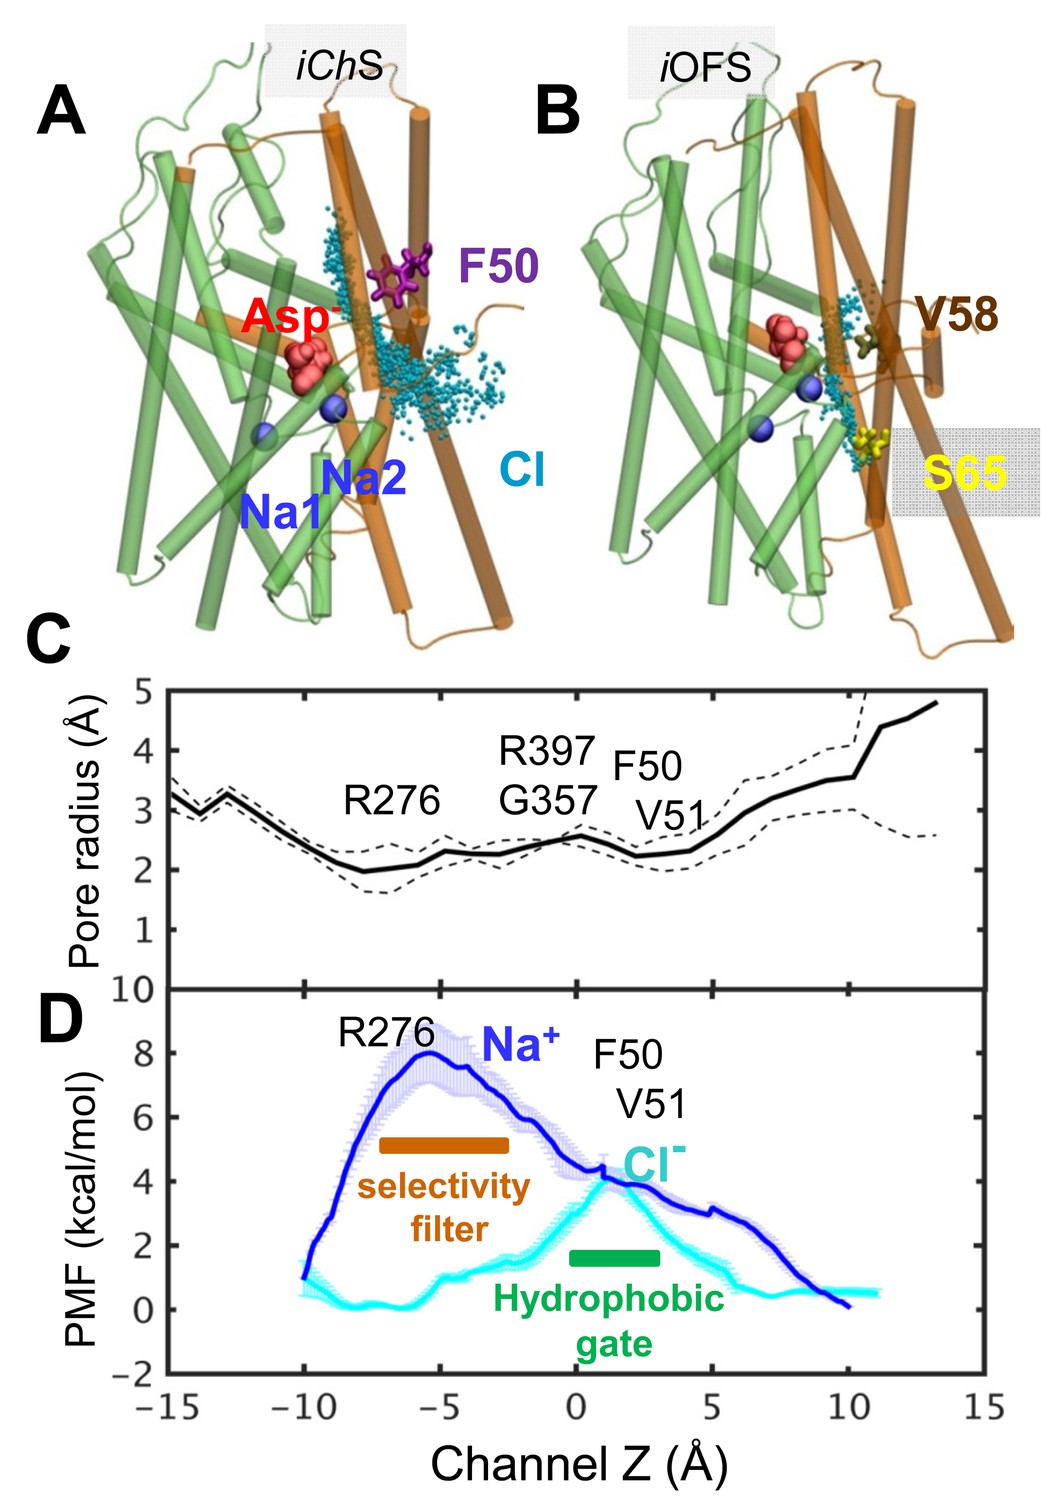
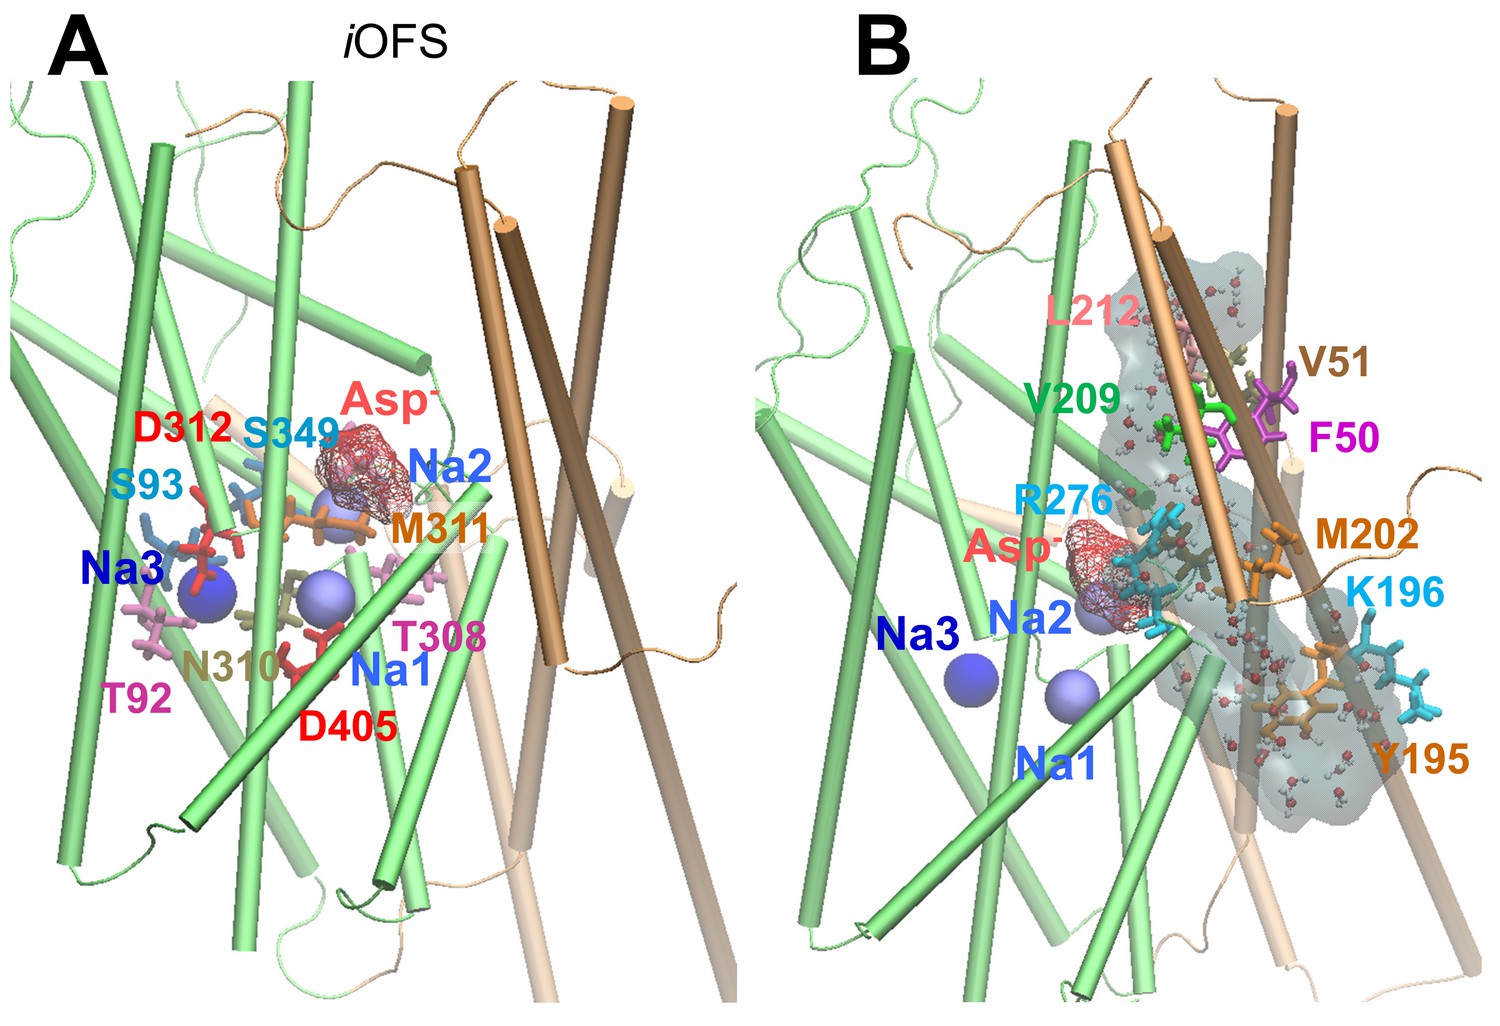
Chloride channeling pathway and its energetics.
(A) Chloride permeation trajectories (cyan points) in the iChS sampled by metadynamics performed for GltPh. The energy barrier for chloride permeation is less than 5 kcal/mol; (B) An alternative pathway lined by V58, I61 and S65, proposed earlier to serve as anion-channeling path, when the subunit in the iOFS. The energy barrier is larger than 20 kcal/mol through this path; (C) iChS channel pore radius along the z-axis, averaged out over multiple snapshots with dashed line showing the variations; and (D) potential of the mean force (PMF) for chloride (cyan curve) and sodium (blue curve) transport through the hydrated channel of the subunit in the iChS, calculated by adaptive biasing force (ABF) method (Chipot and Hénin, 2005). The channel selectivity filter resides near the IC entrance (i.e. R276), and the potential channel gate is near the EC entrance formed by hydrophobic residues F50, V51 and L212 (see Figure 2).
Figure 5—figure supplement 1
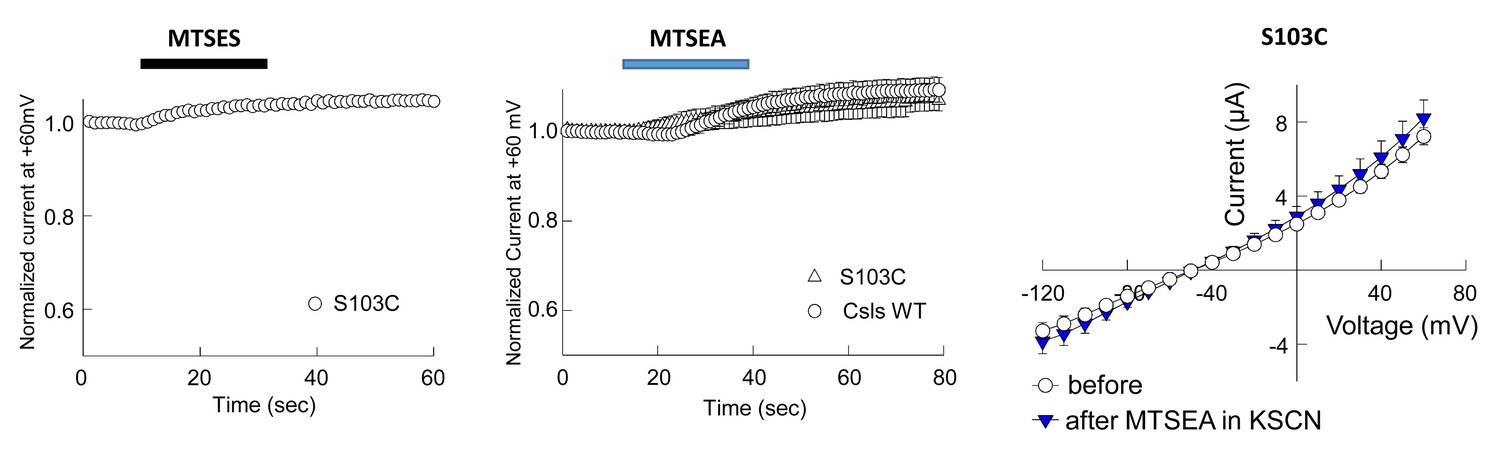
Application of 10 mM MTSES or 2.5 mM MTSEA did not modify anion current amplitudes in EAAT1 S103C (homologous to S65 in GltPh).
(A–B) Averaged normalized current amplitudes at +60 mV in oocytes-expressing EAAT1 S103C (n > 3) or EAAT1 Csls WT (n = 3) before and during the application of 10 mM MTSES (A) or 2.5 mM of MTSEA (B). (C) Averaged current-voltage relationship measured in oocytes-expressing EAAT1 S103C before (open circles, n = 5) and after application (blue triangles) of 2.5 mM MTSEA in the presence of 50 mM KSCN, which is expected to favor and inward facing conformations and therefore to increase the accessibility of intracellularly exposed residues like S103. We did not observe any effect on the anion current amplitudes in oocytes-expressing EAAT1 S103C in any of the tested conditions.
Figure 6
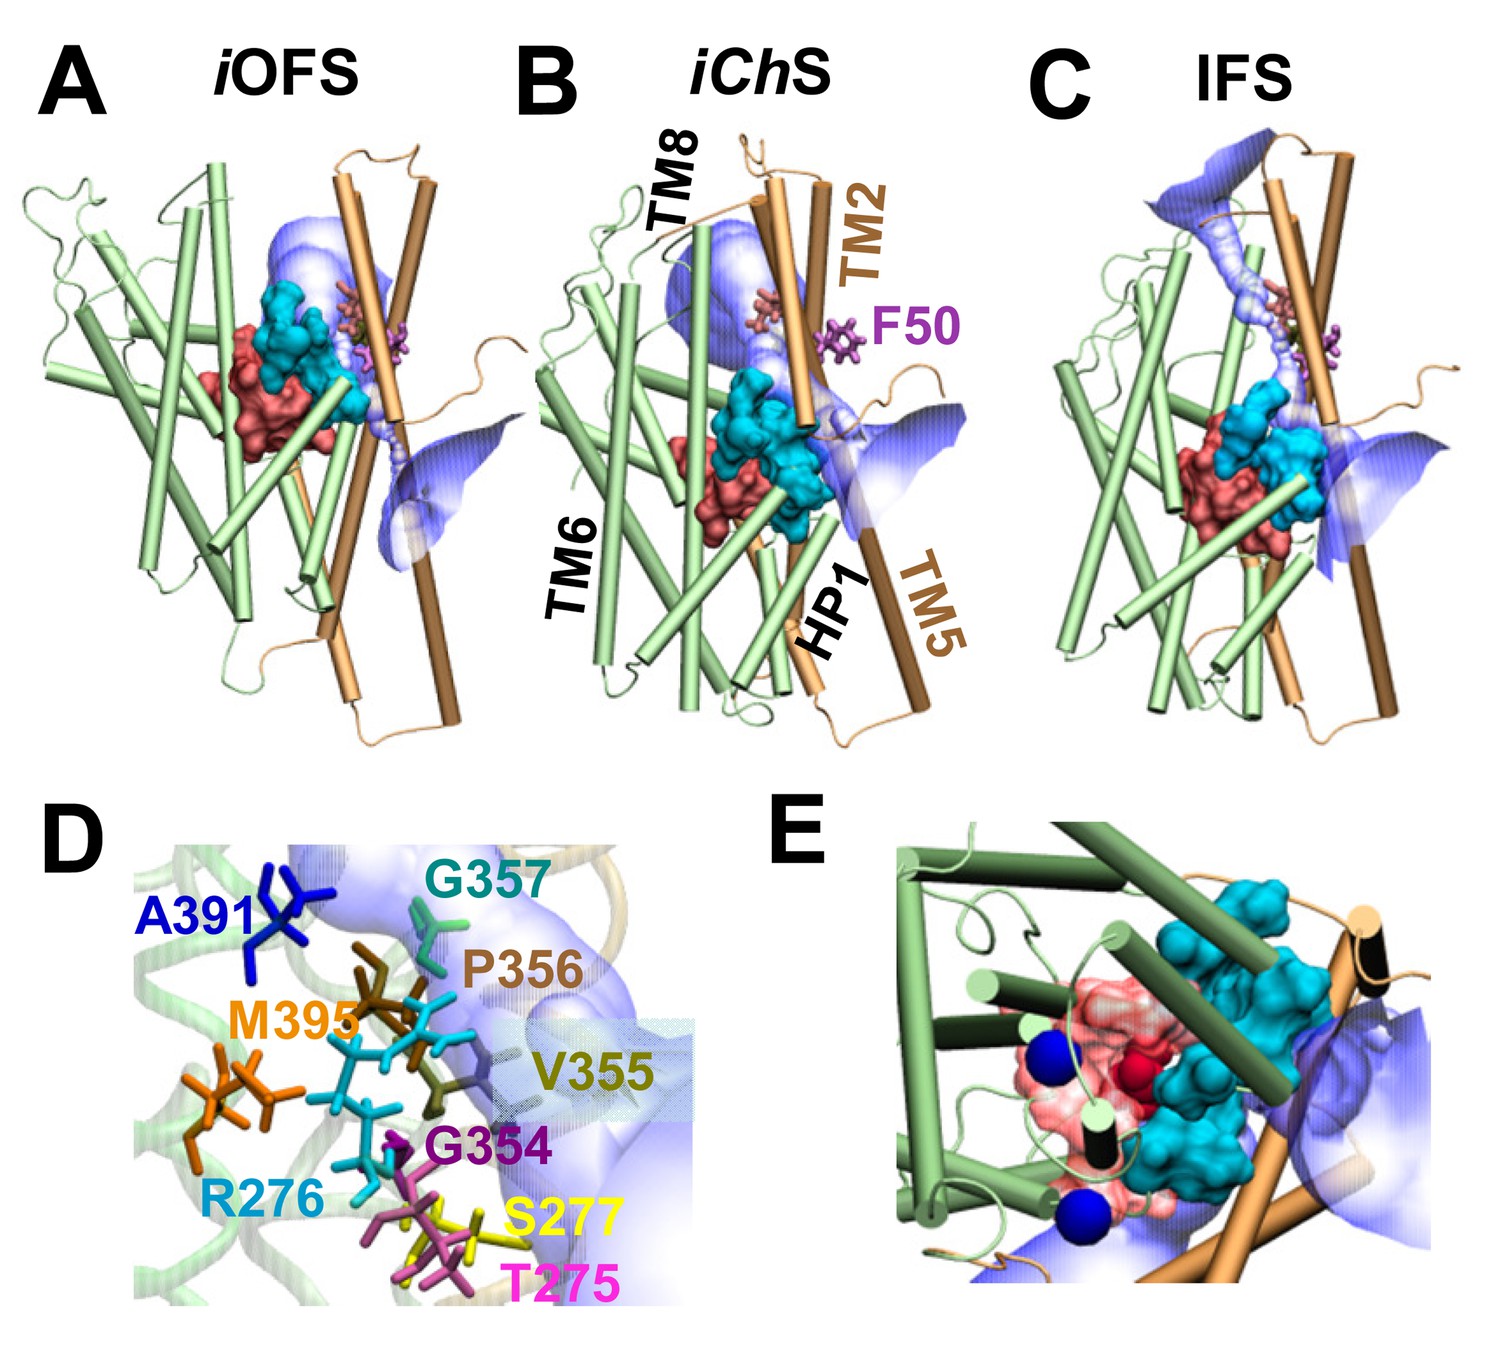
A moving flexible wall separates the substrate-binding and anion permeation regions.
The wall (shown in cyan surface representation) is composed of residues T275-R276-S277 in the HP1 loop, G354-V355-P356-G357 in the HP2 loop, and A391, D394 and M395 in the TM8. The substrate-binding cavity (composed of residues located within 4 Å from the bound aspartate) is shown in red surface representation. The anion permeation region is shown in semi-transparent blue/white. The structures are shown for (A) iOFS; (B) iChS; and (C) IFS in GltPh. TM helices belonging to the transport domain are colored green; those in the trimerization domain are light brown. Comparison of panes A–C shows that the trimerization domain remains approximately fixed in space, while the transport domain moves downward (elevator-like) as the subunit transitions from iOFS to IFS. Panel (D) shows the wall-composing residues in iChS; and (E) displays the IC view of the wall-composing residues (cyan surface), bound sodium ions (blue spheres) and aspartate (red VDW representation). Note that only in the iChS conformer is the channel wide enough to allow for the permeation of anions. In both panels A and C, there are constriction zones near F50, which block the path for anion permeation.
Figure 7
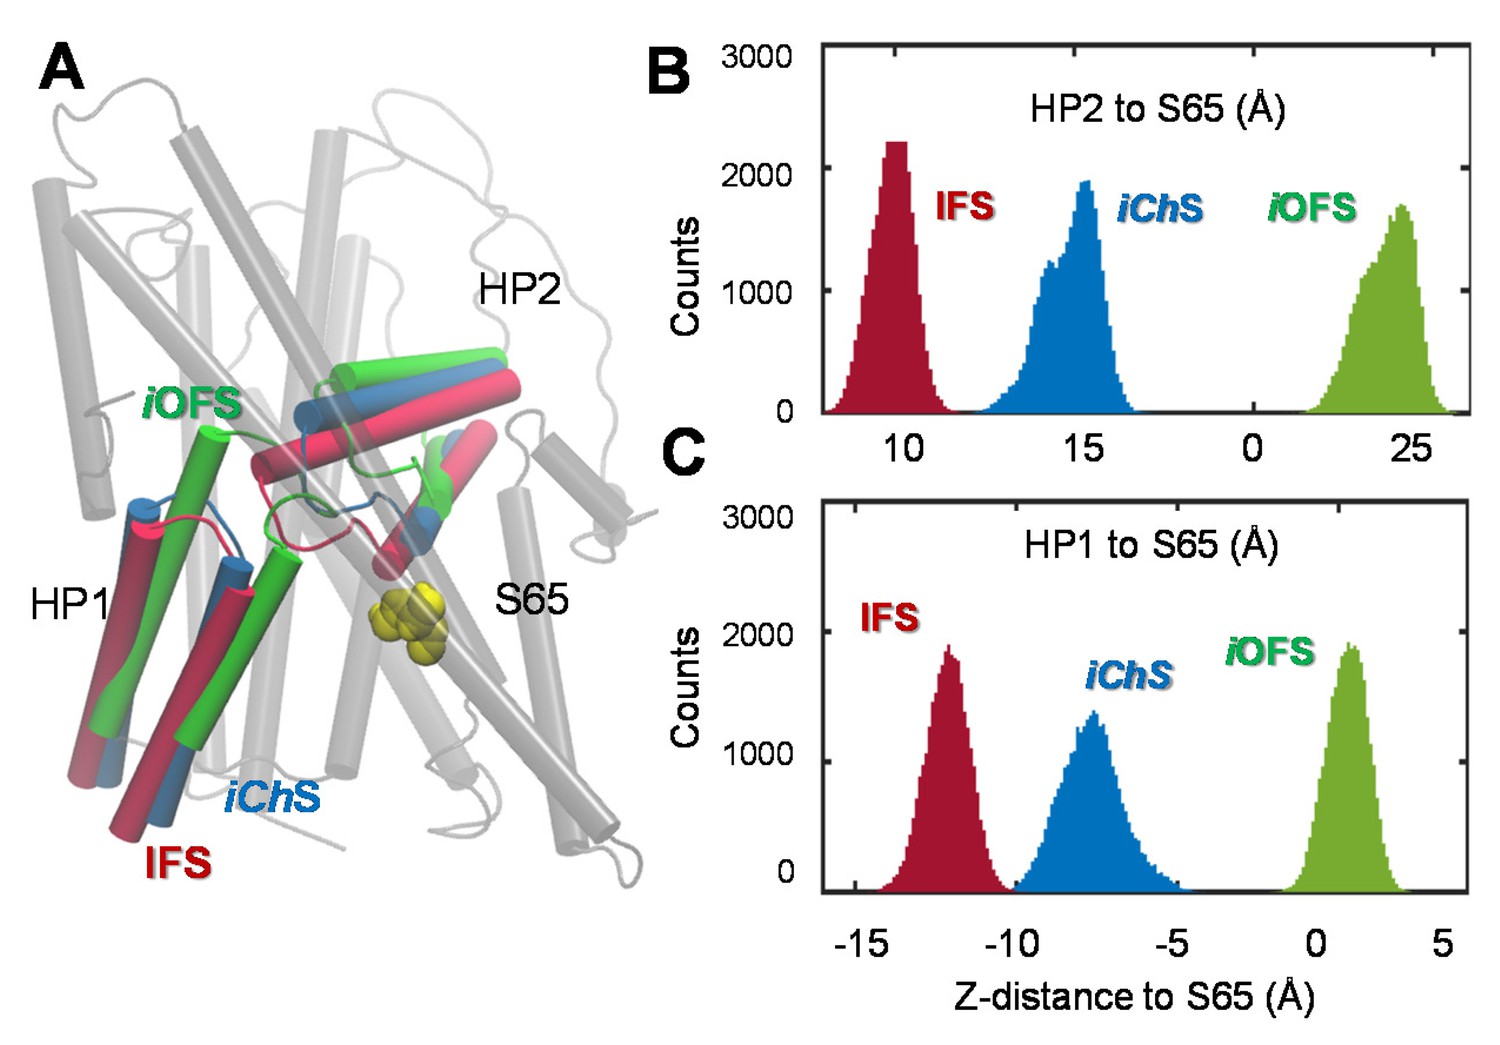
Distinct characteristics of the channeling intermediate iChS stabilized during the transition from iOFS to IFS in GltPh.
(A) Structural superimposition of iChS (blue) with the crystal structures resolved for the iOFS (green;) and IFS (red;). Histograms of the z-distance between (B) the external gate HP2 and TM2 (S65); and (C) the inner gate HP1 and TM2 (S65), based on 320,000 MD snapshots. The distances are based on the z-coordinates of the mass centers of HP2 (V335-V370), HP1 (P258- K290) and S65.
Figure 8
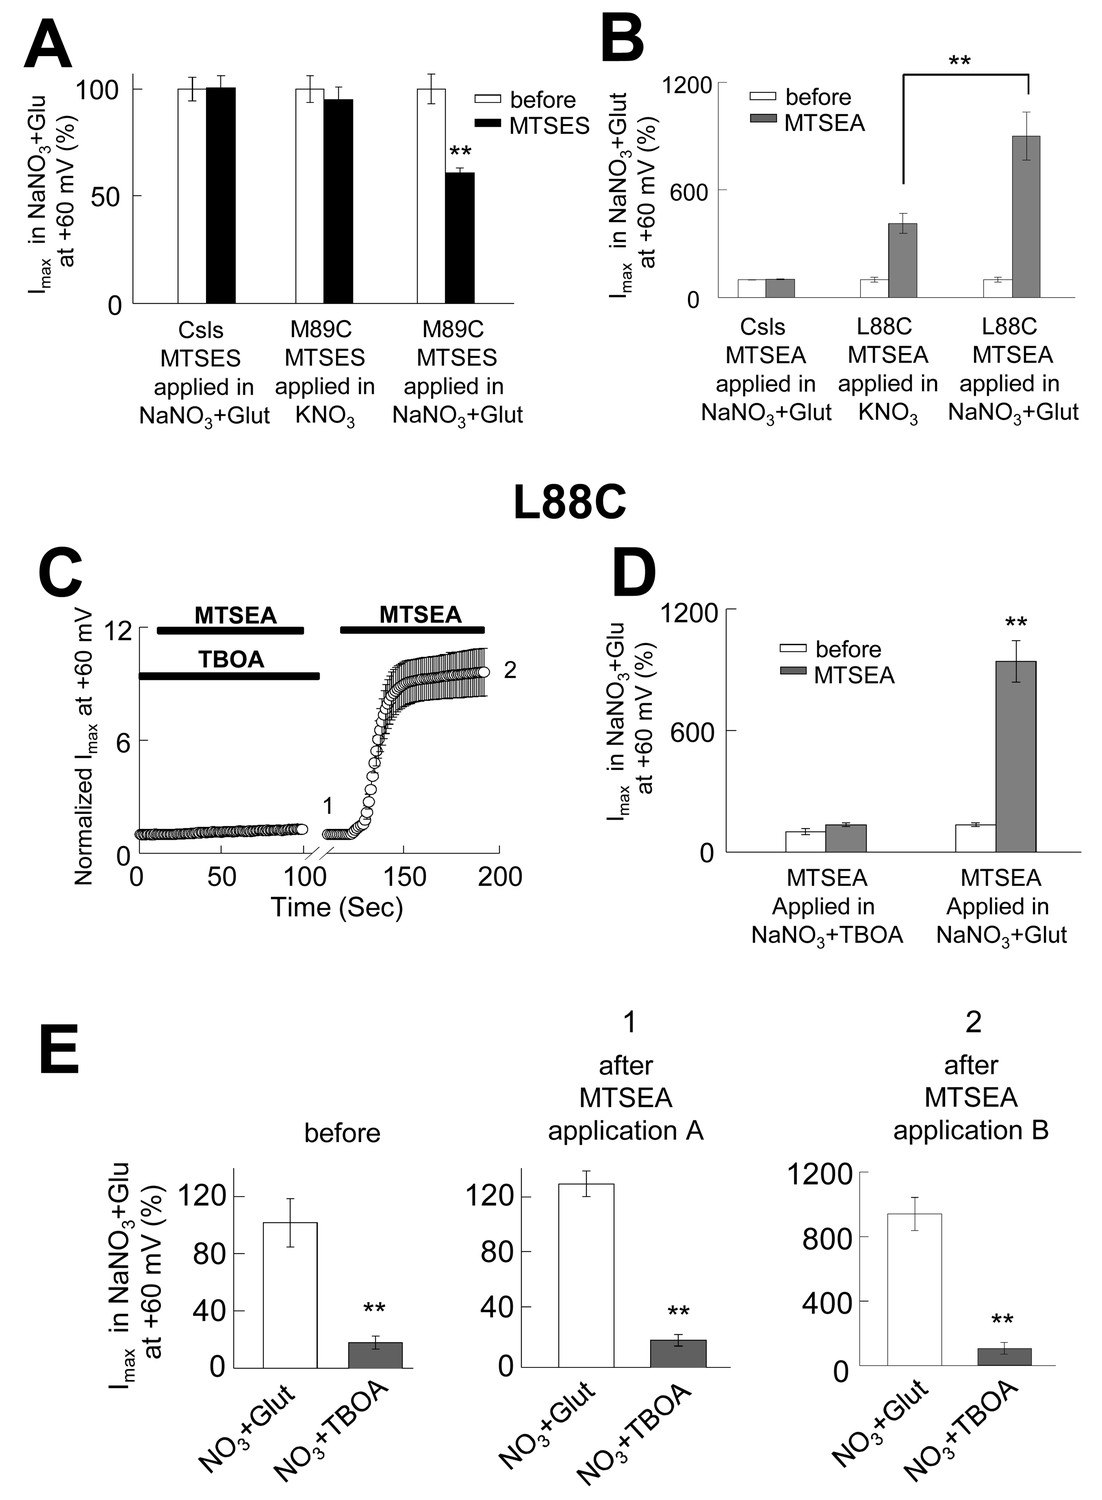
The opening of the anion permeation path occurs only in the iChS, and the accessibility of pore-forming residues is state-dependent.
(A) Bar graph representation of averaged current amplitudes at +60 mV measured in oocytes expressing either CslsWT or M89C before (white bars) and after (black bars) the application of 10 mM MTSES. MTSES was applied in a buffer containing 96 mM KNO3 and no sodium (center bars, n = 5) or in a buffer containing 96 mM NaNO3 +500 µM glutamate (right bars, n = 4). (B) Bar graph representation of the averaged current amplitudes measured in oocytes expressing either CslsWT or L88C before (white bars) and after (grey bars) the application of 2.5 mM MTSEA. The application was done in a buffer containing KNO3-based solution (n = 5) or in a NaNO3-based solution +500 µM glutamate. (C) Averaged normalized current amplitudes measured in oocytes expressing L88C at +60 mV on intervals of 1 s before and during the application of 2.5 mM MTSEA. A first application was done in the presence of 200 µM TBOA, followed by a second application in NaNO3+glutamate (n = 5). The black bars represent the time of each application. (D) Bar graph representation of averaged current amplitudes at +60 mV measured before the application (white bars) and after the first (1) and the second (2) application in C) (grey bars). (E) Averaged current amplitudes at +60 mV in the absence and the presence of 200 µM TBOA before and after each of the applications in (C).
Videos
Video 1
Transition of the GltPh subunit in the iOFS (blue) into IFS during the global motion of the trimeric transporter, observed in tMD simulations.
The two other subunits (shown in yellow, and orange in the background) are in the IFS. The transporter is in substrate-loaded state (all subunits have a bound aspartate, shown in red space-filling). Each subunit also has two bound sodium ions (blue spheres). Residues I61, S65, Y195, M286 and P304 are shown green, yellow, pink, orange, and tan space-filling representations, in the reconfiguring subunit. M286 (orange) and P304 (tan) get away from S65 and Y195, to induce an opening in the IC-facing end of the cavity, although the putative channeling pore remains closed in the iOFS.
Video 2
Chloride channeling pathway.
Metadynamics simulation of the passage of a chloride ion (cyan) through the GltPh subunit in the newly identified anion-conducting intermediate, iChS. In this case, we observe the translocation from the extracellular (EC) to the intracellular (IC) region. Cyan dots represent the trajectory of the chloride ions, sampled during the simulations. In the movie, F50, R276 and P356 are shown purple, cyan and tan stick representations. The bound aspartate and two sodium ions are shown in red space-filling and blue spheres, respectively. Note that, the chloride pathway is distinct from substrate/sodium-binding sites, and it is at the interface between the trimerization (brown) and transport (green) domains of the protomer.
Video 3
Putative pathway near S65 does not permit for chloride channeling.
Sampling the vicinity of S65-associated cavity by chloride ion (cyan) near the iOFS using metadynamics simulation. Cyan dots represent the trajectory of the chloride ion, sampled during the simulations. The pore lining residues S65, I61 and V58 are shown yellow, green and tan stick representations. The bound aspartate and two sodium ions are shown in red and blue space-filling. The estimated energy barrier was over 20 kcal/mol through this path, and therefore we concluded that this is not a probable anion-channeling path.
Additional files
-
Supplementary file 1
Summary of MD simulations.
- https://doi.org/10.7554/eLife.25850.017
Download links
A two-part list of links to download the article, or parts of the article, in various formats.
Downloads (link to download the article as PDF)
Open citations (links to open the citations from this article in various online reference manager services)
Cite this article (links to download the citations from this article in formats compatible with various reference manager tools)
Substrate transport and anion permeation proceed through distinct pathways in glutamate transporters
eLife 6:e25850.
https://doi.org/10.7554/eLife.25850


