Intracellular uptake of macromolecules by brain lymphatic endothelial cells during zebrafish embryonic development
- WWU Münster, Germany
- University College London, United Kingdom
Figures
Figure 1 with 1 supplement
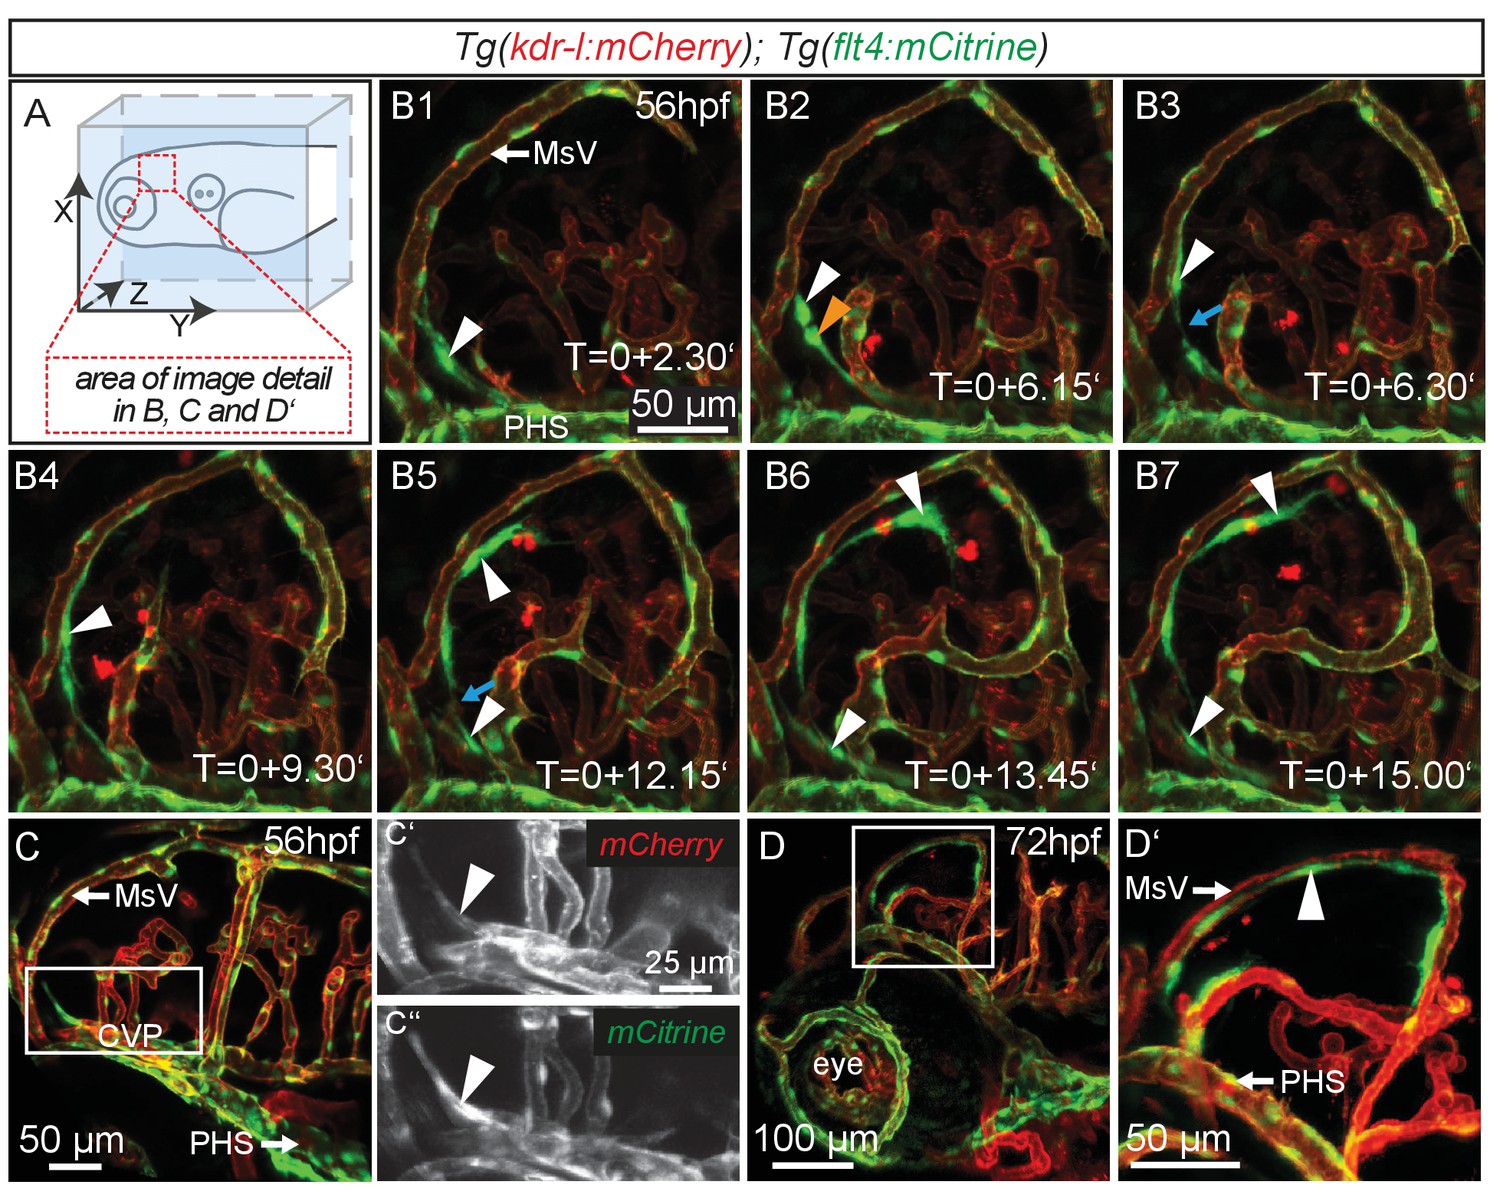
flt4 positive cells sprout from the choroidal vascular plexus and migrate along blood vessels.
In all images blood vessels are highlighted in red (kdr-l:mCherry) and lympho-venous cells in green (flt4:mCitrine). (A) Overview and orientation of zebrafish embryos imaged in B–D. (B1 – B7) Time-lapse still images of lateral confocal projections of the TeO. At 56hpf strong mCitrine positive but low mCherry expressing ECs sprout from a vessel behind the PHS and migrate along the MsV (white arrow). Following initial sprouting the cell divides (B2, white and orange arrowheads). Leading and following cells appear to temporarily lose contact (B3 and B5, blue arrow). After making contact to the MsV the sprout continues migration (B4–B7). (C) Partial projection of the sprouting cells (cropping of the PHS) reveals that the migrating cells originate from the more proximal positioned CVP at around 56hpf. Sprouting cells express low mCherry but high mCitrine levels compared to the CVP (inset C’–C’’). (D) Lateral confocal projection of the head region shows that at 72hpf flt4 positive ECs (white arrowheads) form a loop aligned next to the MsVs (white arrowheads). (D’) Higher magnification of the boxed area in (D). Data are representative of at least five independent experiments. CVP, choroidal vascular plexus; EC, endothelial cell; hpf, hours post fertilization; MsV, mesencephalic vein; PHS, primary head sinus; TeO, Optic Tectum. Apostrophe in B1–B7 denotes hours.
Figure 1—figure supplement 1
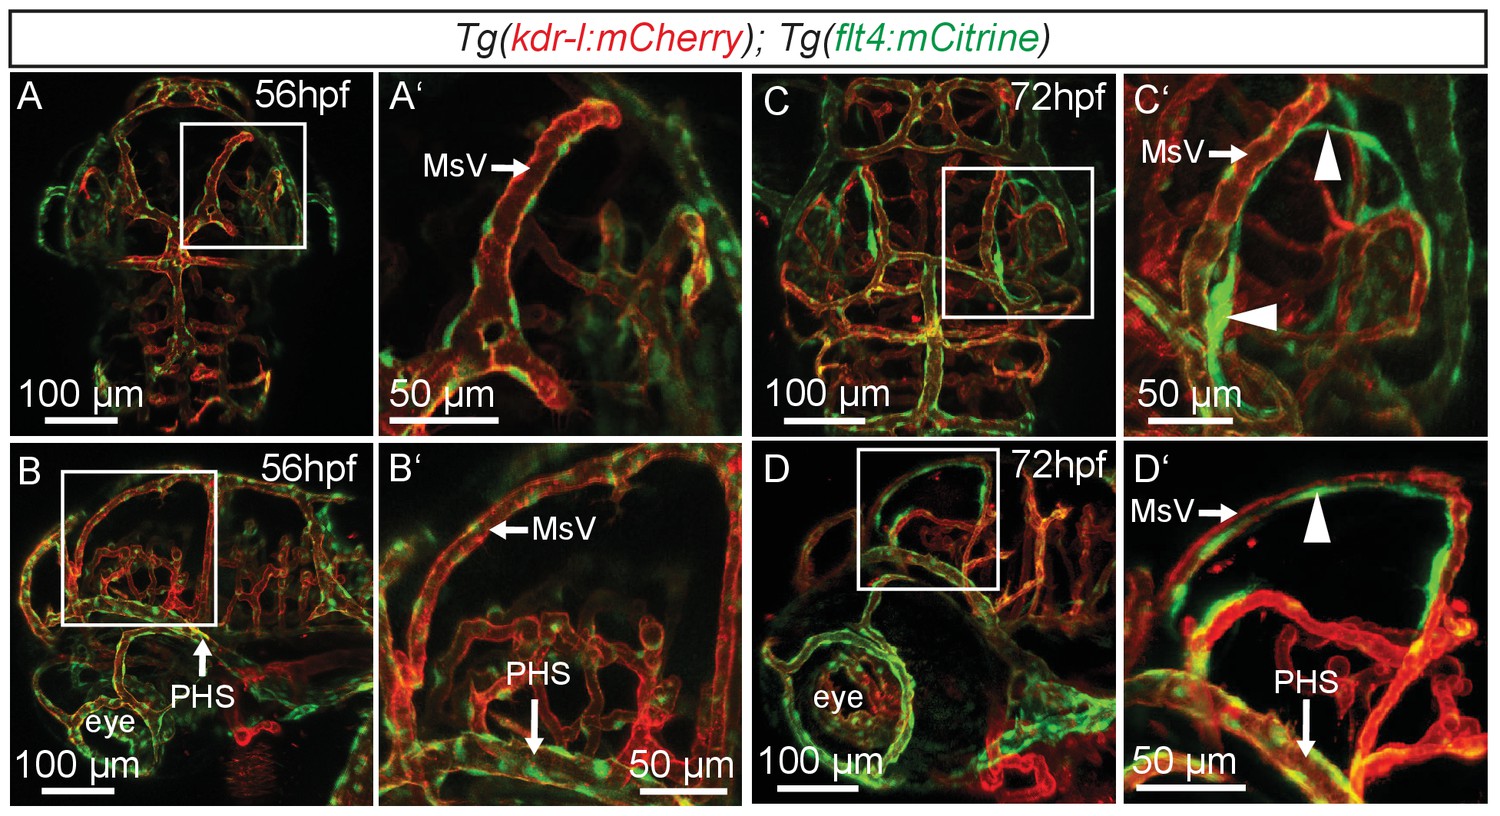
flt4 positive cells develop between 56 and 72hpf.
In all images blood vessels are highlighted in red (kdr-l:mCherry) and lympho-venous cells in green (flt4:mCitrine). (A–D) Representative dorsal and lateral confocal projection of the zebrafish head region. Until 56hpf there are no apparent flt4 positive, kdr-l negative cells visible (dorsal view in A, lateral view in B). In 3dpf embryos, a bilateral loop of loosely connected flt4 positive, kdr-l negative cells has formed next to the MsV (dorsal view in C, lateral view in D, white arrowheads). Data are representative of at least three independent experiments. hpf, hours post fertilization; MsV, mesencephalic vein; PHS, primary head sinus.
Figure 2
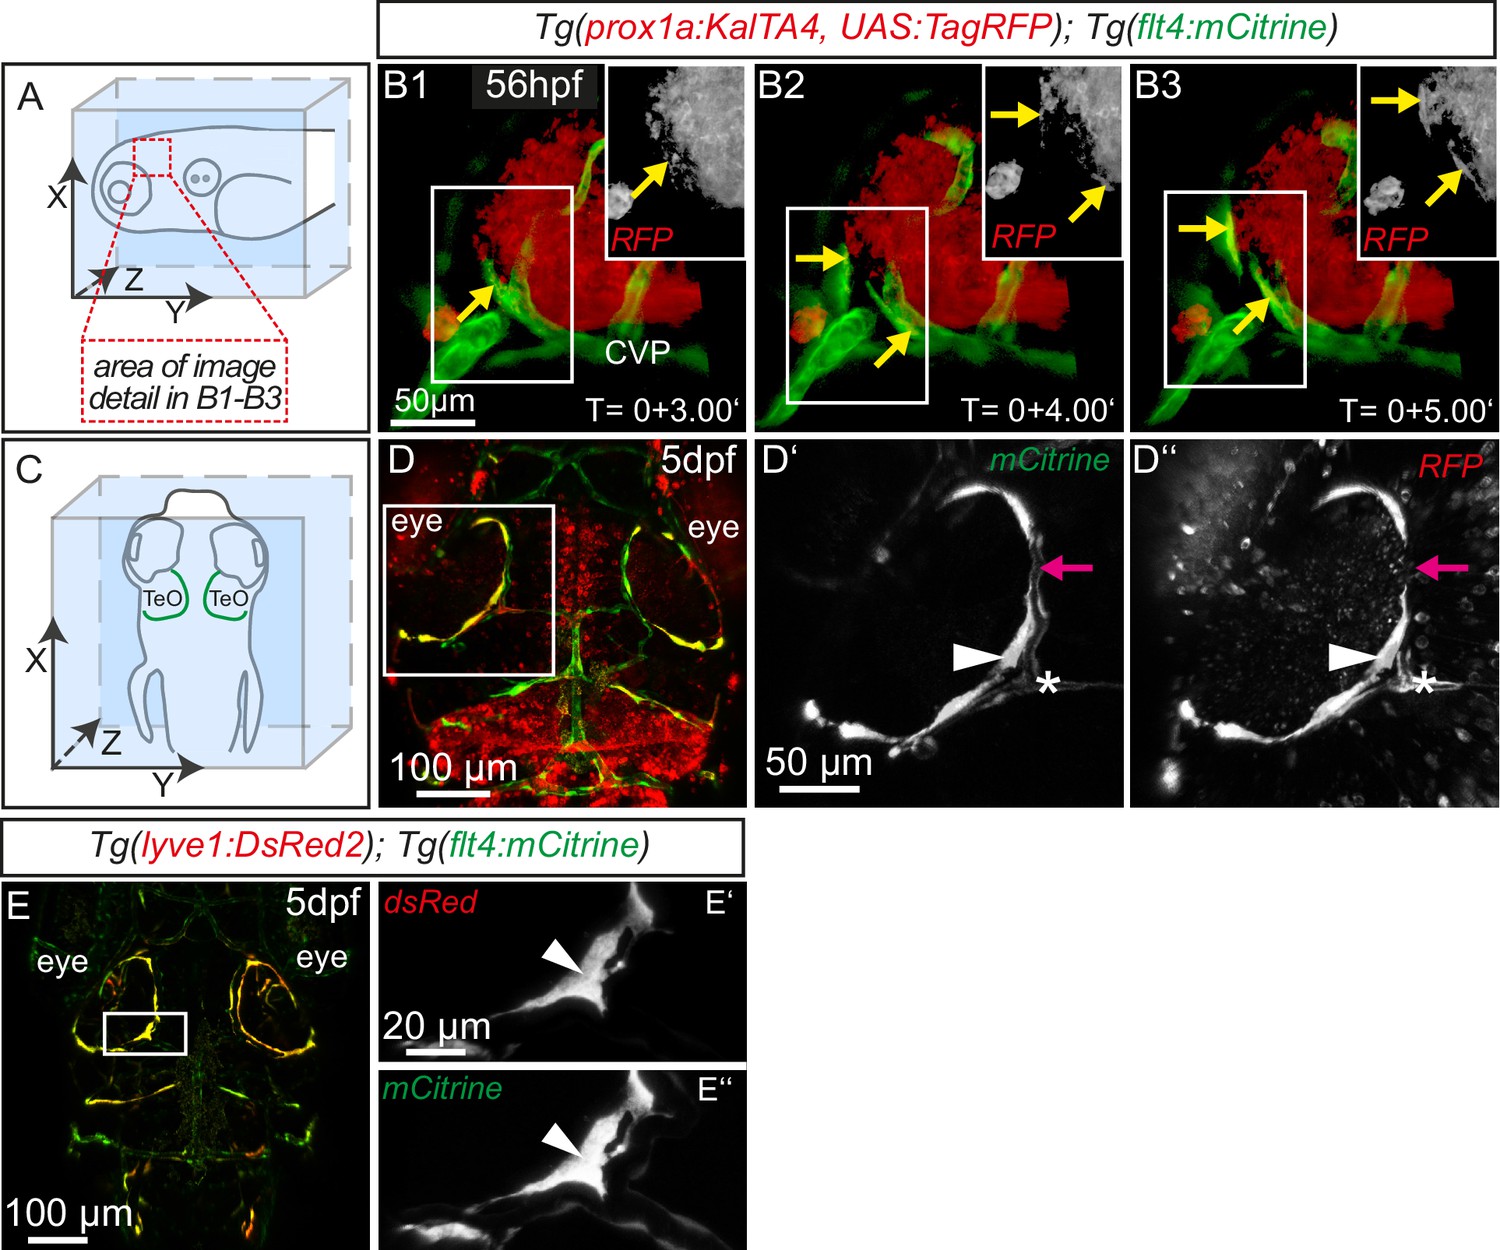
Sprouting flt4 positive endothelial cells express prox1a and lyve1.
(A) and (C) Overview and orientation of 56hpf and 5dpf zebrafish embryos shown in B1-B3 (A) and D–E'' (C). Green lines in C illustrate the position of mCitrine positive ECs. (B1–B3) Time-lapse still images of partial lateral confocal projections of the TeO as depicted in A (red inset). At 56hpf tagRFP indicates prox1a promoter activity in mCitrine positive endothelial sprouts (yellow arrows). Note that the RFP positive red cell mass above the CVP likely reports prox1a expression in cranial ganglia within the TeO. (D) Strong prox1a promoter activity persists in the mCitrine positive loop structure (inset, white arrowhead) but is absent in neighboring MsV (inset, pink arrow) at 5dpf. Note also tagRFP expression around a small part of the MsV (inset, white asterisk). (E) flt4 positive ECs express lyve1 at 5dpf (E’,E’’ inset, white arrowhead). Data are representative of at least three independent experiments. CVP, choroidal vascular plexus; dpf, days post fertilization; hpf, hours post fertilization; MsV, mesencephalic vein; TeO, Optic Tectum. Apostrophe in B1–B3 denotes hours.
Figure 3
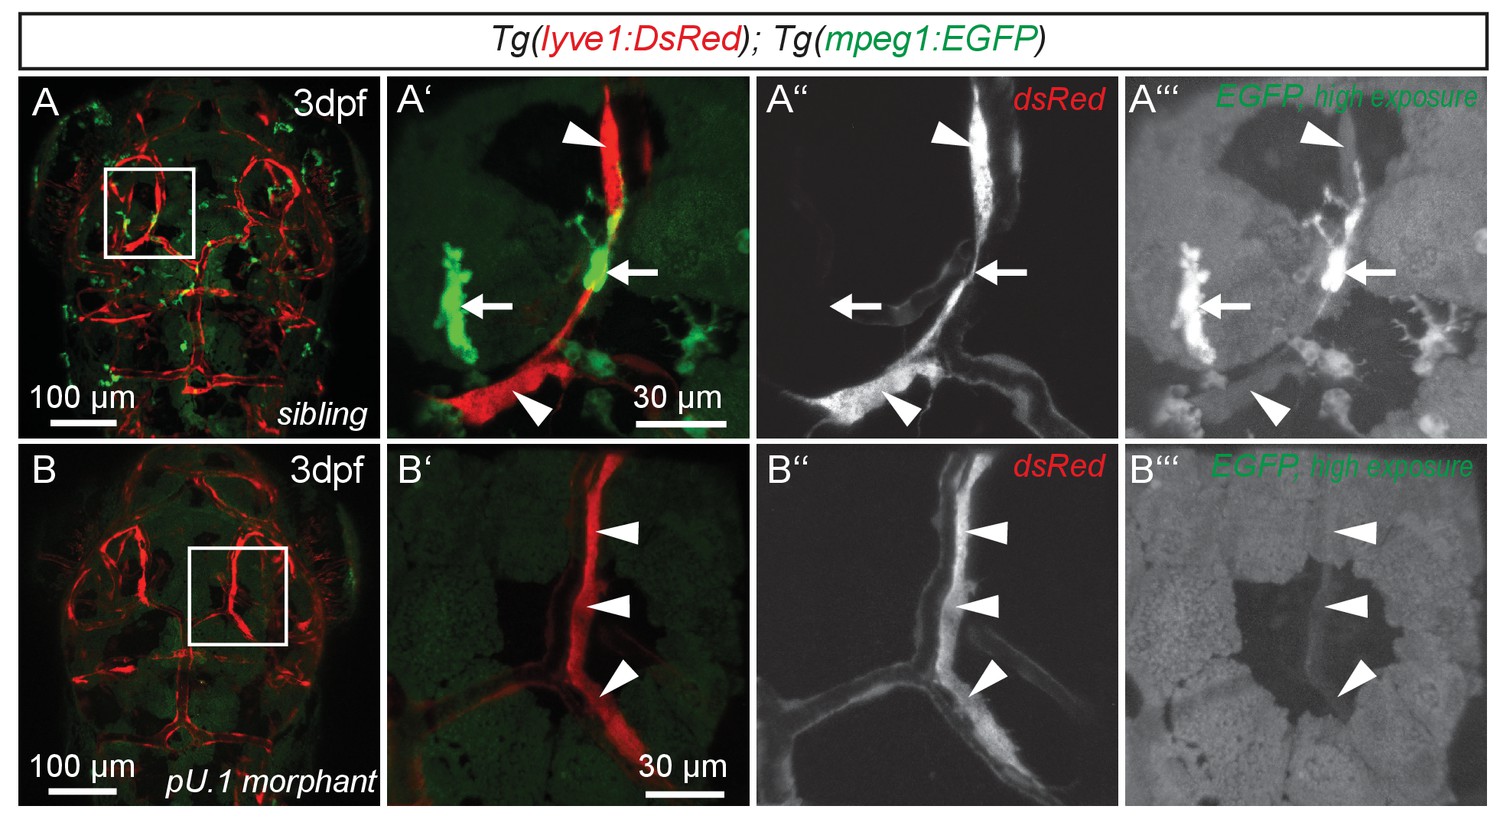
flt4 positive cells are not of myelopoietic origin.
(A) and (B) Dorsal view of partial confocal projections of 3dpf double transgenic Tg(lyve1:DsRed)nz101; Tg(mpeg1:EGFP)gl22 embryos. Brain resident macrophages strongly express mpeg1:EGFP (A’–A’’’, white arrows) while lyve1 positive LECs are only weakly EGFP positive (A’–A’’’, white arrowheads) in uninjected control embryos. Depletion of the myelopoietic lineage by injection of pU.1 (spi1b) morpholinos ablates all EGFP positive macrophages but does not affect the formation of lyve1 positive LECs (B’–B’’’, white arrowheads). dpf, days post fertilization; LEC, lymphatic endothelial cell.
Figure 4
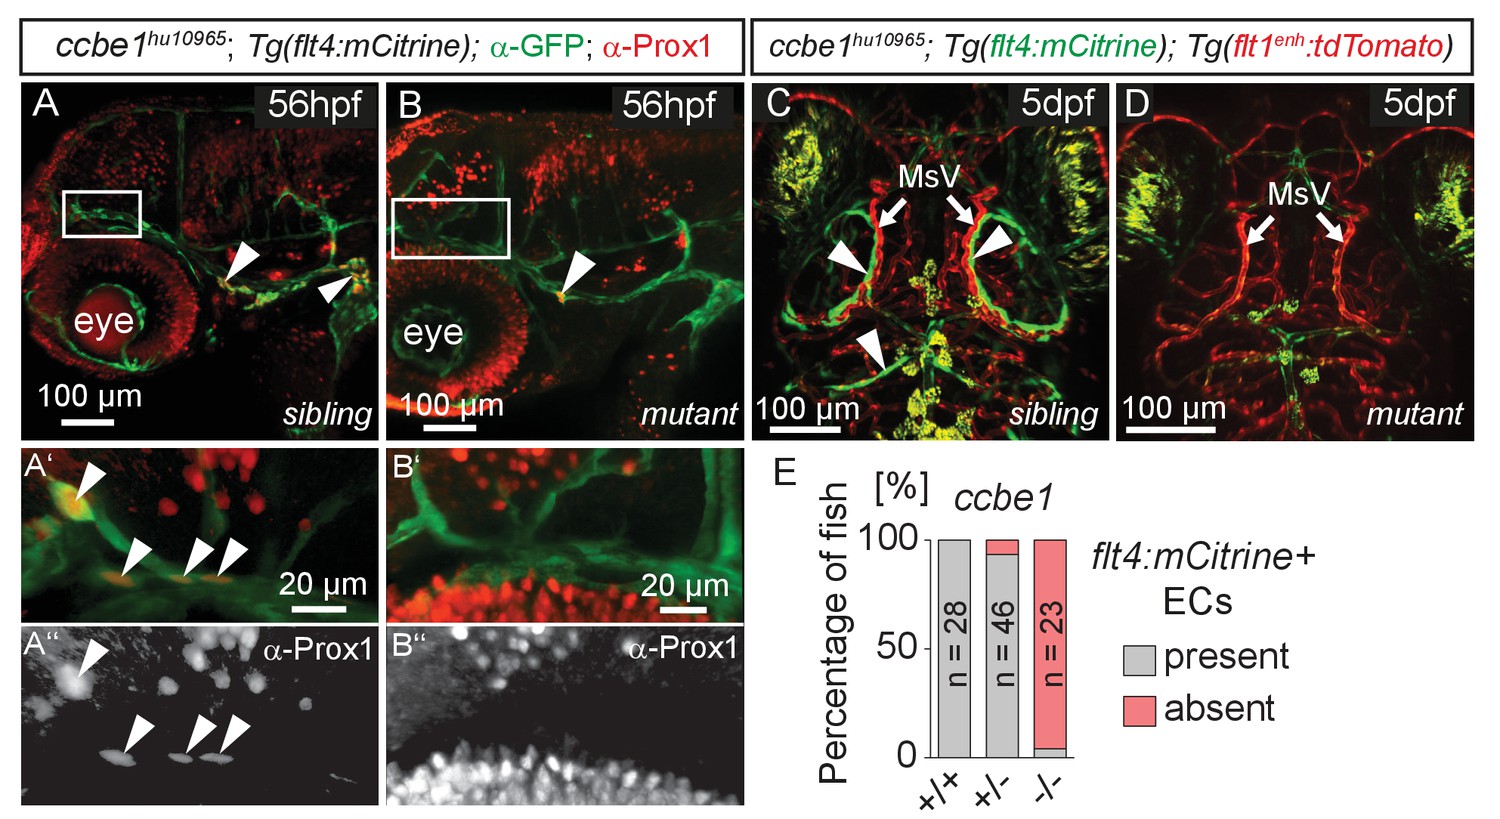
flt4 positive cells are sensitive to ablation of the vegfc/ccbe1 pathway.
(A) and (B) Antibody staining detects Prox1 protein in the GFP positive CVP and sprouting ECs in wild type sibling (A) but not in ccbe1 mutant (B) embryos (A’,A’’ insets, white arrowheads). Note few Prox1 expressing cells remaining in mutants at the site of facial lymphatic sprouting (B, white arrowhead). (C) and (D) Absence of flt4:mCitrine expressing ECs in ccbe1 mutant (D) but not in sibling controls (C, white arrowheads) in 5dpf embryos. Tg(flt1enh:tdTomato) labels arteries. (E) Quantification of results shown in C and D. Data are representative of at least two independent experiments. CVP, choroidal vascular plexus; dpf, days post fertilization; EC, endothelial cell; hpf, hours post fertilization; MsV, mesencephalic vein; +/+, wildtype; +/-, heterozygous; -/-, mutant.
-
Figure 4—source data 1
Zebrafish embryos from an incross of Tg(flt1enh:tdTomato); Tg(flt4:mCitrine) heterozygous for the mutant ccbe1hu10965 allele were analyzed by fluorescent stereomicroscopy at 5dpf for the presence or absence of flt4:mCitrine expressing ECs in the head (as depicted in Figure 4C and D).
Following analysis embryos were genotyped for the presence of the ccbe1hu10965 allele and grouped accordingly. Results from two independent experiments were combined and represented as percentages.
- https://doi.org/10.7554/eLife.25932.008
Figure 5
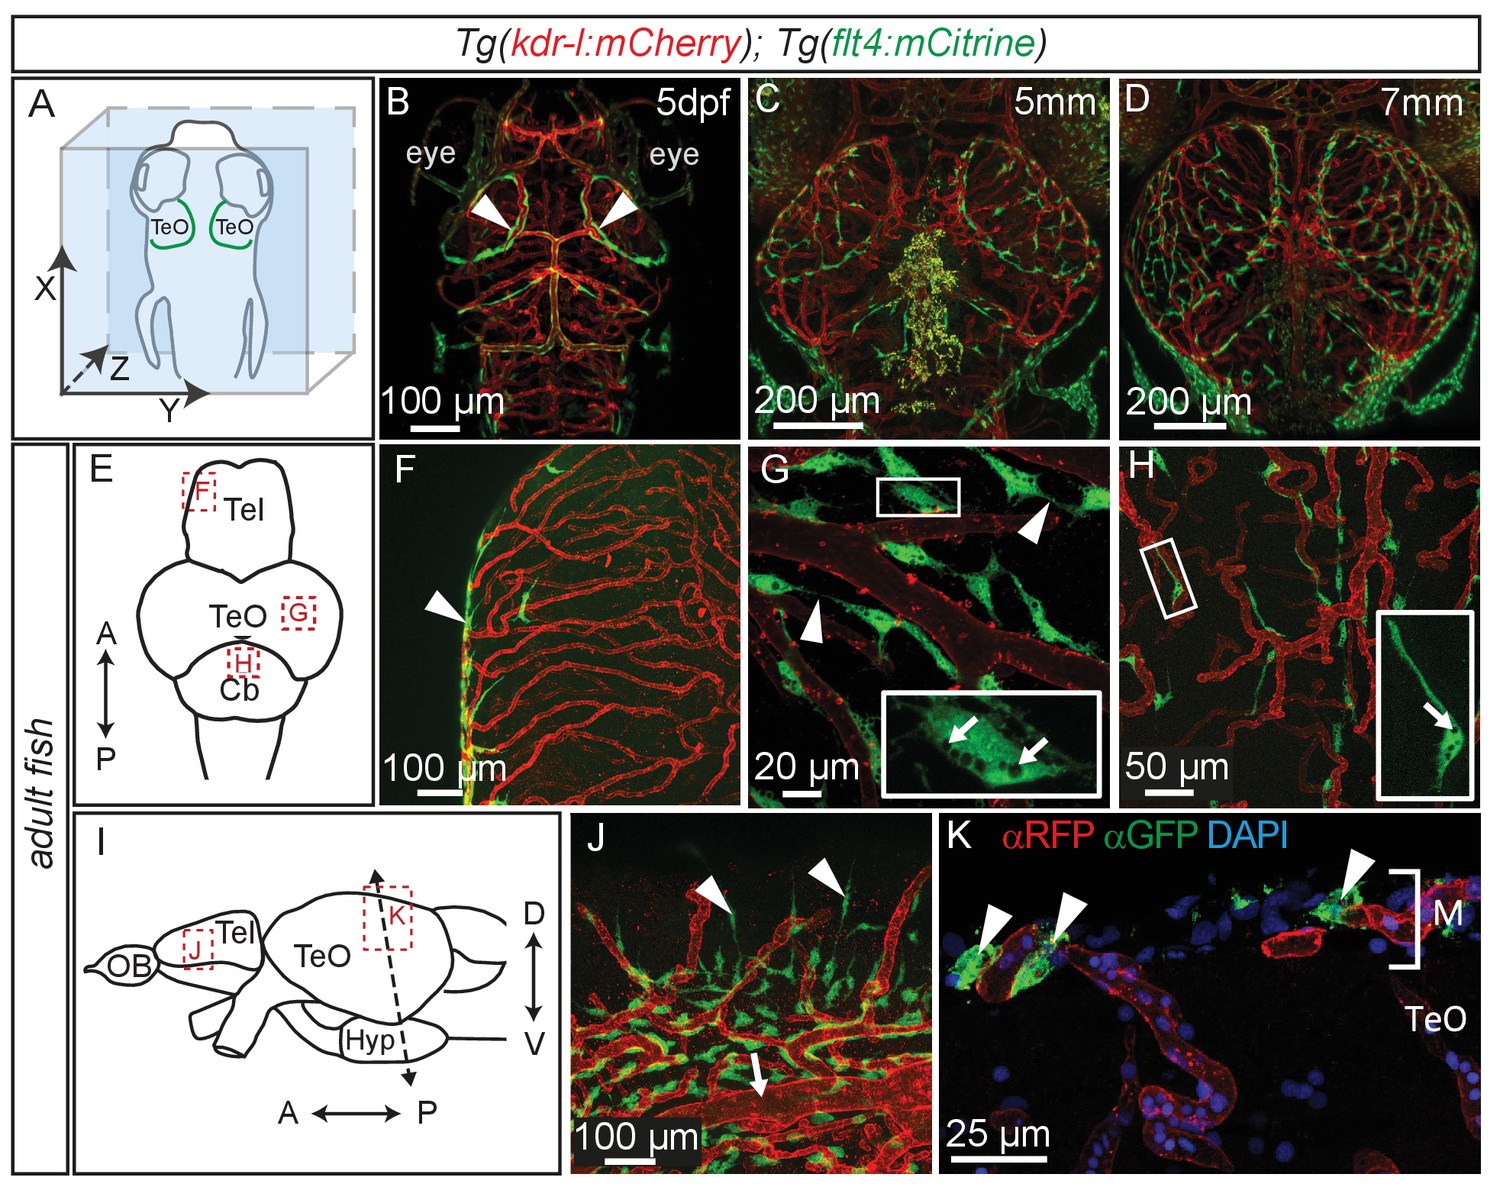
Perivascular position of flt4 positive BLECs in larval stages and adult meninges.
(A) Overview and orientation of zebrafish embryos imaged in B–D. (B) Dorsal confocal projections of the head region show that at 5dpf flt4 positive BLECs (white arrowheads) form a bilateral loop in the TeO which aligns next to the MsVs (white arrowheads). (C) and (D) Dorsal confocal projections at 5 mm and 7 mm stages show increasing spreading of flt4 positive ECs, particularly over the TeO. (E) Schematic diagram (dorsal view) of adult brain. Dotted boxes show area of image detail of F–H. (F) The dorsal surface of the Tel displays a distinct absence of flt4:mCitrine positive cells. (G) and (H) A dorsal view of the TeO and Cb, respectively, shows flt4:mCitrine positive BLECs (green) closely associated with surface kdr-l:mCherry positive blood vasculature (red), interacting with vessels and one another via thin processes (white arrowheads). BLECs contain multiple internal compartments (inset, white arrows). BLECs on the cerebellar surface are less dense and are morphologically distinct, exhibiting an elongated shape (inset). (I) Schematic diagram (lateral view) of adult brain. Dotted boxes show area of image detail of J and K, and the dotted line shows the section plane in K. (J) BLECs on the lower half of the lateral telencephalic midline boundary cluster around smaller vessels branching off from the anterior cerebral carotid artery at the lateral midline of the telencephalon (white arrow) with a few cells sending sparse and elongated processes towards the dorsal surface (white arrowheads). (K) Coronal section of the adult brain shows flt4:mCitrine positive BLECs (green) (white arrowheads) closely associated with kdr-l:mCherry positive vasculature (red) exclusively within the meninges (M) but not along the vessels extending ventrally into the tectal neuropil. DAPI nuclear counter stain (blue). Data are representative of at least three independent experiments. BLEC, brain lymphatic endothelial cell; Cb, Cerebellum; dpf, days post fertilization; EC, endothelial cell; Hyp, hypothalamus; M, Meninges; MsV, mesencephalic vein; Tel, Telencephalon; TeO, Optic Tectum.
Figure 6
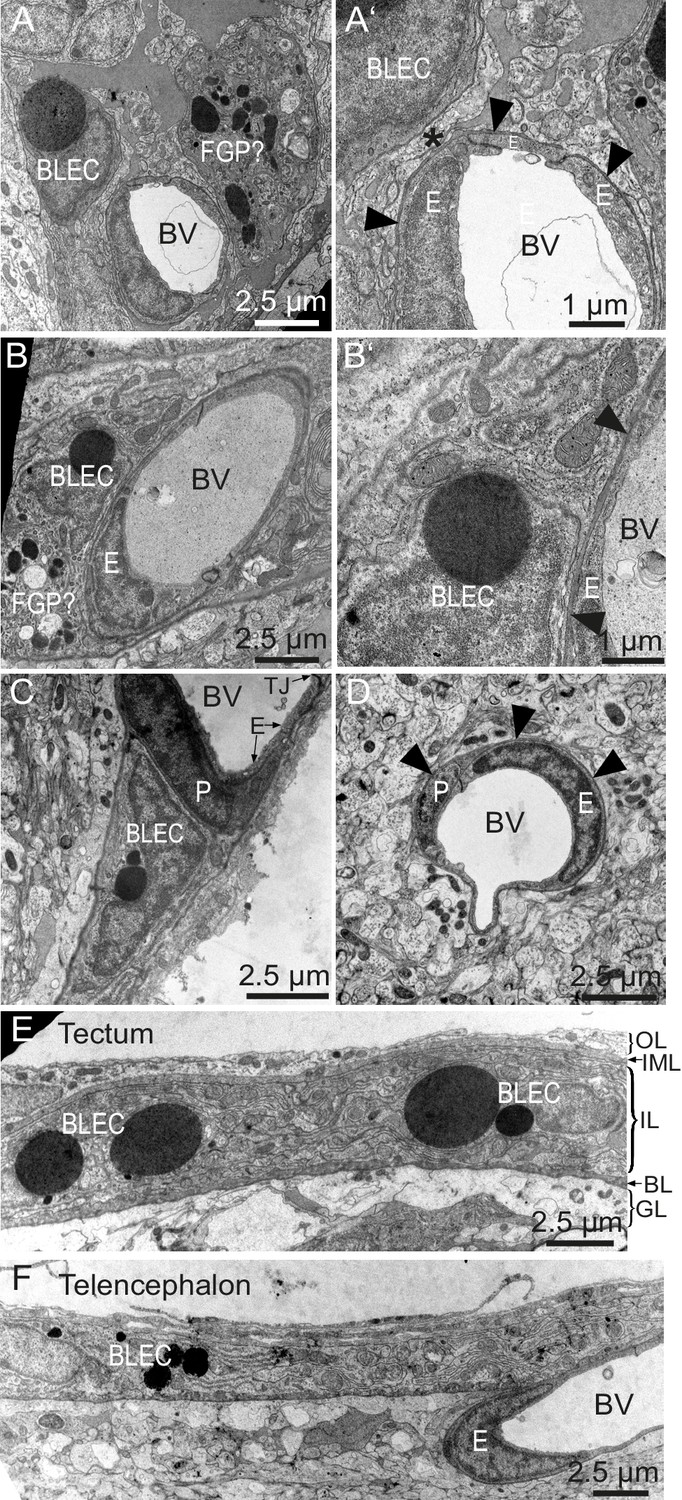
BLEC ultrastructure revealed in TEM of adult brain meninges.
(A) and (B) TEM micrographs of tangential sections of the domed tectal surface revealed cells (BLEC) with large spherical inclusions in proximity to meningeal blood vessels (BV). Higher magnification shows that BLECs are not contained within the basement membrane (A’ and B’, arrowheads) of endothelial cells (E) and are separated from the vessels by other cellular processes (e.g. asterisk in A’). Putative Mato/FGP cells are indicated (FGP?). (C) and (D) Pericytes (P) maintain close contact with endothelial cells (E) and are found under the basement membrane (arrowheads). BLECs are only found in the meninges (C) and are absent near blood vessels in the neuropil (D) of the brain. (E) and (F) T/S sections of tectal (E) and latero-ventral telencephalic (F) meninges showing BLECs are present in the inner layer (IL) of the meningeal covering. BLEC, brain lymphatic endothelial cell; E, endothelial cell; FGP, fluorescent granular perithelial cell; P, pericyte; TJ, tight junction. Nomenclature of meningeal layers according to Momose et al. (1988): OL, outer layer; IML, intermediate layer; IL, inner layer, BL, basal lamina; GL, glia limitans.
Figure 7 with 4 supplements
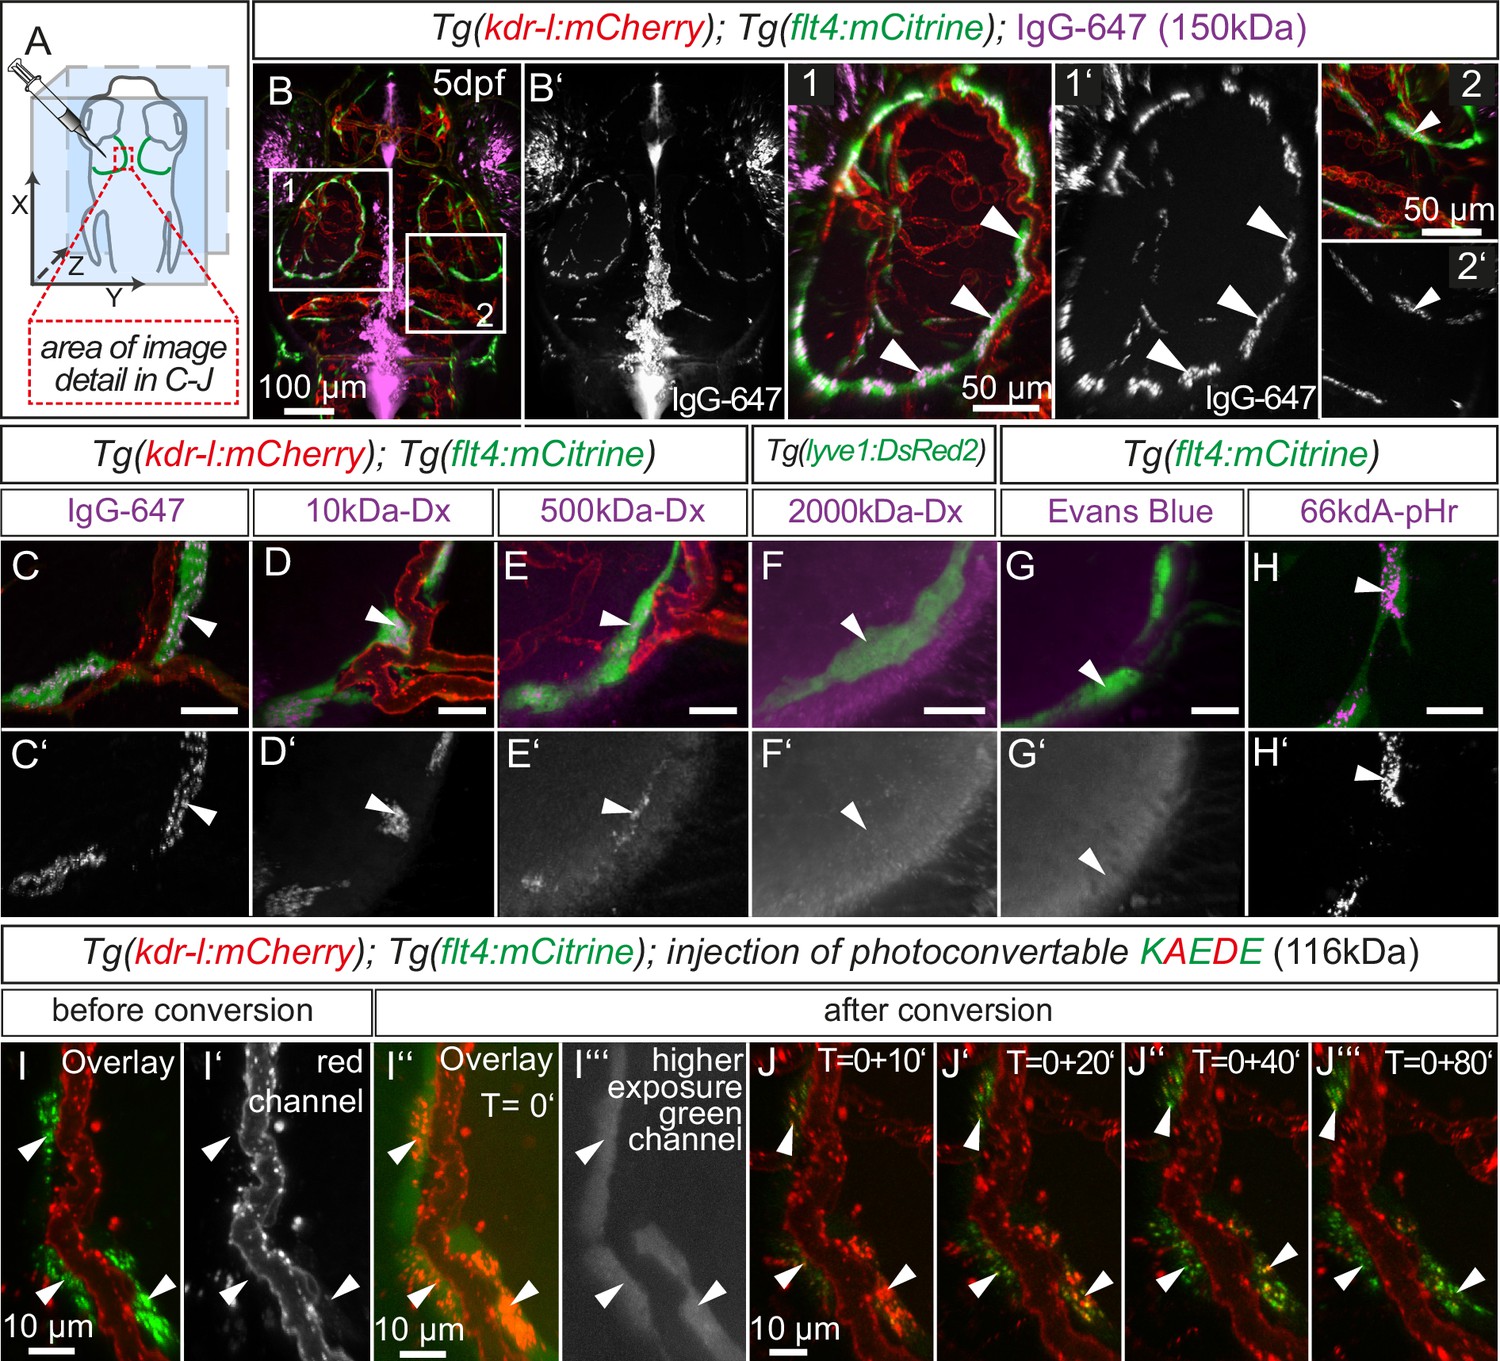
BLECs dynamically take up macromolecules.
(A) Overview of the zebrafish head region and intratectal injection site of fluorescent dyes into the center of the TeO close to the meninges. Red inset denotes area of image detail in C–J. (B–J) Representative dorsal confocal projection of 5dpf embryos injected with different tracer dyes as indicated. Injected IgG-647, 10kDa-Dx, 500kDa-Dx and 66kDa-pHr specifically localize to vesicles in mCitrine positive BLECs but not to mCherry positive blood vessels (B–E, H, I and J, white arrowheads). BLECs do not accumulate high MW dextran or Evans Blue (F and G, white arrowhead). BLECs strongly label with the pH-sensitive dye pHrodo (pHr) indicating tracer internalization (H, white arrowhead). (I) and (J) Injected KAEDE protein is taken up by BLECs (I and I’, white arrowheads) and can be photoconverted to red by localized UV-exposure to a region of interest (I’’ and I’’’, white arrowheads). 10 min after photoconversion, the amount of converted red KAEDE decreases dramatically (J) and the signal is almost completely lost after 80 min (J’’’, white arrowheads). In the same time course photoconverted BLECs re-accumulate non-converted green KAEDE protein (J’’’, white arrowheads). Scale bar in C–H corresponds to 20 µm. Data are representative of at least two independent experiments. BLEC, brain lymphatic endothelial cell; dpf, days post fertilization; Dx, Dextran; IgG-647, IgG-conjugated Alexa Fluor 674; TeO, Optic Tectum; pHr, pHrodo Red Avidin. Apostrophe in J denotes minutes.
Figure 7—figure supplement 1
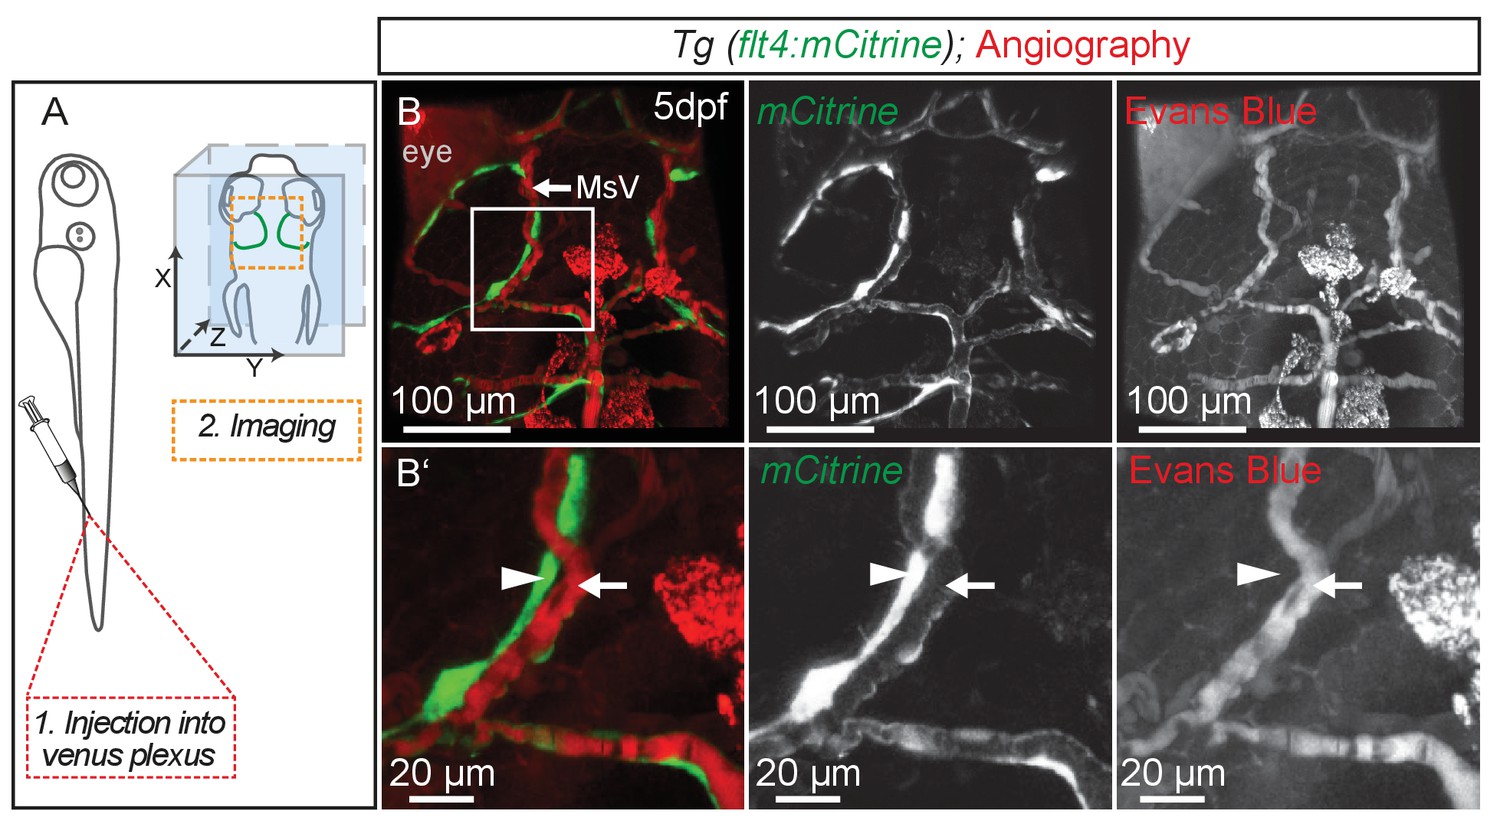
BLECs do not carry blood flow.
(A) Overview of the injection site for angiography into the venus plexus and of the region used for imaging (orange broken box) in the zebrafish head shown in B. (B) Representative dorsal confocal projection of 5dpf embryos with lympho-venous cells in green (flt4:mCitrine). Injected Evans Blue (red fluorescence) is confined to blood vessels (white arrow) and is not taken up by BLECs (white arrowheads). Data are representative of at least two independent experiments. BLEC, brain lymphatic endothelial cell; dpf, days post fertilization; MsV, mesencephalic vein.
Figure 7—figure supplement 2

Eyes and skin pigmentation is autofluorescent in non-injected embryos.
(A) Orientation of the zebrafish head imaged in B. (B) Representative dorsal confocal projection of non-injected 5dpf Tg(flt4:mCitrine) embryos marking lympho-venous cells in green. Excitation at 568 nm (B’) and 647 nm (B’’) shows auto-fluorescent signal from the eyes and skin pigmentation within the emission spectra of red and near-infrared fluorophores (B’ and B’’, white arrowheads). Data are representative of at least two independent experiments. dpf, days post fertilization; MsV, mesencephalic vein; TeO, Optic Tectum.
Figure 7—figure supplement 3
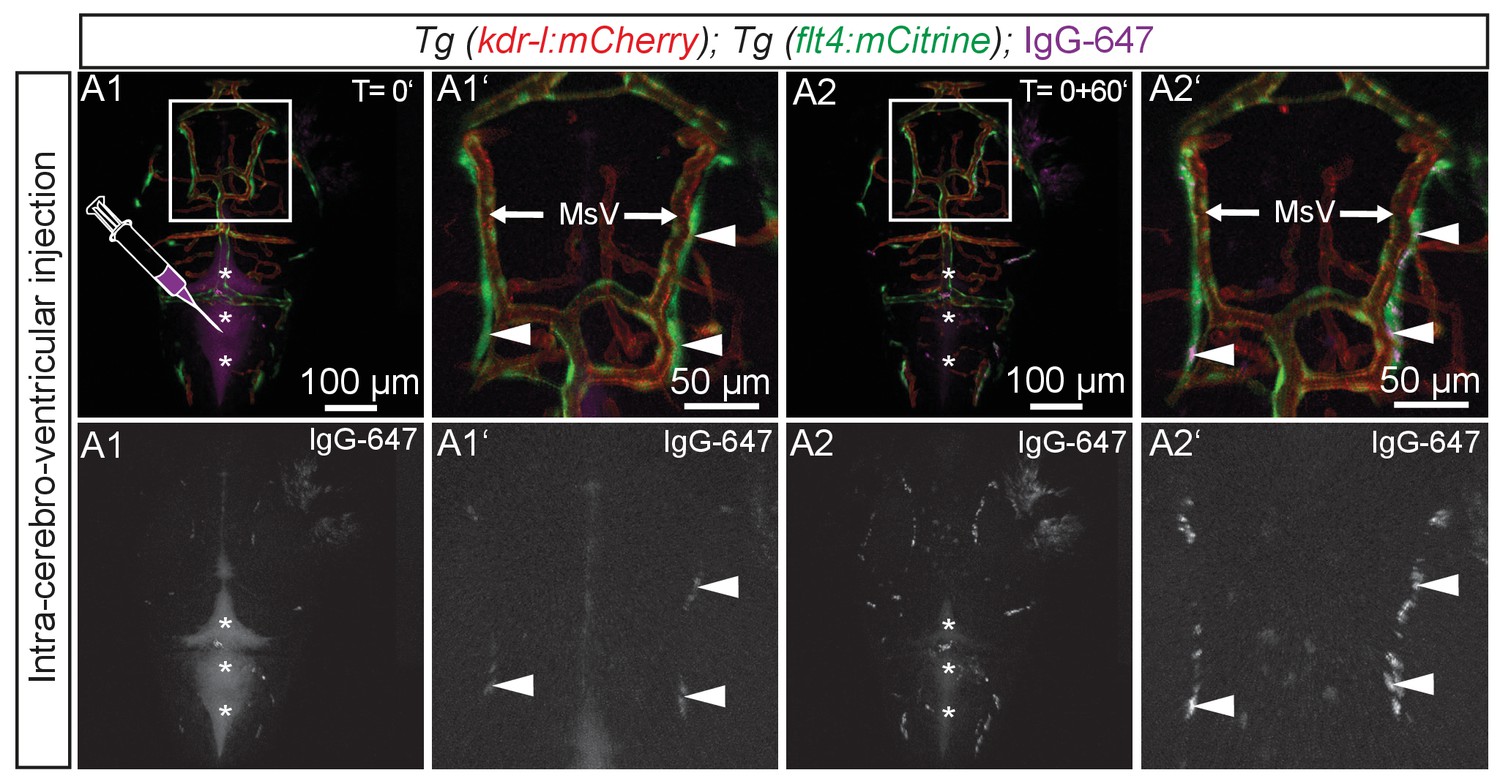
BLECs take up tracer from ventricles.
Blood vessels are highlighted in red (kdr-l:mCherry) and lympho-venous cells in green (flt4:mCitrine). IgG-647 is pseudo-colored in purple. (A1–A2) Time-lapse still images of representative dorsal confocal projection of 72hpf embryo injected with IgG-647 into the hindbrain ventricle. Immediately after injection, the tracer dye is confined to the hind- and midbrain ventricle (A1, asterisks) and only very faint signal is detected from flt4 positive kdr-l negative BLECs (A1, inset, white arrowheads). Within 60 min, the tracer cleared from the ventricular space (B1, asterisks) and accumulated at BLECs (A2, inset, white arrowheads). Data are representative of at least two independent experiments. BLEC, brain lymphatic endothelial cell; hpf, hours post fertilization; IgG-647, IgG-conjugated Alexa Fluor 674; MsV, mesencephalic vein.
Figure 7—figure supplement 4
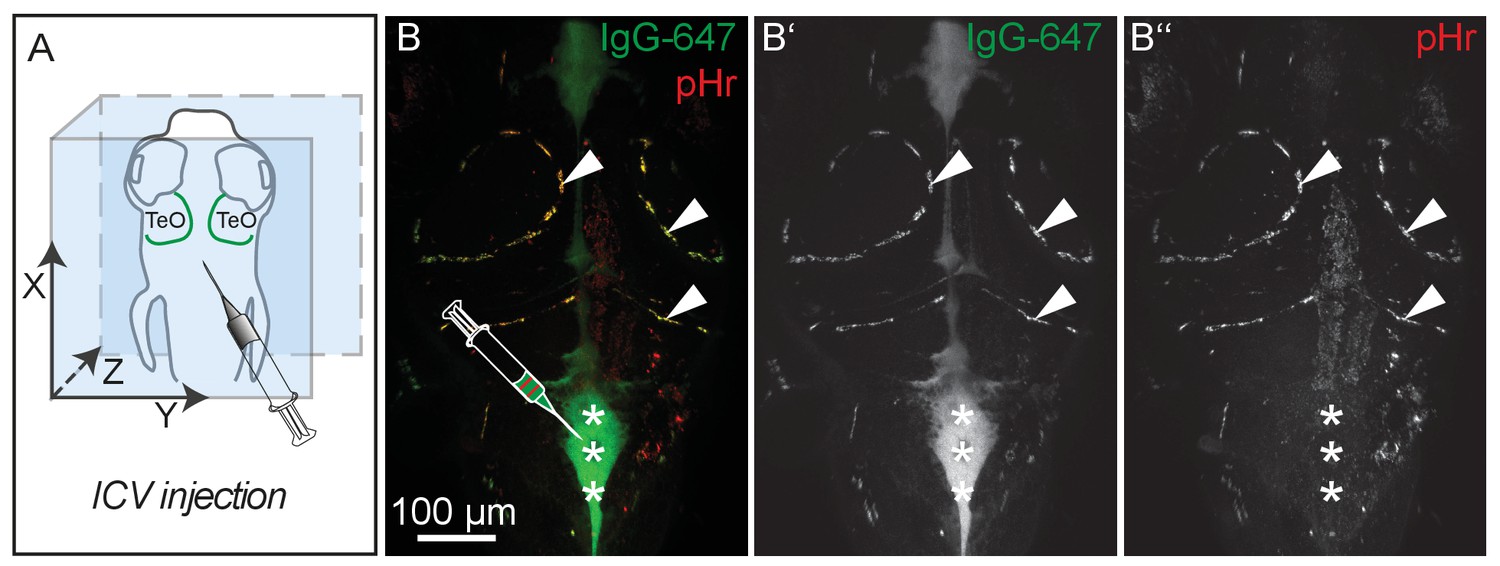
pH-sensitive pHrodo Red Avidin fluoresces more brightly after uptake into BLECs.
(A) Orientation of the zebrafish head and injection site of fluorescent dyes into the hindbrain ventricle of a 5dpf embryo as shown in B. (B) Representative dorsal confocal projection of 5dpf embryos injected with both IgG-647 and pHr. Injected IgG-647 is clearly visible in both the ventricles (asterisks) and BLECs (arrowheads), while pHr predominantly fluoresces within BLECs, probably reflecting localization to low pH compartments (B–B’’, asterisks and arrowheads). Data are representative of at least five independent experiments. BLEC, brain lymphatic endothelial cell; dpf, days post fertilization; ICV, intra-cerebro-ventricular; IgG-647, IgG-conjugated Alexa Fluor 674; TeO, Optic Tectum; pHr, pHrodo Red Avidin.
Figure 8 with 2 supplements
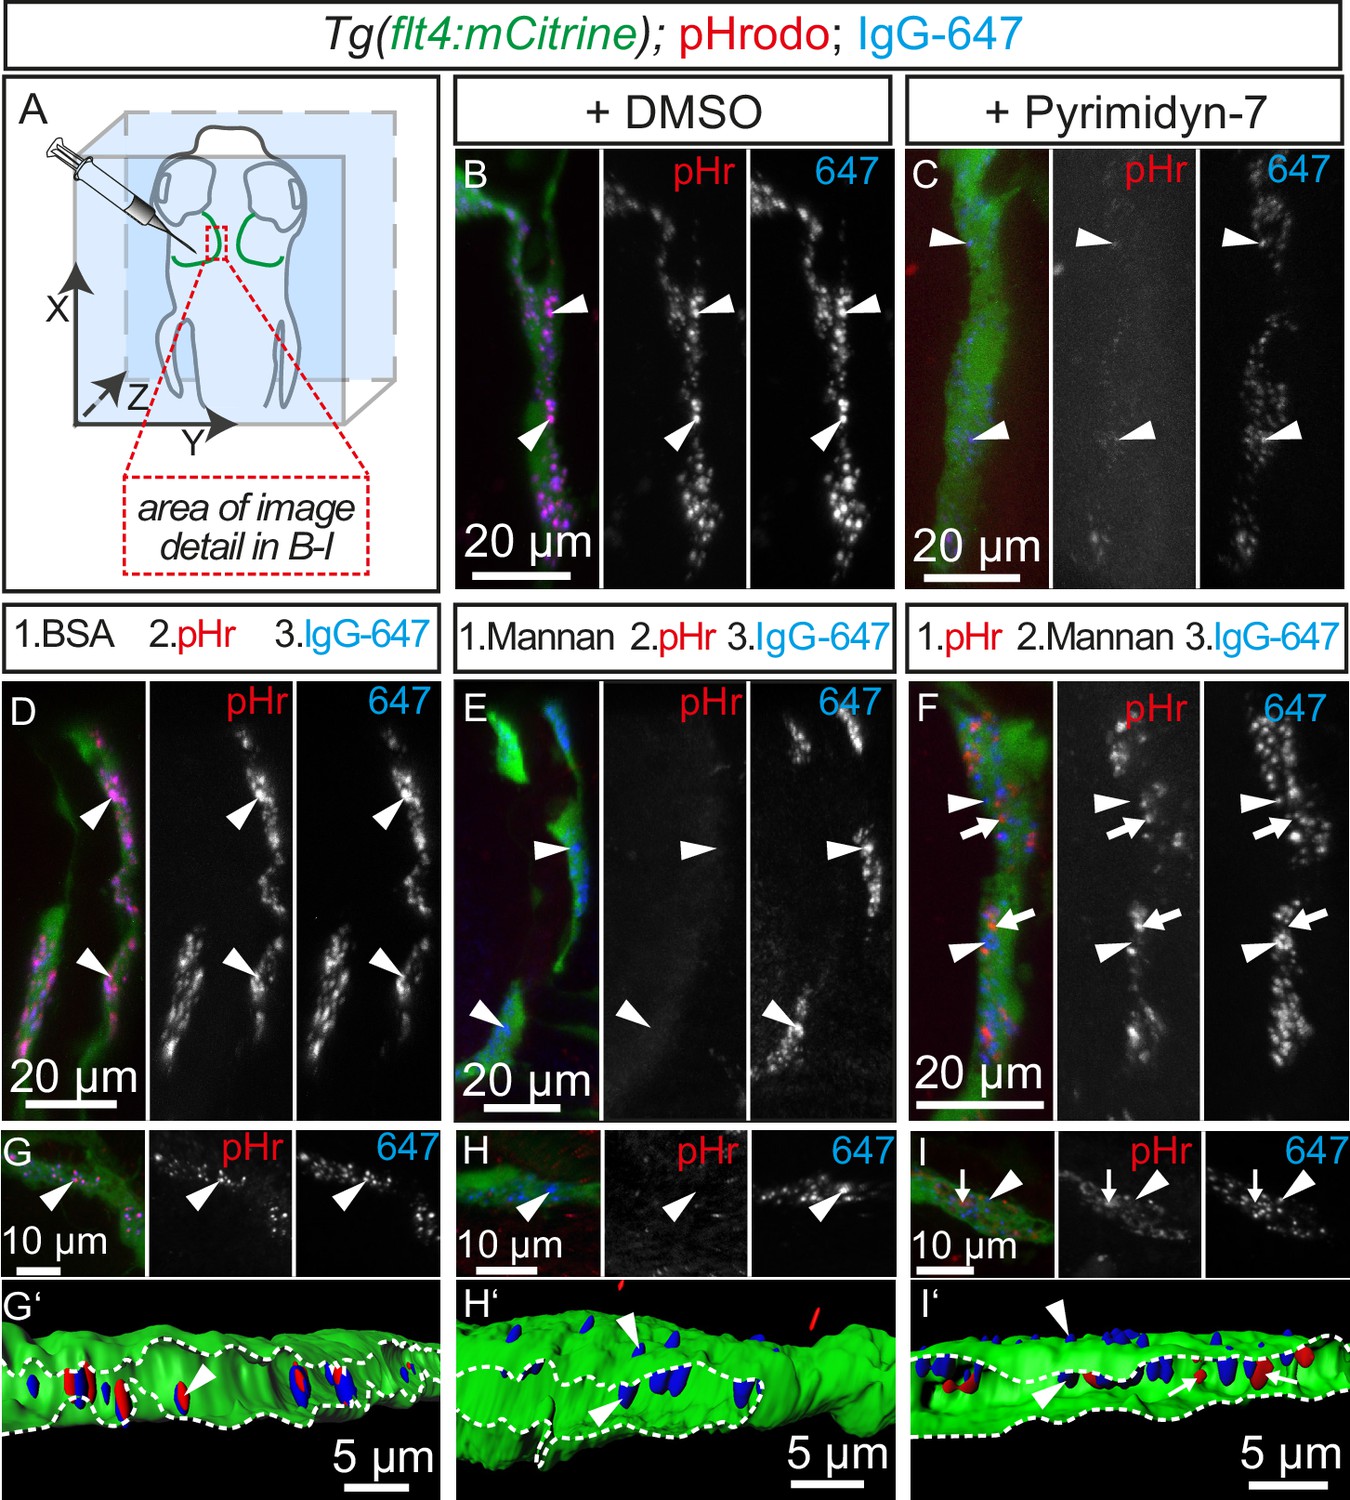
Tracer uptake by BLECs is inhibited by mannan administration.
(A) Overview of the zebrafish head region depicting intratectal injection of fluorescent dyes into the center of the TeO close to the meninges in 5dpf embryos. Red inset denotes area of image detail for representative dorsal confocal projections in B–I. (B) and (C) In DMSO treated fish co-injection of pHr and IgG-647 reveals high degree co-localization of both tracers in vesicles within mCitrine positive BLECs (B, white arrowheads). Inhibition of dynamin-dependent endocytosis with Pyrimidyn-7 results in reduced signal intensity from IgG-647 positive vesicles and an almost complete block of pHr uptake (C, white arrowheads). (D–F) Separate, consecutive injections of BSA or mannan with pHr and IgG-647. Injection of BSA, pHr and IgG-647 results in co-localization of both tracers in BLECs (D, white arrowheads). In contrast, initial injection of mannan completely blocks the uptake of pHr but not the accumulation of IgG-647 to BLECs (E, white arrowheads). However, initial injection of pHr followed by mannan and IgG-647 results in accumulation of both tracers in BLECs with hardly any co-localization (F, white arrowheads and arrows). (G–I) Same experimental setup as in D–F except the embryos were fixed in PFA five minutes after the last injection to enable higher resolution imaging. Area within the white dotted lines in 3D-reconstructions reveals the lumen of BLECs (G’,H’ and I’). In BSA control injected fish both dyes co-localize in intraluminal vesicles (G and G’, white arrowheads). In mannan injected fish, IgG-647 cannot be internalized completely but remains stuck at the cell surface, (H and H’, white arrowheads). Finally, initial injection of pHr reveals internalized vesicular pHr and membrane associated IgG-647 (I and I’, white arrows and white arrowheads). Data are representative of at least two independent experiments. BLEC, brain lymphatic endothelial cell; BSA, bovine serum albumin; dpf, days post fertilization; IgG-647, IgG-conjugated Alexa Fluor 674; PFA, paraformaldehyde; pHr, pHrodo Red Avidin; TeO, Optic Tectum.
Figure 8—figure supplement 1
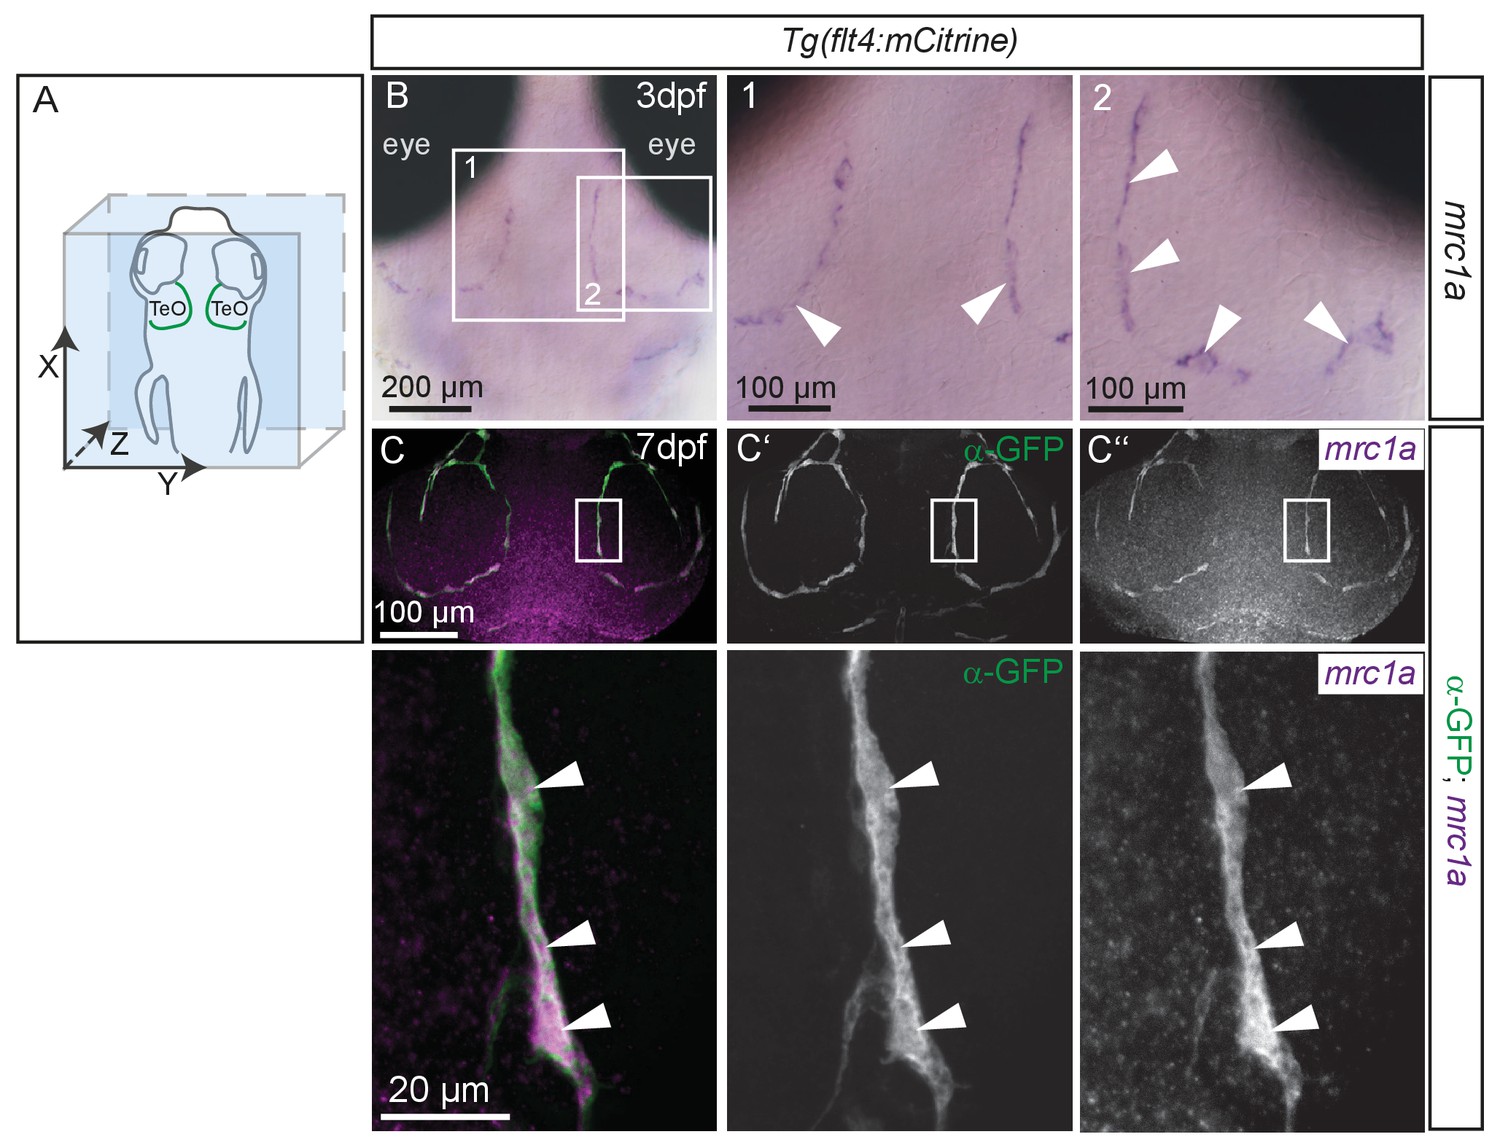
BLECs express mrc1a.
(A) Overview and orientation of zebrafish embryo imaged in B and C, with the arrangement of BLECs over the brain illustrated by the green lines. (B) In situ hybridization in 80hpf zebrafish embryos reveals mrc1a mRNA expression in BLECs (white arrowheads in insets 1 and 2). Note discontinuous staining pattern suggesting labeling of individual, loosely connected cells. (C) Double fluorescent in situ shows mrc1a mRNA (purple) expression persists in 7dpf embryos and specifically localizes to mCitrine expressing BLECs labelled with α-GFP antibody (green) (white arrowheads in insets). Data are representative of three independent experiments. BLEC, brain lymphatic endothelial cell; TeO, Optic Tectum.
Figure 8—figure supplement 2
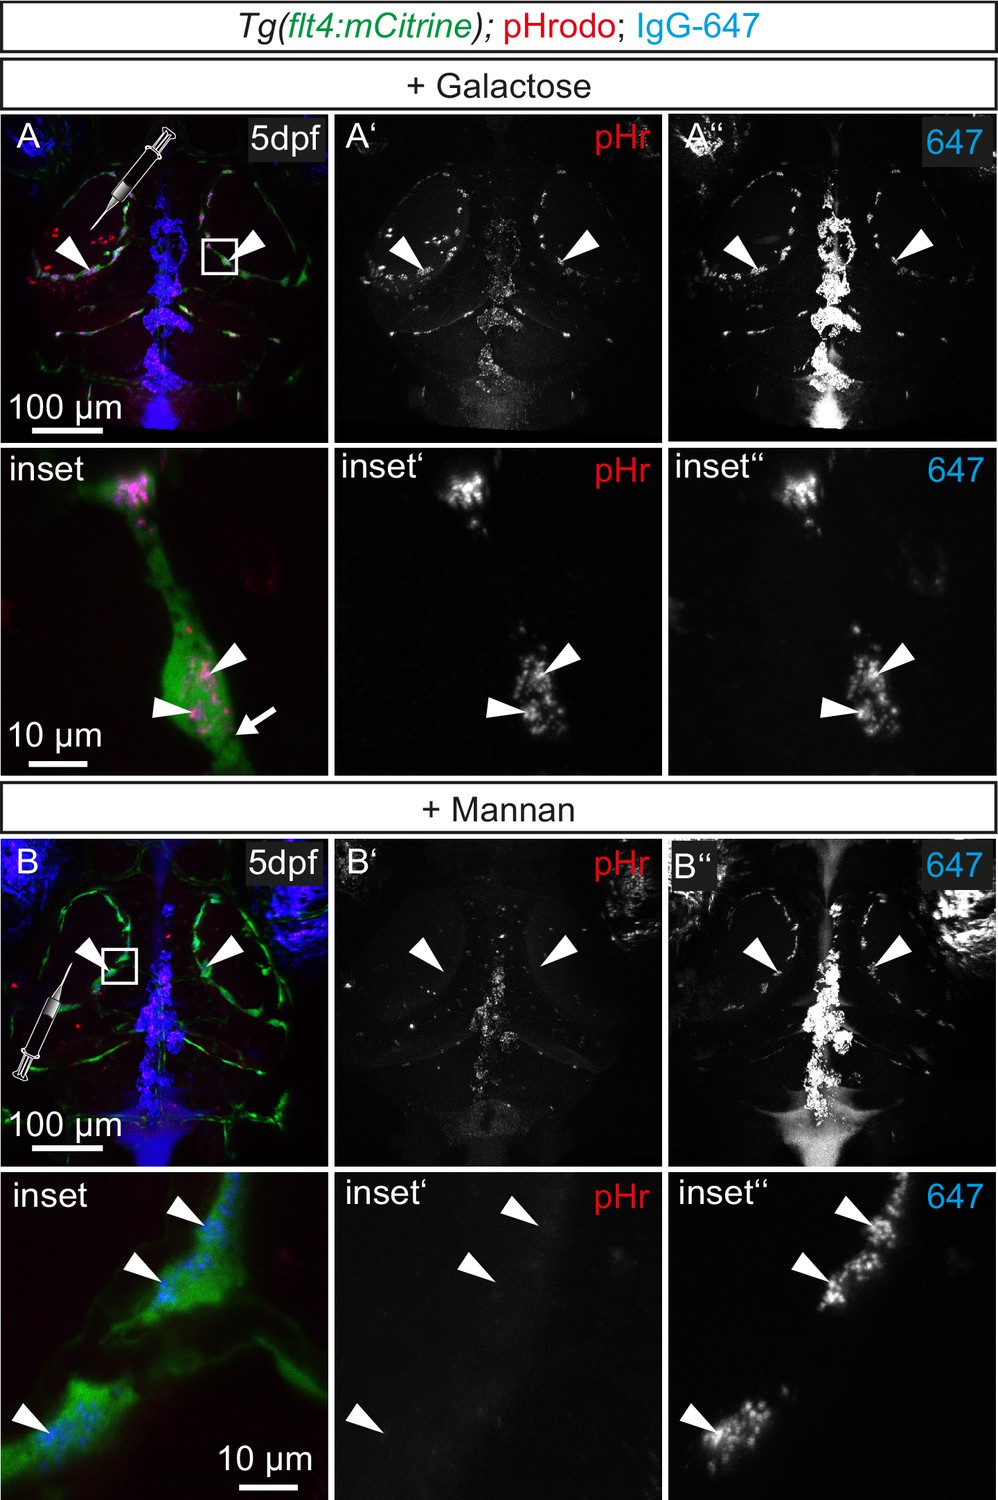
Tracer uptake by BLECs is not inhibited by galactose administration.
(A) and (B) Representative dorsal confocal projections of the zebrafish head region depicting intratectal injection of galactose (A) or mannan (B) prior to injection of fluorescent dyes into the center of TeO close to the meninges in 5dpf Tg(flt4:mCitrine) embryos. After injection of the monosaccharide galactose, flt4 positive BLECs still endocytose both pHr and IgG-647 (A, white arrowheads). In contrast, mannan administration blocks dye uptake indicated by the absence pHr positive vesicles in BLECs (B), while 647 can still bind to the PM (B, white arrowheads). BLEC, brain lymphatic endothelial cell; dpf, days post fertilization; IgG-647, IgG-conjugated Alexa Fluor 674; pHr, pHrodo Red Avidin; TeO, Optic Tectum.
Videos
Video 1
LECs migrate along the MsV in the Optic Tectum.
Complete time-lapse of partial lateral confocal projections of the zebrafish TeO from 56hpf to 72hpf as depicted in Figure 1, B1-B7. Blood vessels are highlighted in red (kdr-l:mCherry) and lympho-venous cells in green (flt4:mCitrine). Data are representative of at least five independent experiments. hpf, hours post fertilization; LEC, lymphatic endothelial cell; TeO, Optic Tectum.
Video 2
LECs form a loop over the zebrafish Optic Tectum at 5dpf.
3D rotation of a dorsal confocal projection of the zebrafish head region of a 5dpf embryo with blood vessels highlighted in red (kdr-l:mCherry) and lympho-venous cells in green (flt4:mCitrine). The flt4 positive LECs form a loop over the TeO and appear not to penetrate deeper into the brain. Halfway through the video a 3D surface rendering has been included marking kdr-l positive vessels in red and cells which strongly express flt4:mCitrine in green. Data is representative of at least five independent experiments. dpf, days post fertilization; LEC, lymphatic endothelial cell; TeO, Optic Tectum.
Video 3
LECs branch over the zebrafish Optic Tectum in 7 mm larvae.
3D animation of a dorsal confocal projection of the zebrafish head region of a 7 mm larva with blood vessels are highlighted in red (kdr-l:mCherry) and lympho-venous cells in green (flt4:mCitrine). flt4 positive LECs cover the TeO and appear not to penetrate deeper into the brain. Many LECs are in close association with kdr-l positive blood vessels. Also note the isolated LECs with no apparent contact to other LECs or blood vessels. Data is representative of at least three independent experiments. LEC, lymphatic endothelial cell; TeO, Optic Tectum.
Video 4
Fluorescent dyes show dynamic movement in BLECs.
Confocal projection of a one-hour video shows tracer movement in BLECs in 5dpf zebrafish head after injection of fluorescent dyes into the center of TeO close to the meningeal surface as shown in Figure 7A. IgG-647 tracer exhibits dynamic movements in two neighboring BLECs. Image stacks were recorded every two minutes. Data is representative of at least five independent experiments. BLEC, brain lymphatic endothelial cell; dpf, days post fertilization; IgG-647, IgG-conjugated Alexa Fluor 674; TeO, Optic Tectum.
Video 5
BLECs take up tracer from ventricles.
Complete 2.5 hr time-lapse of dorsal confocal projections of the zebrafish head region in a 72hpf embryo after IgG-647 ICV injection as depicted in Figure 7—figure supplement 3. Blood vessels are highlighted in red (kdr-l:mCherry) and lympho-venous cells in green (flt4:mCitrine). IgG-647 is pseudo-colored in purple. Note uptake of tracer into flt4 positive BLECs over time. Image stacks were recorded every five minutes. Data are representative of at least three independent experiments. BLEC, brain lymphatic endothelial cell; hpf, hours post fertilization; IgG-647, IgG-conjugated Alexa Fluor 674.
Video 6
BLECs internalize fluorescent dyes.
3D animation of a dorsal confocal projection of the zebrafish head region at 5dpf injected with pHr into the TeO as depicted in Figure 7A. Lympho-venous cells are in green (flt4:mCitrine), pHr in red. BLECs strongly label with the pH-sensitive dye pHrodo (pHr) indicating tracer internalization. Signal from eye and skin pigmentation is auto-fluorescence. Origin of dot-like pHr signal not associated to BLECs is unknown but may represent tracer aggregation. Data is representative of at least five independent experiments. BLEC, brain lymphatic endothelial cell; dpf, days post fertilization; TeO, Optic Tectum; pHr, pHrodo Red Avidin.
Tables
Table 1
Primers used for genotyping ccbe1hu10965 embryos.
| Primer name | Sequence |
|---|---|
| ccbe1_TALEN_Control-FW | GAACCTATGGAAGCCGATCA |
| ccbe1_TALEN_Control-Rv | GCCTACAGACAATACACAAACACA |
Table 2
Primers used for synthesis of ISH probes.
| Primer pair | Gene / Region | Sequence | Probe lengths |
|---|---|---|---|
| Pair 1: Forward primer | mrc1a/3’UTR | CTAGGCCTGCGATTGGAGAG | 547bps |
| Pair 1: Reverse primer | mrc1a/3’UTR | CATTAACCCTCACTAAAGGGAACTGCCACCTCATGTCCAGTT | |
| Pair 2: Forward primer | mrc1a / Exon 2 | ACACCAGCTACTTCCTTATCTACA | 401bps |
| Pair 2: Reverse primer | mrc1a / Exon 2 | CATTAACCCTCACTAAAGGGAATTGATTTCCATGAGAACATAAATCGT | |
| Pair 3: Forward primer | mrc1a/3’UTR | CCACAGACATAGCTCCCACA | 987 bp |
| Pair 3: Reverse primer | mrc1a/3’UTR | GAAATAATTAACCCTCACTAAAGGGACCAGCAGTCTATTTGGCTATTC |
Download links
A two-part list of links to download the article, or parts of the article, in various formats.
Downloads (link to download the article as PDF)
Open citations (links to open the citations from this article in various online reference manager services)
Cite this article (links to download the citations from this article in formats compatible with various reference manager tools)
Intracellular uptake of macromolecules by brain lymphatic endothelial cells during zebrafish embryonic development
eLife 6:e25932.
https://doi.org/10.7554/eLife.25932


