Glycolytic reliance promotes anabolism in photoreceptors
- Harvard Medical School, United States
- Howard Hughes Medical Institute, Harvard Medical School, United States
Figures
Figure 1 with 4 supplements
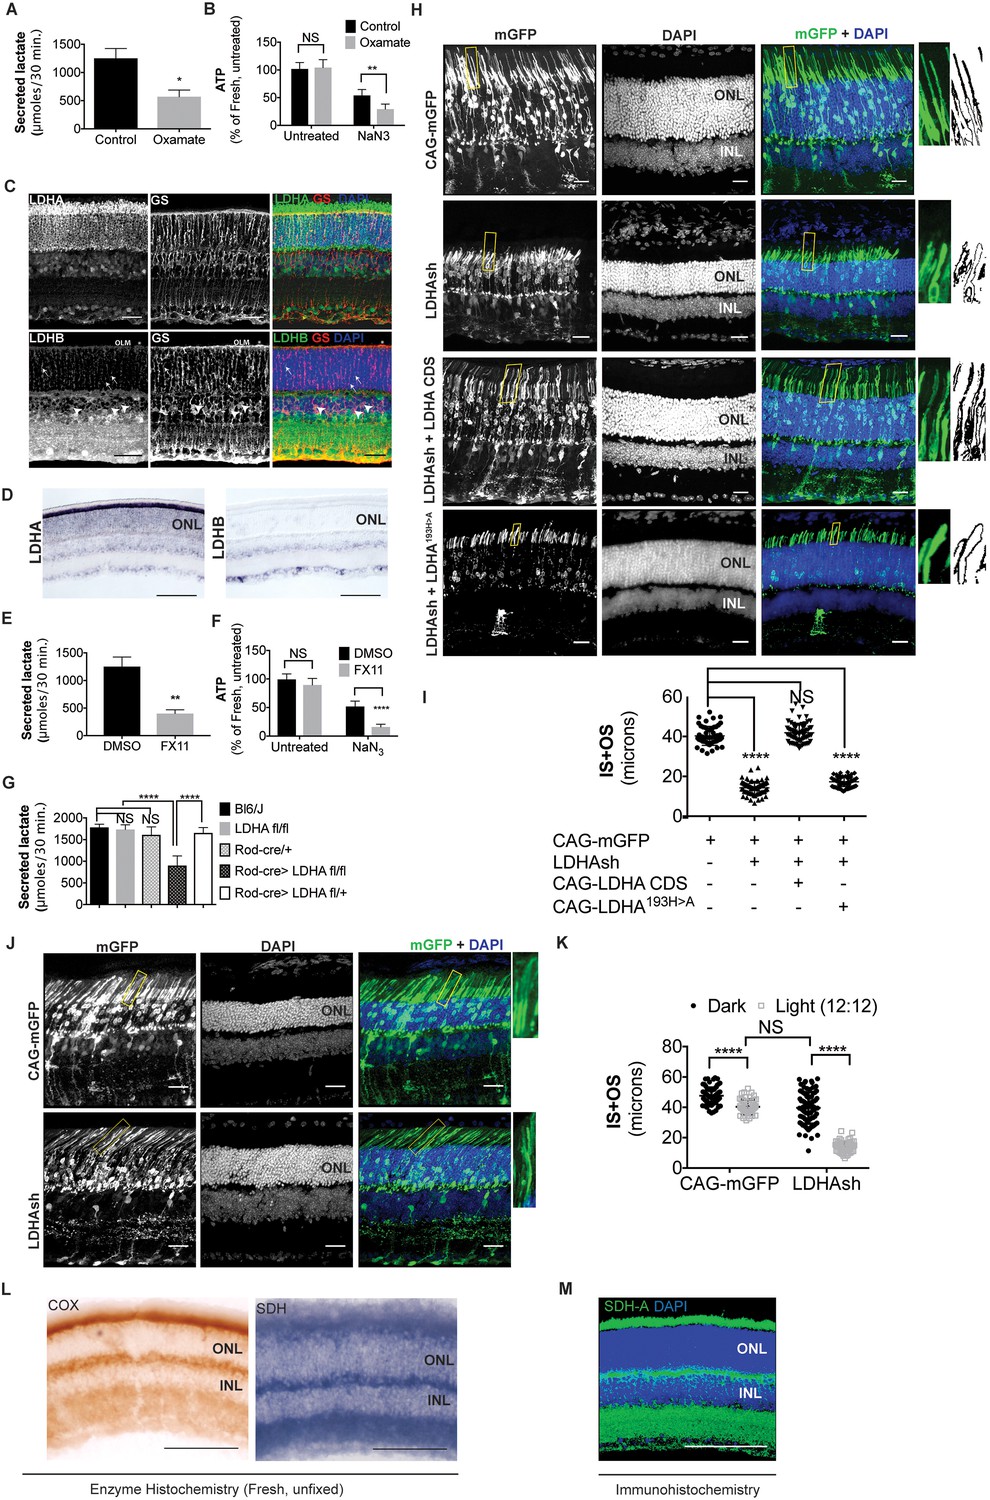
Ldha-dependent aerobic glycolysis and outer segment maintenance in photoreceptors.
(A) Freshly explanted retinas were treated with the LDH inhibitor, sodium oxamate, for 8 hr in explant culture medium, transferred to Krebs’-Ringer's for 30 min, and lactate was measured in the supernatant. Control (n = 5), Oxamate (n = 4). (B) Freshly explanted retinas were treated with oxamate or NaCl (control) in explant culture medium for 8 hr, followed by treatment with NaN3 or NaCl (untreated group) in Krebs’-Ringer's medium for 30 min. ATP per retina was then measured. n = 7, Control untreated; n = 8, Oxamate untreated n = 8, Control NaN3; n = 8, Oxamate NaN3. (C) Expression of Ldha and Ldhb as determined by IHC. Glutamine synthetase (GS), a Mueller glia-specific marker, colocalized with LDHB in the cell bodies (arrowheads), processes ensheathing the photoreceptors (arrows) and the outer limiting membrane (OLM, *). Scale bar, 50 μm. (D) ISH for Ldha and Ldhb. Ldha RNA displayed photoreceptor-enriched expression while Ldhb RNA was not observed in photoreceptors. Scale bar, 100 μm. (E, F) Freshly explanted retinas were treated with FX11 or DMSO for 8 hr and transferred to Krebs’-Ringer's for 30 min and secreted lactate was measured (E) n = 5, DMSO; n = 6, FX11, or they were transferred to Krebs’-Ringer's buffer with NaN3 or NaCl (untreated group) for 30 min for ATP quantitation (F). ATP per retina was measured at the end of the assay. n = 8, DMSO untreated; n = 8, FX11 untreated; n = 9, DMSO NaN3; n = 7, FX11 NaN3. (G) Freshly explanted retinae were transferred to Krebs’-Ringer's for 30 min and secreted lactate was measured. n = 8, Bl6/J; n = 8, Ldhafl/fl; n = 8, Rod-cre; n = 16, Rod-cre> Ldhafl/fl; n = 8, Rod-cre> Ldhafl/+. (H) Photoreceptor outer segment phenotype 42–45 days following in vivo electroporation of a knock-down construct (shRNA) for Ldha. CAG-mGFP was used for coelectroporation. Plasmid combinations listed on the left. Magnification of areas outlined in yellow is displayed on right with threshold-adjusted rendering to highlight inner and outer segments. Scale bar, 25 μm. (I) Quantification of inner+outer segment (IS+OS) lengths. n = 53–74 photoreceptors, 4–5 retinae. (J) Photoreceptor outer segment phenotype of dark-reared animals. Electroporated pups were transferred to dark on the day of eye opening (P11) and reared with their mothers for 3 weeks. (K) Quantification of inner+outer segment lengths of (J). n = 53–83 photoreceptors, 4–5 retinae. (L) Colored end products of redox reactions catalyzed by COX and SDH enzymes in retinal tissue. Scale bar, 200 μm. (M) IHC for SDH-A subunit in adult retina. Scale bar, 200 μm. ONL, outer nuclear layer. INL, inner nuclear layer. Data, Mean±SD. Statistics, unpaired, two-tailed t-test with Kolmogorov-Smirnov correction for panels A, E; two-way ANOVA with Tukey’s correction for panels B, F and K; one-way ANOVA with Tukey’s multiple comparison test for panels G, I.
-
Figure 1—source data 1
Source data for Figure 1A,B,E,F and G.
- https://doi.org/10.7554/eLife.25946.004
Figure 1—figure supplement 1
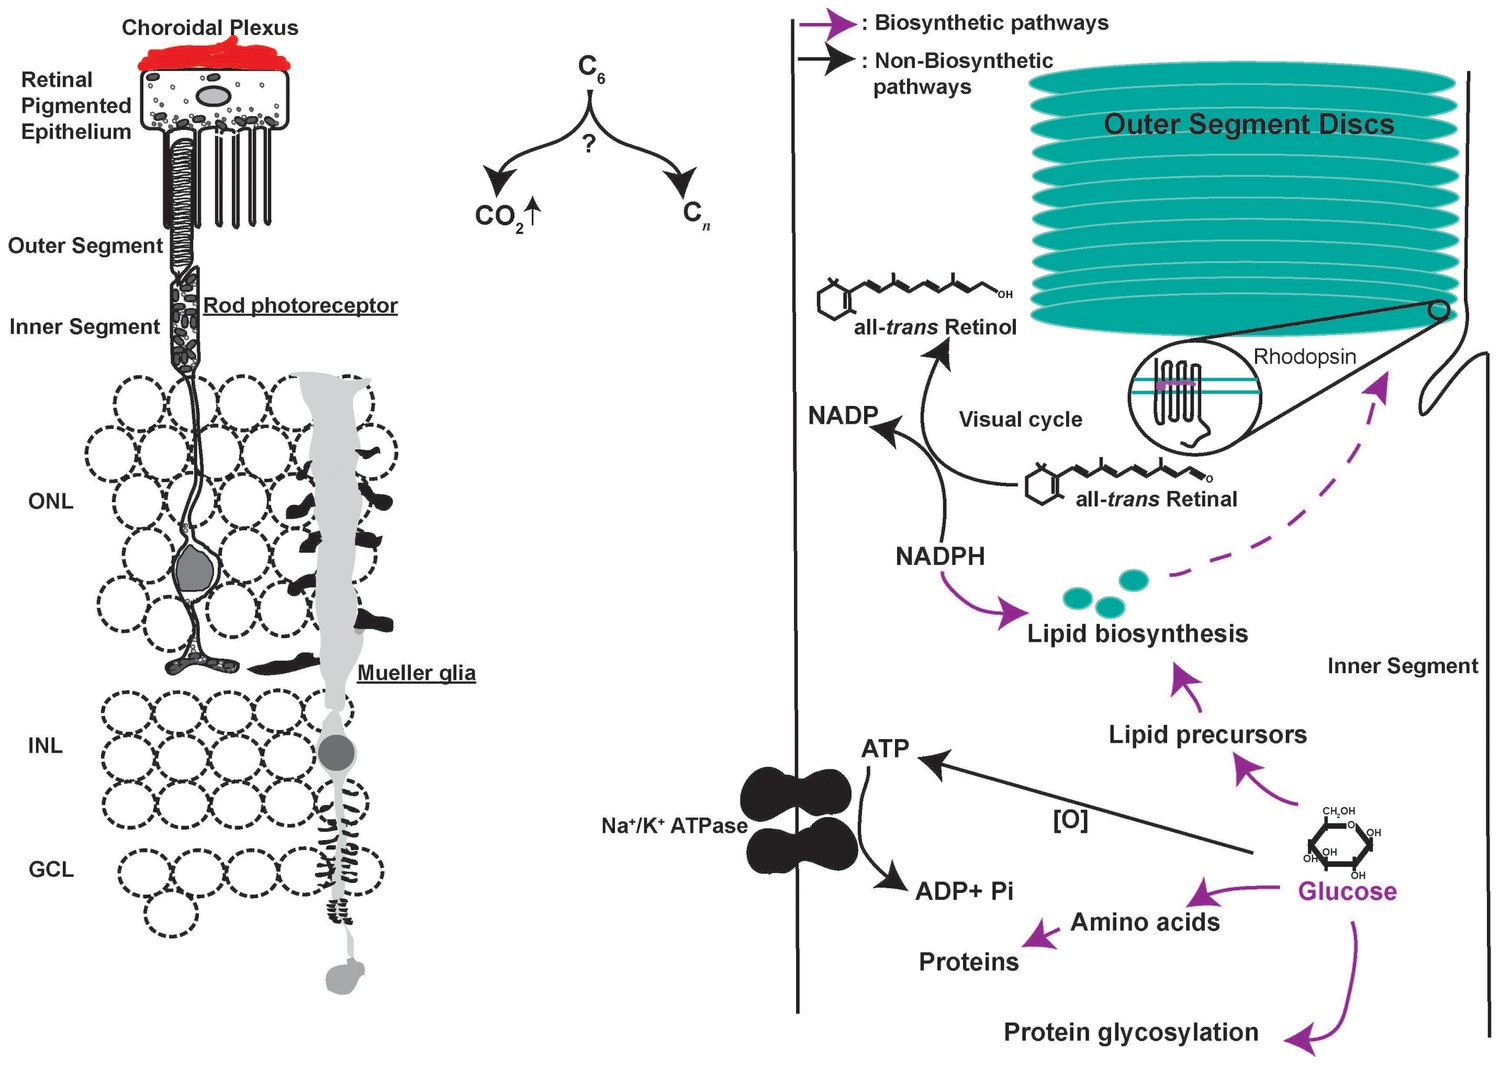
Metabolic challenges of photoreceptor cell.
Schematic of the rod photoreceptor and RPE-Outer segment proximity shown on the left. photoreceptors are also ensheathed by Mueller glia that span the thickness of the retina. A meshwork of blood capillaries, the choroidal plexus, supplies nutrients and oxygen to the photoreceptors. These cells shed a fraction of their outer segment to be phagocytosed by the RPE. We estimated, based on published findings, that on diurnal basis, the shed discs account for ~70X the lipid present in the cell outside the outer segment (LaVail, 1976) and necessitate ~2X the rate of protein synthesis if shedding does not occur (Kwok et al., 2008). Thus, outer segment shedding poses a considerable biosynthetic demand on the photoreceptors. Intense metabolic activity compels judicious allocation of metabolites to competing pathways (Right). Each photoreceptor consumes ~108 ATP s−1 in darkness primarily via the action of Na+/K+ ATPase. Glucose oxidation can generate the ATP, though this would necessitate regulated channeling of glucose to biosynthetic vs catabolic pathways. Similarly, each photon absorption results in formation of all-trans Retinal, which needs to be reduced to complete the visual cycle using NADPH in stoichiometric amounts. NADPH also plays an important role in lipid biosynthesis and countering oxidative stress, which is a byproduct of mitochondria-based oxidative phosphorylation. The central question in understanding photoreceptor physiology thus is, how carbons are allocated toward biosynthetic vs catabolic processes? ONL, outer nuclear layer. INL, inner nuclear layer. GCL, ganglion cell layer.
Figure 1—figure supplement 2
Characterization of Ldha knockdown and mitochondrial function.
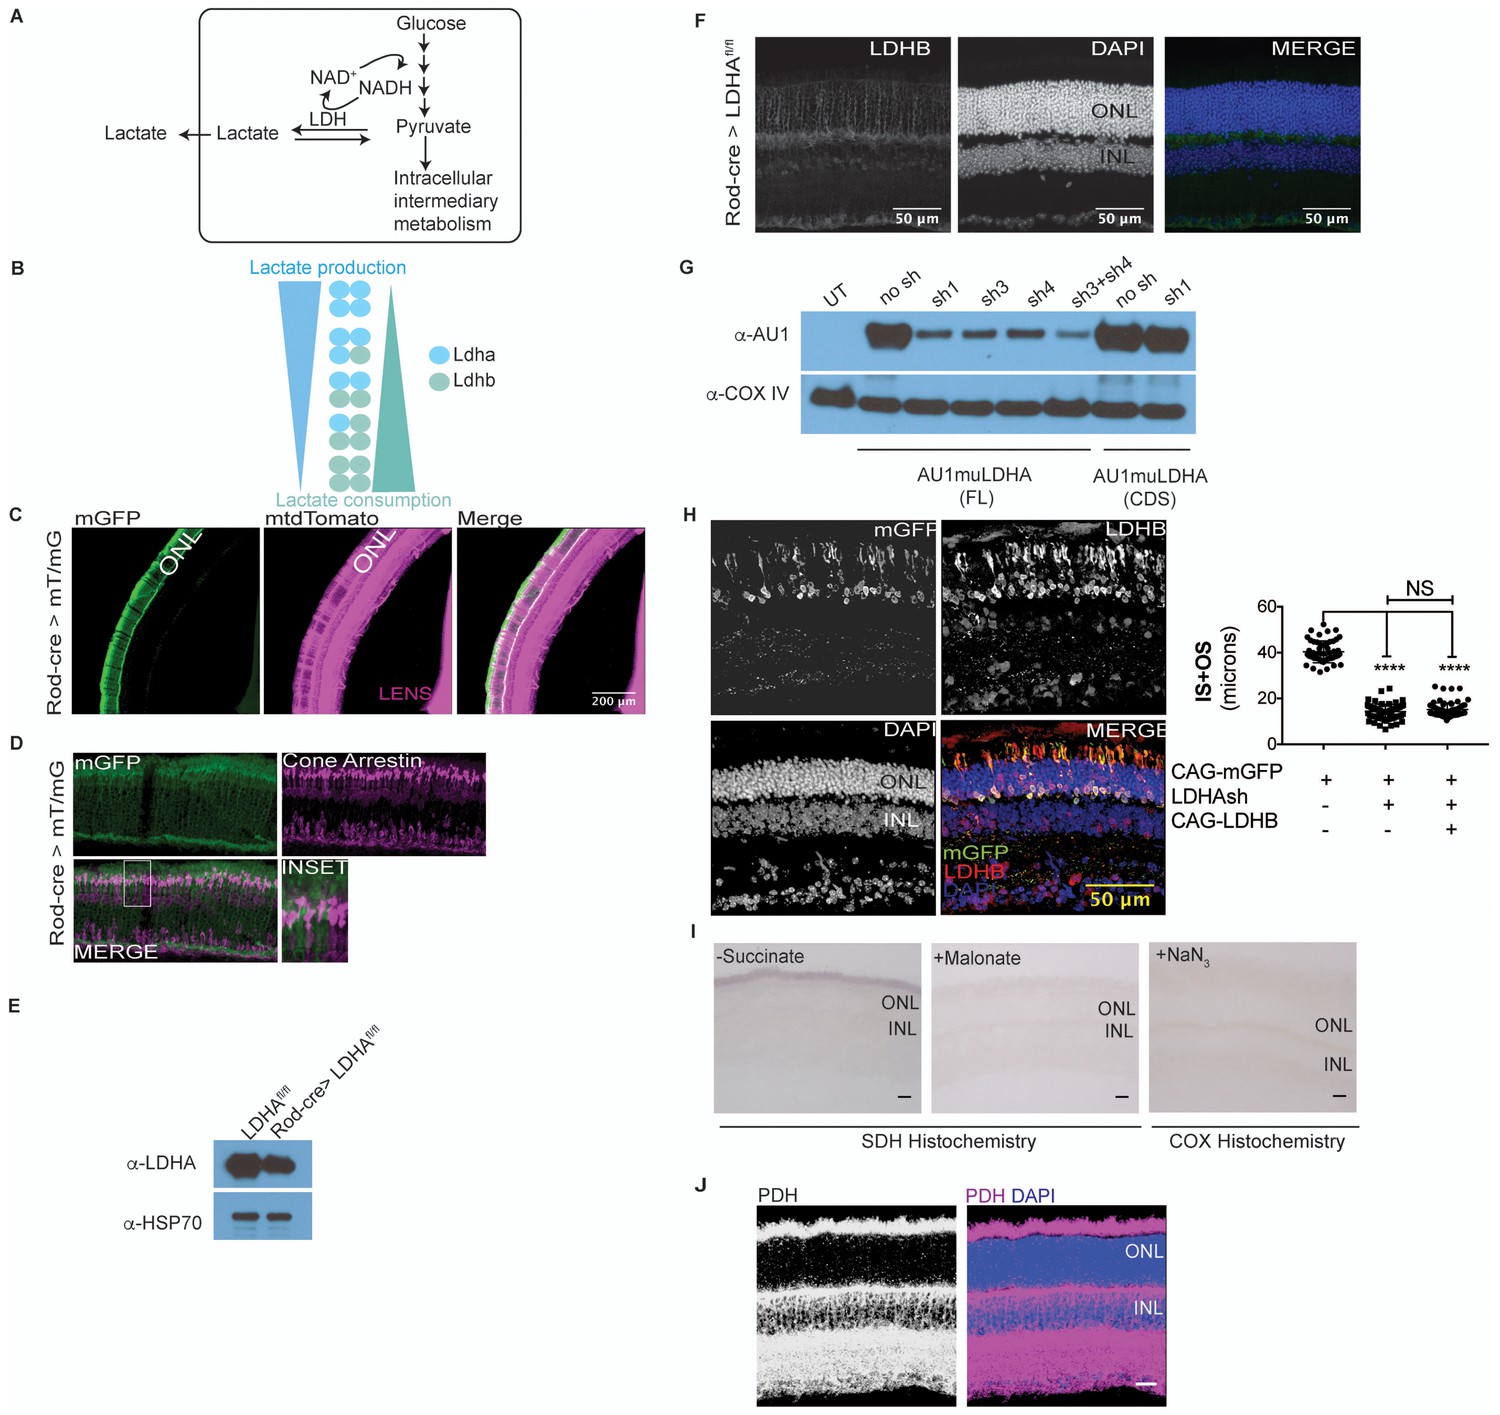
(A) Lactate dehydrogenase (LDH) catalyzes equilibrium between pyruvate and lactate. Of importance is to note the 1:1:1:1 molar stoichiometry between NAD+, pyruvate, lactate and NADH underscoring the concept that formation of lactate results in molar equivalent contribution to the cytosolic NAD+ pool which in turn serves as a cofactor to generate molar equivalents of pyruvate via the glycolytic pathway. Secreted lactate represents pyruvate-derived carbons that were unavailable to that cell for other metabolic pathways. (B) LDH is composed of four subunits with the two most common encoded by the Ldha and Ldhb genes. The five tetrameric compositions are considered to differ in the ability to produce or consume lactate, although the net reaction direction would be dictated by thermodynamics and flux considerations. (C) Retinal cross section from the 8 week old F1 progeny of Rod-cre and mT/mG parents. mtdTomato is constitutively expressed while mGFP is expressed in a cre-dependent manner. (D) Retina in (c) stained for cone arrestin, a cone photoreceptor marker. (E) Immunoblot probing for LDHA expression in 3-week-old retinal lysates of Rod-Cre> Ldhafl/fl and age-matched Cre− (Ldhafl/fl) siblings. Six retinae from 3 mice were pooled for lysate preparation in each group. (F) IHC for Ldhb on a retinal cross section of a 6-week-old Rod-Cre> Ldhafl/fl mouse. (G) Representative immunoblots of 293 T cells transfected with either full length (FL) or the coding region (CDS) of AU1-tagged murine LDHA driven by the CAG promoter. Cells were cotransfected with constructs encoding short hairpins targeting the murine Ldha transcripts. The short hairpin sh1 targets the 3’ untranslated region (UTR) of the mouse Ldha transcript while sh3 and sh4 target the coding region. Cox IV was used as a loading control. UT, untransfected. (H) Photoreceptor outer segment phenotype 40 days following in vivo electroporation of LDHAsh, CAG-rLDHB. CAG-mGFP was used for coelectroporation. For Ldhb staining, the gain during acquisition was adjusted to prevent oversaturation of signal intensity in overexpressing photoreceptors so as to preserve detail. Live histogram of pixel-intensity distribution was used in order to prevent clipping at the far-right end of intensities. Thus, Ldhb staining intensity in the IPL seems much lower compared to those observed in other figure panels in this study. Right panel, quantification of inner+outer segment lengths. Data, Mean±SD (n = 75 photoreceptors, 3 retinae for LDHAsh+ CAG-rLDHB group). Statistics, One-way ANOVA with Tukey’s multiple comparison test. (I) Control histochemical reactions for SDH and COX activity. SDH reaction on unfixed retinal tissue without the substrate or in presence of Malonate, a competitive inhibitor. The light blue precipitate in –Succinate reaction was observed in outer segments. It differed from the intense purple precipitate when the substrate was included and does not match SDH localization in the retina. COX was inhibited by sodium azide (+NaN3) and failed to form the end product of the histochemical reaction. (J) Confocal image of retinal cross section stained with anti-PDHE1 antibody that recognizes a subunit of pyruvate dehydrogenase (PDH). Highest signal is seen in the photoreceptor inner segments, as well as the OPL and IPL synaptic layers. Scale bar, 25 μm.
Figure 1—figure supplement 3
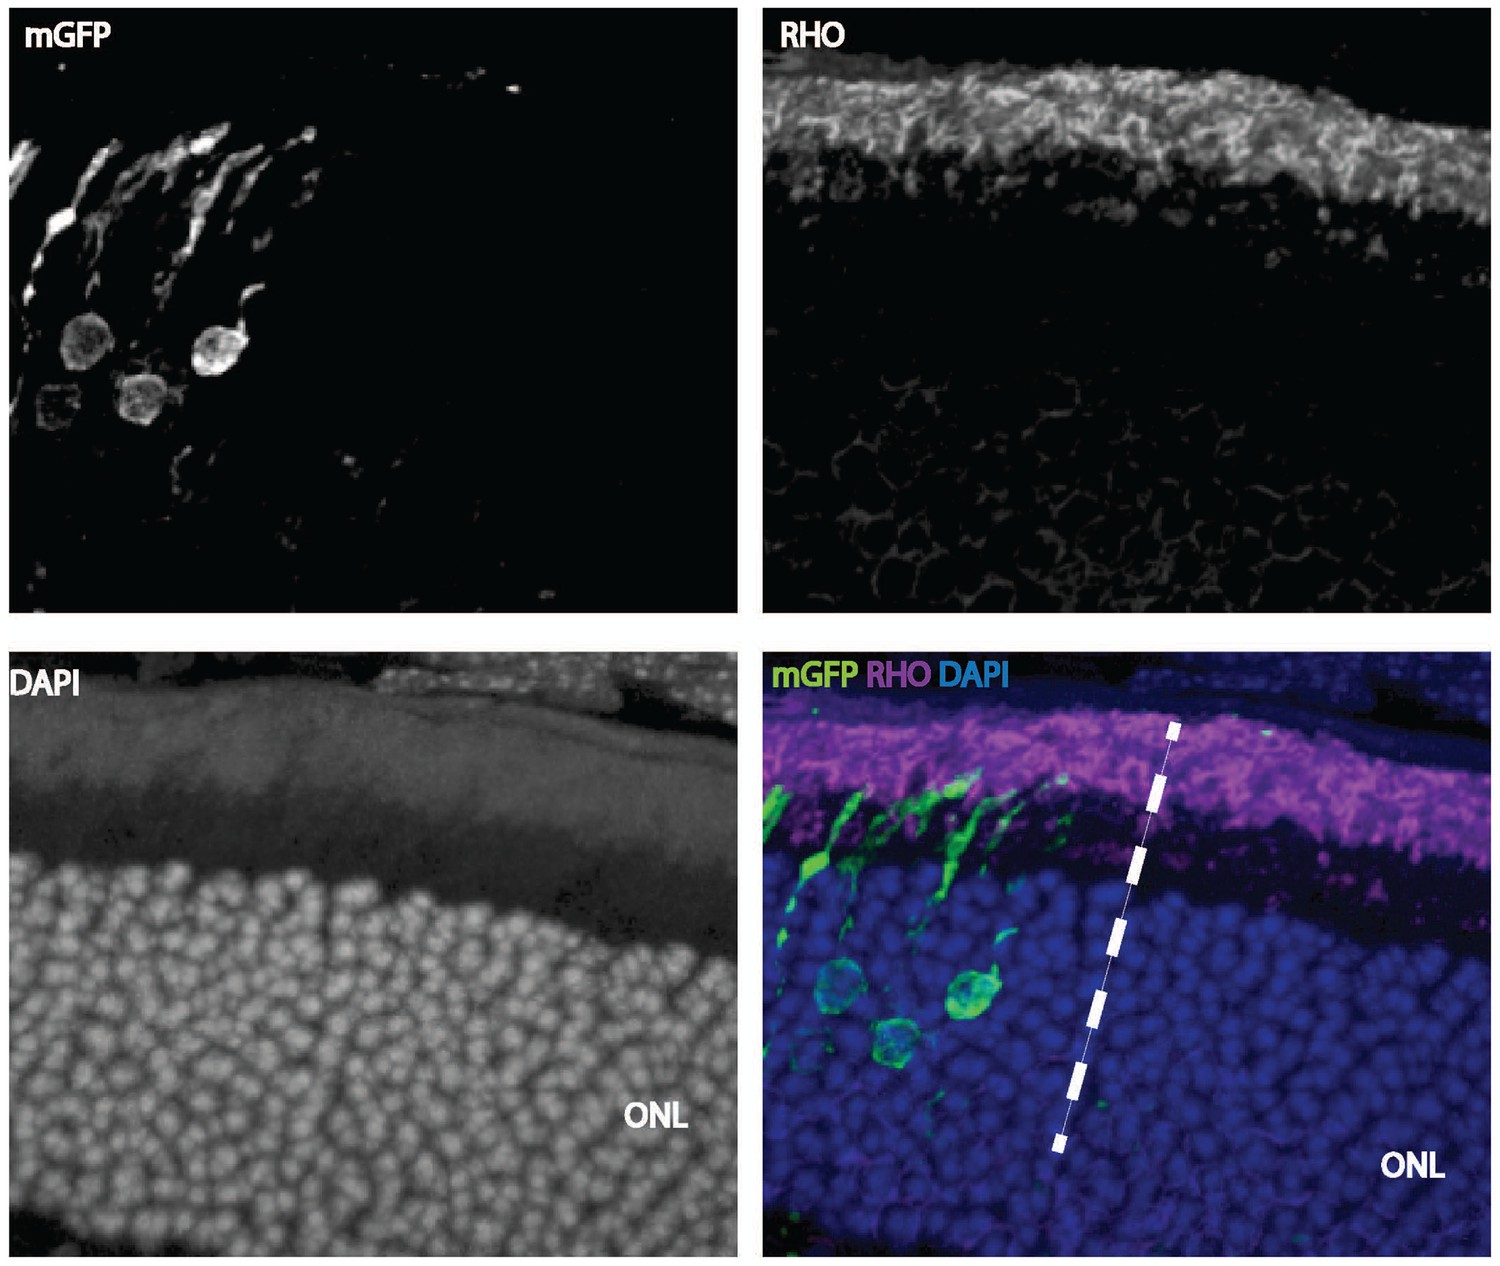
Cell-autonomous effect of Ldha knockdown.
Rhodopsin staining of a 42-day-old mouse retina electroporated with a shRNA construct targeting Ldha. Magnification of a retinal cross section focusing at the edge of the electroporation boundary is shown to depict the outer segments within the electroporated patch (left side of the dotted line) and outside (right-hand-side of the dotted line). CAG-mGFP was used as a coelectroporation plasmid.
Figure 1—figure supplement 4
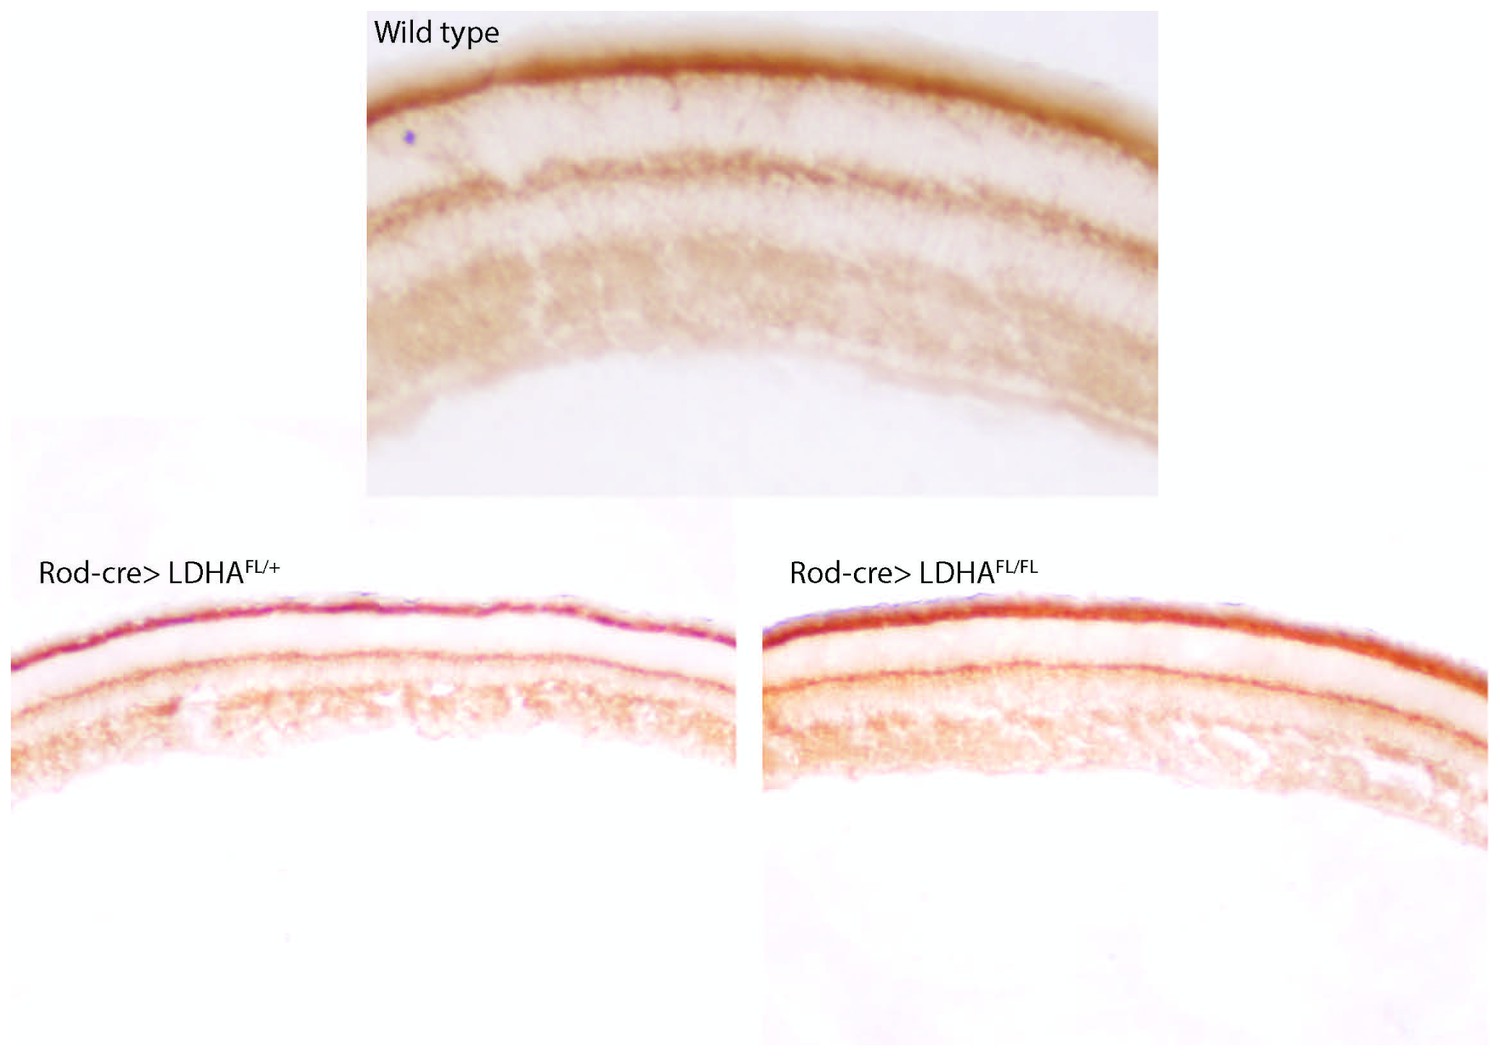
Mitochondrial activity after Ldha loss-of-function.
Cytochrome oxidase (COX) activity after deletion of Ldha in the rods (Rod-cre> Ldhafl/fl, bottom right) of a 7-week animal. Age-matched heterozygous sibling (Rod-cre> Ldhafl/+, bottom left) is included as control. For comparison, a retina from wild-type mouse (previously presented in Figure 1) is included (top panel).
Figure 2 with 1 supplement

Targeting allostery reveals glycolytic reliance for outer segment maintenance.
(A) Constructs for spatio-temporal control of expression of Tigar and Pfkfb3. DsRed used as the cre reporter, mGFP as a coelectroporation marker. (B) Scheme for electroporation and tamoxifen induction. i.p, Intraperitoneal. (C, D) IS+OS length were measured following introduction of Tigar (n = 72 cells), PFKB3 (n = 72 cells), and Tigar and Pfkfb3 constructs (n = 78), shown in (A). Controls were -tamoxifen (n = 62) and +tamoxifen (n = 74). Scale bar, 50 μm. Data are Mean±SD. One-way ANOVA with Tukey’s correction. Outlined areas magnified to show IS and OS morphology. (E) AAV genomes for expression of mGFP (AAV-mGFP) or Tigar (AAV-TIGAR). (F) Cross-sections of AAV-mGFP alone or AAV-TIGAR (coinjected with AAV-mGFP) infected retinae harvested at P28 imaged for mGFP expression. (G) Intracellular lactate normalized for total protein was quantified for retinae infected with AAV-mGFP (Control) or AAV-mGFP + AAV-TIGAR. Data represented as percentages relative to age-matched, freshly isolated retinae. Data, Mean±SD. Unpaired, two-tailed t-test with Kolmogorov-Smirnov correction for non-Gaussian distribution. ONL, outer nuclear layer.
-
Figure 2—source data 1
Source data for Figure 2G.
- https://doi.org/10.7554/eLife.25946.010
Figure 2—figure supplement 1
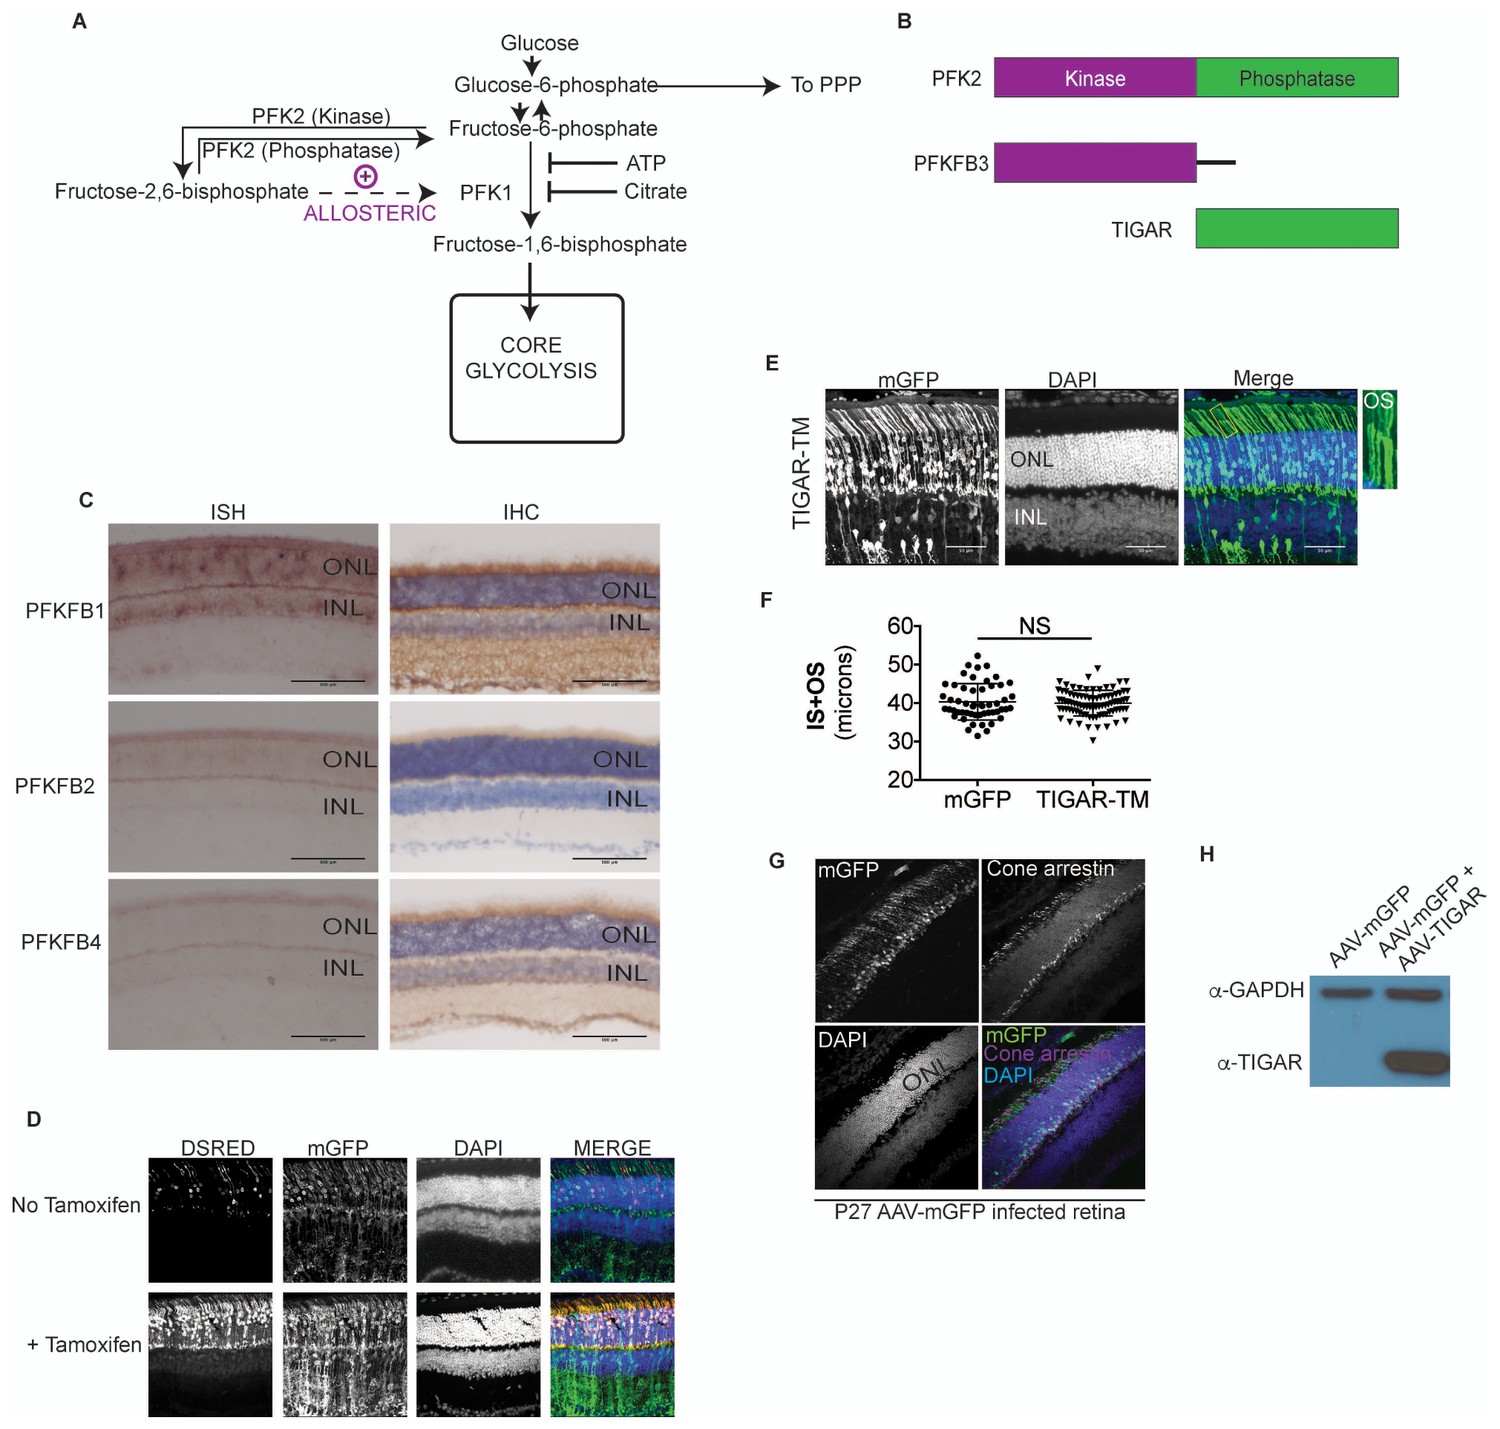
Allosteric regulation in photoreceptor glycolysis.
(A) Schematic of the glycolytic pathway. (B) PFK2 isoenzyme polypeptide structure depicting the kinase and phosphatase domains. PFKFB3, has ~700 times kinase to phosphatase activity. Conversely, TIGAR (TP53-induced glycolysis and apoptosis regulator) is functionally similar to the phosphatase domain of PFK2. (C) Expression of PFK2 isoenzymes in the retina. In situ hybridization (left panels) for Pfkfb1, Pfkfb2, and Pfkfb4 on retinal sections and representative immune-stained sections (right panels). (D) Confocal images of retinal cross-sections after in vivo electroporation of CAG-mGFP, RHO-ERT2CreERT2 and DsRed cre reporter. In absence of tamoxifen, some leaky expression of the DsRed reporter was seen (top panels), but it remained restricted to the photoreceptors. In tamoxifen injected mice (bottom) induction of dsRed was seen that remained confined to the photoreceptor layer. mGFP serves as electroporation control. (E) Cross sections of CAG-Tigar-TM electroporated retinae at postnatal day 45. CAG-mGFP was used as coelectroporation marker. Magnification of outlined area to reveal outer segment morphology. OS, outer segment. (F) Expression Tigar-TM (n = 85 cells, 5 retinae) did not result in significant reduction in IS+OS length. Unpaired, t-test with Kolmogorov-Smirnov correction. (G) Cross-section of a 27-day -ld, AAV-mGFP infected retina stained for cone arrestin. The mGFP expression remained confined to the photoreceptor layer and cone arrestin colocalization was not observed. (H) Representative immunoblot of retinal lysates from 28 day old mice infected with AAV-mGFP alone or AAV-mGFP + AAV-TIGAR. GAPDH served as loading control.
Figure 3 with 6 supplements
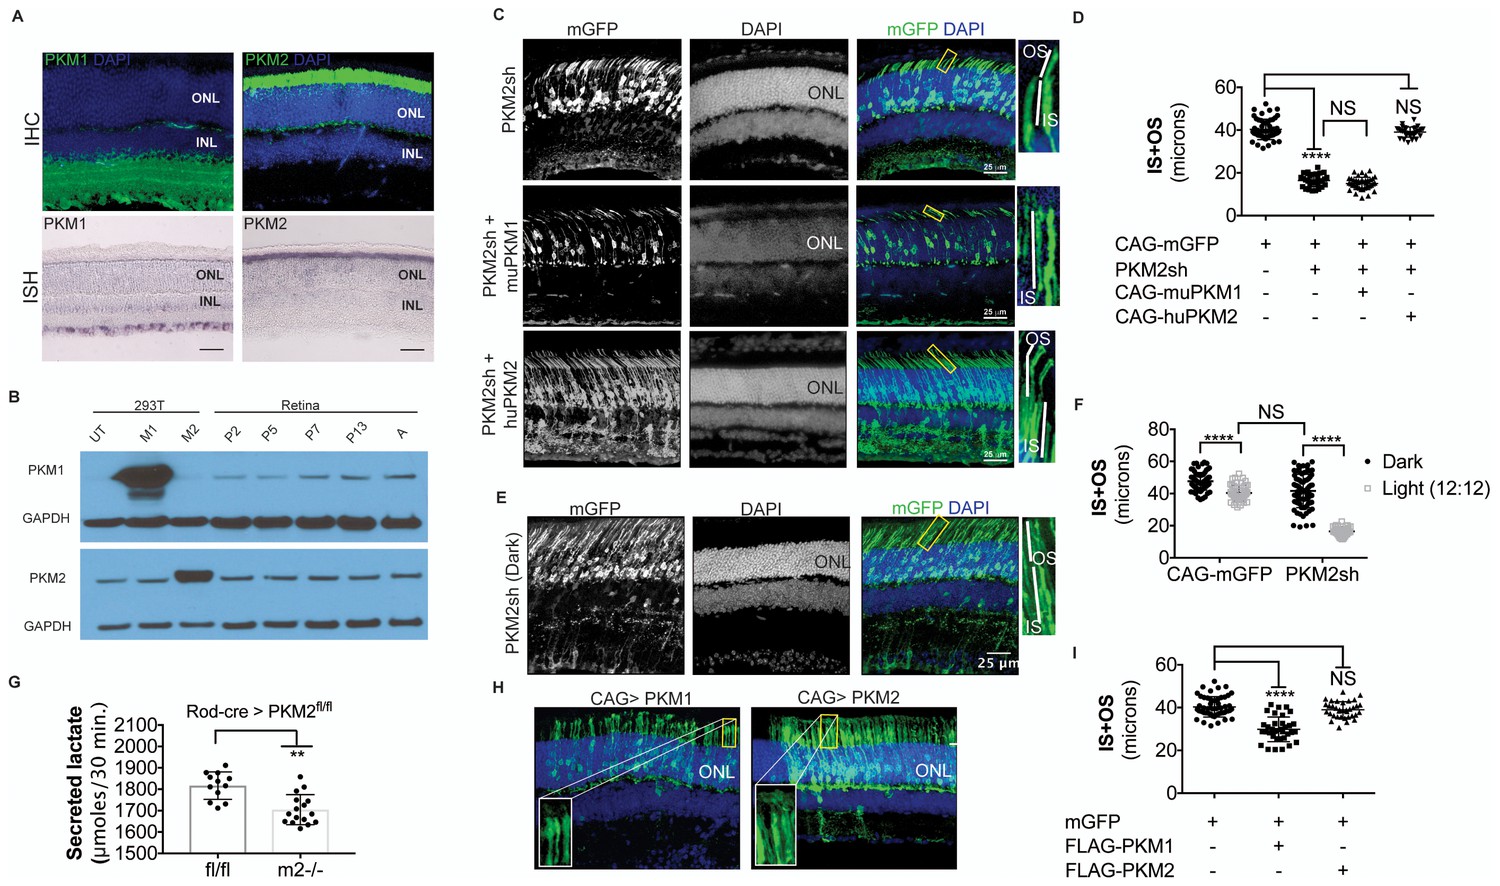
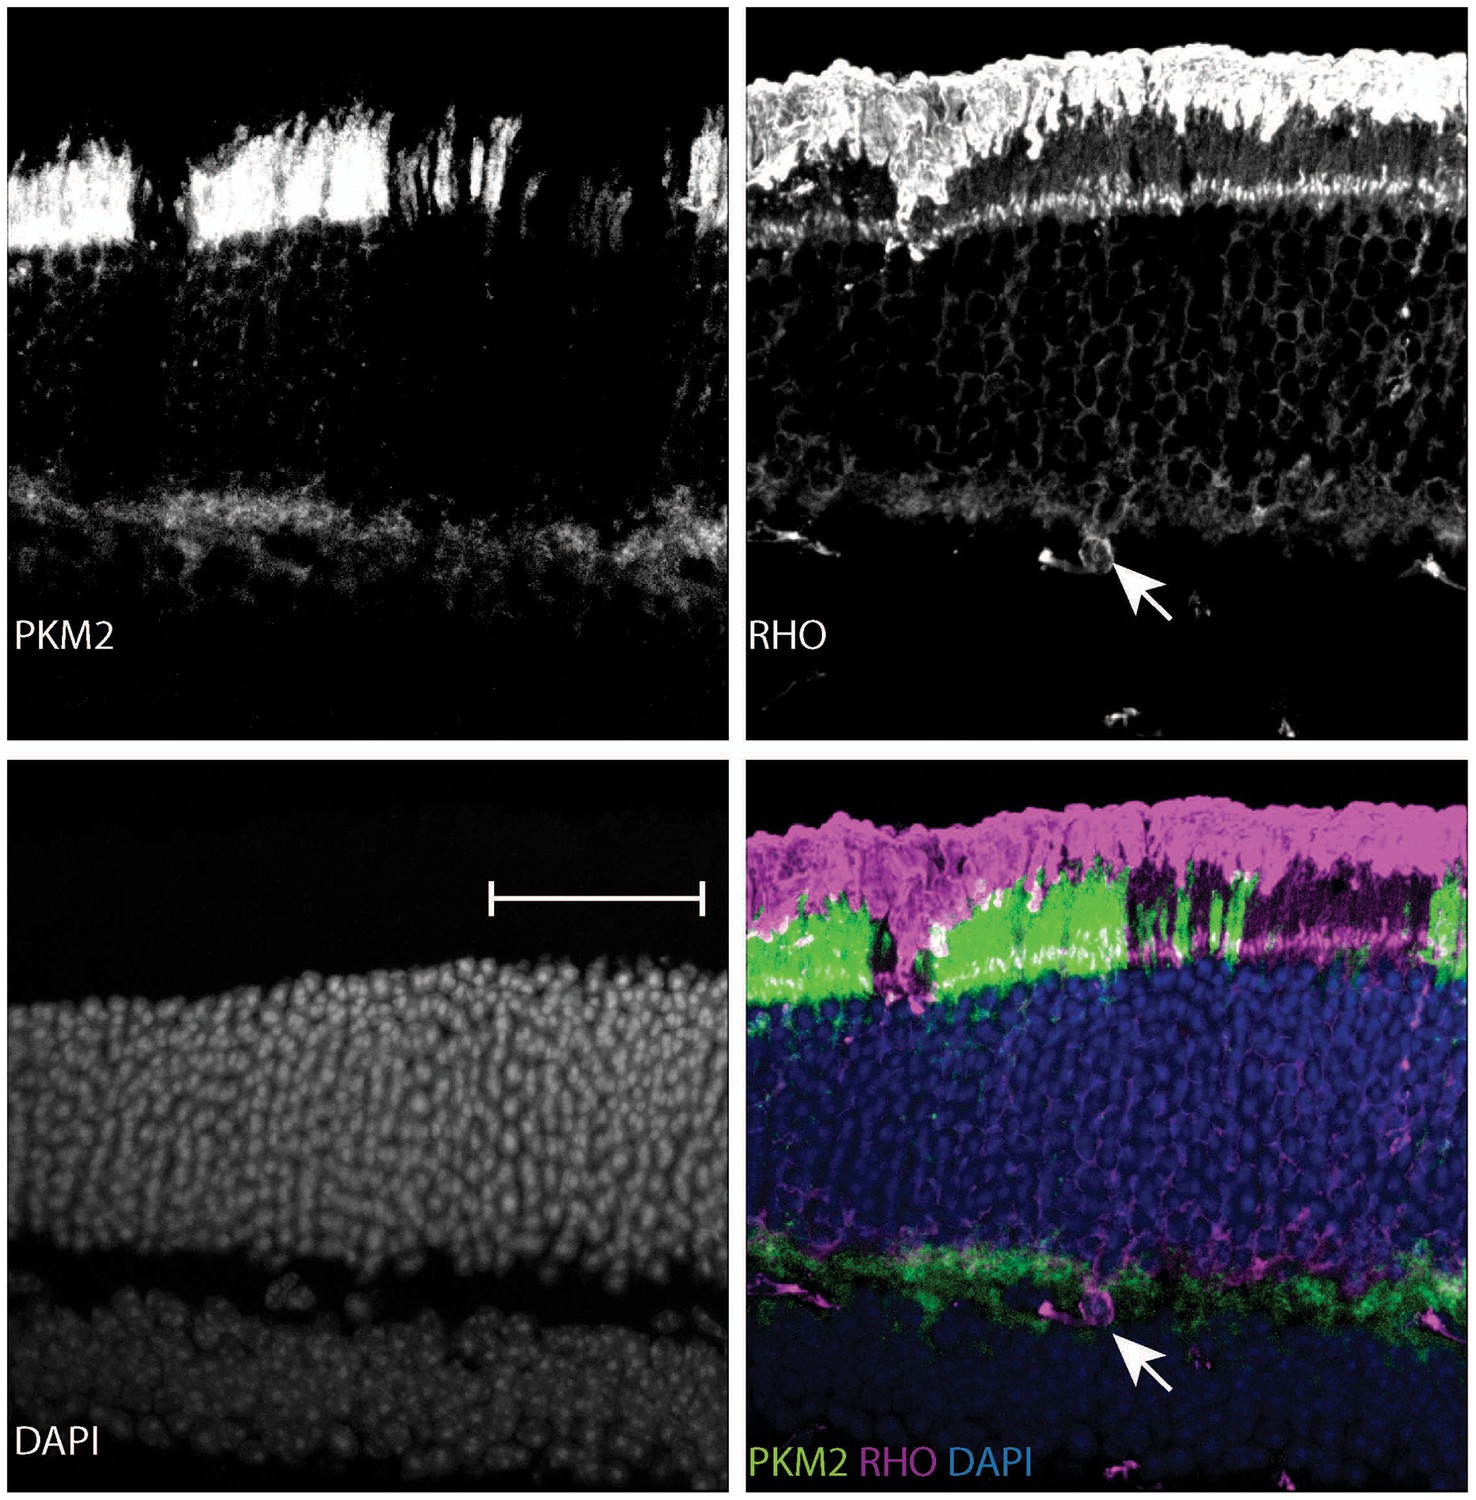
PKM1 and PKM2 isoforms have nonequivalent roles.
(A) Biased expression of M1 and M2 isoforms in retinal layers detected by IHC and ISH. (B) Immunoblot of retinal lysates from postnatal retina at different developmental stages. HEK293T cell lysates that were from untransfected (UT) cells, or those transfected with CAG-FLAGmuPKM1 (M1) or CAG-FLAGmuPKM2 (M2) as controls. Postnatal age in days. A, mature retina (P25–P30). (C) Outer segment phenotype of P45 mice after electroporation with constructs encoding mouse PKM2-specific shRNA (PKM2sh) and adding either mouse PKM1 (muPKM1) or human PKM2 (huPKM2). Selected areas in yellow boxes are magnified on the right. (D) Quantification of IS+OS lengths obtained in (C). n = 32–53 cells from 3 to 4 retinae. (E) Outer segment phenotype of dark-reared P31 mice electroporated with PKM2sh-encoding plasmid. The yellow-boxed region is magnified and presented on the right. (F) Quantification of IS+OS lengths obtained in (e). n = 75 cells from three retinae. (G) Secreted lactate from freshly isolated retinae from Pkm2fl/fl (fl/fl) (n = 12) or Rod-cre> Pkm2fl/fl (m2-/-) (n = 16) mice. (H) Outer segment phenotype after CAG promoter-driven overexpression of Flag-tagged mouse PKM1 or PKM2. Inset, higher magnification of IS and OS. (I) Quantification of IS+OS lengths obtained in (H). n = 35 cells from three retinae in PKM1 and PKM2 groups. ONL, outer nuclear layer. Data, Mean±SD. Statistics, one-way ANOVA with Tukey’s correction for panels D, I; two-way ANOVA with Tukey’s multiple comparison test for panel F; unpaired, two-tailed t-test with Kolmogorov-Smirnov correction for panel G.
-
Figure 3—source data 1
Source data for Figure 3G.
- https://doi.org/10.7554/eLife.25946.013
Figure 3—figure supplement 1
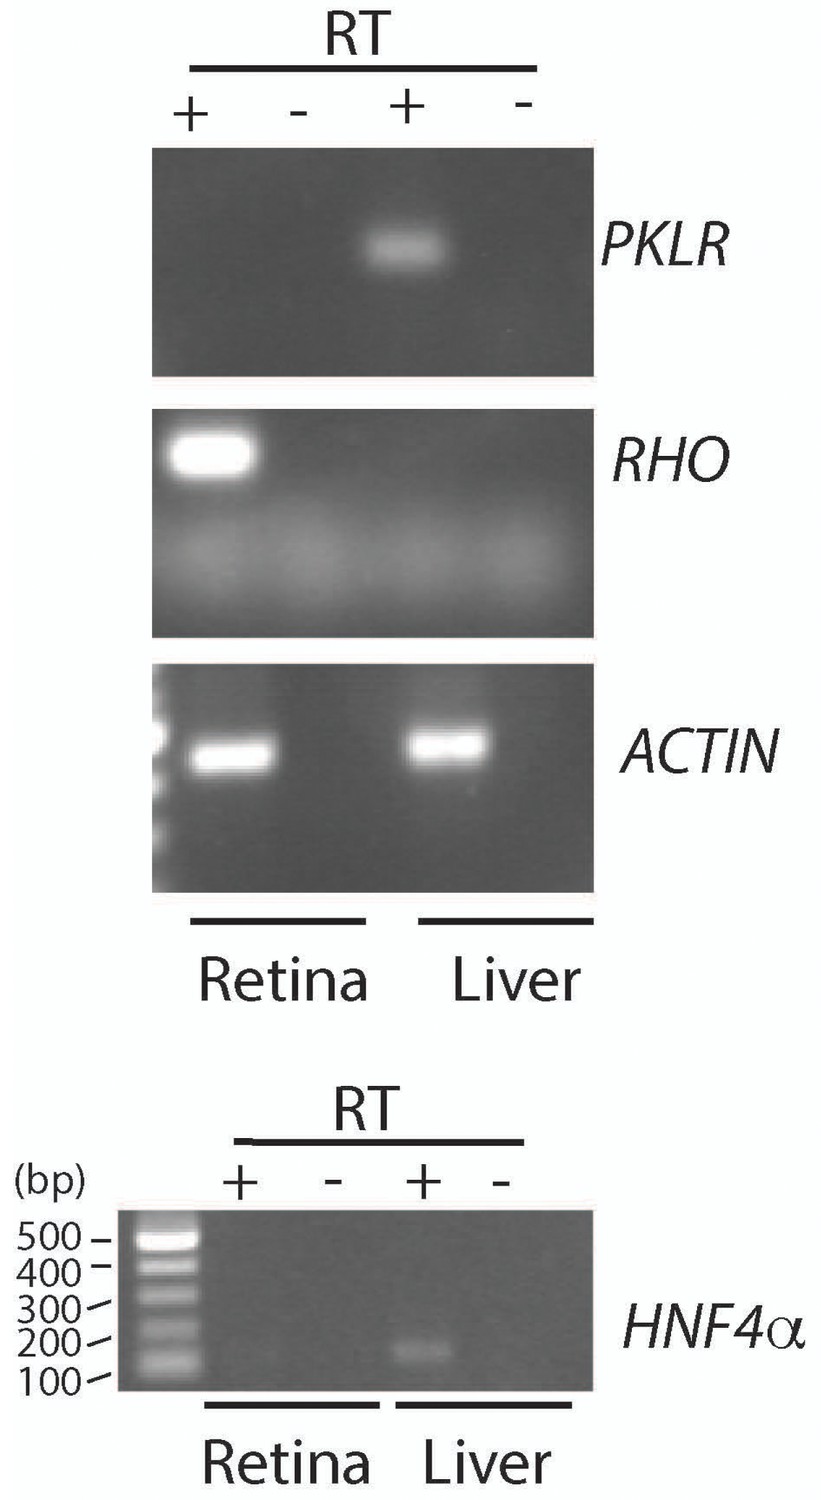
Assessment of Pklr expression in retina and liver.
PCR analysis to detect Pyruvate kinase Liver RBC (Pklr), Rhodopsin (Rho), Actin (Act) and Hepatocyte nuclear factor 4α (Hnf4α). RNA was extracted from the retina and liver of an adult mouse (>P28). PCR reactions with retinal cDNA (lanes with reverse transcriptase, +RT) as a template were compared with reactions where liver cDNA was used. The –RT lanes served as control for genomic DNA contamination.
Figure 3—figure supplement 2
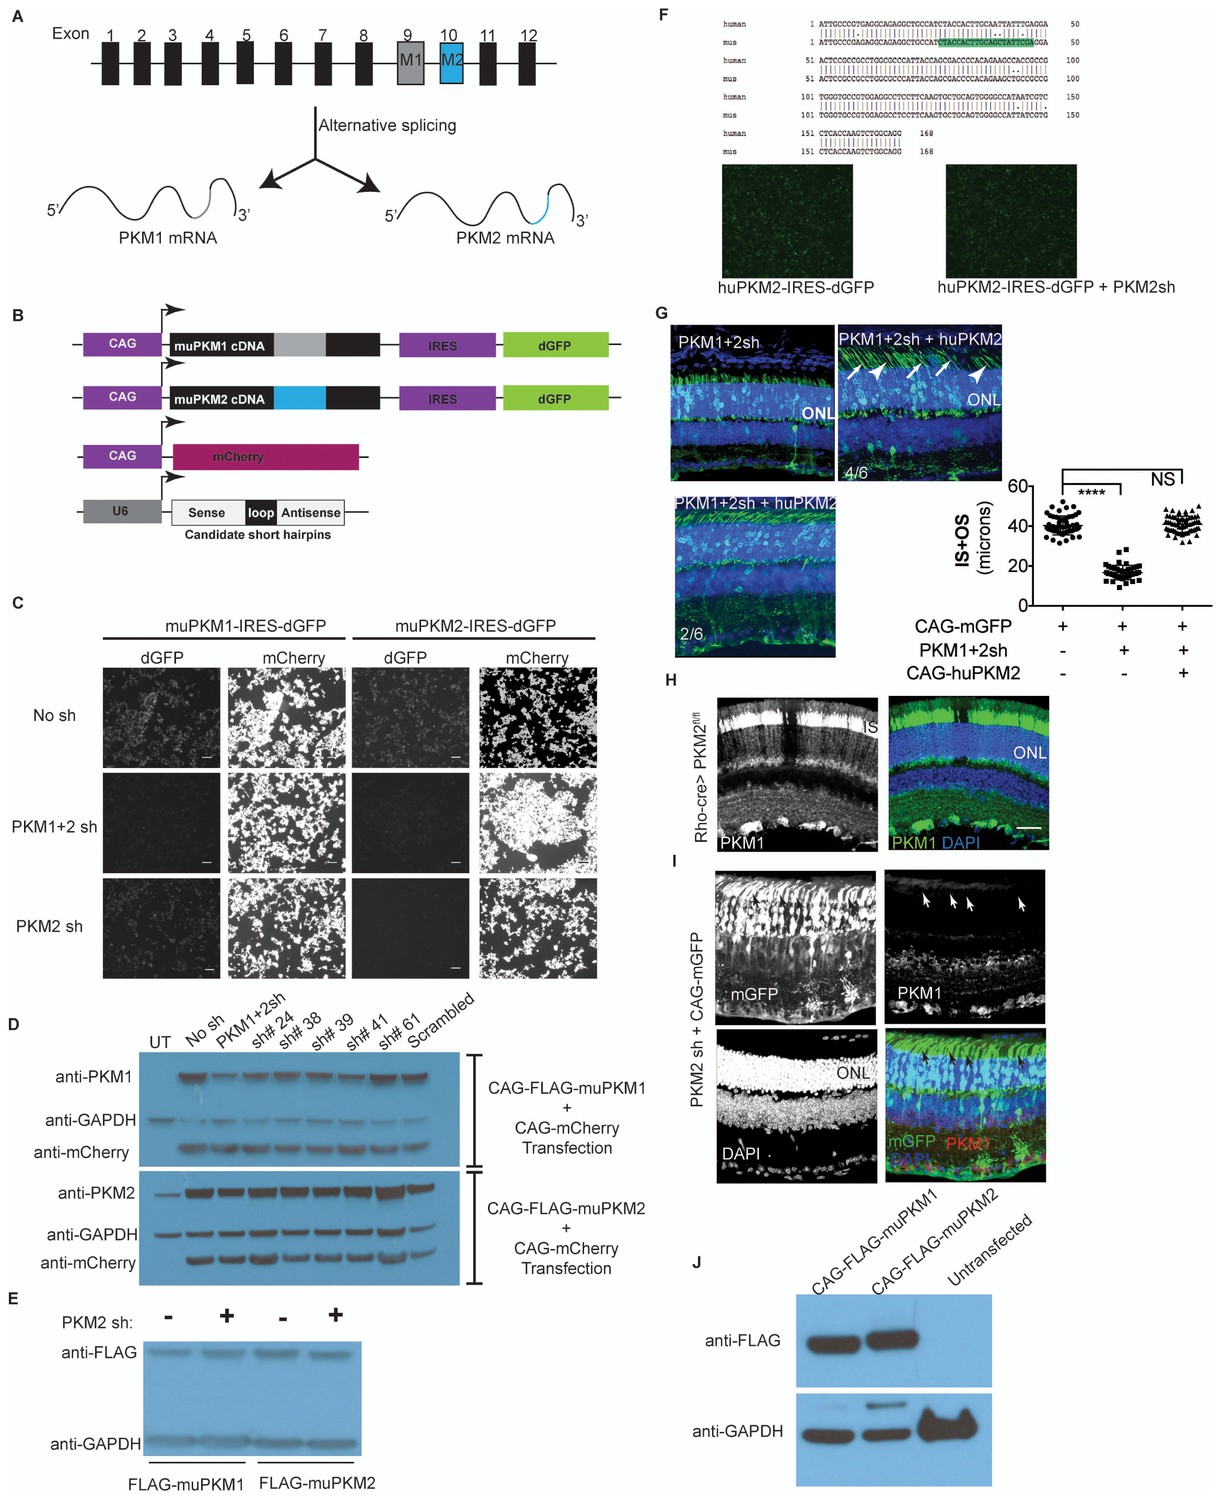
Characterization of PKM1 and PKM2 function in the retina.
(A) Schematic of the PKM genomic locus and depiction of generation of M1 and M2 isoforms by alternative splicing. (B) Plasmids encoding cDNA of either mouse PKM1 or PKM2 and destabilized GFP (dGFP) were transfected in 293T cells. CAG-mCherry served as transfection control. Plasmids encoding candidate shRNAs driven by the U6 promoter were cotransfected. (C) Live imaging of dGFP or mCherry in transfected cells. PKM1 +2 sh encodes for shRNA that targets both M1 and M2, whereas the PKM2sh codes for shRNA that is M2-specific. Scale bar, 50 μm. (D) Effect of shRNAs on protein steady state. Representative immunoblot of 293T cells transfected with Flag-tagged muPKM1 or muPKM2 driven by the CAG promoter and co-transfected with a plasmid encoding for mCherry and indicated shRNA-encoding constructs. Forty-eight hour post-transfection, cells were lysed and lystaed used for immunoblots using indicated antibodies on the left. This panel also represents shRNAs that had a knockdown effect in the screen in (b), but were not considered in favor of PKM1 +2 owing to its strong knockdown effect. UT, untransfected 293T (endogenously express PKM2 but not PKM1). (E), Representative immunoblot of 293 T cells transfected with Flag-tagged muPKM1 or muPKM2 driven by the CAG promoter and cotransfected with PKM2sh from (c) (‘+’ lanes) or empty sh vector (‘- ‘lanes) and harvested 24 hr later for lysate preparation. (F) Human and mouse M2 exon alignment. The region targeted by PKM2sh is highlighted. This shRNA did not knockdown the human PKM2. (G) In vivo electroporation of a plasmid encoding PKM1 +2 shRNA resulted in photoreceptors with significantly shorter inner plus outer segments (top left). This phenotype could be rescued by coelectroporation of a construct encoding human PKM2 cDNA (top right and bottom left). In 4/6 retinae (top right), many photoreceptors lacked clear borders distinguishing inner and outer segments (arrows) while some photoreceptors looked normal (arrowheads). In 2/6 retinae (bottom left), the morphology resembled that of control retinae. (H) Retinal cross section of a 6 week old Rod-cre; PKM2fl/fl mouse stained for PKM1. (I) Retinal cross section of a P40 mouse electroporated with PKM2sh and CAG-mGFP. Arrows mark inner segments of electroporated photoreceptors. (J) Representative immunoblot of 293T cells transfected with Flag-tagged muPKM1 or muPKM2 driven by the CAG promoter. GAPDH served as loading control.
Figure 3—figure supplement 3
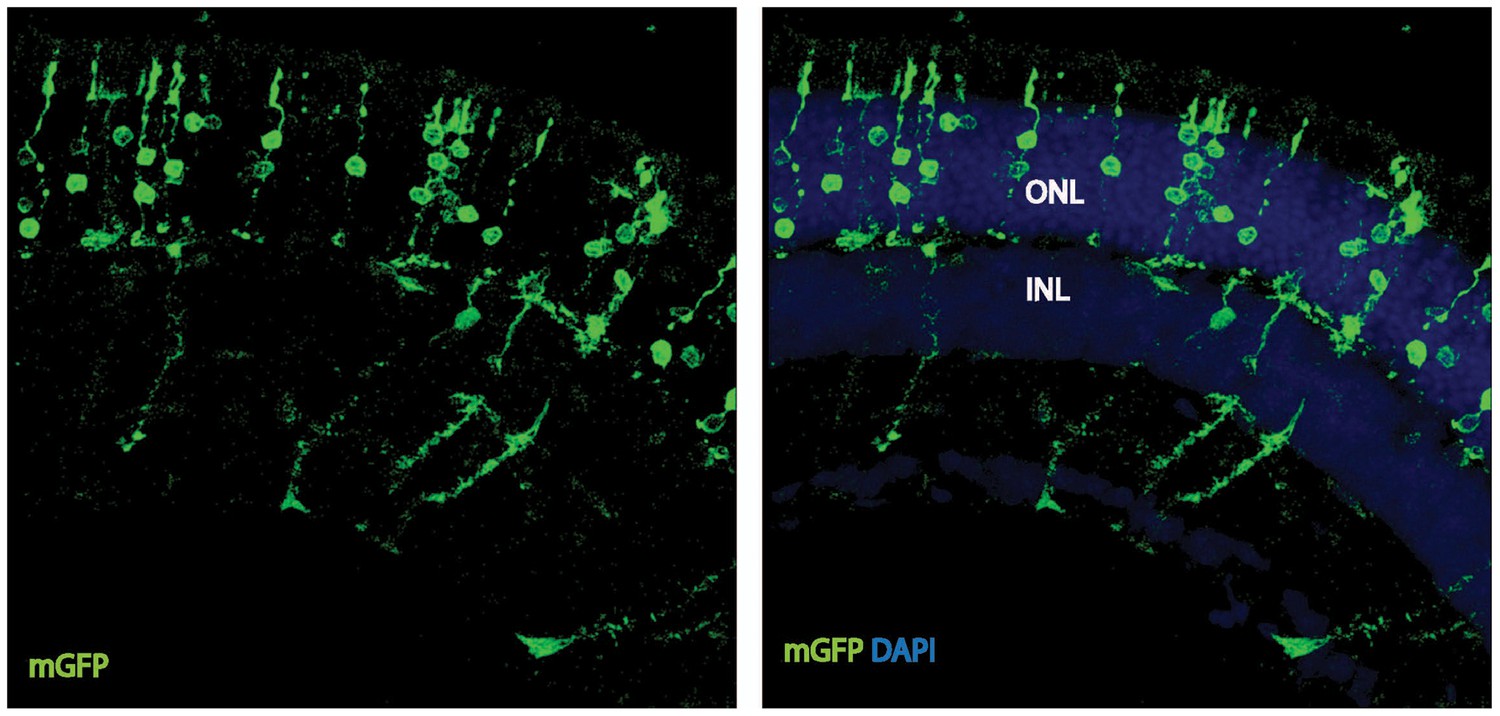
Cell-autonomous effect of PKM2 knockdown.
Photoreceptor outer segment phenotype 41 days after sparse in vivo electroporation of a plasmid encoding PKM2sh.
Figure 3—figure supplement 4
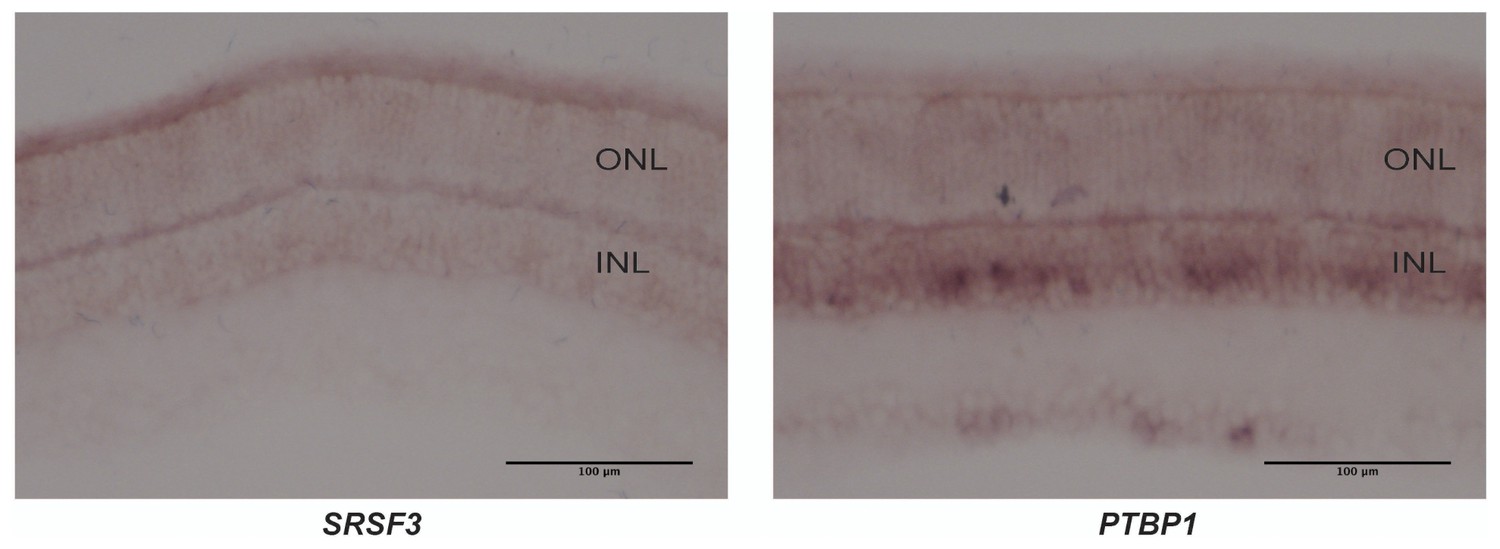
PKM1 and PKM2 splicing factors.
In situ hybridization for Srsf3 mRNA (left) and Ptbp1 mRNA (right) on retinal sections. SRSf3 mRNA is abundant in photoreceptors while Ptbp1 is more enriched in the inner nuclear layer (INL).
Figure 3—figure supplement 5
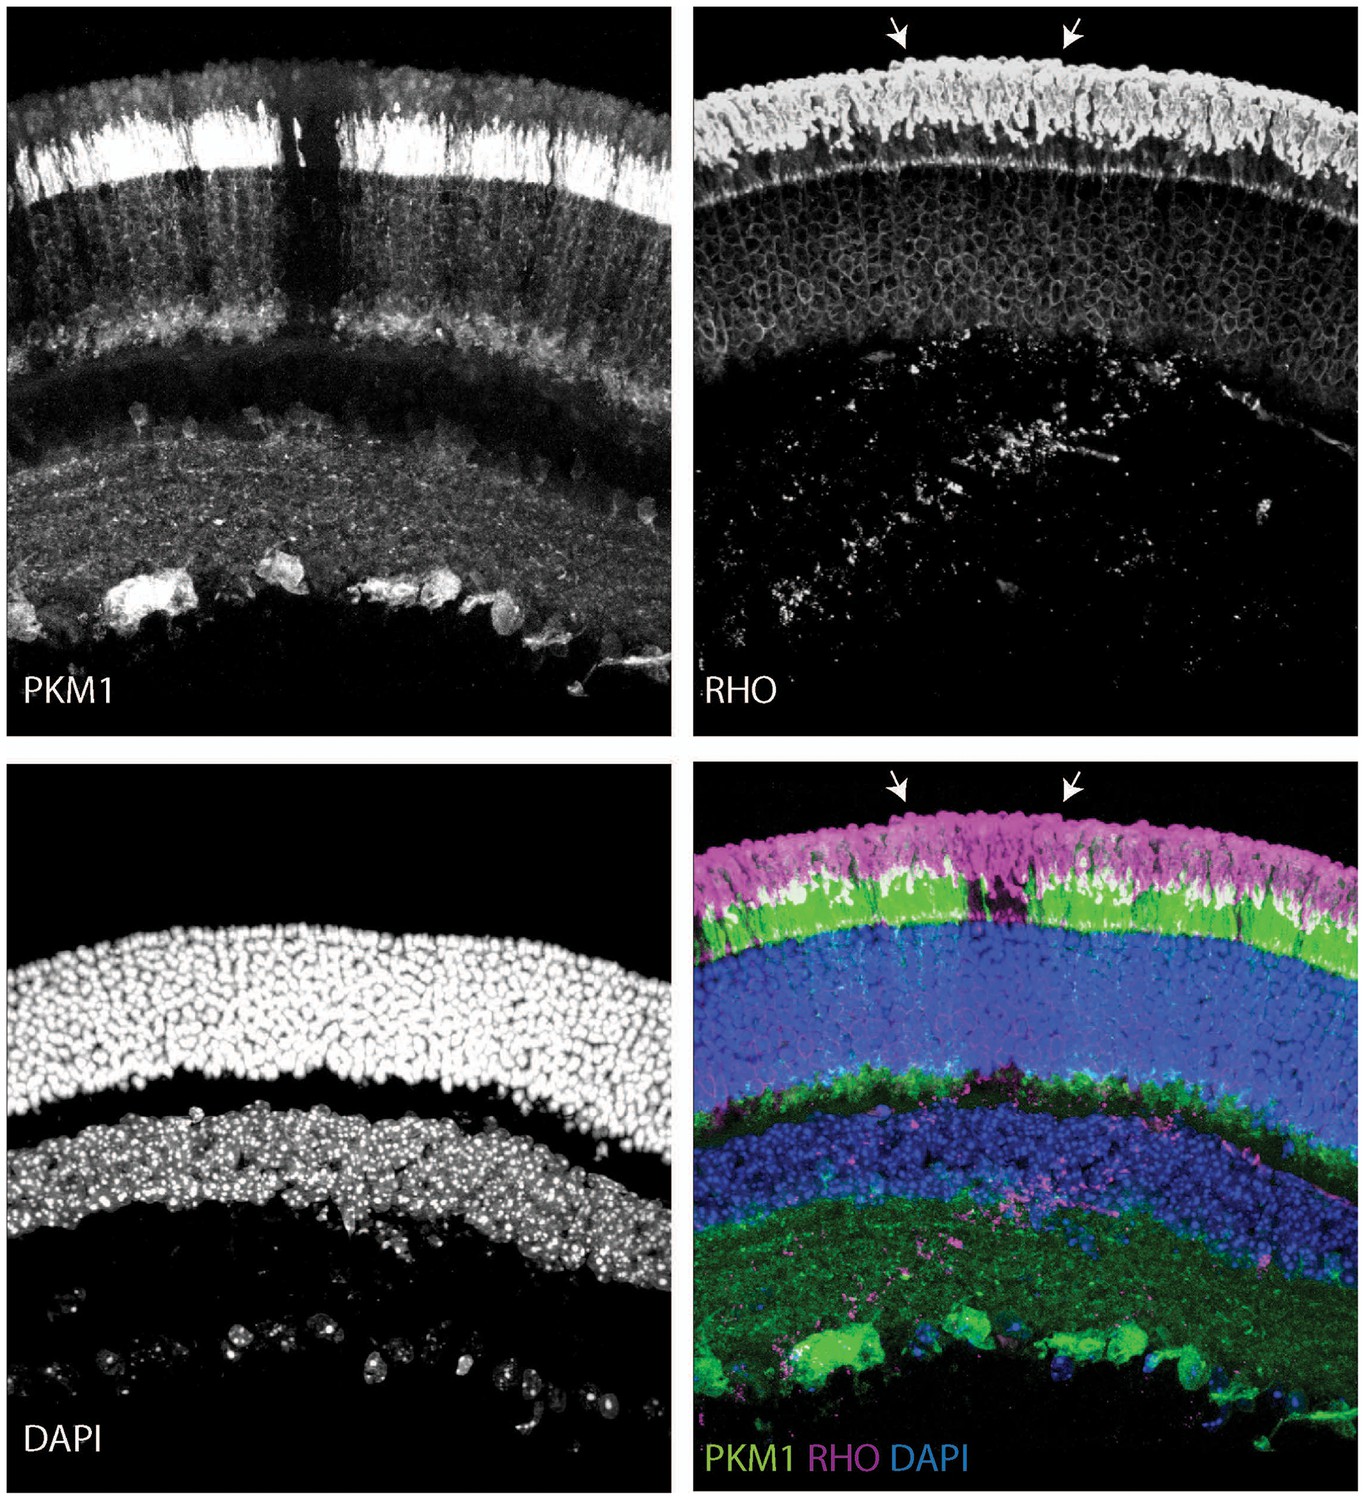
Outer segments in young Rod-cre; Pkm2fl/fl mice.
Retinal cross section of a 6-week-old Rod-cre; Pkm2fl/fl (depicted previously in Figure 3—figure supplement 2H) stained for PKM1, Rhodopsin (RHO) and counterstained with DAPI. The region of slightly longer outer segments is demarcated with arrows.
Figure 3—figure supplement 6
Age-dependent retinal changes in Rod-cre; Pkm2fl/fl mice.
Retinal cross-section of a 37-week-old Rod-cre; PKM2fl/fl mouse stained for PKM2, Rhodopsin (RHO) and counterstained with DAPI. Slight nuclear disorganization in the retinal mosaic corresponding to PKM2 loss is demarcated in the panel corresponding to the DAPI channel (lower left). Aberrant mislocalized RHO+ cell is marked by arrow.
Figure 4 with 1 supplement
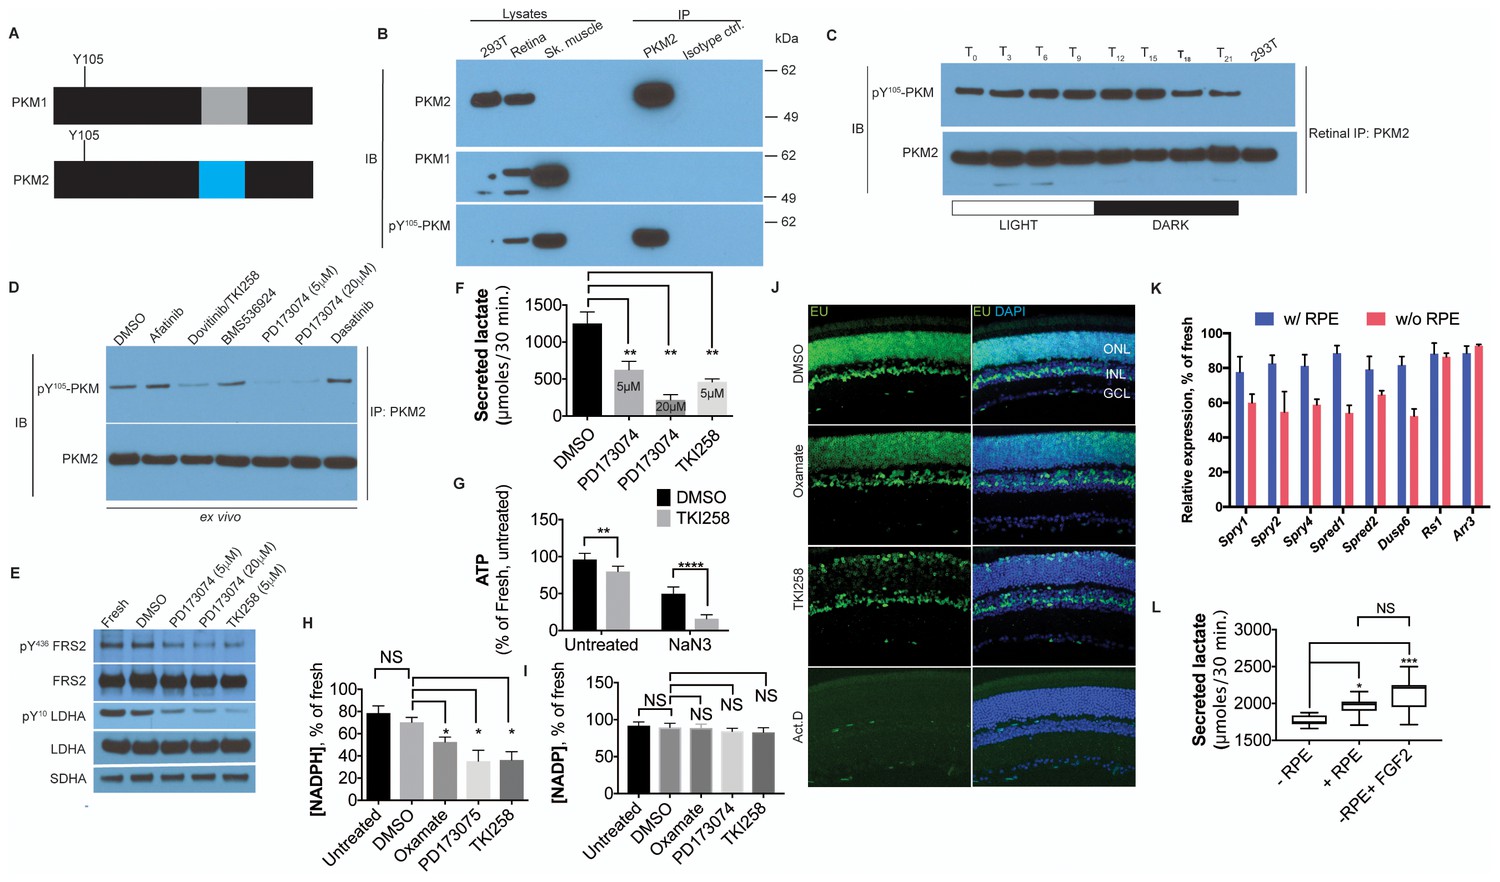
FGF signaling regulates aerobic glycolysis and anabolism.
(A) Schematic of PKM1 and PKM2 polypeptide showing Y105 is a shared epitope between PKM1 and PKM2. (B) Immunoprecipitation (IP) of PKM2 from adult retina followed by immunoblot (IB) for either PKM1, PKM2 or pY105 PKM. IP using isotype-matched antibody (IgG) is used alongside to control for nonspecific binding. Lysates from skeletal muscle (expresses PKM1) and 293T (expresses only PKM2) included as controls. Molecular weight marker positions are depicted on the right-hand-side (C) Retinal lysates were prepared from eyes harvested at 3-hr interval during the 12 hr light 12 hr dark cycle. T0 is the time point of light on in the room. The lysates were subjected to immunoprecipitation with anti-PKM2. Immunoprecipitates were probed for phosphorylation at Y105 by immunoblotting with the phospho-specific antibody. (D) Lysates from explants treated with candidate tyrosine kinase pathway inhibitors or vehicle control (DMSO) were subjected to immunoprecipitation with anti-PKM2. Immunoprecipitates were probed for phosphorylation at Y105 by immunoblotting with the phospho-specific antibody. (E) FGF inhibitors also reduce phosphorylation of LDHA at the Y10 residue. Phosphorylation of FRS2, an FGFR-interacting protein was included as a control. SDHA served as loading control. (F) Rate of lactate production from explants treated with DMSO (n = 5) or FGF inhibitors PD173074 (5 mM) (n = 6), PD173074 (20 mM) (n = 5), TKI258 (n = 6). (G) Steady-state ATP levels per retina in explants after culture with TKI258 or DMSO. The retinae were transferred to Krebs’-Ringer's with NaN3 or NaCl (untreated group) for 30 min followed by harvest for ATP extraction. n = 7, DMSO+NaCl; n = 9, TKI258+NaCl; n = 9, DMSO+NaN3; n = 9, TKI258+NaN3. Data are Mean±SD. Statistics, Two-way ANOVA with Tukey’s correction. (H) NADPH steady state levels in explants as a percentage of those measured in freshly isolated retina. Explants were treated with DMSO, oxamate, PD173074, TKI258 or left untreated in culture medium. n = 4 groups. Unpaired t-test with Kolmogorov-Smirnov correction for indicated pairs. (I) NADP steady-state levels in explants as a percentage of those measured in freshly isolated retina. Explants were treated with DMSO, oxamate, PD173074, TKI258 or left untreated in culture medium. Oxamate, n = 5; rest, n = 6 groups. Unpaired t-test with Kolmogorov-Smirnov correction for indicated pairs. (J) Blocking glycolysis or FGF signaling reduced EU incorporation in nascent RNA. Explants were treated with DMSO, oxamate, TKI258 or Actinomycin D (RNA Pol II inhibitor) followed by incubation with EU. (K) Quantitative PCR analysis of transcripts to ascertain relative expression of FGF or non-FGF targets (Arr3, Rs1) in explants cultured with or without RPE/Sclera complex (+RPE or –RPE respectively). (L) Ability to produce lactate from neural retina increased when cultured in the presence of RPE/Sclera complex (+RPE) (n = 11) as compared to those that were cultured without the complex (-RPE) (n = 9). Addition of FGF2 in –RPE cultures restored the ability (-RPE+FGF2) (n = 8). Retinal explants were cultured with RPE attached in the explant culture medium. Before transferring them to Krebs’s-Ringer's for lactate estimation, the RPE/Sclera complex was removed and intact neural retina was used. For –RPE conditions, neural retina was cultured in explant medium followed by transfer to Krebs’-Ringer's. FGF2 was added to the explant culture medium but was absent in the Krebs’-Ringer's for -RPE+FGF2 condition. Data depict median in 1–99 percentile box and whiskers plot. Hinges extend between 25th to 75th percentiles. Statistics, Ordinary one-way ANOVA with Tukey’s correction. ONL, outer nuclear layer. INL, inner nuclear layer. GCL, Ganglion cell layer.
-
Figure 4—source data 1
Source data for Figure 4F–I,K and L.
- https://doi.org/10.7554/eLife.25946.021
Figure 4—figure supplement 1
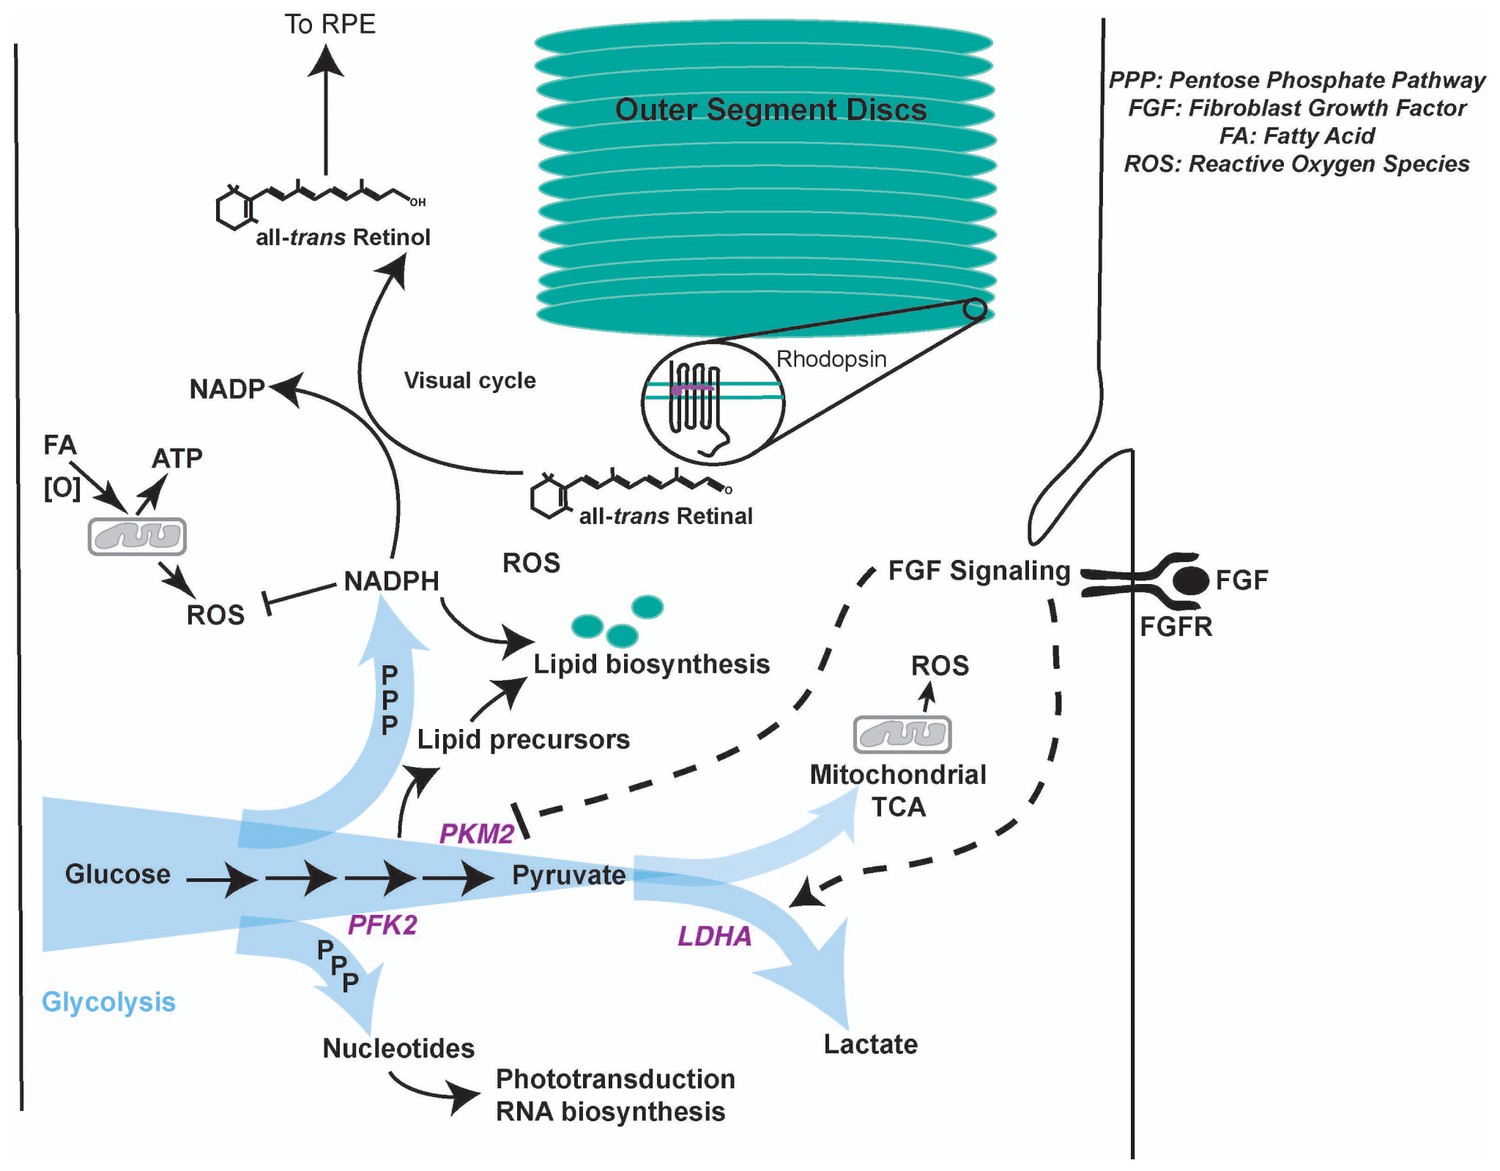
Model summarizing regulation of glycolysis and its contribution to photoreceptor physiology.
Aerobic glycolysis could serve as a metabolic adaptation to promote anabolism and visual cycle in the photoreceptors. Lactate represents carbon that is unavailable for oxidation and ATP generation. We favor a model where allosteric and FGF-mediated promotion of Warburg effect would funnel glucose towards glycolytic pathway enabling generation of NADPH- a key cofactor in lipid biosynthesis and visual cycle, and nucleotides- required RNA biosynthesis to replenish proteins lost in disc shedding and phototransduction. Since methods to quantify selective glucose uptake by photoreceptors in undissociated state are not available, its fate specifically in the photoreceptors and relative contribution of glycolysis to the ATP pool in these cells is currently not decipherable. Other fuels such as fatty acids can be used in the mitochondria for ATP requirements (Joyal et al., 2016). A byproduct of mitochondrial activity is ROS generation. NADPH plays a critical role in ROS detoxification as well. Thus, in this way aerobic glycolysis might support sustainable energy generation by the photoreceptors. It is worth noting that the blood pressure in choroidal vasculature (that lies behind the photoreceptors) is not regulated and is generally considered to provide unabated supply of nutrients and oxygen to the neural retina. Given this anatomical feature, metabolic regulation in photoreceptors might not be geared toward economizing carbon allocation. Thus, aerobic glycolysis might not be a wasteful process, but a metabolic adaptation to meet multiple physiological needs.
Author response image 1

Additional files
-
Supplementary file 1
qPCR analysis of target genes in isolated rod samples.
- https://doi.org/10.7554/eLife.25946.023
-
Supplementary file 2
shRNA-encoding constructs used and targeted regions in the cDNA.
- https://doi.org/10.7554/eLife.25946.024
-
Supplementary file 3
List of antibodies.
- https://doi.org/10.7554/eLife.25946.025
-
Supplementary file 4
Probe sequences for in situ hybridization.
- https://doi.org/10.7554/eLife.25946.026
-
Supplementary file 5
Primers for qPCR analysis.
- https://doi.org/10.7554/eLife.25946.027
Download links
A two-part list of links to download the article, or parts of the article, in various formats.
Downloads (link to download the article as PDF)
Open citations (links to open the citations from this article in various online reference manager services)
Cite this article (links to download the citations from this article in formats compatible with various reference manager tools)
Glycolytic reliance promotes anabolism in photoreceptors
eLife 6:e25946.
https://doi.org/10.7554/eLife.25946


