Inter-species population dynamics enhance microbial horizontal gene transfer and spread of antibiotic resistance
- University of California, San Diego, United States
Figures
Figure 1 with 1 supplement
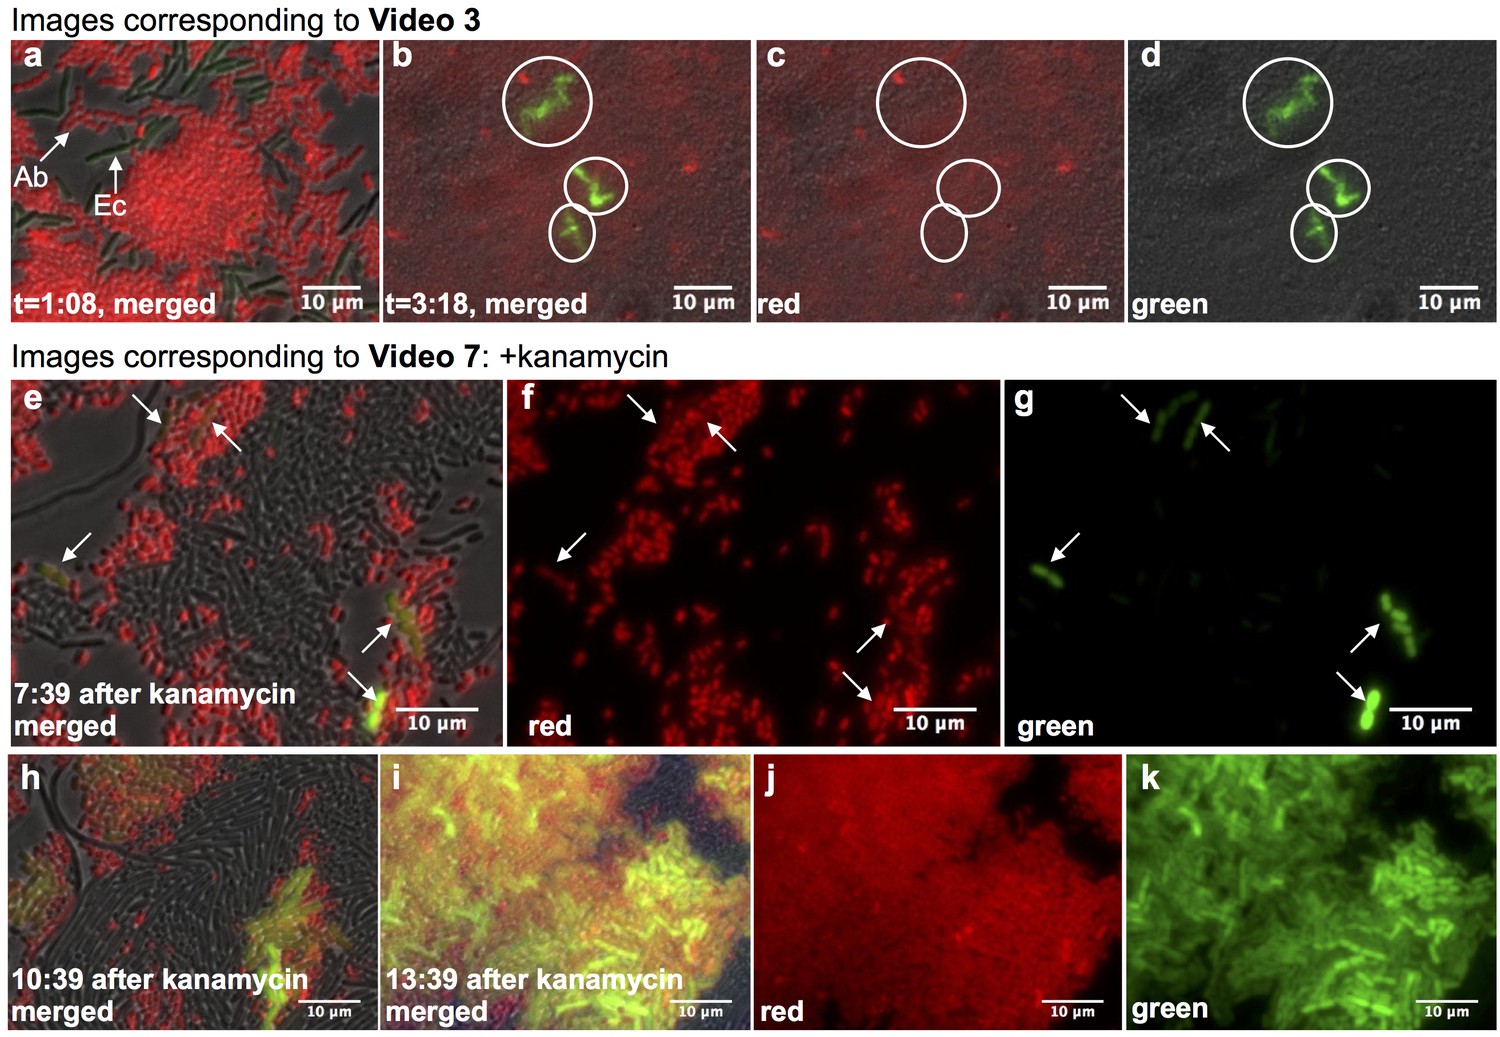
Real-time observation of functional HGT in microfluidic traps.
(a–d) Acinetobacter expressing mCherry were mixed with E. coli carrying LacI-repressed pBAV1k-GFP inside a microfluidic device (frames captured from Video 3, see also Supplementary Note 1). (a) t = 1:08, both Acinetobacter (Ab) and E. coli (Ec) were present, and no HGT had occurred. (b–d) t = 3:18, all E. coli in the field had been lysed, and several independent lineages of GFP-expressing Acinetobacter deriving from HGT were visible (circled). (e–k) HGT renders Acinetobacter resistant to antibiotic treatment (frames captured from Video 7). Kanamycin was added 11:42 after seeding the device. Still images were captured at indicated times after kanamycin addition, after several independent HGT events had already occurred (arrows in e-g). (h–k) Newly kanamycin-resistant Acinetobacter began outcompeting both E. coli and the sensitive parent (h), and by 13 hr after kanamyin addition (i–k), they dominated the environment.
Figure 1—figure supplement 1
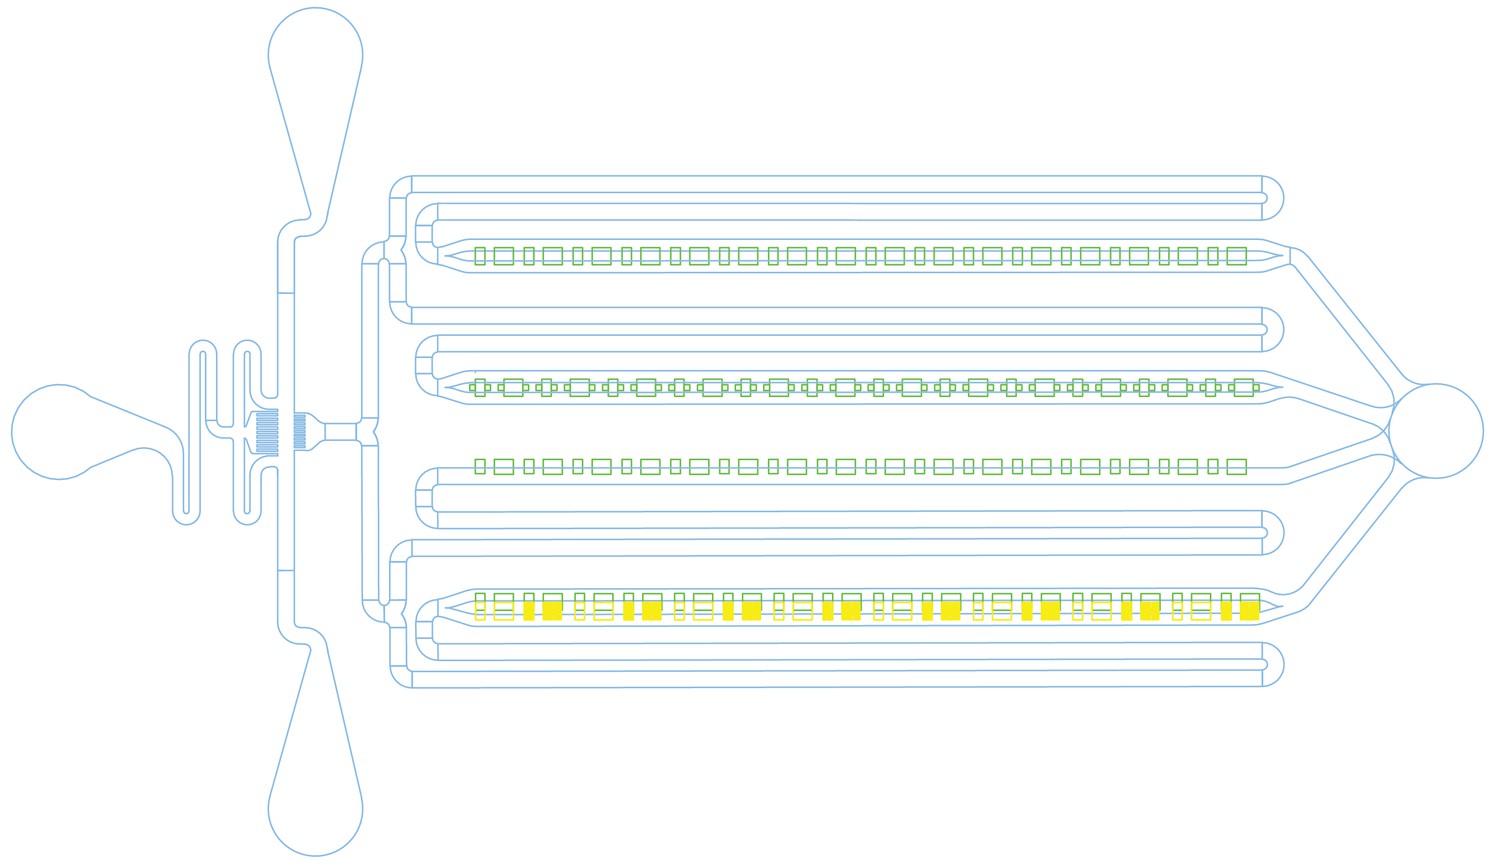
Microfluidic chip design.
Cells were loaded from the port on the right, which was also used to remove waste media. Fresh media was flowed in from the ports on the left. For media switching, the top left port was used to flow in LB with kanamycin by raising the attached syringe. There are four rows of traps (green), each with a slightly different design. The top two rows have feeding channels (blue) on both the top and the bottom of the traps, while the third row of traps is only open to feeding channels on one side. The fourth row was designed to have narrow feeding channels at the backs of the traps (yellow), but these proved too challenging to fabricate and were omitted from the physical devices, making this row functionally equivalent to the third.
Figure 2 with 2 supplements
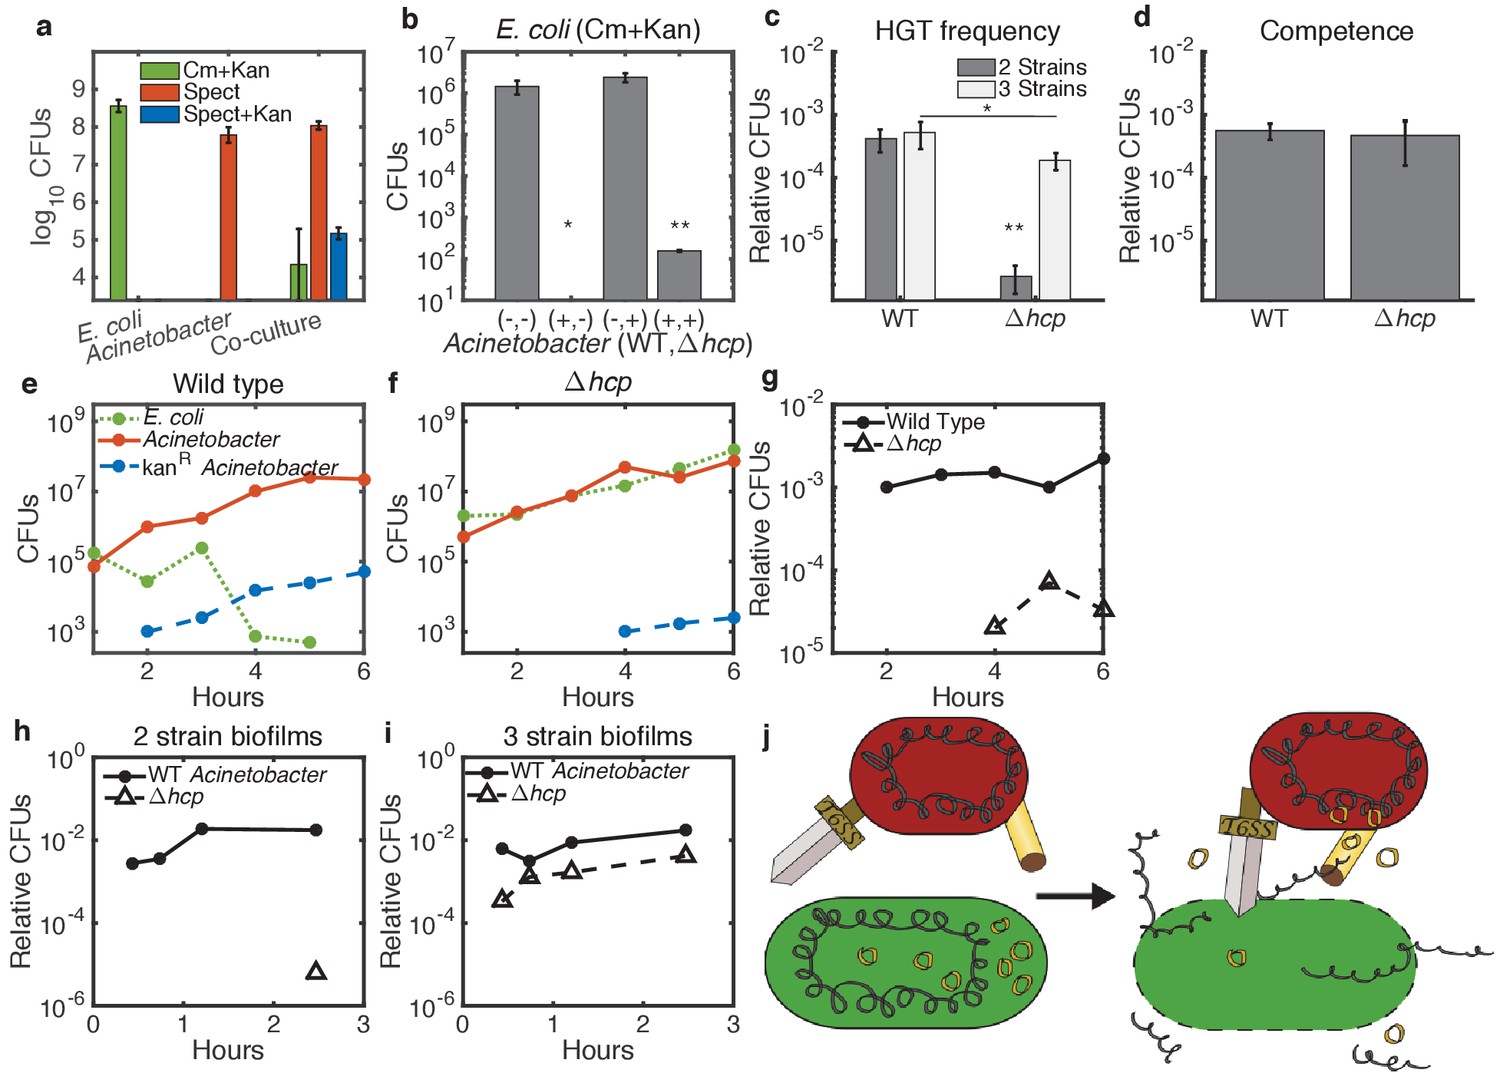
Enhancement of HGT efficiency by neighbor killing.
Communities were seeded with 2 ul droplets containing indicated strains of Acinetobacter with genomic spect resistance, mixed with genomically cm-resistant E. coli carrying the kan-resistant donor plasmid pBAV1k. Spots were incubated at 30°C overnight (a) or at 37°C for 150 min (b–d) or for the indicated time (e–i). Lower limits on y-axes are the limits of detection. (a) E. coli (cm+kan, green bars), Acinetobacter (spect, orange bars), and newly double-resistant Acinetobacter (spect+kan, blue bars) present after growth either alone or in co-culture. (b) Survival of E. coli after growth alone (-,-) or with wild type (+,-), non-killing hcp (-,+), or both (+,+) strains of Acinetobacter. Spots were seeded with Acinetobacter at optical density (OD) five and E. coli at OD 1. (c) HGT during the experiment shown in b, measured as the proportion of wild type (WT - spect, left bar group) or hcp (tetracycline, right bar group) CFUs that were also resistant to kan. Two-strain cultures (dark bars) correspond to the center two bars in b, while the three-strain cultures (light bars) corresponds to the rightmost bar in b. (d) Transformation efficiency of Acinetobacter as in c, but mixed with purified pBAV1k DNA just before spotting. (e–g) Time course showing CFUs of E. coli (dotted green), total Acinetobacter (solid orange) and double-resistant Acinetobacter (dashed blue) in two-strain cultures (wild-type Acinetobacter in e and hcp Acinetobacter in f). (g) The proportion of wild type (solid line) and hcp (dashed line) Acinetobacter cells that have acquired kan resistance during the experiment in e-f. (h,i) Time course showing HGT complementation by killing in trans. The proportion of double-resistant cells is shown for wild type (solid lines) and hcp (dashed lines) Acinetobacter grown with E. coli either separately in two-strain (h) or together in three-strain (i) cultures. (j) A conceptual model for killing-enhanced HGT to Acinetobacter. Statistical significance levels are: with significance calculated using raw data, and , with significance calculated on log10-transformed data (see Materials and methods for sample sizes and statistical analysis, and see main text for exact p-values).
Figure 2—figure supplement 1
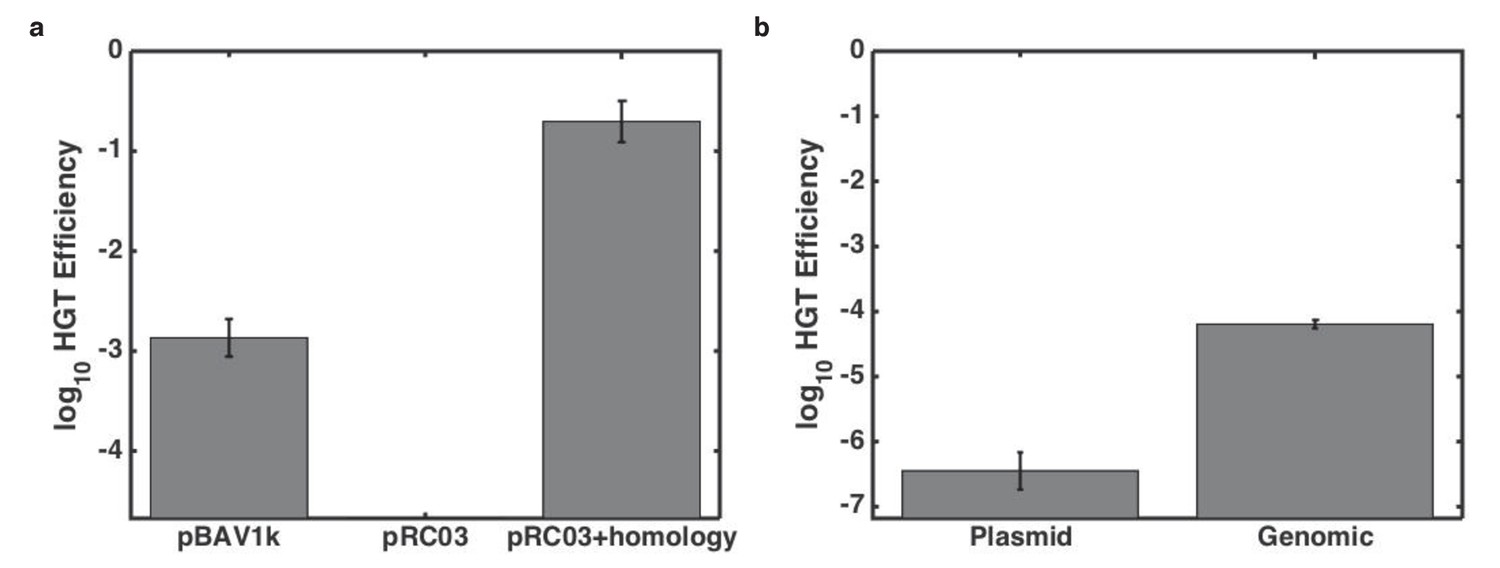
Effect of genomic context on killing-enhanced HGT.
(a) Proportion of kan-resistant Acinetobacter after overnight growth with E. coli carrying different bait plasmids. (b) Dependence of HGT on genetic location of the resistance gene and genomic homology. Error bars indicate standard errors from three culture replicates, and lower limits on y-axes are the limits of detection for each experiment.
Figure 2—figure supplement 2
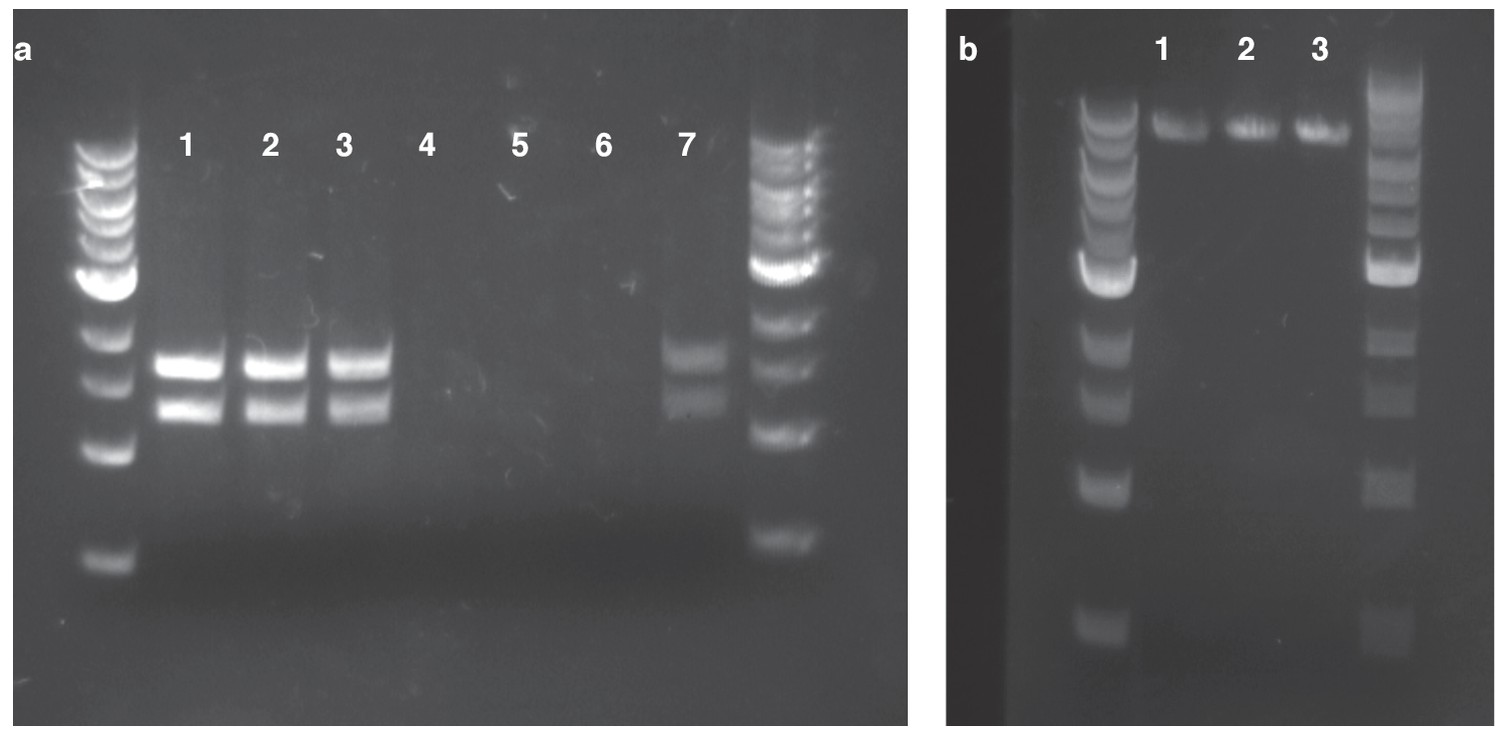
Confirmation of HGT from replicating and homology plasmids.
(a) plasmid DNA isolated with a standard miniprep kit and digested using SspI. Lanes 1–3: Kanamycin-resistant Acinetobacter clones resulting from HGT of pBAV1k. Lanes 4–6: Kanamycin-resistant Acinetobacter clones resulting from HGT of pRC03+homology. Lane 7: E. coli carrying pBAV1k. (b) inverse PCR with primers located in the kan gene using genomic DNA isolated from kanamycin-resistant Acinetobacter clones resulting from HGT of pRC03H.
Figure 3 with 5 supplements
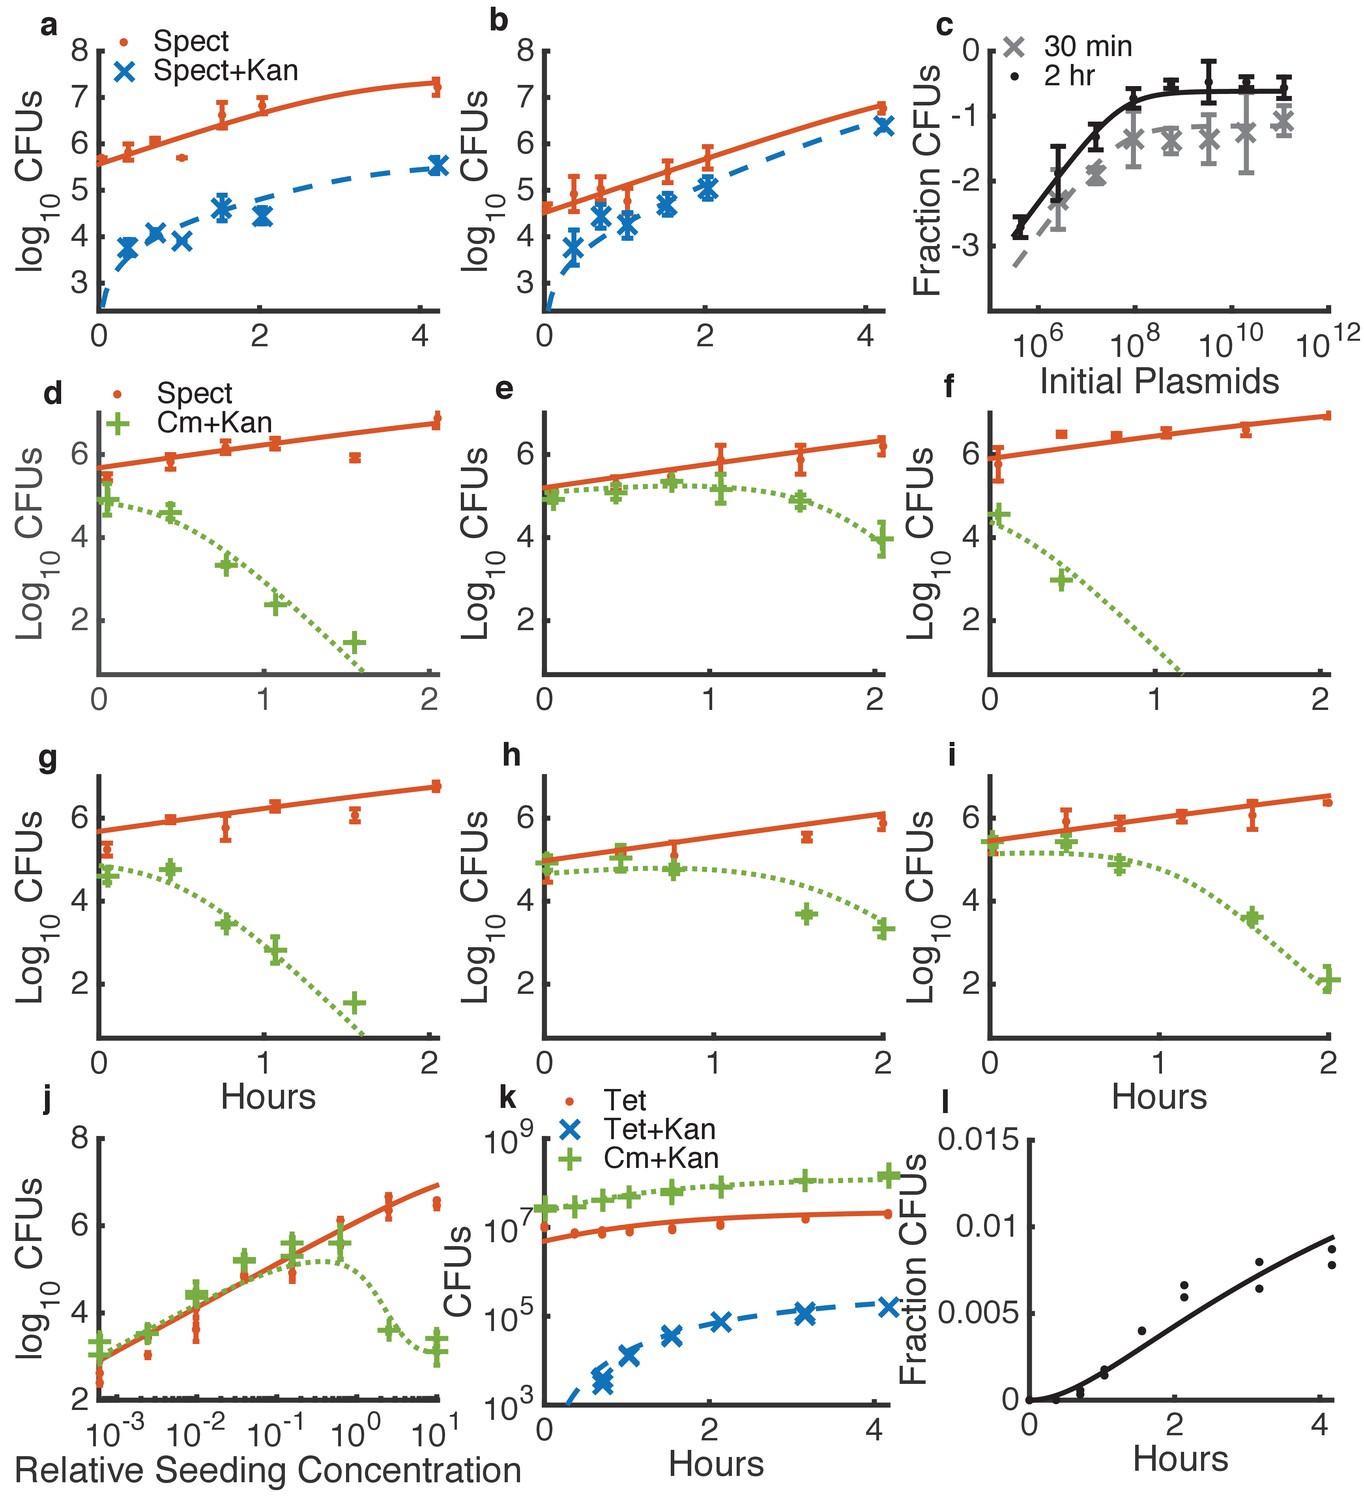
Determining quantitative parameters for natural transformation and contact-dependent neighbor killing.
Error bars indicate measurement standard deviations of experimental data for a single spot harvested from an agar plate, and lines represent simulations using the shared best fit parameters (Table 1). Note all y-axes are log scale except for l. Orange lines indicate Acinetobacter (spect-, or in k, tet-resistant), blue lines indicate transformed Acinetobacter (additionally kan-resistant), green lines indicate E. coli (cm-resistant), and black or grey lines indicate the fraction of Acinetobacter that have been transformed. (a–c) Transformation of Acinetobacter via homologous recombination of exogenous DNA (pRC03H-2S) added just before spotting the cells. (a,b) Time courses of transformation of Acinetobacter mixed with limiting (a) or saturating (b) plasmid DNA. (c) Fraction of Acinetobacter transformed by a DNA dilution series, harvested after either 30 min or 2 hr. (d–j) Measuring killing of E. coli by Acinetobacter. (d–i) A selection of independent time courses seeded with varying densities of E. coli and Acinetobacter (see also Figure 3—figure supplement 3). (j) A contact-dependent killing assay using a dilution series of Acinetobacter mixed with E. coli at the same ratio, but varying total concentration. (k,l) Time series of the number of CFUs (k) and fraction of transformed killing-deficient Acinetobacter hcp (l) after growth with E. coli on agar plates, used to fit DNA ‘leakage’.
Figure 3—figure supplement 1
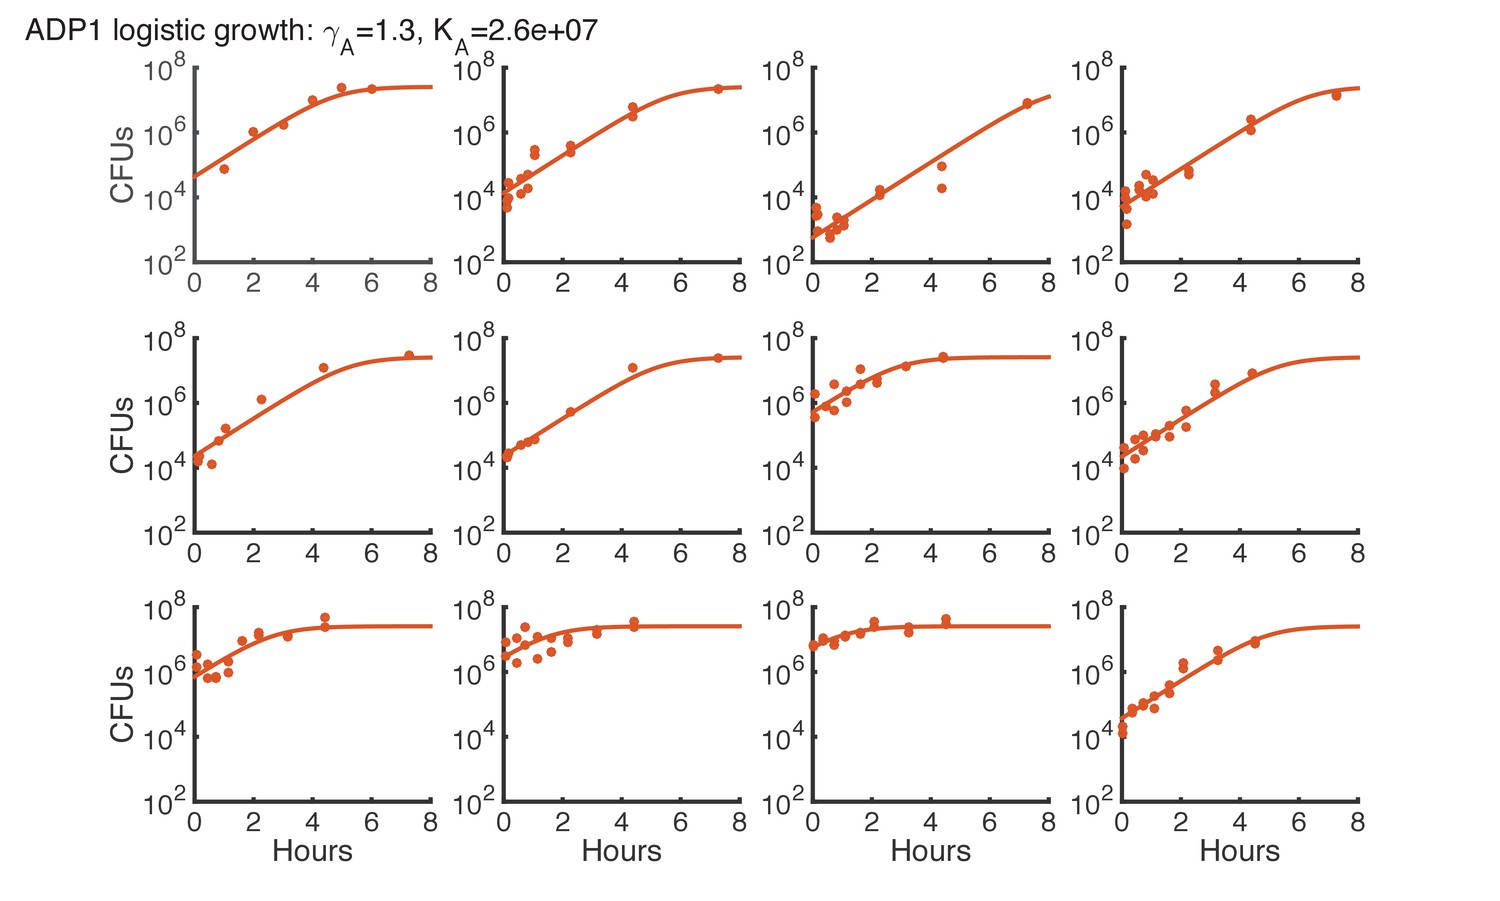
Logistic growth fit for Acinetobacter spots on agar starting with various initial CFUs.
https://doi.org/10.7554/eLife.25950.018
Figure 3—figure supplement 2
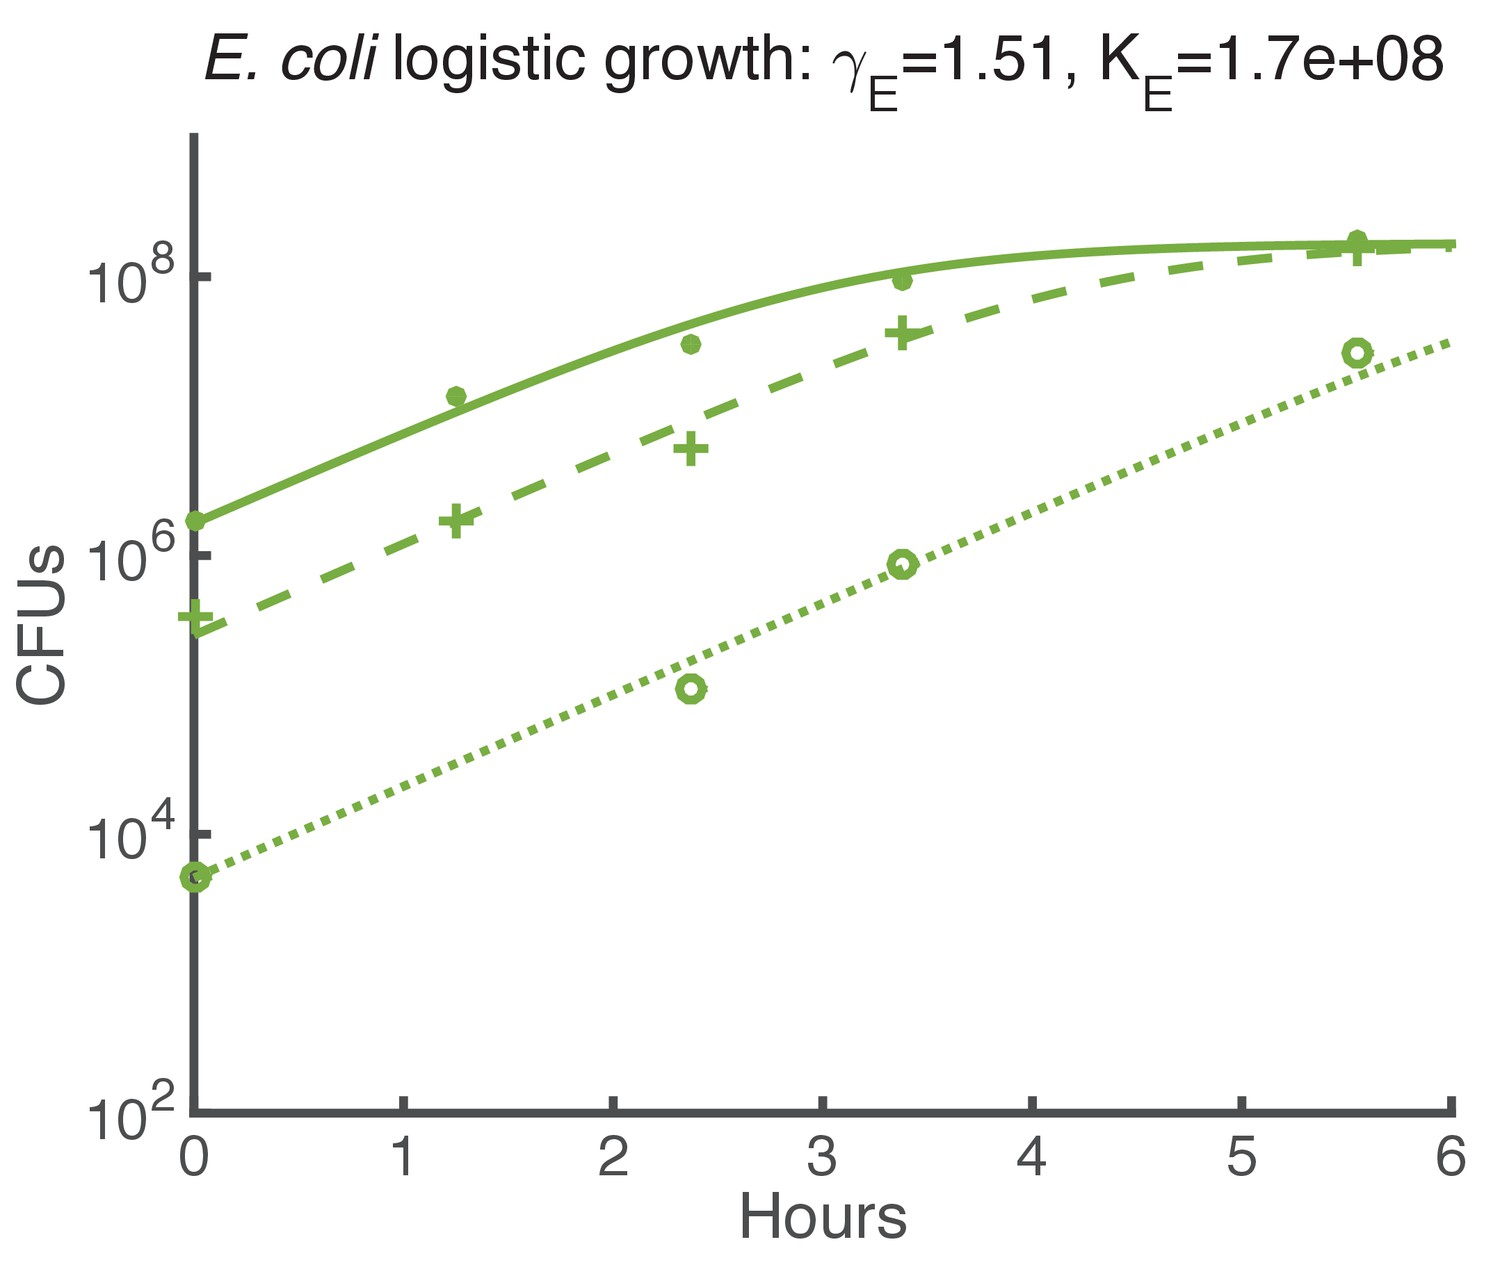
Logistic growth fit for E. coli spots on agar starting with various initial CFUs.
https://doi.org/10.7554/eLife.25950.019
Figure 3—figure supplement 3
Fitting contact-dependent killing.
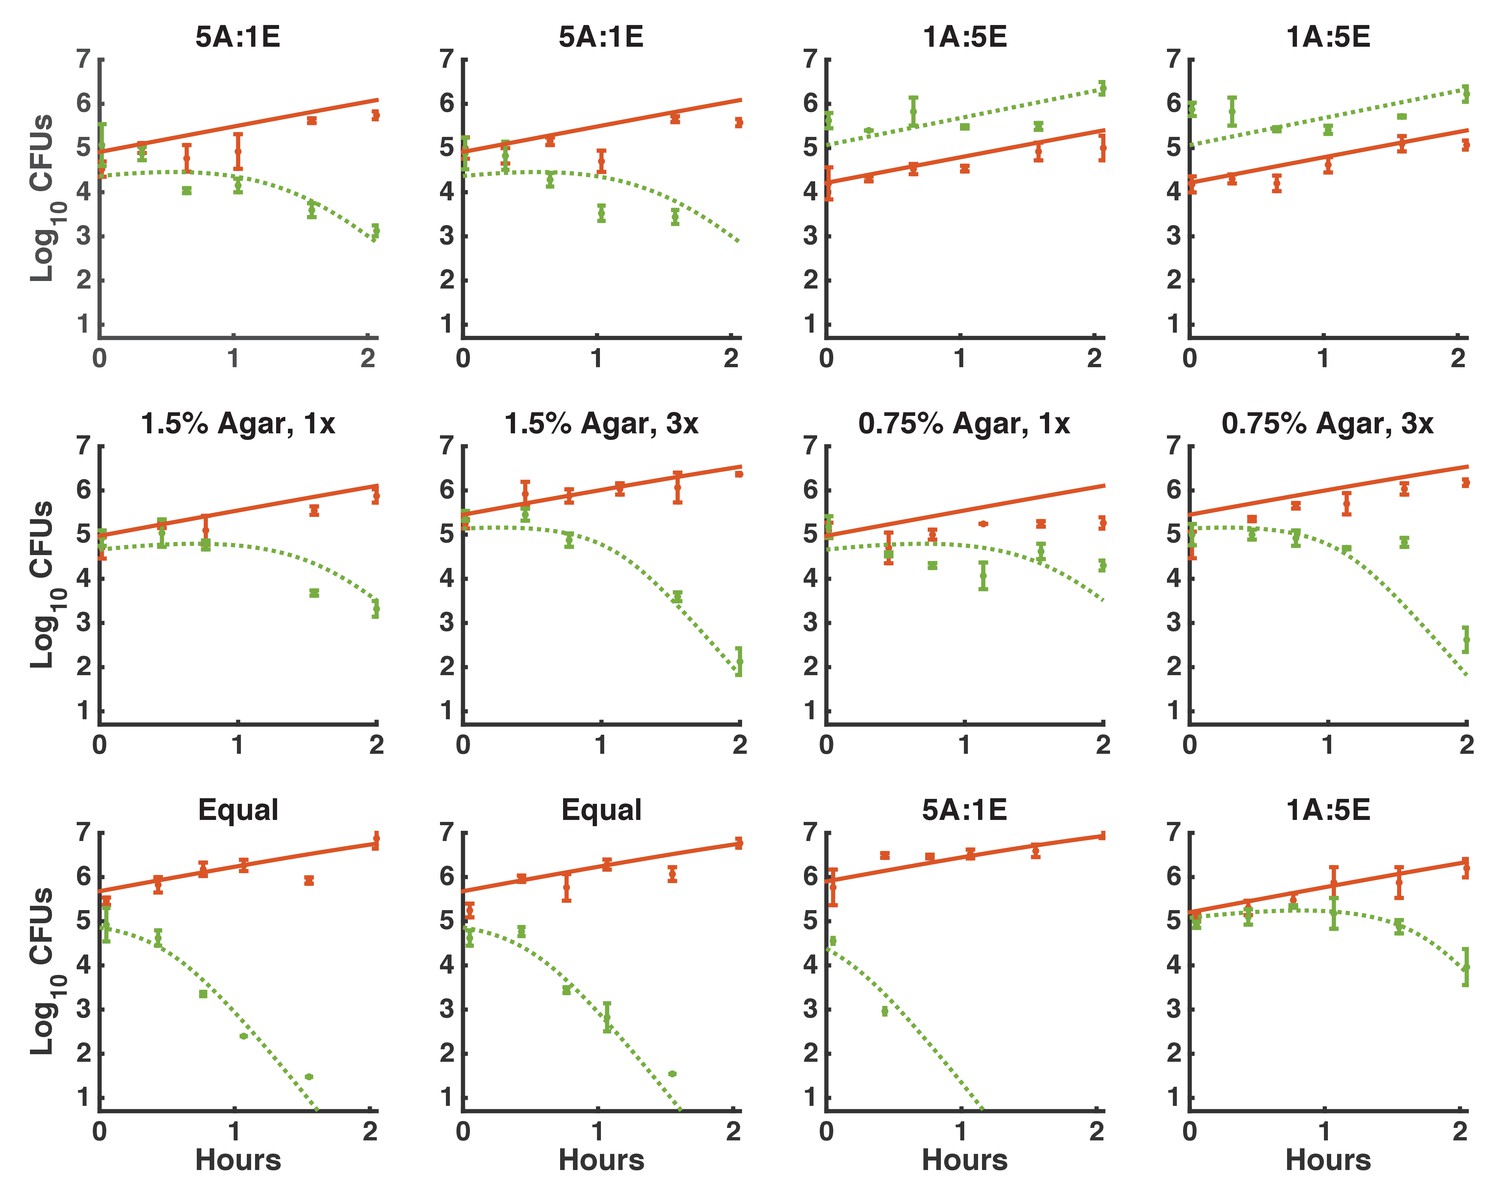
The full set of time courses used to fit the killing parameters. A subset of time courses are shown in Figure 3d–i. Each row represents experiments done on a different day. Each time course was seeded with different densities of Acinetobacter and E. coli. As in Figure 3d–i, solid orange: total Acinetobacter, dotted green: E. coli, error bars indicate measurement standard deviation for a single harvested spot.
Figure 3—figure supplement 4

Simulations of contact-dependent killing with and without restriction of killing to perimeter cells.
This is the same experimental data shown in Figure 3—figure supplement 3 and simulated using the same, best-fit parameters. Here, solid lines indicate simulations using N* to restrict killing to the perimeters of micro-colonies, and dashed lines indicate the same simulation without that restriction (i.e. replacing A* with A and E* with E). Green indicates E. coli, and orange indicates Acinetobacter.
Figure 3—figure supplement 5
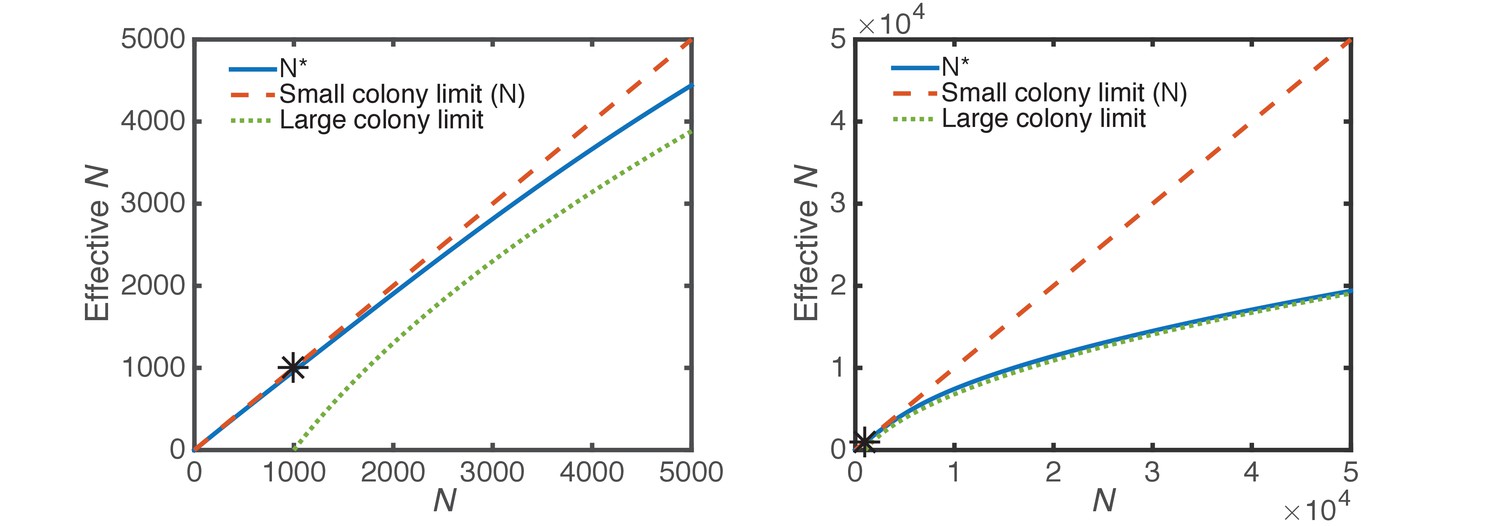
Effective perimeter cells.
The effective number of micro-colony perimeter cells (Equation 5, solid blue) is shown in comparison to the total number of cells (Equation 4, dashed orange, small micro-colony limit), and the large micro-colony limit (Equation 3, dotted green). The two panels are the same, but panel b is zoomed out by a factor of 10. The initial number of CFUs at seeding; i.e., in Equations 3,5, is 1000 (black asterisk).
Figure 4
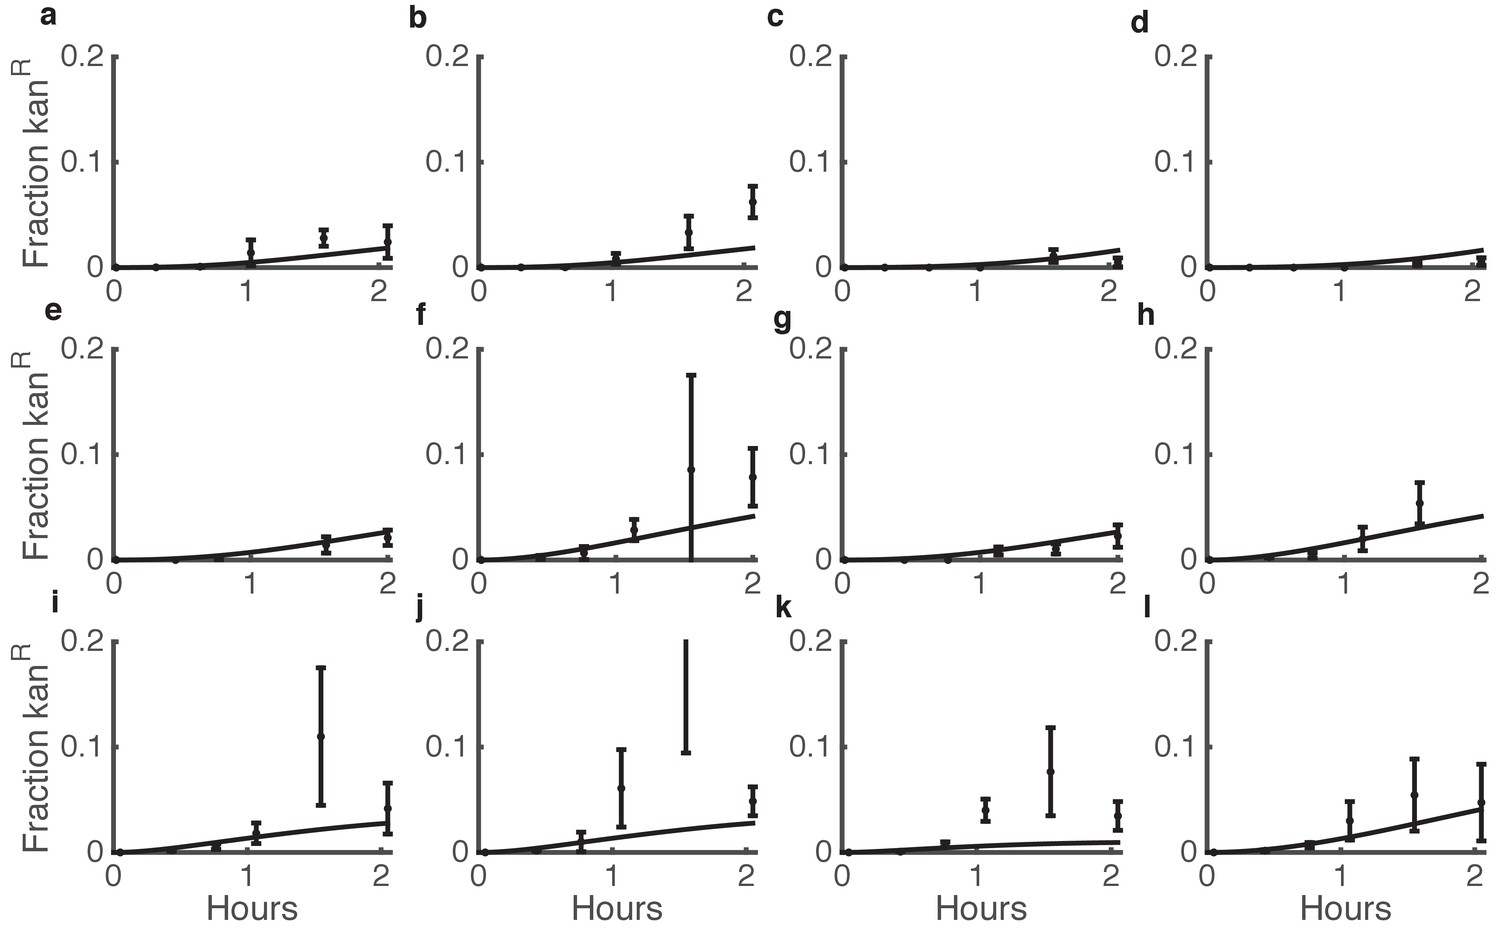
Comparison between predicted and actual killing-enhanced HGT in microbial communities.
Plotted is the fraction of Acinetobacter that have become double antibiotic-resistant due to HGT of kan resistance from E. coli. Data are from the same experiments as Figure 3d–i and Figure 3—figure supplement 3, which shows the total CFUs. Solid lines are model predictions, and error bars are standard deviations of experimental results. Each row of plots is from a different day, and plots within a row are for varying seeding densities of the two species (shown in the Figure Supplement at time 0).
Figure 5
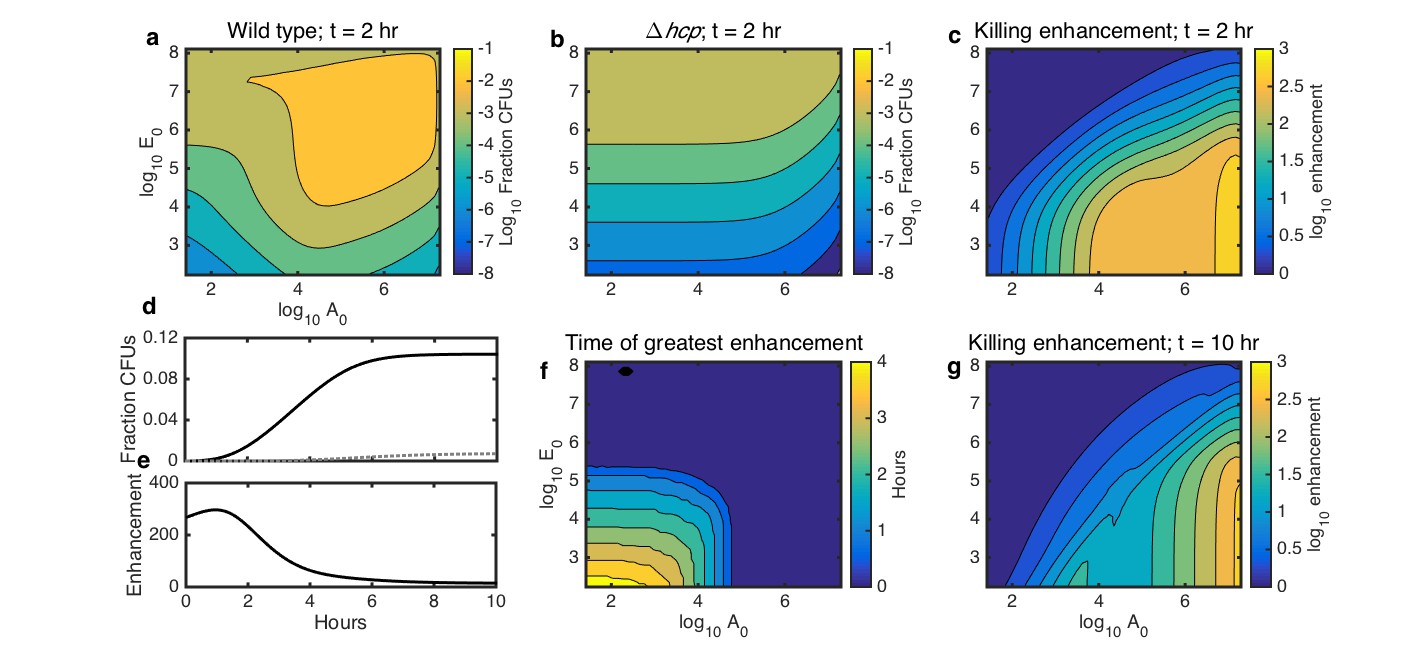
Simulations showing the effects of initial species density and interaction time on HGT, and the degree to which contact-dependent killing enhances HGT.
The axes in a-c,f,g indicate the initial cell count ( and ) relative to the carrying capacity ( and ) for Acinetobacter and E. coli, respectively. Contour levels indicate 10-fold changes in a,b, two-fold changes in c,g, and 30 min changes in f. (a) Simulated HGT frequency to wild-type Acinetobacter grown with E. coli at varying seeding densities for 2 hr. (b) Simulated HGT frequency as in a, but for killing-deficient Acinetobacter hcp. (c) The HGT enhancement factor provided by killing depending on seeding density; that is, the ratio of HGT to the wild type (a) divided by HGT to the killing mutant (b). (d) HGT frequency over time for agar surfaces seeded with both species at 10−3 of their respective carrying capacity. Solid line: wild type Acinetobacter, dotted gray line: killing mutant hcp Acinetobacter. (e) HGT enhancement factor provided by killing over time for the simulation in d. (f) Incubation time at which killing provides the greatest HGT enhancement, for varying seeding densities. (g) HGT enhancement as in c, but after 10 hr, by which time even sparsely seeded communities had approached simulated growth saturation.
Figure 6
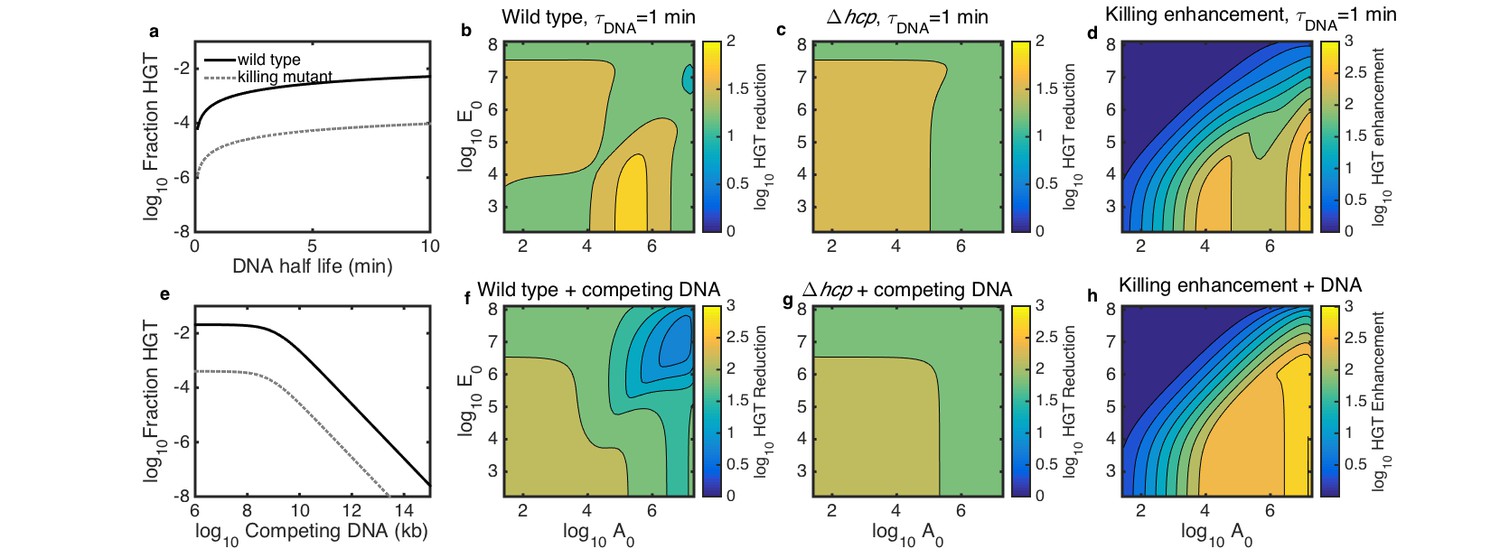
Simulated inhibition of HGT by DNase (a–d) or competing DNA (e–h) in simulated microbial communities seeded with both Acinetobacter and E. coli at 10−3 of their respective carrying capacities and grown for 2 hr.
All contour levels indicate two-fold differences, and all axis and colorbar scales are log10, except DNA half life in a. (a) Fraction of wild type (solid line) and non-killing (dotted grey line) Acinetobacter that have undergone HGT as a function of DNA half life in the extracellular space. (b,c) Fraction of wild type (b) and killing mutant (c) Acinetobacter that have undergone HGT with the half life of extracellular DNA set to 1 min, for varying initial cell counts. The axes indicate the initial cell count and for Acinetobacter and E. coli, respectively. (d) The degree to which killing increases HGT as a function of seeding density, with DNA half life set to 1 min; i.e., the ratio of HGT to the wild type (b) divided by HGT to the killing mutant (c). (e) HGT efficiency as in a, but with the addition of varying amounts of competing DNA rather than a finite DNA lifetime. (f,g) Efficiency of HGT as in b,c, but with the addition of 1011 kb of competing DNA at time 0 rather than DNA decay. (h) Enhancement of HGT provided by killing, as in d, but with 1011 kb of competing DNA at time 0 and no DNA degradation.
Figure 7
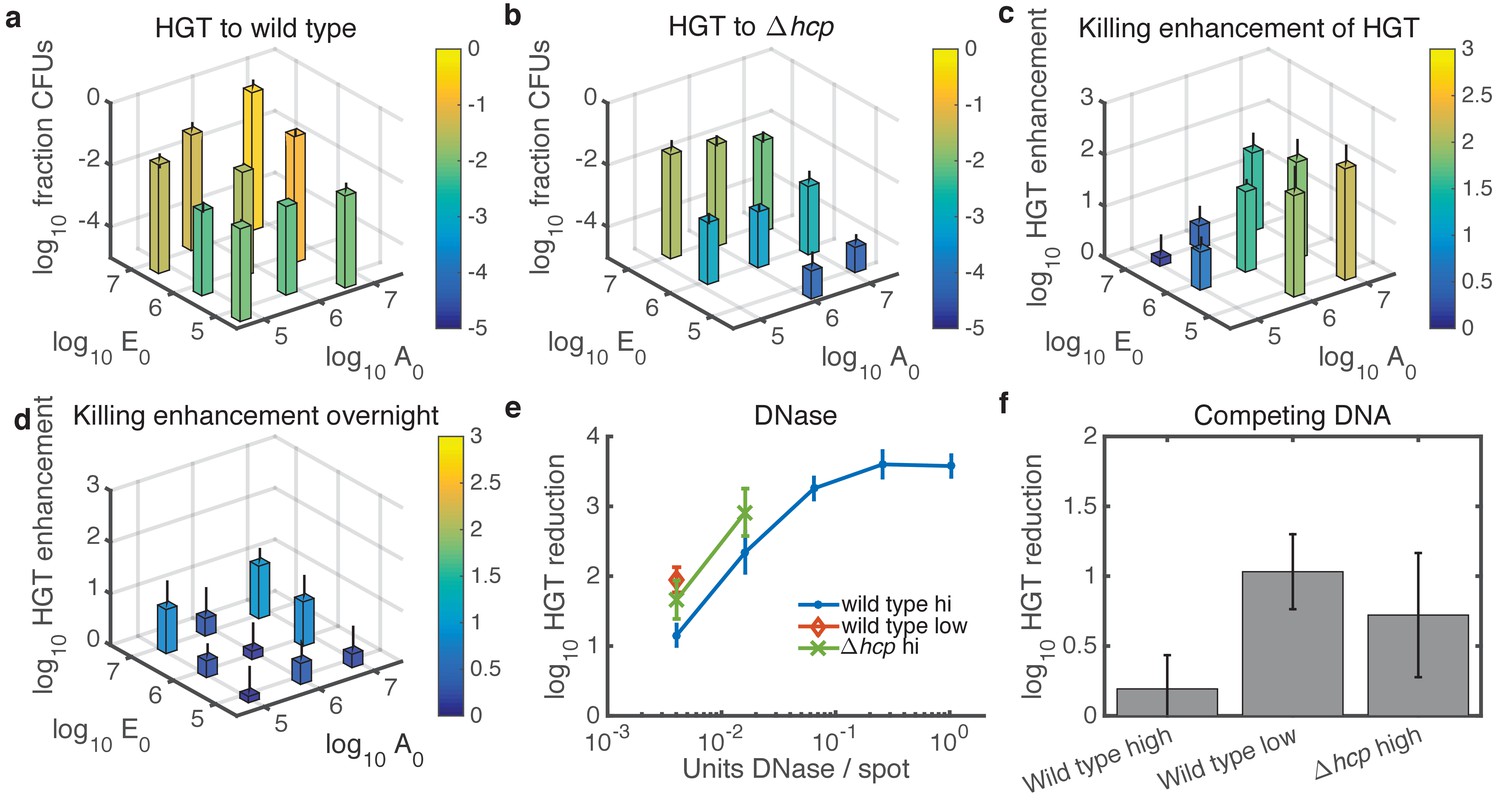
Experimental tests of model predictions.
(a–d) Dependence of HGT on cell seeding density. a HGT frequency to wild-type Acinetobacter spotted together with E. coli at the indicated cell counts ( and , respectively) and grown for 2 hr at 37°C. b HGT frequency as in a, but for Acinetobacter hcp. The missing bar at the bottom indicates data below detection. (c) HGT enhancment provided by killing; i.e., the ratio of data in a to that in (b) . (d) Same as in c but after overnight growth. (e) Reduction of HGT to wild type (blue dot) or hcp (green X) Acinetobacter seeded with E. coli at equal high density (approximately 3x10⁶ CFUs each), or to wild type with both species seeded at low density (3x10⁴ CFUs each, orange diamond), all mixed with the indicated amount of DNase before spotting and grown for 2 hr. Missing data points indicate HGT was below detection (5 CFUs), and HGT to Acinetobacter hcp was below detection (5 CFUs) for all tested levels of DNase. Reduction is relative to the same experiment with no DNase added. (f) HGT reduction as in e, but adding 1011 kb of competing DNA before spotting. Error bars indicate the propagated standard error.
Videos
Video 1
Real-time observation of HGT from E. coli to Acinetobacter.
E. coli carrying pBAV1k-PLac-GFP were mixed with Acinetobacter expressing mCherry in a microfluidic device. Most E. coli were rapidly killed, and multiple HGT events were observed across several traps (circled). PLac-GFP was not fully repressed within E. coli, despite the presence of LacI (not found in Acinetobacter), so some E. coli expressed GFP as well. Expression of mCherry in Acinetobacter faded toward the end of the movies (see also Supplemental Note 1). Individual movies are physically separated traps within the same microfluidic chip.
Video 2
Real-time observation of HGT from E. coli to Acinetobacter.
See caption to Video 1 for details. Individual movies are physically separated traps within the same microfluidic chip.
Video 3
Real-time observation of HGT from E. coli to Acinetobacter.
See caption to Video 1 for details. Individual movies are physically separated traps within the same microfluidic chip.
Video 4
Real-time observation of HGT from E. coli to Acinetobacter.
See caption to Video 1 for details. Individual movies are physically separated traps within the same microfluidic chip.
Video 5
Real-time observation of HGT from E. coli to Acinetobacter.
See caption to Video 1 for details. Individual movies are physically separated traps within the same microfluidic chip.
Video 6
Real-time observation of HGT from E. coli to Acinetobacter.
See caption to Video 1 for details. Individual movies are physically separated traps within the same microfluidic chip.
Video 7
Killing-enhanced HGT enables Acinetobacter to dynamically adapt to new environments.
Acinetobacter and E. coli were grown together in a microfluidic chip as in Videos 1–6 for several hours, after which the media was switched to include kanamycin, resistance to which is encoded on the transferring plasmid pBAV1k. The movies begin 7.5 hr after kanamycin addition. Only Acinetobacter expressing GFP continue to grow. These mCherry+/GFP + cells push their mCherry+/GFP- parents out of the trap and kill neighboring E. coli.
Video 8
Killing-enhanced HGT enables Acinetobacter to dynamically adapt to new environments.
See caption to Video 7 for details. Individual movies are physically separated traps within the same microfluidic chip.
Video 9
E. coli lysis is concentrated at the periphery of micro-colonies.
Four representative micro-colonies were selected from Videos 2 and 3 to highlight the enrichment of E. coli cell lysis at the boundaries of micro-colonies, where the cells are in contact with Acinetobacter cells. E. coli are shown in green and Acinetobacter in red; in some cases the E. coli micro-colony is eliminated, and in others it survives. Left panels: difference images were calculated for the green (E. coli) channel by subtracting the subsequent time point from the current one. This shows where the the GFP signal dramatically decreases, indicating cell lysis between the two time points. These regions of putative cell lysis are shown in yellow. Right panels: the same movies, but without the yellow difference signal and including the transmitted light channel, for comparison. After the mCherry signal from Acinetobacter fades (see Supplemental Note 1), the location of Acinetobacter surrounding the E. coli can be seen in the transmitted light channel. Note that some color intensity scales were chosen differently for the two panels to optimize clarity for the viewer.
Video 10
E. coli lysis is concentrated at the periphery of micro-colonies.
Four representative micro-colonies were selected to highlight the enrichment of E. coli cell lysis at the boundaries of micro-colonies. See caption to Video 9 for details.
Video 11
E. coli lysis is concentrated at the periphery of micro-colonies.
Four representative micro-colonies were selected to highlight the enrichment of E. coli cell lysis at the boundaries of micro-colonies. See caption to Video 9 for details.
Video 12
E. coli lysis is concentrated at the periphery of micro-colonies.
Four representative micro-colonies were selected to highlight the enrichment of E. coli cell lysis at the boundaries of micro-colonies. See caption to Video 9 for details.
Tables
Table 1
Microbial community growth, killing, and horizontal gene transfer parameters.
See Materials and methods and main text for details.
| Parameter | Description | Value | Source |
|---|---|---|---|
| A | Acinetobacter growth rate | 1.34 hr∧−1 | Figure 3—figure supplement 1 |
| E | E. coli growth rate | 1.51 hr-1 | Figure 3—figure supplement 2 |
| KA | Acinetobacter growthsaturation | 2.6 x 10⁷ | Figure 3—figure supplement 1 |
| KE | E. coli growth saturation | 1.7 x 10⁸ | Figure 3—figure supplement 2 |
| rkill | Killing rate | 15 hr-1 | Figure 3d–j |
| Kkill | Killing saturation | 9.3 x 10⁵ | Figure 3d–j |
| KE_kill | Killing saturationprey factor | 17 | Figure 3d–j |
| rleak | Spontaneous E. colilysis rate | 9.9 x 10⁻⁴ hr-1 | Figure 3k,l |
| c | DNA uptake rate | 60 bp/s | (Mao and Lu, 2016) |
| KDNA | DNA uptake saturation | 6.7 x 10⁸ kb | Figure 3a–c |
| ε | Plasmid transformationefficiency | 6.7 x 10⁻³ | Figure 3a–c |
| p | Plasmids per E. colicell | 162 | See Materials and methods |
| G | Plasmid equivalents ofgenomic DNA per cell | 506 | = 3.6x10⁶ /9093 |
Additional files
-
Source code 1
Supplementary Matlab model file used to generate Figures 6 and 7.
This uses parallel processing - if you would rather not, please replace parfor with for. It takes about 15 min to get all the way through on my desktop computer using parallel processing.
- https://doi.org/10.7554/eLife.25950.032
-
Transparent reporting form
- https://doi.org/10.7554/eLife.25950.033
Download links
A two-part list of links to download the article, or parts of the article, in various formats.
Downloads (link to download the article as PDF)
Open citations (links to open the citations from this article in various online reference manager services)
Cite this article (links to download the citations from this article in formats compatible with various reference manager tools)
Inter-species population dynamics enhance microbial horizontal gene transfer and spread of antibiotic resistance
eLife 6:e25950.
https://doi.org/10.7554/eLife.25950


