Countercurrent heat exchange and thermoregulation during blood-feeding in kissing bugs
- UMR 7261 CNRS - Université François Rabelais, France
- Universidade Federal de Minas Gerais, Brazil
- University of Saskatchewan, Canada
- Canadian Light Source Inc., Canada
Figures
Figure 1 with 1 supplement
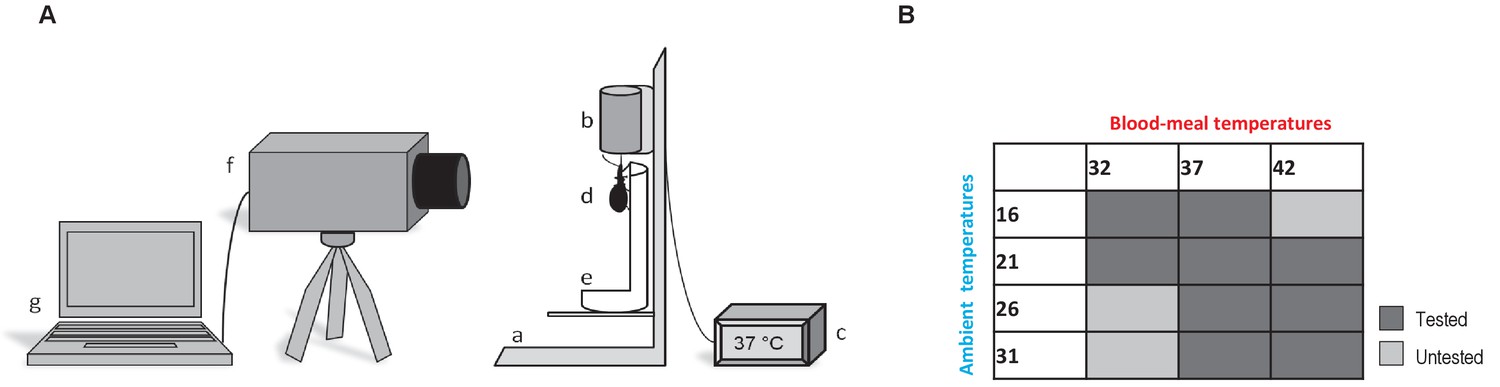
Thermographic experiments.
(A) Experimental device used for Rhodnius prolixus blood-feeding and thermography. (a) artificial feeder, (b) blood container, (c) thermostat, (d) bug, (e) opened falcon tube, (f) thermographic camera, (g) computer. (B) Blood-meal and ambient temperatures combinations used during the experiments. Dark grey is related to the tested combinations; light grey corresponds to the combinations that were not tested.
Figure 1—figure supplement 1
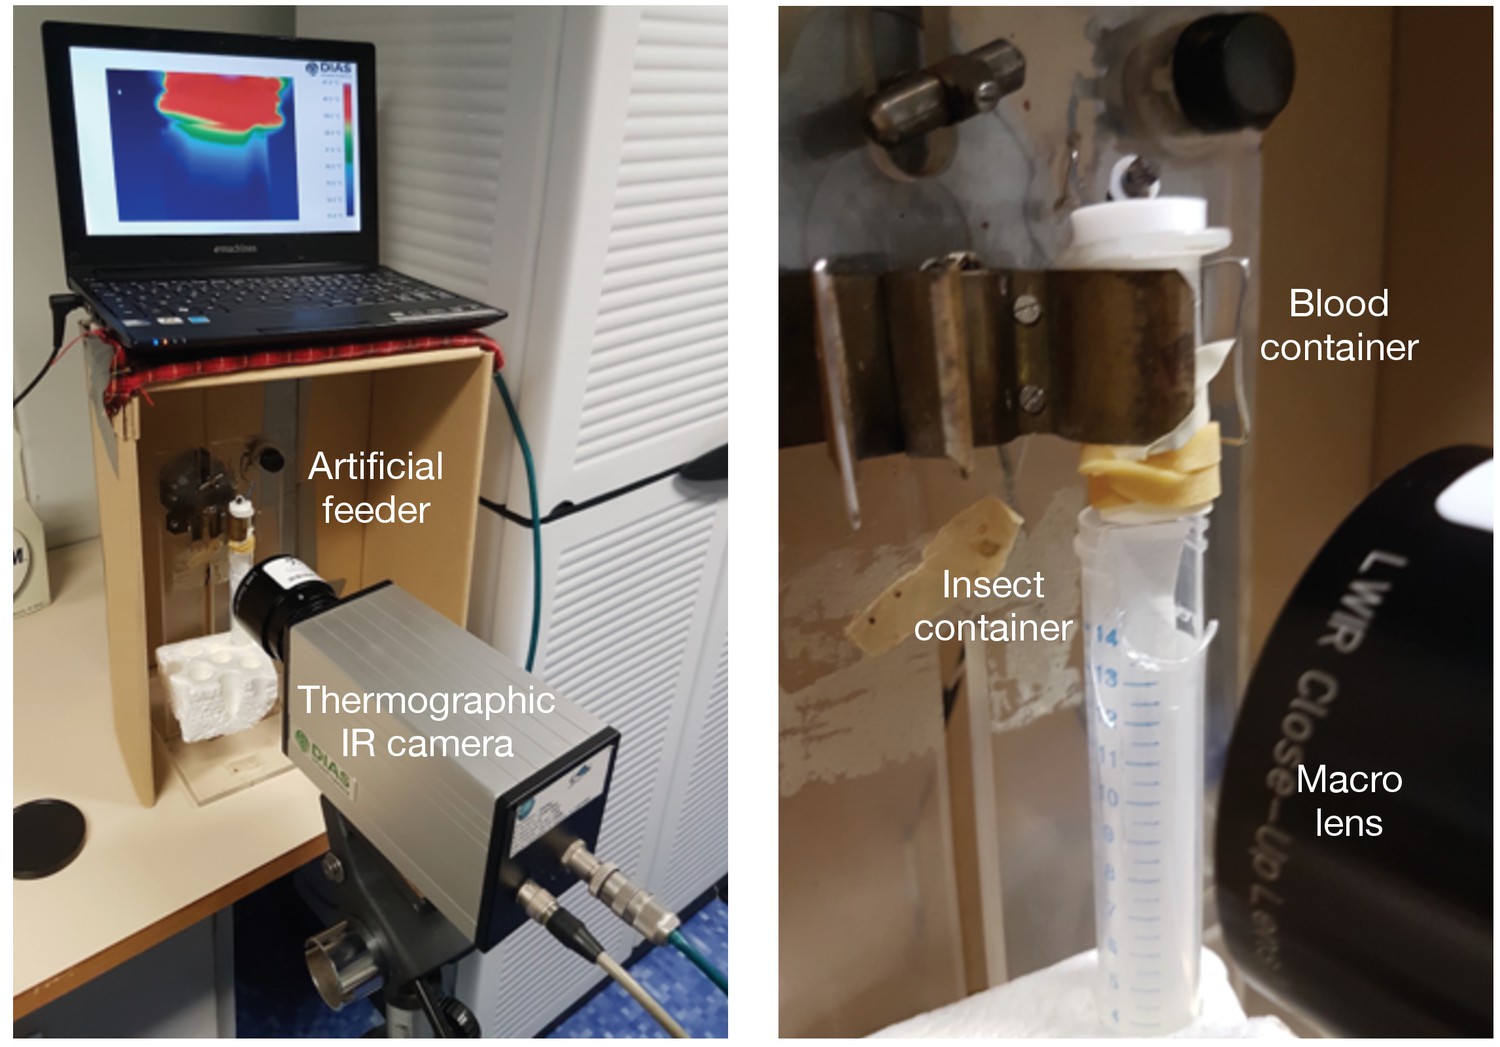
General view (left panel) and details (right panel) of the setup used for infrared thermography.
An individual was place inside a falcon tube cut to let free the space between the bug and the camera; blood at the chosen temperature was offered through a latex membrane and the data from the camera sent to a computer.
Figure 2 with 1 supplement
Heterothermy and HSP synthesis associated to feeding in kissing bugs.
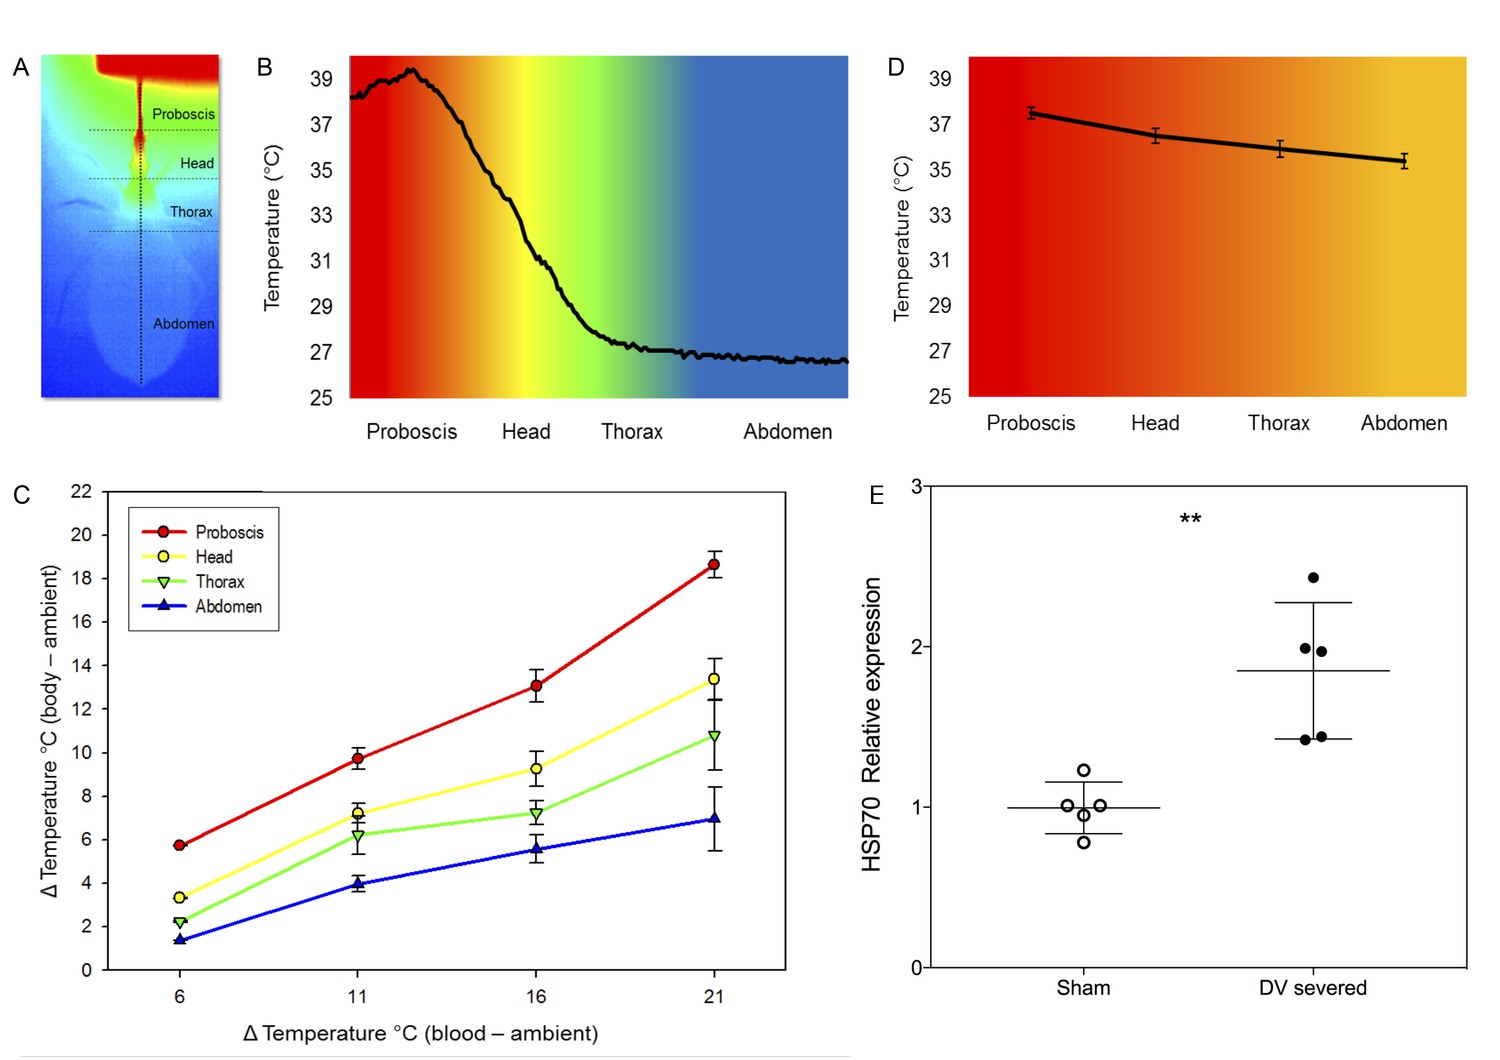
(A) Thermogram (dorsal view) of Rhodnius prolixus during feeding on sheep blood (Tblood = 40°C) in an artificial feeder (on top). Horizontal dotted lines separate the different parts of the body, that is proboscis, head, thorax and abdomen. The vertical dotted line represents a transect along which the temperature of the surface of the insect’s body was measured. (B) Temperatures recorded along the transect designated in A. (Tblood = 40°C). (C) Impact of the difference between blood (Tblood) and environmental (Ta) temperatures on the body temperature of Rhodnius prolixus. (D) Average temperature of the proboscis, head, thorax and abdomen during blood-feeding in insects with severed dorsal vessels. (E) Relative levels of expression of HSP70 of sham-operated and dorsal vessel-severed bugs, measures 2 hr after fed on blood at 39°C. Asterisks: t-test, p<0.01, n = 5.
-
Figure 2—source data 1
Source data of temperature in different parts of the body (P, proboscis; T, head; Th, thorax and A, abdomen) for different combinations of environment (16°C, 21°C, 26°C and 31°C) and blood temperature (32°C, 37°C and 42°C).
Sheet 1 (T°C): raw data; sheet 2 (∆T°C) temperature difference between blood and the different parts of the insect body.
- https://doi.org/10.7554/eLife.26107.008
-
Figure 2—source data 2
Source data and statistical analysis (t-test) of the expression of HSP70 and HSP90 in bugs which dorsal vessel was severed before feeding and sham operated animals.
Sheet 1 (Data and t-test): raw data and statistical analysis; sheet 2 (Summary): summary of results and graph.
- https://doi.org/10.7554/eLife.26107.009
Figure 2—figure supplement 1
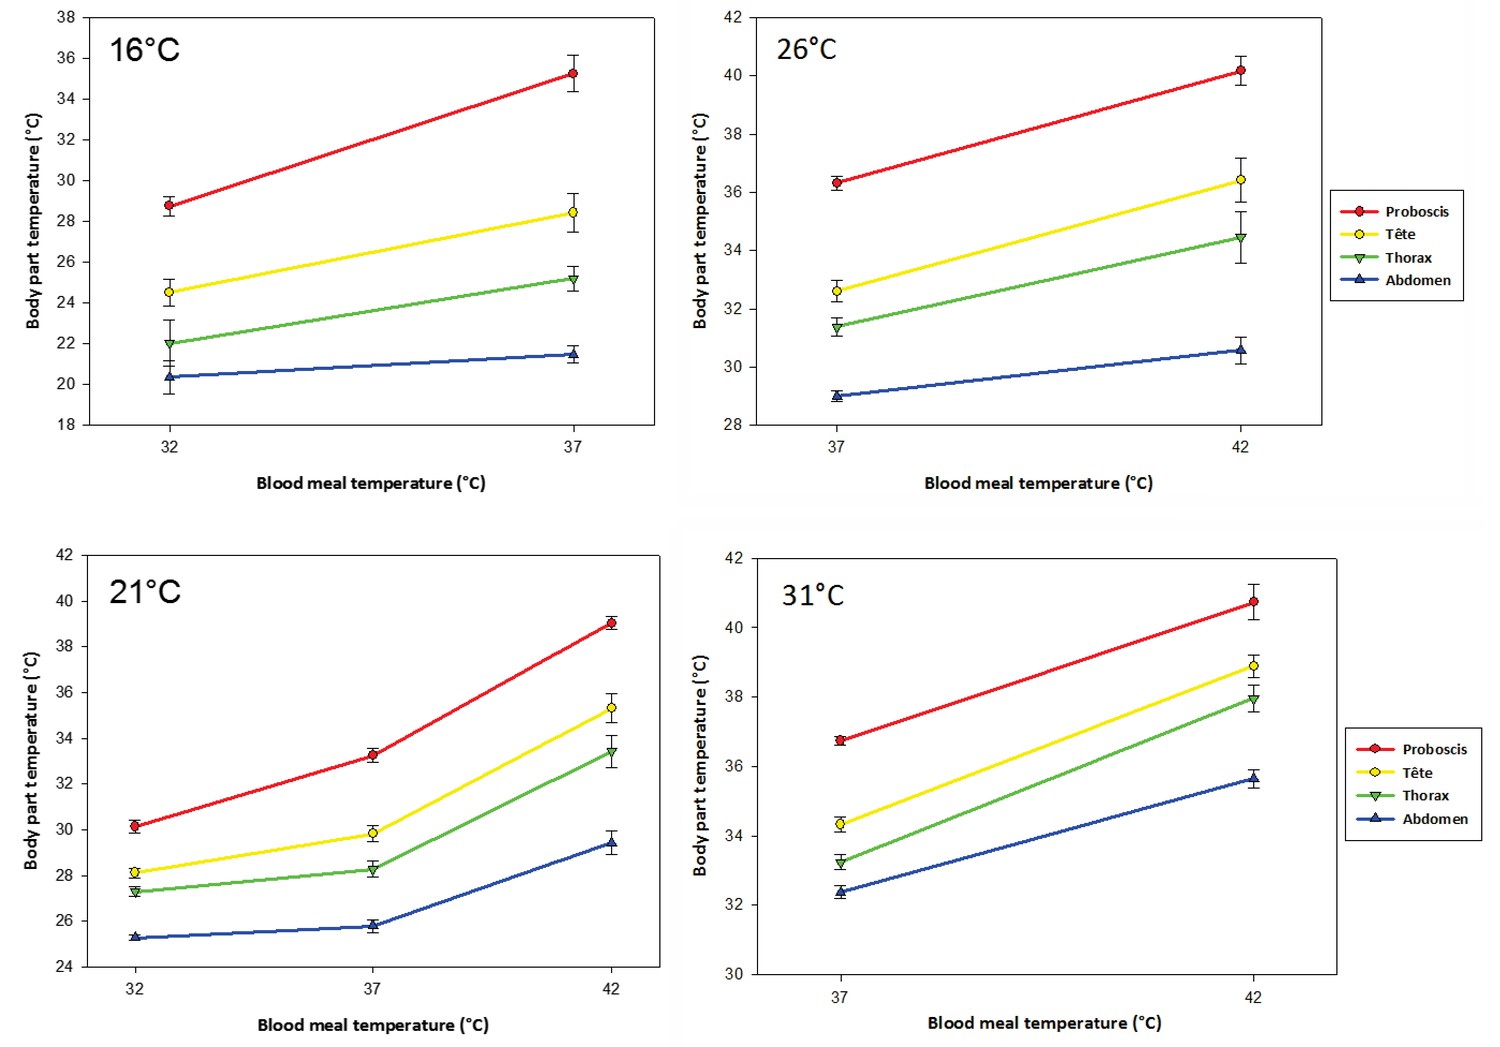
Mean temperatures of the proboscis (red), the head (yellow), the thorax (green) and the abdomen (blue) of Rhodnius prolixus during feeding on blood at either 32°C, 37°C or 42°C in an environment at either 16°C, 21°C, 26°C or 31 ± 1°C for all tested temperatures.
Vertical bars represent standard error of the mean values (S.E.M). Results for the statistical comparisons (two-way ANOVA) are presented in the Table 1.
Figure 3
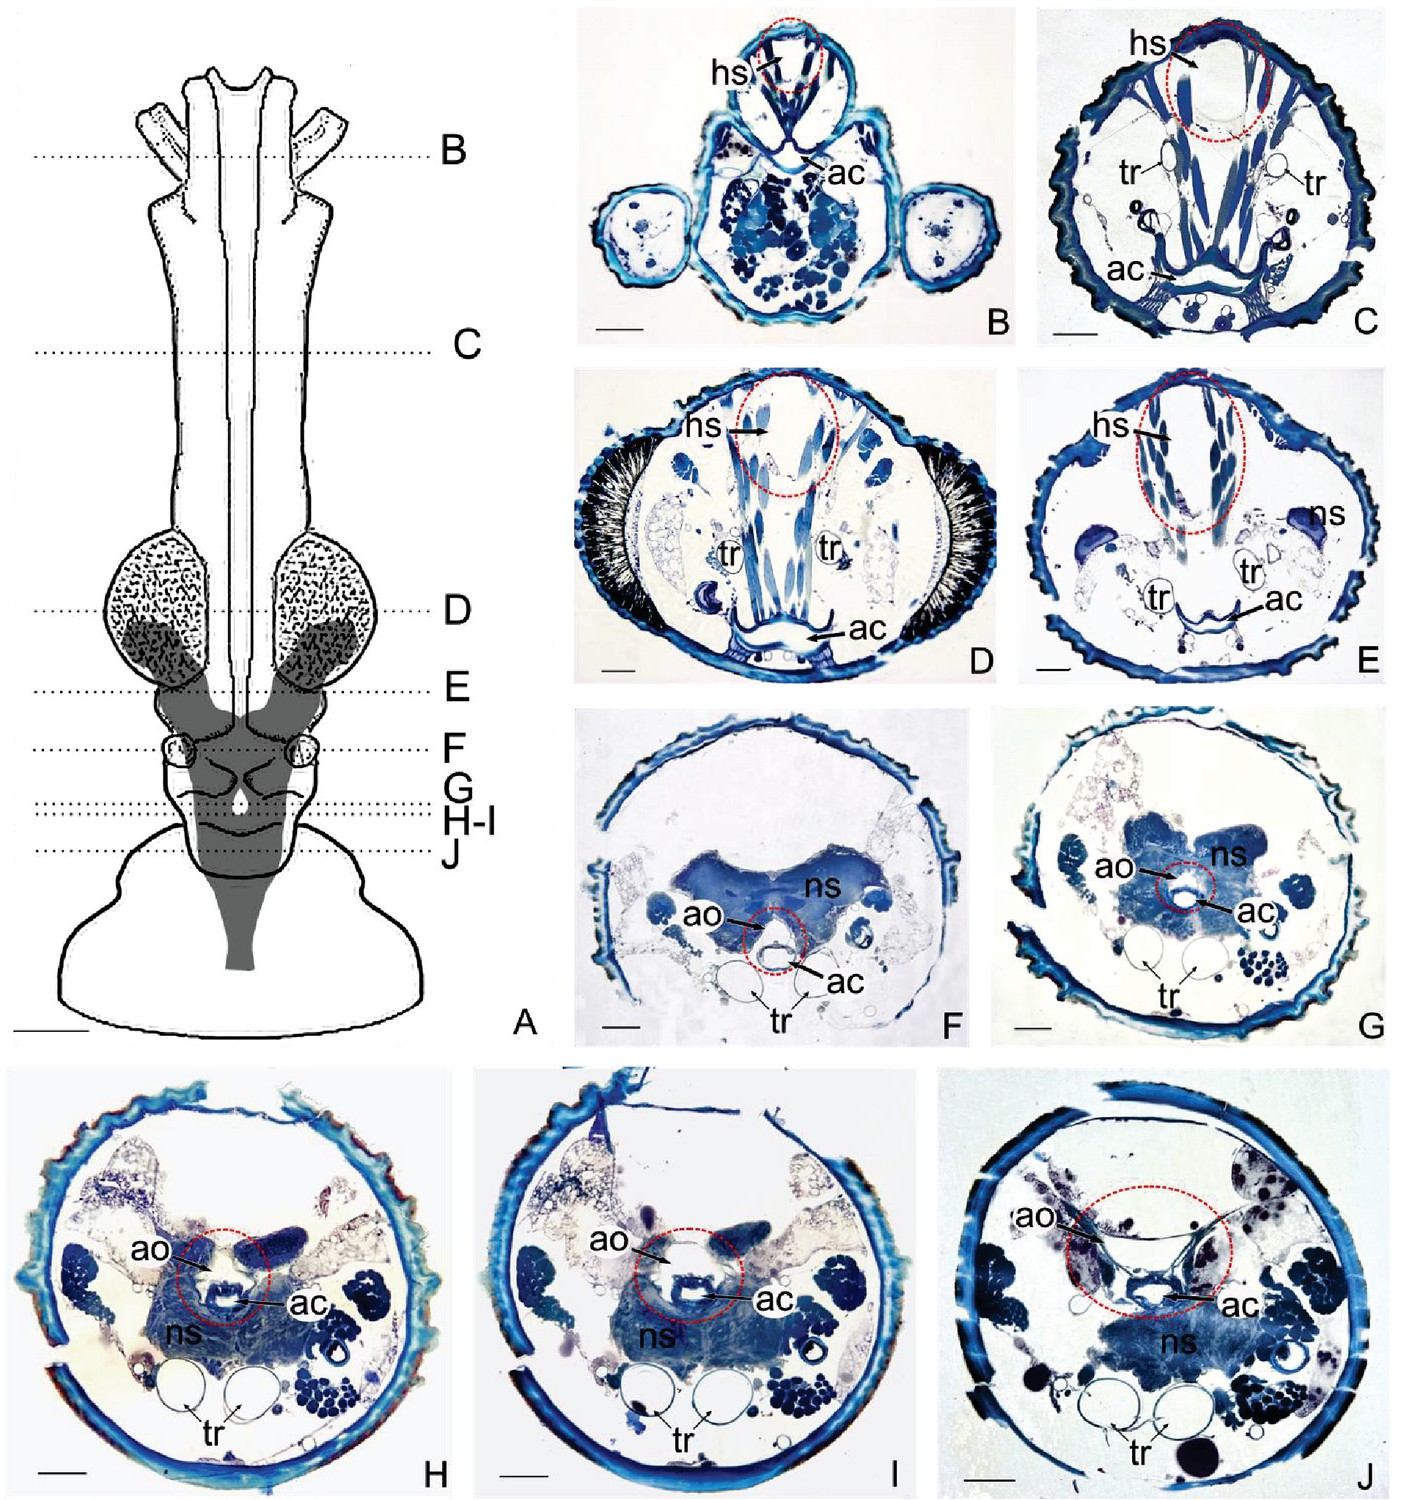
Anatomical organisation of the head of a kissing bug.
(A) Diagram of the head of Rhodnius prolixus showing the position of the brain. (B–J): Photomicrographs of frontal sections of the head at different levels indicated in the diagram A. Dotted red lines show the position of the haemolymphatic sinus (B–E) and the aorta (F–J). Note the close association between the aorta and the alimentary canal (B–J) and the dorsal haemolymphatic sinus with the dorsal head surface (B–E) where heat transfer takes place. ac, alimentary canal; ao, aorta; hs, haemolymphatic sinus; ns, nervous system; t, trachea. Dotted red lines show where heat transfer takes place. Scales bars: A, 300 μm; B-J, 100 μm.
Figure 4
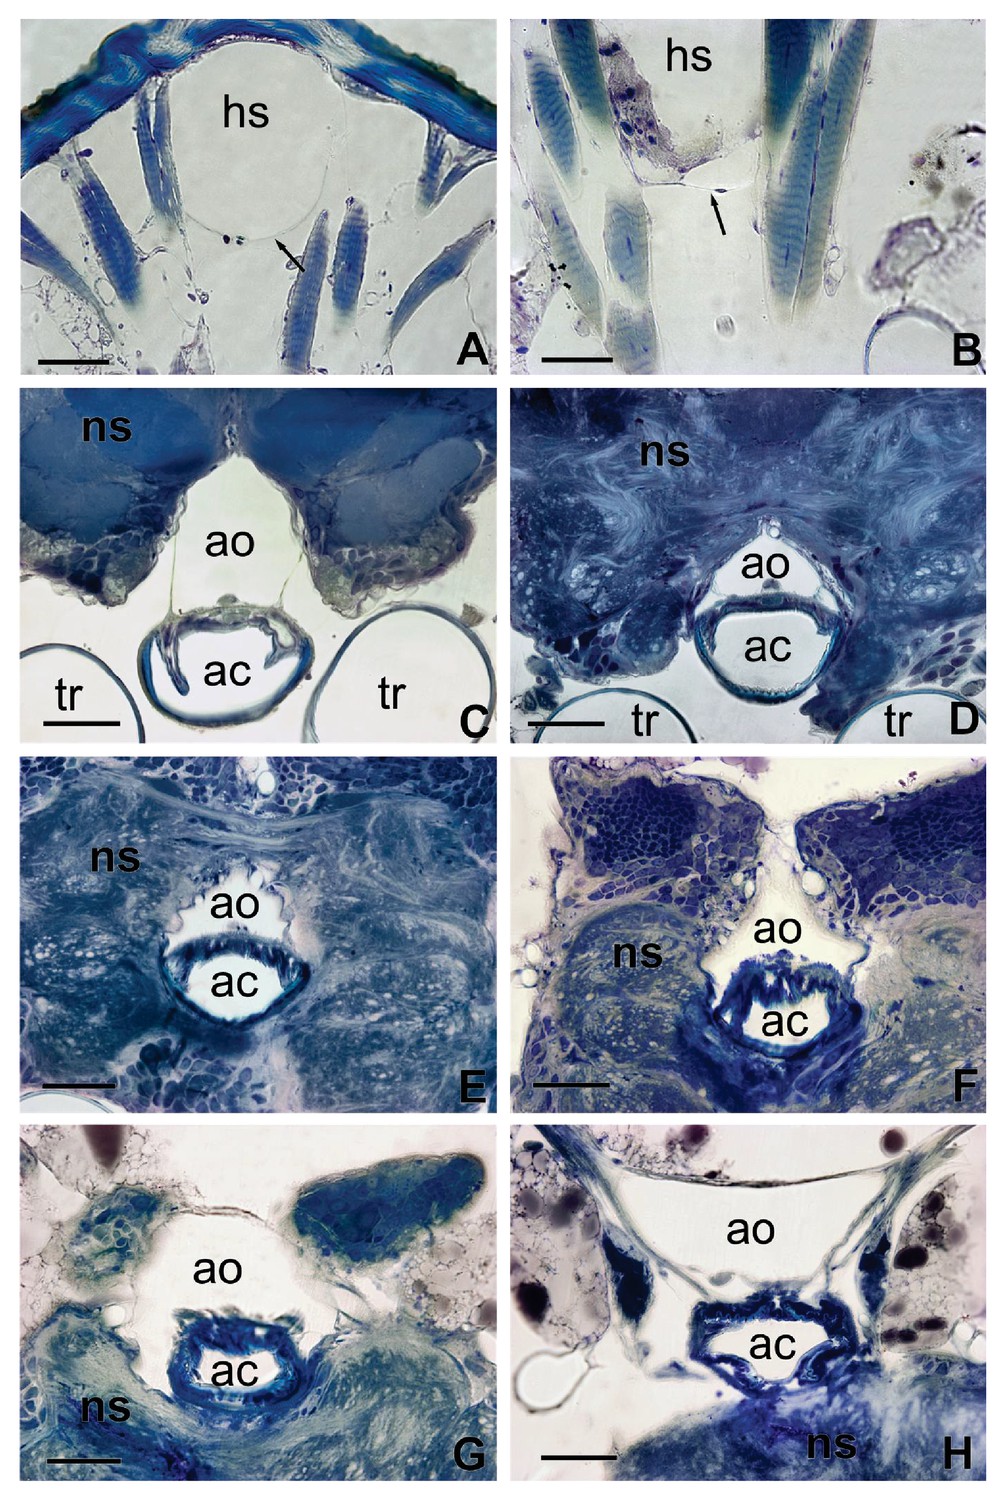
Sections of Figure 3 showing in details the interaction between the aorta and the alimentary canal (C–H) and the haemolymphatic sinus with the dorsal tegument of the head (A).
The arrow in (A) shows the ventral membrane delimiting the basal part of the haemolymphatic sinus. (B) Detail of the ventral membrane of the haemolymphatic sinus (arrow). ac, alimentary canal; ao, aorta; hs, haemolymphatic sinus; ns, nervous system; t, trachea. Scales bars: 100 μm.
Figure 5
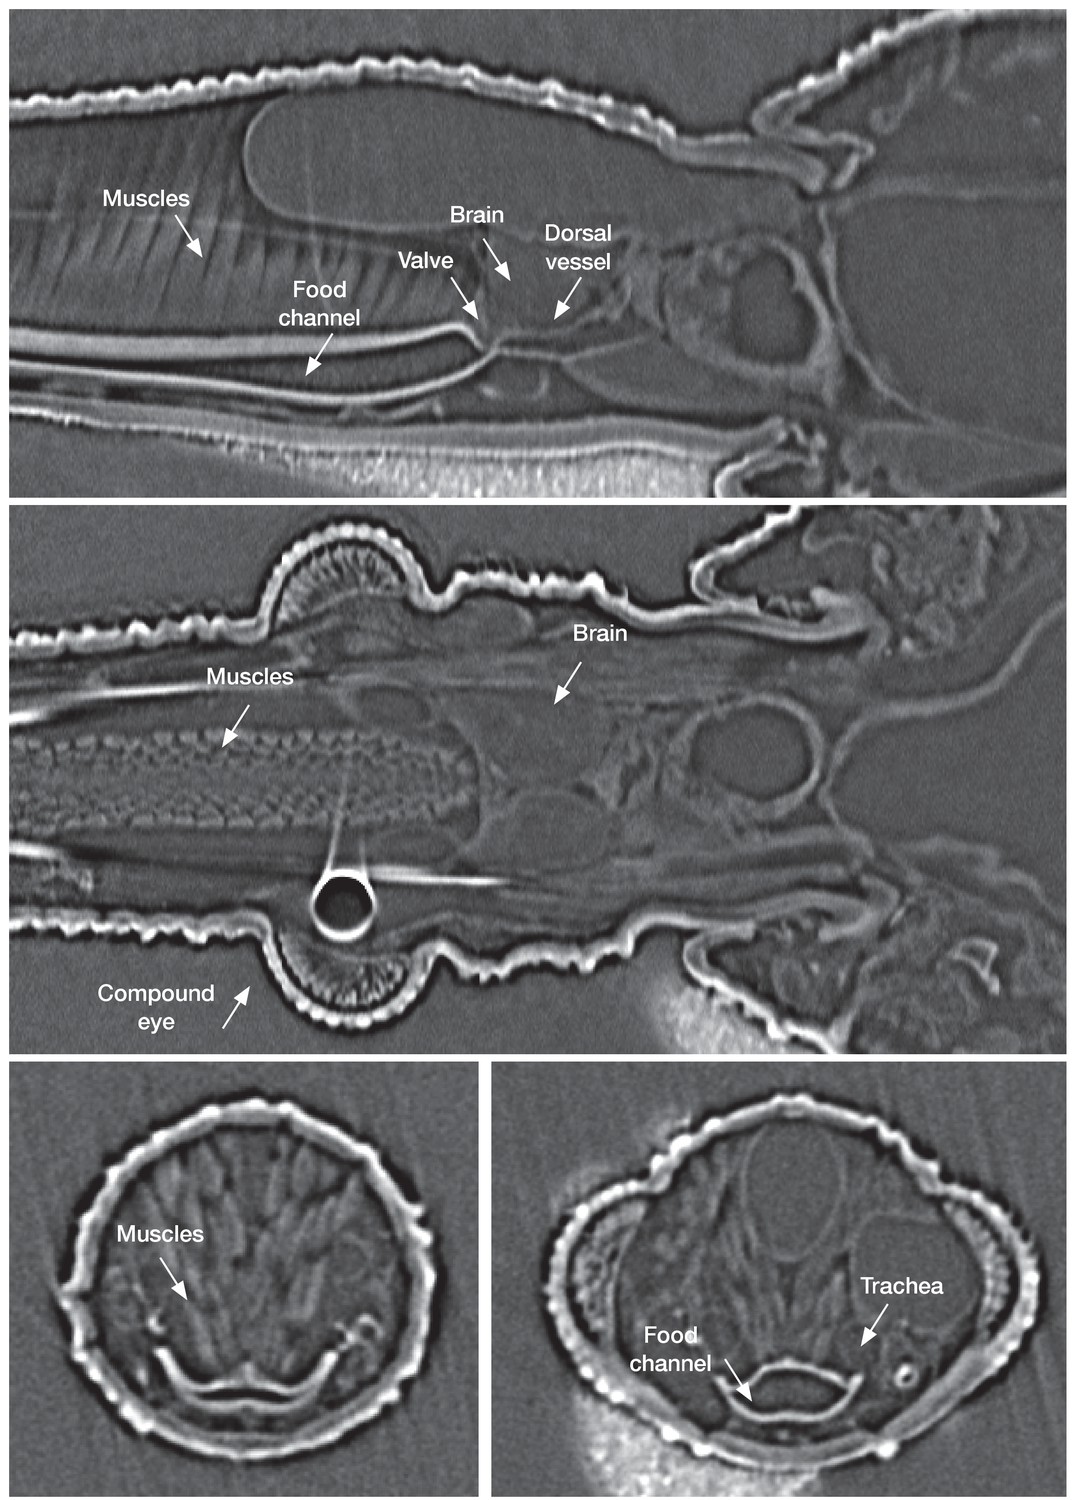
In vivo µ-CT(micro-computed-tomography scanner) imaging of a fifth instar Rhodnius prolixus larvae head in sagittal view (top), horizontal view (middle) and traversal view (bottom) showing the organization of the different structures in the insect head.
https://doi.org/10.7554/eLife.26107.013
Figure 6

Ingestion pumps in kissing bugs.
(A) X-ray imaging of a fifth instar Rhodnius prolixus larvae in sagittal view during blood-feeding. (B) and (C). Pictures showing the activity of the ingestion pumps during blood-feeding. (D) Activity of the cibarial and pharyngeal pumps during blood intake showing that they work in antiphase.
Figure 7
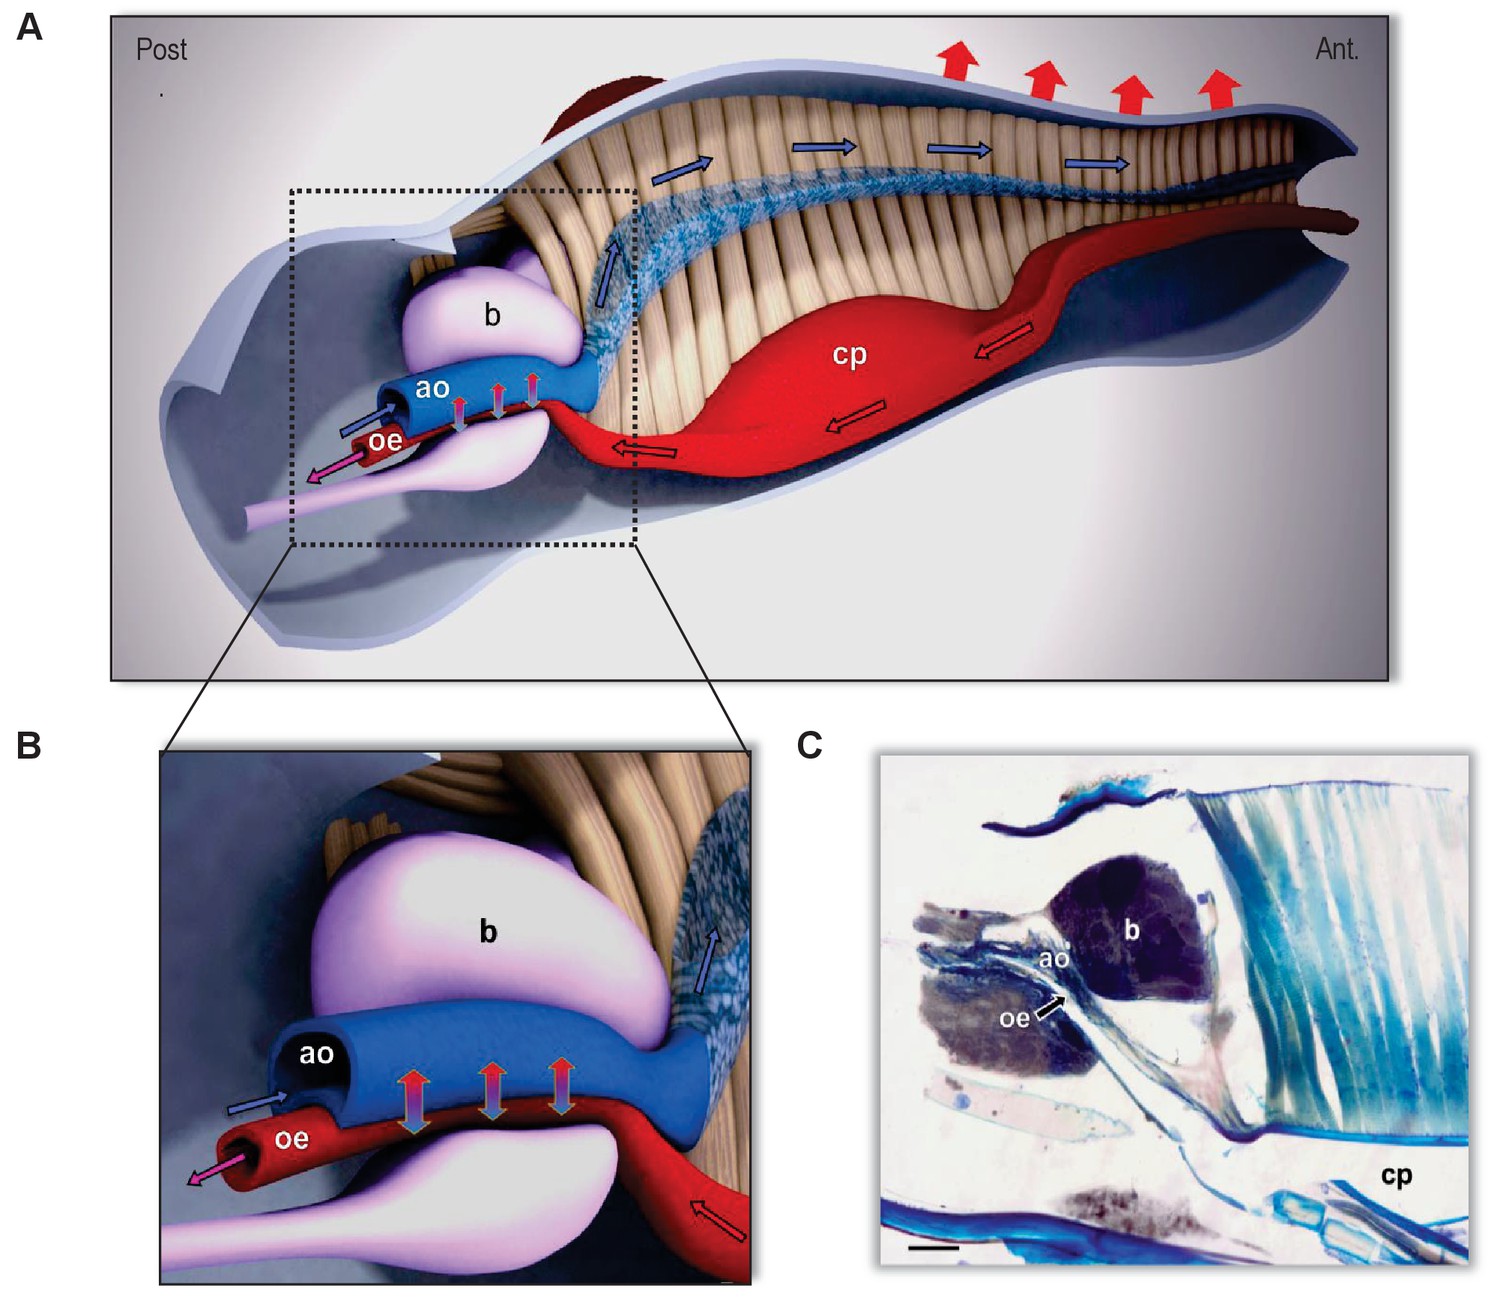
The countercurrent heat-exchanger in the head of kissing bugs.
(A) Sagittal section of the head of Rhodnius prolixus (scale bar, 100 µm). (B, C) 3-Dimensional reconstruction of the head based on frontal and sagittal sections. A: Detail of the countercurrent heat exchanger at level of the brain. (B) General view of the head and circulation routes of ingested blood (red) and haemolymph (blue). Note the close association between the aorta (ao) and the alimentary canal (oe) at the level of the brain (b). In beige, the muscles of the cibarial pump (cp). Directions of flowing fluids are indicated by arrows: red/black arrows indicate the direction of the ingested blood circulating in the alimentary canal; blue/black arrows indicate the flow direction of the haemolymph. Red arrows on top indicate the heat loss to the environment by both convection and radiation. Vertical blue/red arrows indicate the countercurrent heat transfer between aorta and oesophagus fluids and the consequently refreshed blood that continues toward the thorax (purple arrow). The exact location of the system is behind the compound eyes, as can be appreciated in Figures 2–4.
Videos
Video 1
Rhodnius prolixus thermogram during blood feeding on an artificial feeder.
The blood was maintained at 37°C and the room temperature was 22°C. We recorded a frame every 10 s.
Video 2
X-ray synchrotron video in a sagittal view during blood intake of a fifth instar Rhodnius prolixus larvae showing the activity of the cibarial and pharyngeal pumps.
https://doi.org/10.7554/eLife.26107.015
Video 3
X-ray synchrotron video in dorsal view during blood intake of a fifth instar Rhodnius prolixus larvae showing the activity of the cibarial pump as well as the tracheal network surrounding each side of the pumps and extending towards the thorax and abdomen of the insect.
https://doi.org/10.7554/eLife.26107.016
Video 4
Three-dimensional reconstruction of the tracheal system (in pink) in Rhodnius prolixus’ head showing the two big trachea on each side of the cibarial pump (in blue) as well as secondary and tertiary trachea networks surrounding the pump.
Note that the tracheal system extends beyond the prothorax (see Ramírez-Pérez, 1969 for a complete overview of the tracheal network all along the insect’s body).
Tables
Table 1
Two-way ANOVA table for the analysis of the impact of the temperature of the blood (Tblood) and the environmental temperature on the different body part of Rhodnius prolixus during feeding.
(See also Figure 2C and Supplementary file 1).
| Source of variation | DF | Sum of squares | Mean square | F-value | P-value |
|---|---|---|---|---|---|
| 1- Body part | 3 | 813.546 | 271.182 | 302.798 | <0.001 |
| 2- Tblood | 3 | 672.914 | 224.305 | 250.455 | <0.001 |
| 1 × 2 | 9 | 91.142 | 10.127 | 11.308 | <0.001 |
| Residual | 92 | 82.394 | 0.896 | ||
| Total | 107 | 1860.120 | 17.384 |
Additional files
-
Supplementary file 1
Two-way ANOVA tables for the analysis of the impact of the temperature of the blood (Tblood) and the environmental temperature on the different body parts of Rhodnius prolixus during feeding.
(See also Figure 2—figure supplement 1). From top to bottom, Ta = 16°C, 21°C, 26°C or 31°C.
- https://doi.org/10.7554/eLife.26107.019
-
Transparent reporting form
- https://doi.org/10.7554/eLife.26107.020
Download links
A two-part list of links to download the article, or parts of the article, in various formats.
Downloads (link to download the article as PDF)
Open citations (links to open the citations from this article in various online reference manager services)
Cite this article (links to download the citations from this article in formats compatible with various reference manager tools)
Countercurrent heat exchange and thermoregulation during blood-feeding in kissing bugs
eLife 6:e26107.
https://doi.org/10.7554/eLife.26107


