Mobilization of LINE-1 retrotransposons is restricted by Tex19.1 in mouse embryonic stem cells
- University of Edinburgh, United Kingdom
- Pfizer-Universidad de Granada-Junta de Andalucía, PTS Granada, Spain
- Max Planck Institute for Developmental Biology, Germany
- University of Oslo, Norway
- Oslo University Hospital, Norway
Figures
Figure 1 with 1 supplement
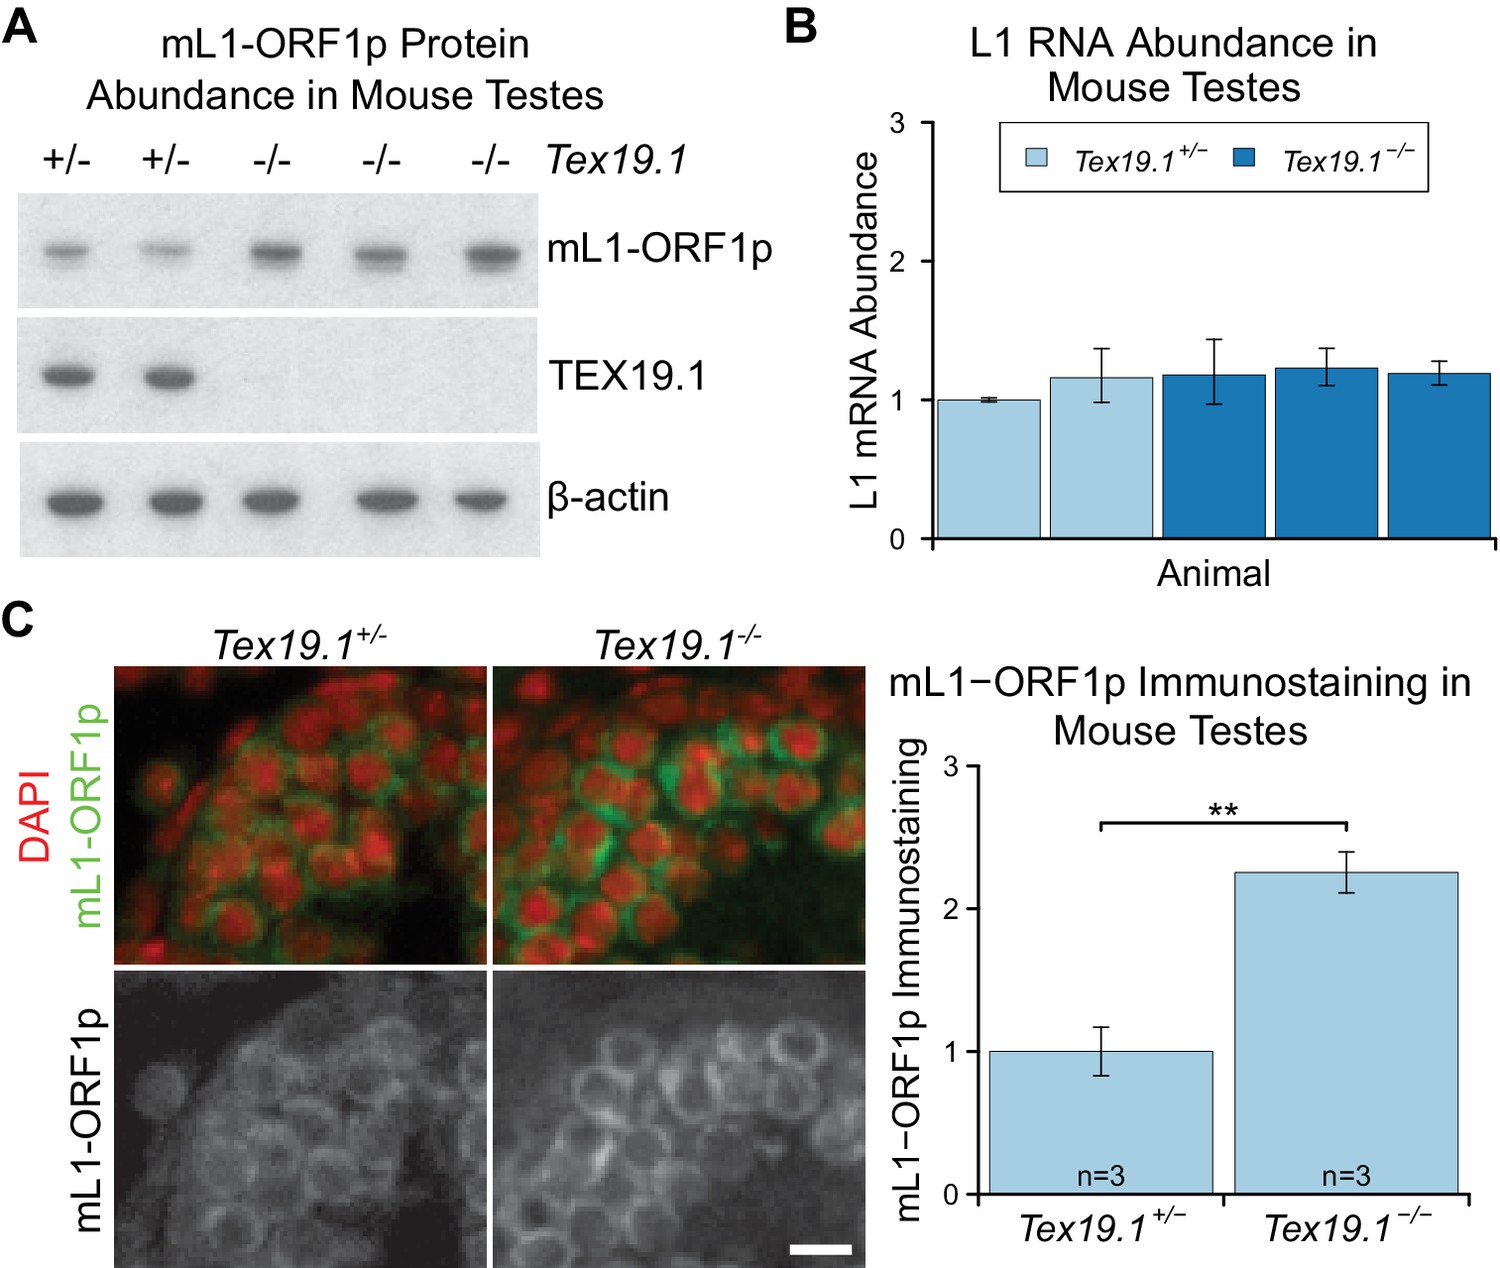
mL1-ORF1p is post-transcriptionally regulated by Tex19.1 in mouse germ cells.
(A) Western blot for mL1-ORF1p in Tex19.1+/− and Tex19.1−/− littermate P16 mouse testes. β-actin is a loading control. Data shown is representative of seven Tex19.1−/− animals across four litters. (B) qRT-PCR for L1 RNA using primers against ORF2 in testes from the same animals analyzed in panel A. Expression relative to β-actin was normalized to a Tex19.1+/− control animal. Error bars indicate SEM for three qPCR technical replicates from the same reverse-transcribed RNA. (C) Immunostaining for mL1-ORF1p (green) in Tex19.1+/− and Tex19.1−/− P16 mouse testis sections. Nuclei are counterstained with DAPI (shown as red). Scale bar, 10 μm. Anti-mL1-ORF1p immunostaining per unit area was quantified for three animals for each genotype, and normalized to the mean for Tex19.1+/− animals. Means ± SEM (1 ± 0.17 and 2.25 ± 0.14 for Tex19.1+/− and Tex19.1−/− respectively) are indicated; **p<0.01 (t-test, p=0.005).
Figure 1—figure supplement 1
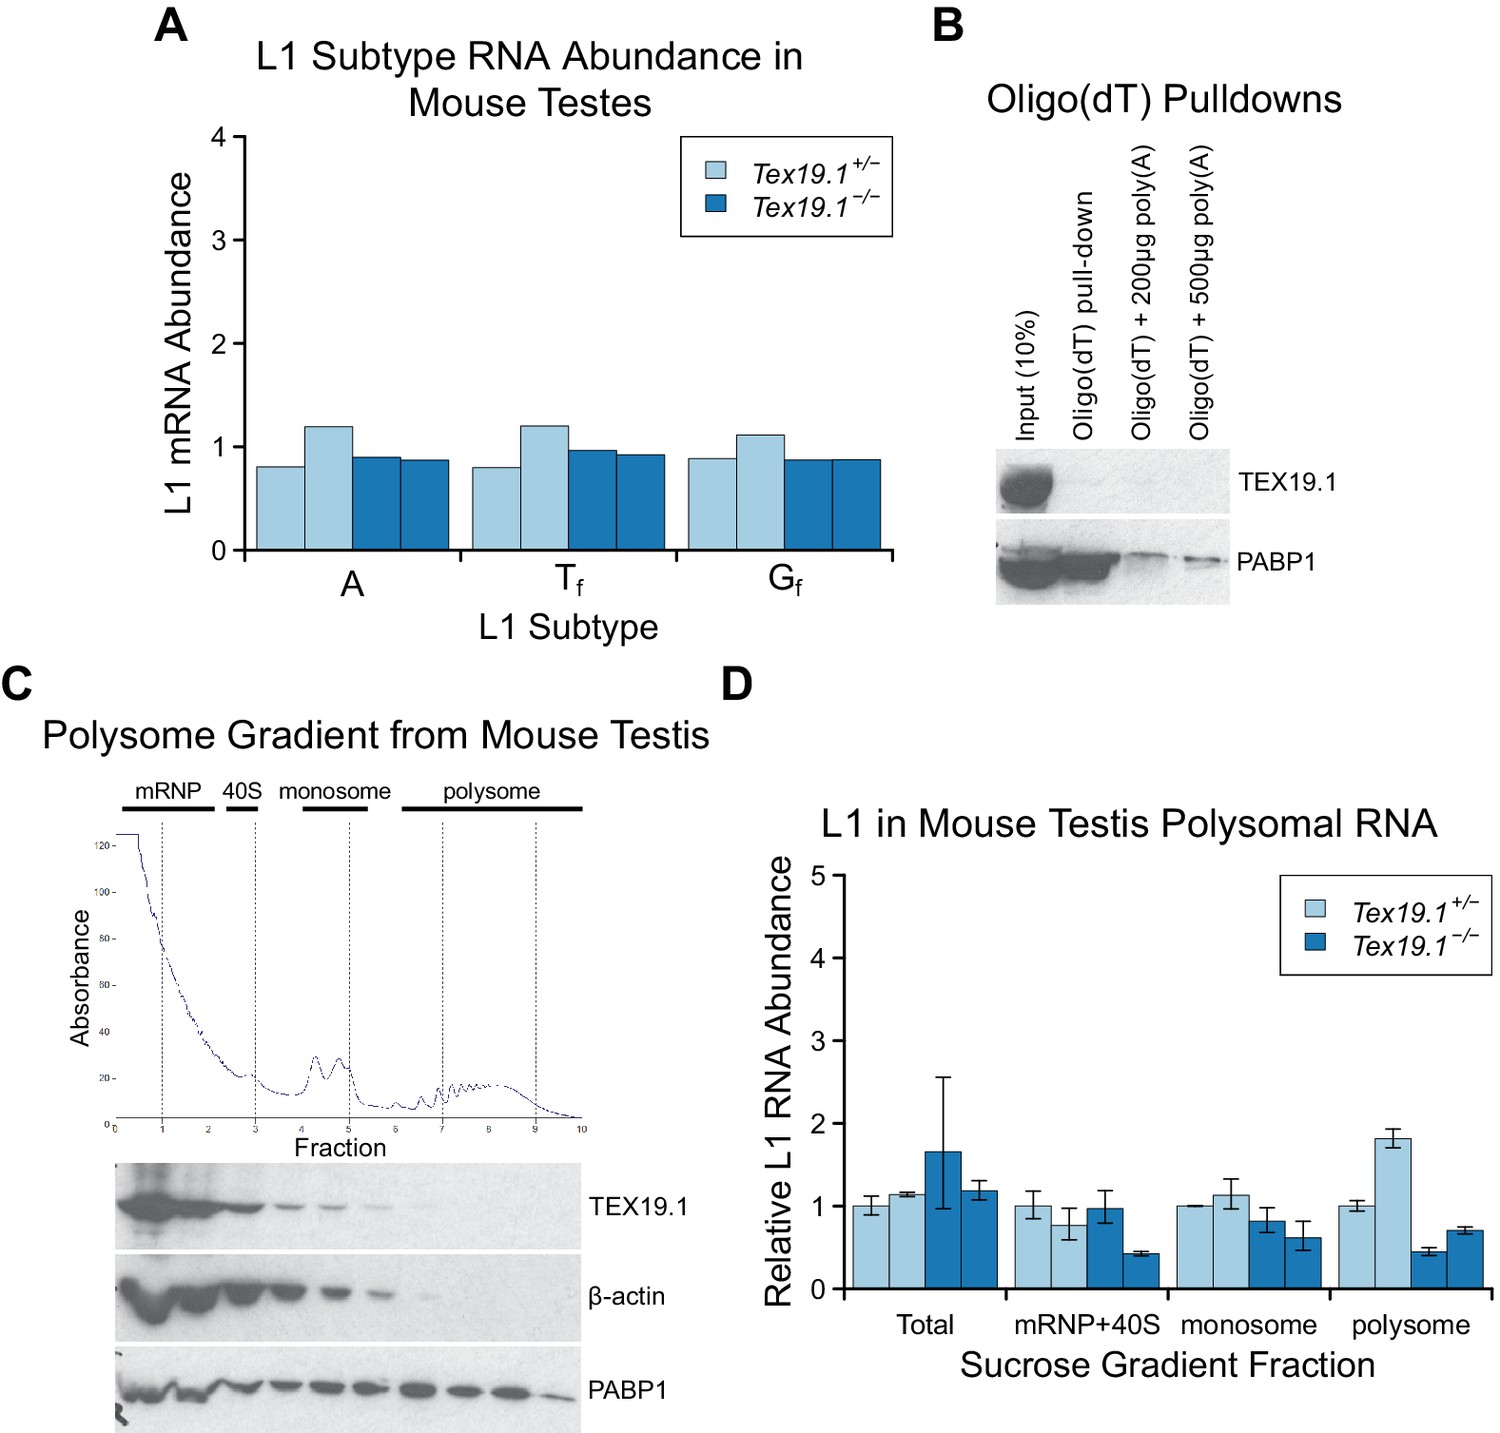
Tex19.1 does not inhibit L1 translation.
(A) qRT-PCR for A, Tf and Gf active subtypes of L1 in P16 testes. L1 subtype mRNA abundance was measured relative to β-actin, and normalised to the mean Tex19.1+/− control level. Two animals for each genotype are shown. (B) Oligo(dT) pull-downs from P16 testes. Oligo(dT) cellulose beads were used to isolate poly(A) RNA from testis lysates, and associated proteins analysed by Western blotting with indicated antibodies. 200 or 500 µg poly(A) RNA was added as a competitor. The poly(A) RNA binding protein PABP1 was used as a positive control. TEX19.1 is not detectably associated with poly(A) RNA in testes. C. Sucrose density gradient enrichment of translation intermediates from P18 testes. The protein content of the fractions was monitored by reading absorbance at 254 nm, and peaks corresponding to messenger ribonucleoproteins (mRNPs), 40S ribosomal subunits, monosomes and polysomes are indicated. Western blots for TEX19.1, β-actin and PABP1 are shown for each fraction. TEX19.1 is not detectably associated with actively translating polysomes in testes. D. qRT-PCR for L1 mRNA in mRNP + 40S, monosome, and polysome fractions in sucrose gradients from Tex19.1+/− and Tex19.1−/− P18 testes. L1 mRNA abundance was measured relative to β-actin in each fraction, and normalized to one of the heterozygous control animals. A proportion of L1 mRNA associates with polysomes consistent with previous reports (Tanaka et al., 2011). Meiotic arrest and increased spermatocyte death between P16 and P22 in Tex19.1−/− testes (Ollinger et al., 2008) may be generating some differences in testicular cell composition in these P18 samples and causing subtle differences in L1 mRNA distribution between Tex19.1+/− and Tex19.1−/− samples. However, there is no statistically significant increase in polysome-associated L1 mRNA in Tex19.1−/− P18 testes (t-test, p=0.4). Error bars indicate SEM for technical replicates.
Figure 2 with 1 supplement
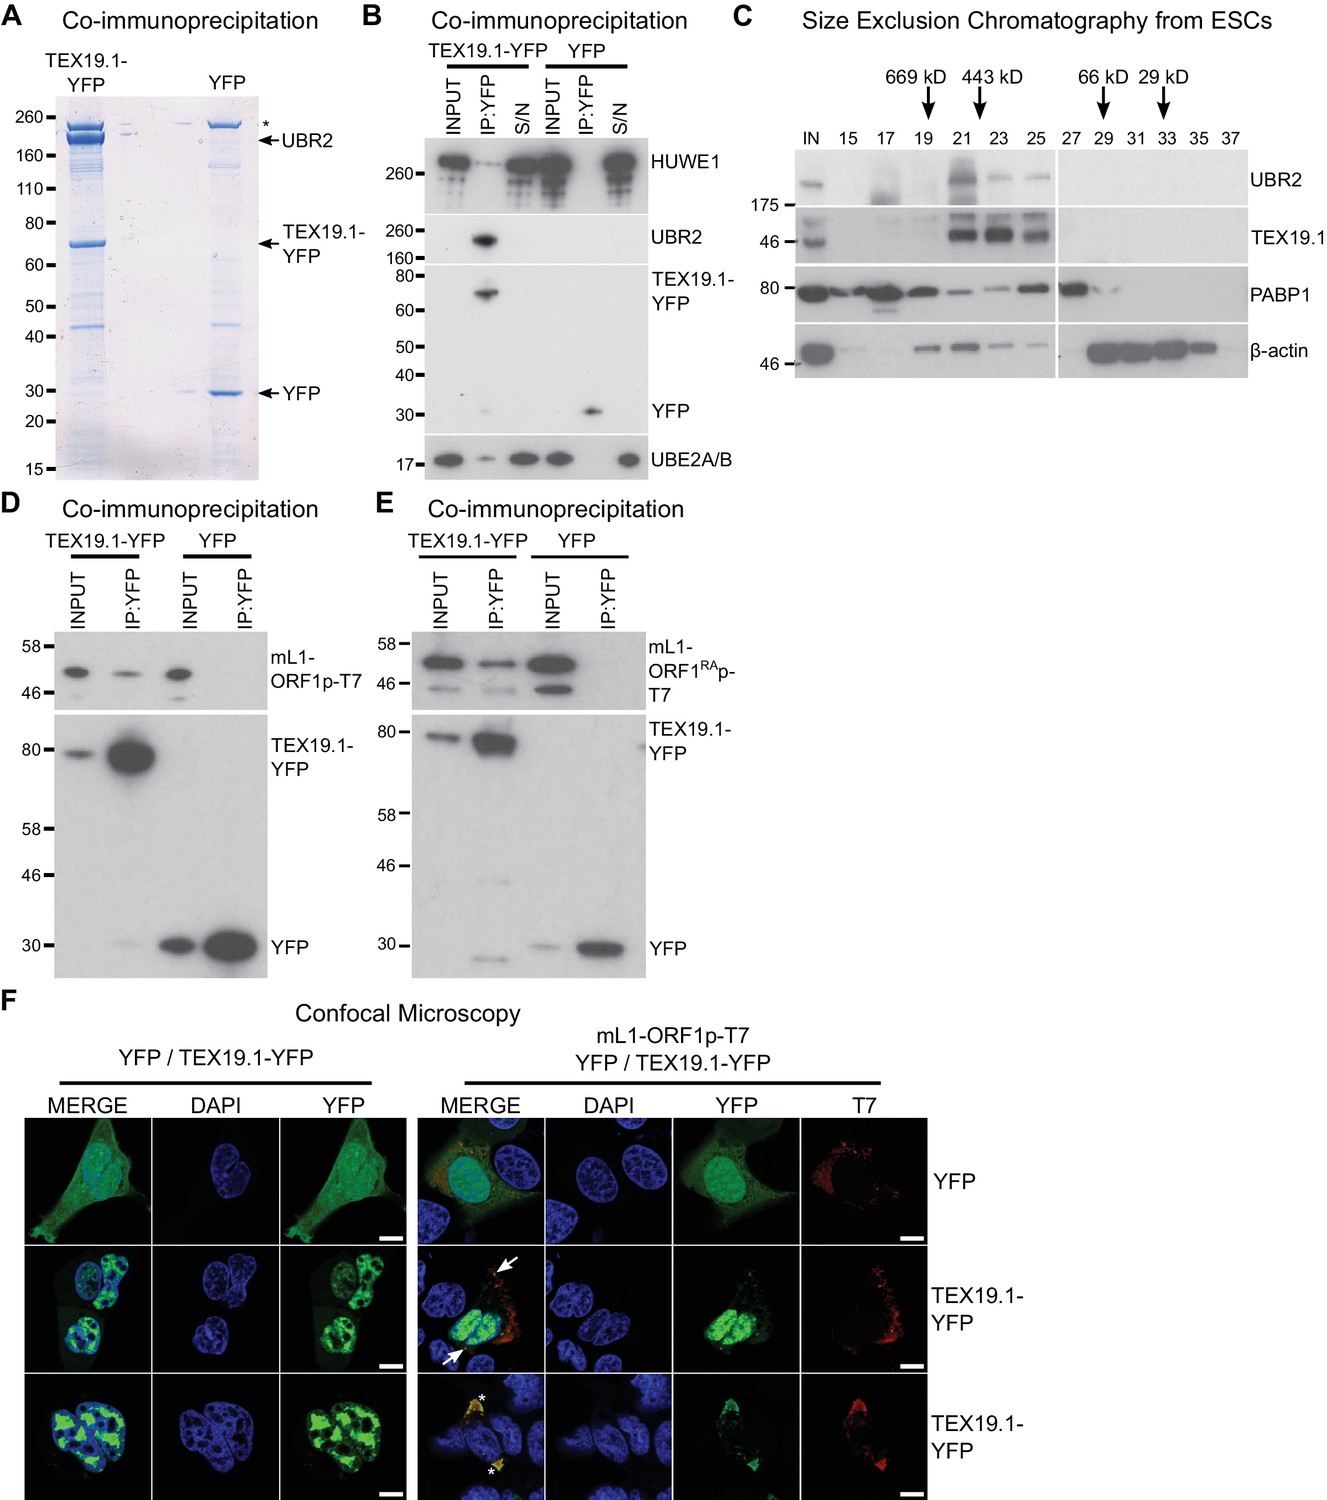
TEX19.1 physically interacts with components of the ubiquitin proteasome system and with L1-ORF1p.
(A) Colloidal blue-stained cytoplasmic anti-YFP immunoprecipitates from mouse ESCs stably expressing mouse TEX19.1-YFP or YFP. Mass spectrometry identities of major bands are indicated, and a non-specific band marked with an asterisk. (B) Western blots for ubiquitin-proteasome system components in anti-YFP immunoprecipitates (IPs) from panel A. Anti-YFP IP inputs, IPs and IP supernatants (S/N) were blotted with indicated antibodies. (C) Size exclusion chromatography of cytoplasmic extract from ESCs showing elution of endogenous mouse TEX19.1 and UBR2. PABP1 and β-actin are included as controls. Input (IN) sample is also shown, and eluted fraction numbers and the positions of pre-stained molecular weight markers in kD are indicated. (D, E) IPs from HEK293T cells co-transfected with mL1-ORF1p-T7 constructs and either mouse TEX19.1-YFP or YFP and Western blotted with indicated antibodies. The mutant mL1-ORF1RAp in panel E has a reduced binding affinity for RNA (Kulpa and Moran, 2005; Martin et al., 2005). (F) Subcellular localization of mouse TEX19.1-YFP in the presence and absence of mL1-ORF1p-T7. U2OS cells were transiently transfected with TEX19.1-YFP or YFP expression constructs with or without a plasmid expressing mL1-ORF1p-T7 (pCEPL1SM-T7), then stained with anti-T7 antibodies, and with DAPI to detect DNA. 49% of 51 cells examined exhibited some co-localization of mL1-ORF1p-T7 with TEX19.1-YFP. In 71% of these co-localizing cells mL1-ORF1p-T7 with TEX19.1-YFP were both present in a subset of small cytoplasmic foci (arrows). In the remaining 29% of co-localizing cells, large cytoplasmic aggregates of mL1-ORF1p-T7 extensively co-localize with TEX19.1-YFP (asterisks). Two representative images of cells transfected with either TEX19.1-YFP alone or TEX19.1-YFP in combination with mL1-ORF1p are shown. Scale bars 10 μm.
Figure 2—figure supplement 1
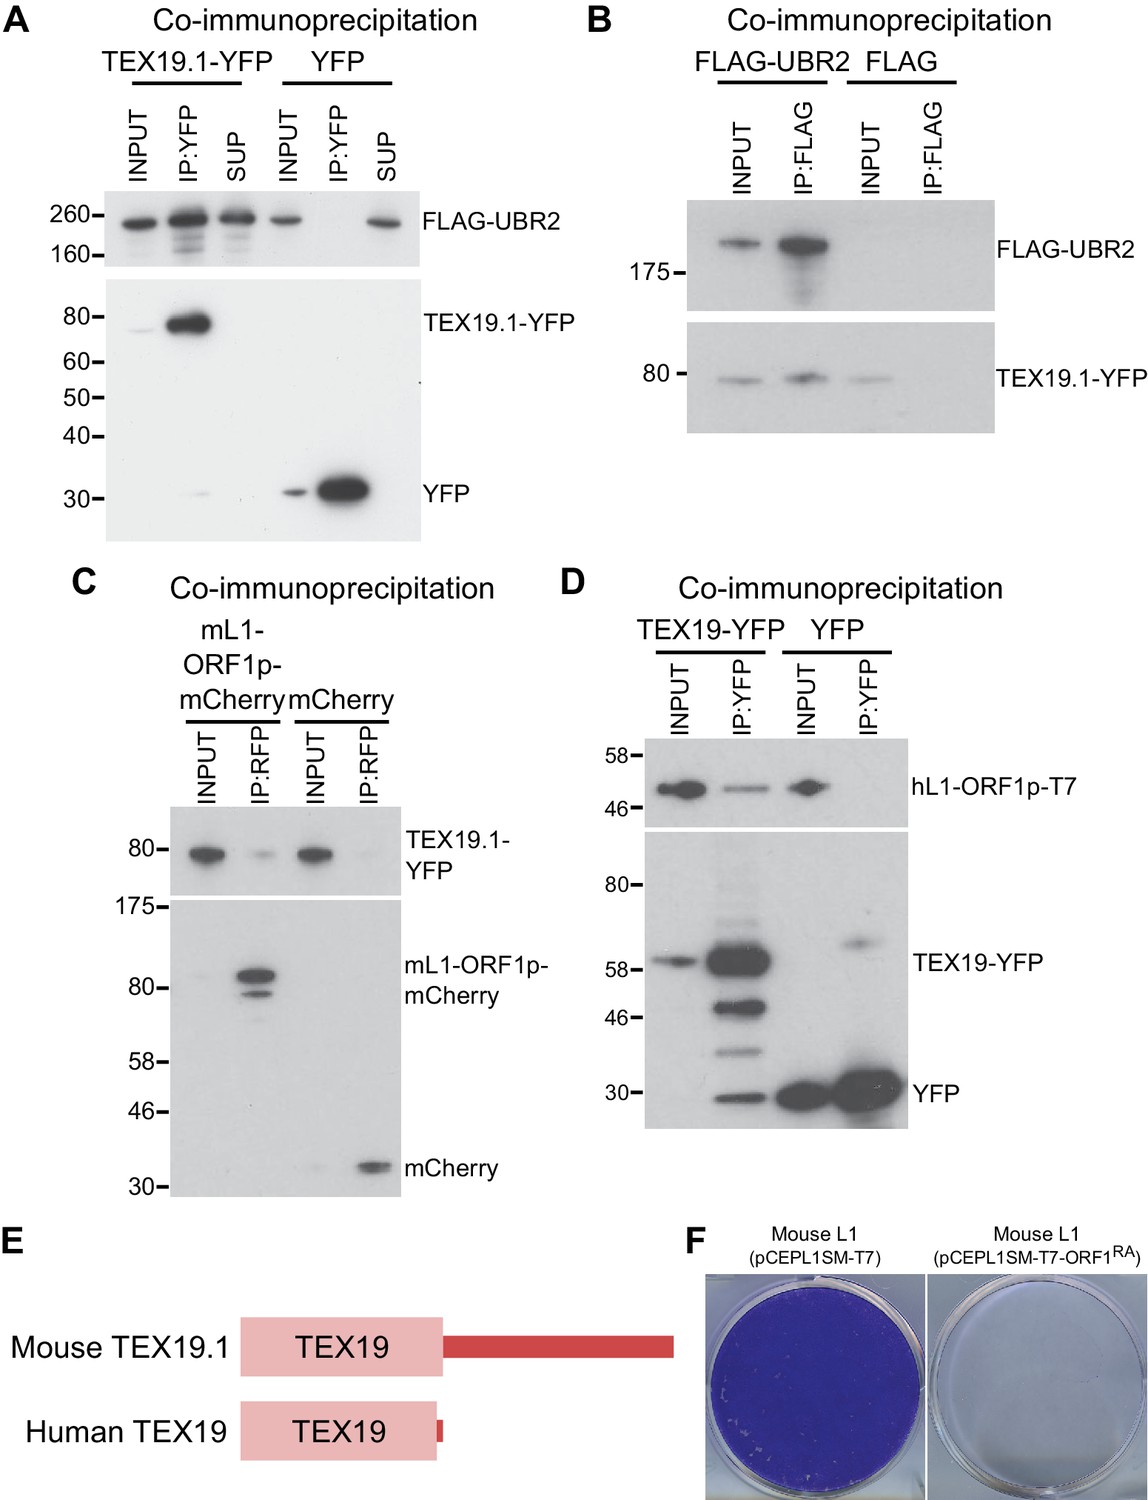
TEX19 orthologs interact with UBR2 and L1-ORF1p.
(A) Co-immunoprecipitations (co-IPs) from stable HEK293 cell lines expressing either TEX19.1-YFP or YFP alone transiently transfected with FLAG-UBR2. Anti-YFP immunoprecipitates (IPs), inputs, and supernatants (SUP) were Western blotted with anti-FLAG and anti-YFP antibodies. (B) Reciprocal co-IP for panel A. HEK293T cells were transiently transfected with TEX19.1-YFP and either FLAG-UBR2 or FLAG alone, and anti-FLAG IPs and their inputs were Western blotted with anti-FLAG and anti-YFP antibodies. Positions of FLAG-UBR2, TEX19.1-YFP, YFP alone and pre-stained molecular weight markers in kD are indicated. (C) Co-immunoprecipitation from HEK293T cells co-transfected with TEX19.1-YFP and mCherry-tagged mL1-ORF1p expression constructs and IPd for mCherry. YFP or mCherry alone were used as negative controls. Anti-mCherry IP inputs and IPs were Western blotted with anti-mCherry or anti-YFP antibodies. Positions of pre-stained molecular weight markers in kD are indicated.( D) Co-IPs from HEK293T cells co-transfected with epitope-tagged hL1-ORF1p and human TEX19-YFP expression constructs. YFP was used as a negative control. IP inputs and IPs were Western blotted with anti-T7 or anti-YFP antibodies. (E) Diagram showing the domain structure of mouse and human TEX19 orthologs. A conserved TEX19 domain is present at the N-terminus of both proteins, but the C-terminal region of mouse TEX19.1 is not conserved in the truncated human TEX19 protein. (F) Mouse L1-ORF1RAp mutants used to test for RNA-independent interactions have impaired mobilization. Plates of G418-resistant colonies from L1 retrotransposition assays in HeLa cells. Assays for mouse L1 (pCEPL1SM-T7) and mouse L1 carrying the R297A and R298A mutations in the RNA binding domain of ORF1p that reduce its affinity for RNA (Martin et al., 2005) (pCEPL1SM-T7-ORF1RA).
Figure 3
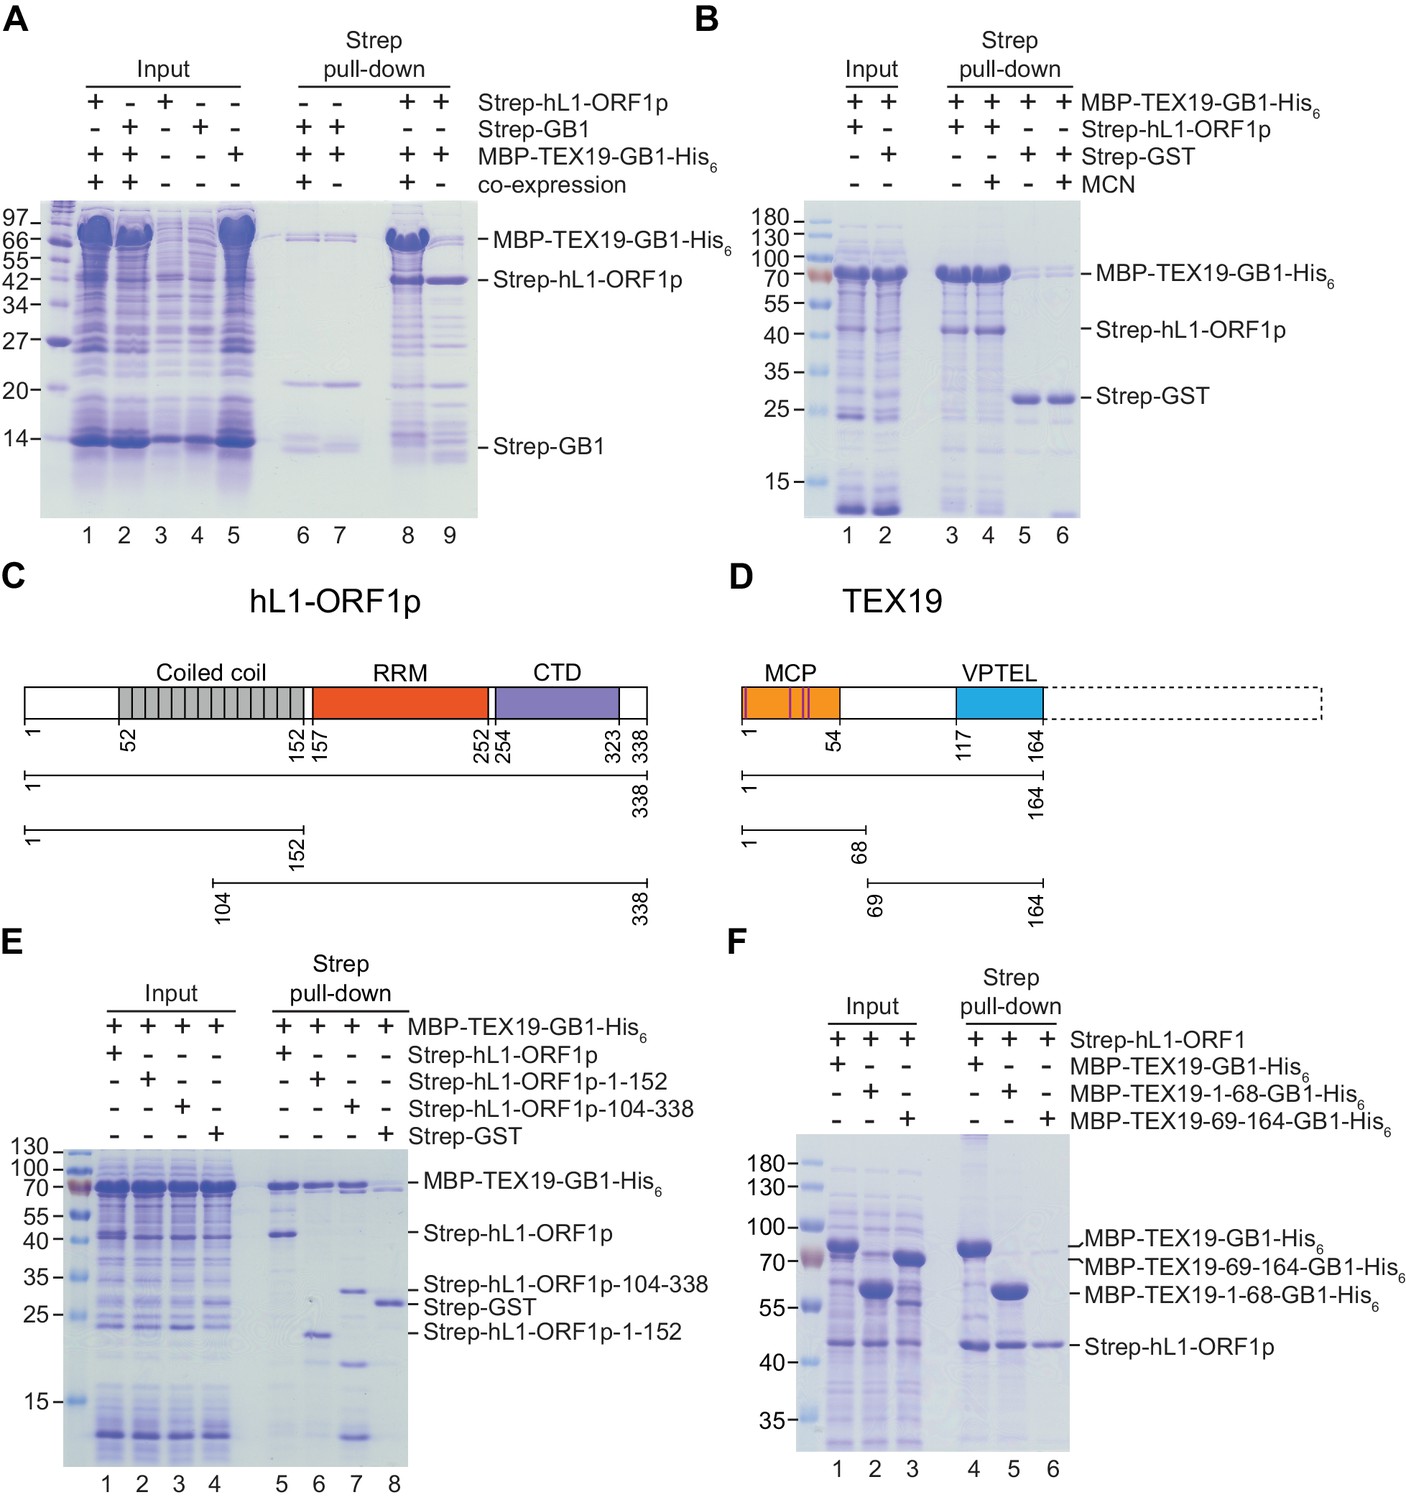
Direct interaction between human TEX19 and human L1-ORF1p.
(A) Strep pull-down assays from bacterial (Escherichia coli) lysates. Double-tagged human TEX19 was either co-expressed with Strep-tagged human L1-ORF1p (lane 8) or added after L1-ORF1p immobilization on Strep-Tactin beads (lane 9). Strep-GB1 served as a control (lanes 6 and 7). (B) Pull-down assays of the co-expressed proteins in the absence and presence of micrococcal nuclease (MCN, lanes 3 and 4). Strep-GST served as a control (lanes 5 and 6). (C) Bar diagram of human L1-ORF1p based on the crystal structure by Khazina et al. (2011) and consistent with the alignment by Boissinot and Sookdeo (2016). Structural domains are colored and the sub-fragments used for pulldown assays are indicated below the bar with the corresponding amino acid numbers. The C-terminal fragment is sufficient for L1-ORF1p trimerization and has been crystallized. The N-terminal fragment is highly variable among mammals. (D) Bar diagram of human TEX19 according to the alignment by Bianchetti et al. (2015). The conserved MCP and VPTEL regions are colored and the C-terminal extension that is present in murine TEX19.1 and most of the other mammalian homologs is indicated with a dotted line. Purple lines indicate a putative CHCC zinc-binding motif in the MCP region. (E) Strep pull-down assays with bacterially expressed sub-fragments of human L1-ORF1p and full-length human TEX19. (F) Strep pull-down assays with bacterially expressed sub-fragments of human TEX19 and full-length human L1-ORF1p.
Figure 4 with 1 supplement

TEX19 stimulates polyubiquitylation of hL1-ORF1p.
(A) Cell-based ubiquitylation assay (Ub assay) for T7 epitope-tagged hL1-ORF1p in HEK293T cells. HEK293T cells were transfected with hL1-ORF1p-T7 and his6-myc-ubiquitin (his6-myc-Ub), and his6-tagged proteins isolated using Ni2+ agarose. Inputs and Ni2+ pull-downs were analysed by Western blotting for T7. (B) Western blots and quantification of hL1-ORF1p-T7 abundance in HEK293T cells after treatment with either the proteasome inhibitor MG132 (50 µM, 7 hr) or DMSO as a vehicle control. HEK293T cells were co-transfected with hL1-ORF1p-T7 and RFP to control for transfection efficiency, and hL1-ORF1p-T7 abundance measured relative to RFP, then normalized to the DMSO controls for three independent transfections. MG132 treatment increases hL1-ORF1p-T7 abundance 1.96 ± 0.21 fold. *p<0.05 (t-test, p=0.04). (C) Cell-based ubiquitylation assay (Ub assay) for hL1-ORF1p-T7 in HEK293T cells in the presence and absence of human TEX19. Ni2+-pull downs were Western blotted (WB) with anti-T7 antibodies. Polyubiquitylated hL1-ORF1p-T7 containing four or more ubiquitin molecules (~100 kD band and above) was quantified relative to monoubiquitylated hL1-ORF1p-T7 (~58 kD band) and normalized to empty vector controls. Means ± SEM (1 ± 0.14 and 2.11 ± 0.31 for vector control and TEX19 respectively) are indicated; *p<0.05 (t-test, p=0.03). (D) Western blots of HEK293 FlpIn cells stably expressing hL1-ORF1p-T7 transfected with human TEX19 or empty vector. Abundance of hL1-ORF1p-T7 protein and its encoding RNA were measured relative to lamin B and GAPDH respectively, and normalized to empty vector controls. Means ± SEM (1 ± 0.09 and 0.51 ± 0.06 for protein abundance and 1.01 ± 0.09 and 1 ± 0.10 for RNA abundance for vector control and TEX19 respectively) are indicated; **p<0.01; ns indicates not significant (t-test, p=0.0005, 0.9 from left to right); Pre-stained MW markers (kD) are indicated beside blots.
Figure 4—figure supplement 1
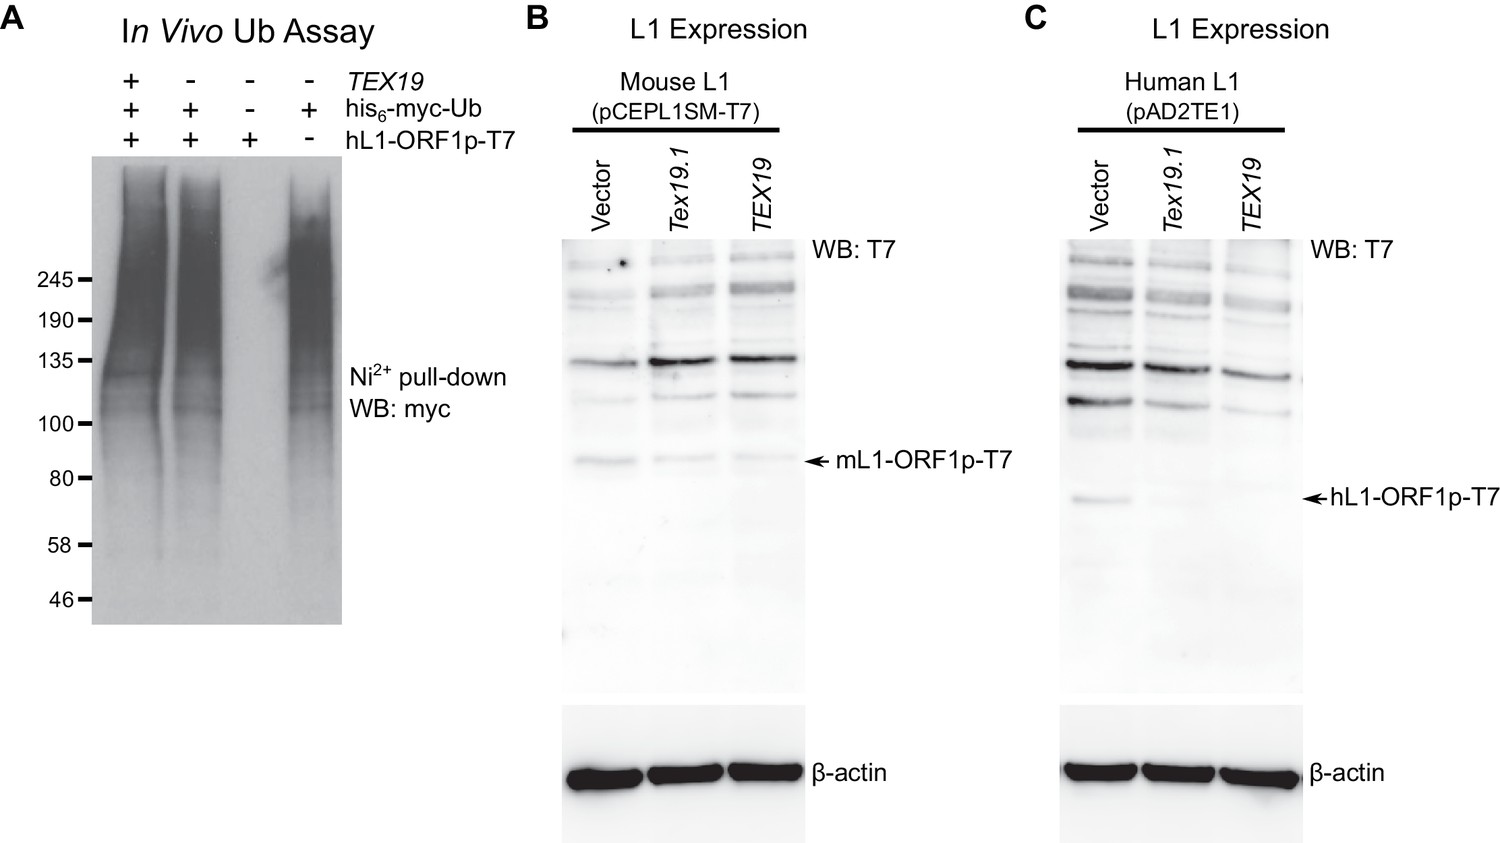
TEX19 orthologs regulate L1-ORF1p abundance.
(A) Control for cell-based ubiquitylation assay shown in Figure 4C. Ni2+ pull-downs were Western blotted (WB) with anti-T7 antibodies to detect the immunoprecipitated his6-myc-Ub conjugates. MW markers (kD) are shown beside blots. (B, C) Hamster XR-1 cells were transiently transfected with a synthetic mouse or human L1 construct containing T7 epitope-tagged ORF1p (panel B: mouse, pCEPL1SM-T7; panel C, pAD2TE1, human), and either empty vector, Strep-Tex19.1 or Strep-TEX19 expression constructs. Cells were Western blotted (WB) for the T7 epitope tag, and for β-actin as a loading control 72 hr post-transfection. Arrows indicate the L1-ORF1p-T7 bands (43 kD for mL1-ORF1p-T7, 40 kD for hL1-ORF1p-T7). The high molecular weight bands migrating more slowly than the L1-ORF1p-T7 constructs in panels B and C likely represent the anti-T7 antibody cross-reacting with cellular proteins from the host cells.
Figure 5 with 1 supplement
TEX19 orthologs restrict L1 mobilization.
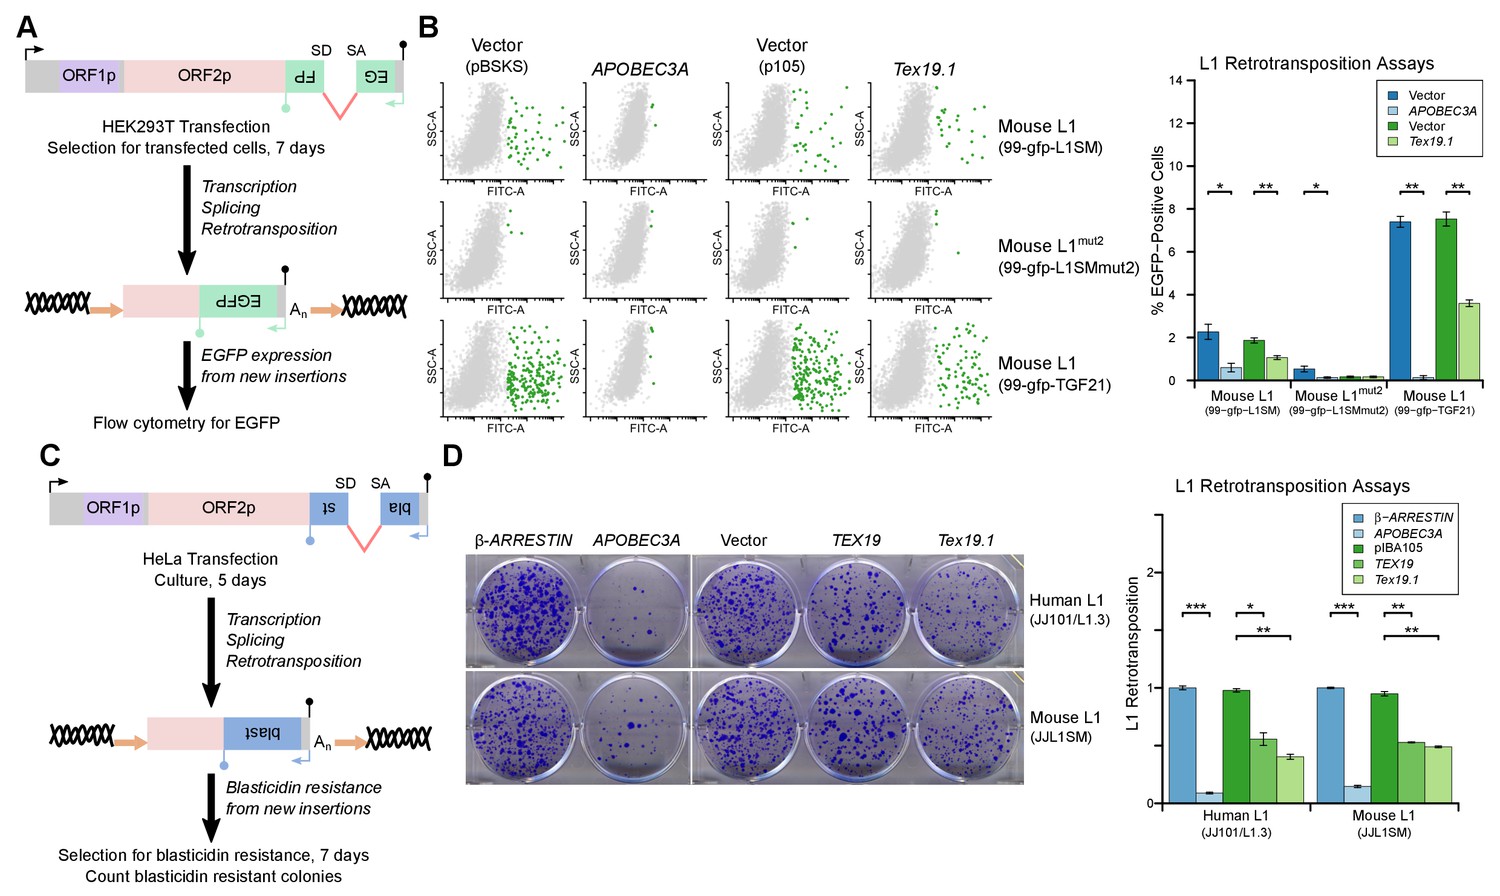
(A) Schematic of engineered L1 retrotransposition assay in HEK293T cells using an EGFP indicator cassette. (B) Flow cytometry profiles from engineered mouse L1 retrotransposition assays performed as shown in panel A. HEK293T cells were co-transfected with engineered mouse L1 retrotransposition constructs containing EGFP indicator cassettes (99-gfp-L1SM, 99-gfp-L1SMmut2, 99-gfp-TGF21), and either Strep-tagged mouse Tex19.1, APOBEC3A (positive control) or empty vectors (pBSKS for APOBEC3A, pIBA105 for Tex19.1). EGFP fluorescence is plotted on the x-axis and side scatter on the y-axis of the flow cytometry profiles, and cells classed as EGFP-positive are shown in green. 99-gfp-L1SMmut2 carries missense mutations in the endonuclease and reverse transcriptase domains of ORF2p. *p<0.05; **p<0.01 (t-test, p=0.04, 0.006, 0.04, 1, 0.00001, 0.0004 for each pairwise comparison with vector from left to right). (C) Schematic of engineered L1 retrotransposition assays in HeLa cells using a blasticidin resistance indicator cassette. (D) Plates stained with 0.1% crystal violet showing blasticidin-resistant colonies from engineered L1 retrotransposition assays performed as shown in panel C. Human (JJ101/L1.3) and mouse (JJL1SM) L1 retrotransposition constructs containing blasticidin resistance indicator cassettes were co-transfected with β-ARRESTIN or APOBEC3A as negative and positive controls respectively, or with Strep-tagged mouse Tex19.1, Strep-tagged human TEX19 or pIBA105 empty vector. Quantification of L1 retrotransposition was calculated relative to the β-ARRESTIN control. *p<0.05; **p<0.01 (t-test, p=0.0004, 0.02, 0.002, 0.0002, 0.002, 0.002 for each pairwise comparison with vector from left to right).
Figure 5—figure supplement 1
TEX19 orthologs restrict L1 mobilization.
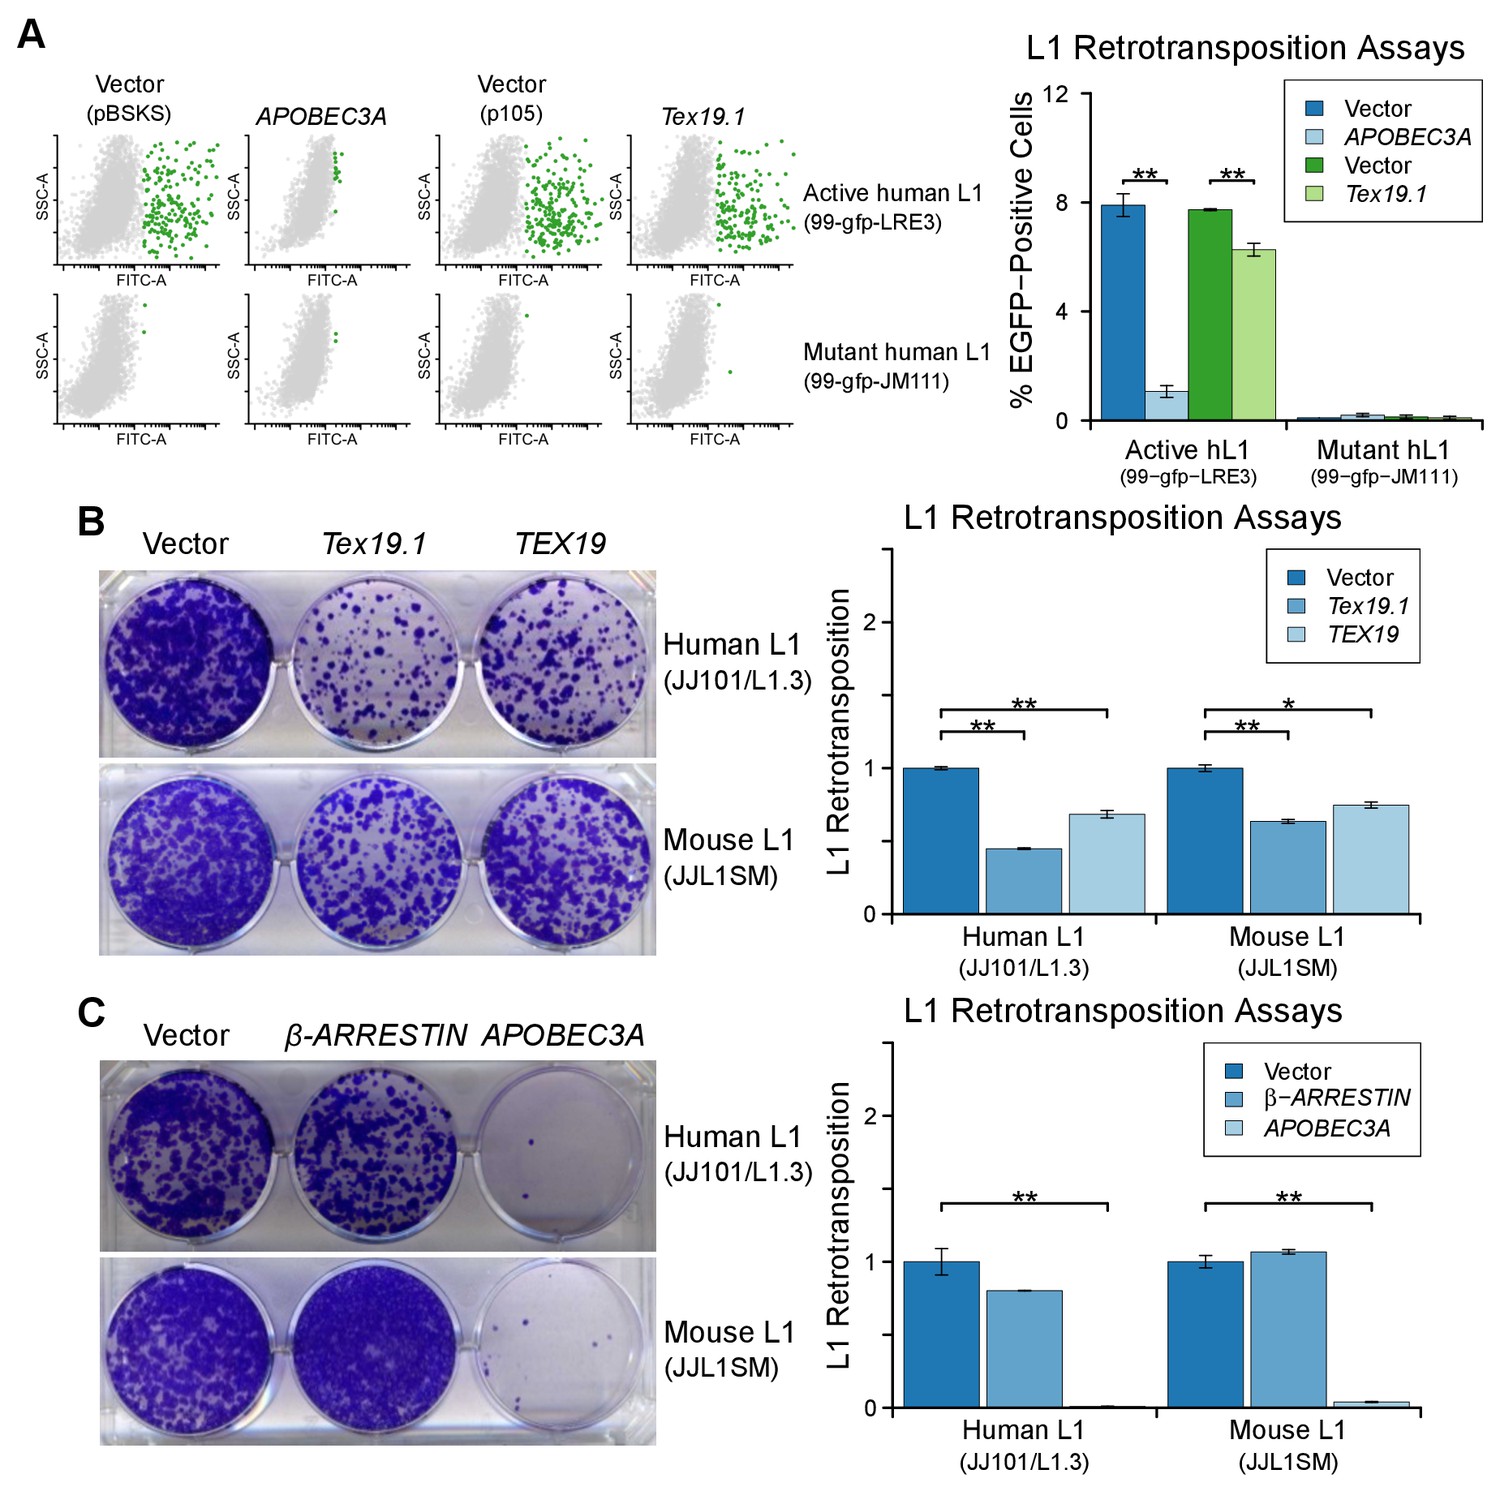
(A) Flow cytometry profiles of engineered L1 retrotransposition assays in HEK293T cells co-transfected with active and mutant human L1 constructs (99-gfp-LRE3 and 99-gfp-JM111) containing EGFP retrotransposition cassettes, and either Strep-tagged Tex19.1, APOBEC3A (positive control) or empty vectors (pBSKS for APOBEC3A, pIBA105 for Tex19.1). EGFP fluorescence is plotted on the x-axis and side scatter on the y-axis of the flow cytometry profiles, and cells classed as EGFP-positive are shown in green. 99-gfp-JM111 carries the ORF1RA mutations and is severely impaired for retrotransposition (Han and Boeke, 2004; Moran et al., 1996). **p<0.01 (t-test, p=0.0001, 0.003, 0.2, 0.7 for each pairwise comparison with vector from left to right). (B, C) Blasticidin-resistant colonies from L1 retrotransposition assays in U2OS cells. Human (JJ101/L1.3) and mouse (JJL1SM) engineered L1 constructs containing blasticidin-resistance retrotransposition cassettes were co-transfected with Strep-tagged mouse Tex19.1, Strep-tagged human TEX19, or empty vector (B), or with β-ARRESTIN (negative control), APOBEC3A (positive control) or empty vector (C). Quantification of L1 retrotransposition normalized for transfection efficiency is shown. *p<0.05; **p<0.01 (t-test, p=0.0004, 0.008, 0.005, 0.014 for each pairwise comparison with vector from left to right for B; t-test p=0.2, 0.008, 0.3, 0.002 for C).
Figure 6 with 2 supplements
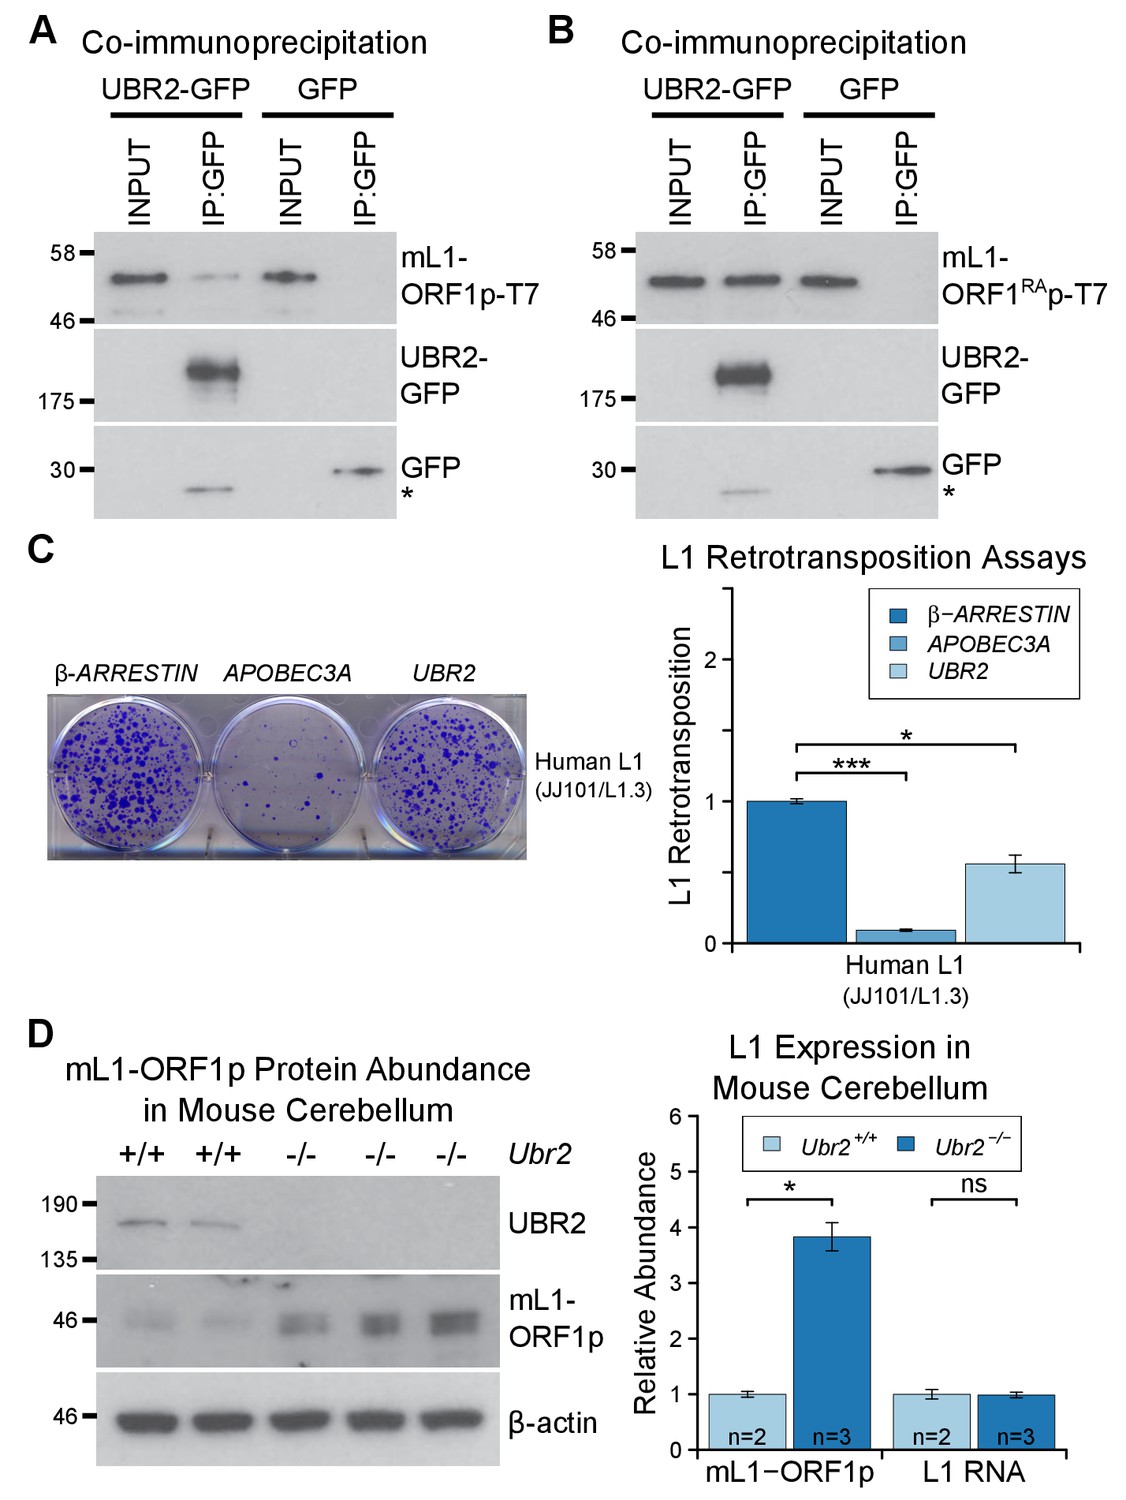
The TEX19.1-interacting protein UBR2 negatively regulates mL1-ORF1p abundance and L1 mobilization.
(A) Co-immunoprecipitations (co-IPs) from HEK293T cells co-transfected with mL1-ORF1p-T7 and either mouse UBR2-GFP or GFP. IP inputs and IPs were Western blotted with T7 and GFP antibodies. A presumed cleavage product of UBR2-GFP running smaller than GFP itself is indicated with an asterisk. (C) Plates from an engineered L1 retrotransposition assay as described in Figure 5C stained with 0.1% crystal violet showing blasticidin-resistant colonies. Human (JJ101/L1.3) L1 retrotransposition construct was co-transfected with β-ARRESTIN or APOBEC3A as negative and positive controls respectively, or with UBR2-Flag. *p<0.05; ***p<0.01 (t-test, p=0.0004, 0.02 from left to right). (D) Western blots of endogenous UBR2 and mL1-ORF1p in P16 Ubr2+/+ and Ubr2−/− mouse cerebellum. β-actin was used as a loading control. Quantification of mL1-ORF1p-T7 and L1 mRNA relative to β-actin and normalized to Ubr2+/+ control mice is also shown. Means ± SEM are indicated (1 ± 0.05 and 3.82 ± 0.25 for Ubr2+/+ and Ubr2−/− respectively) *p<0.05; ns indicates not significant (t-test, p=0.048, 0.9 from left to right); pre-stained MW markers (kD) are shown beside blots.
Figure 6—figure supplement 1
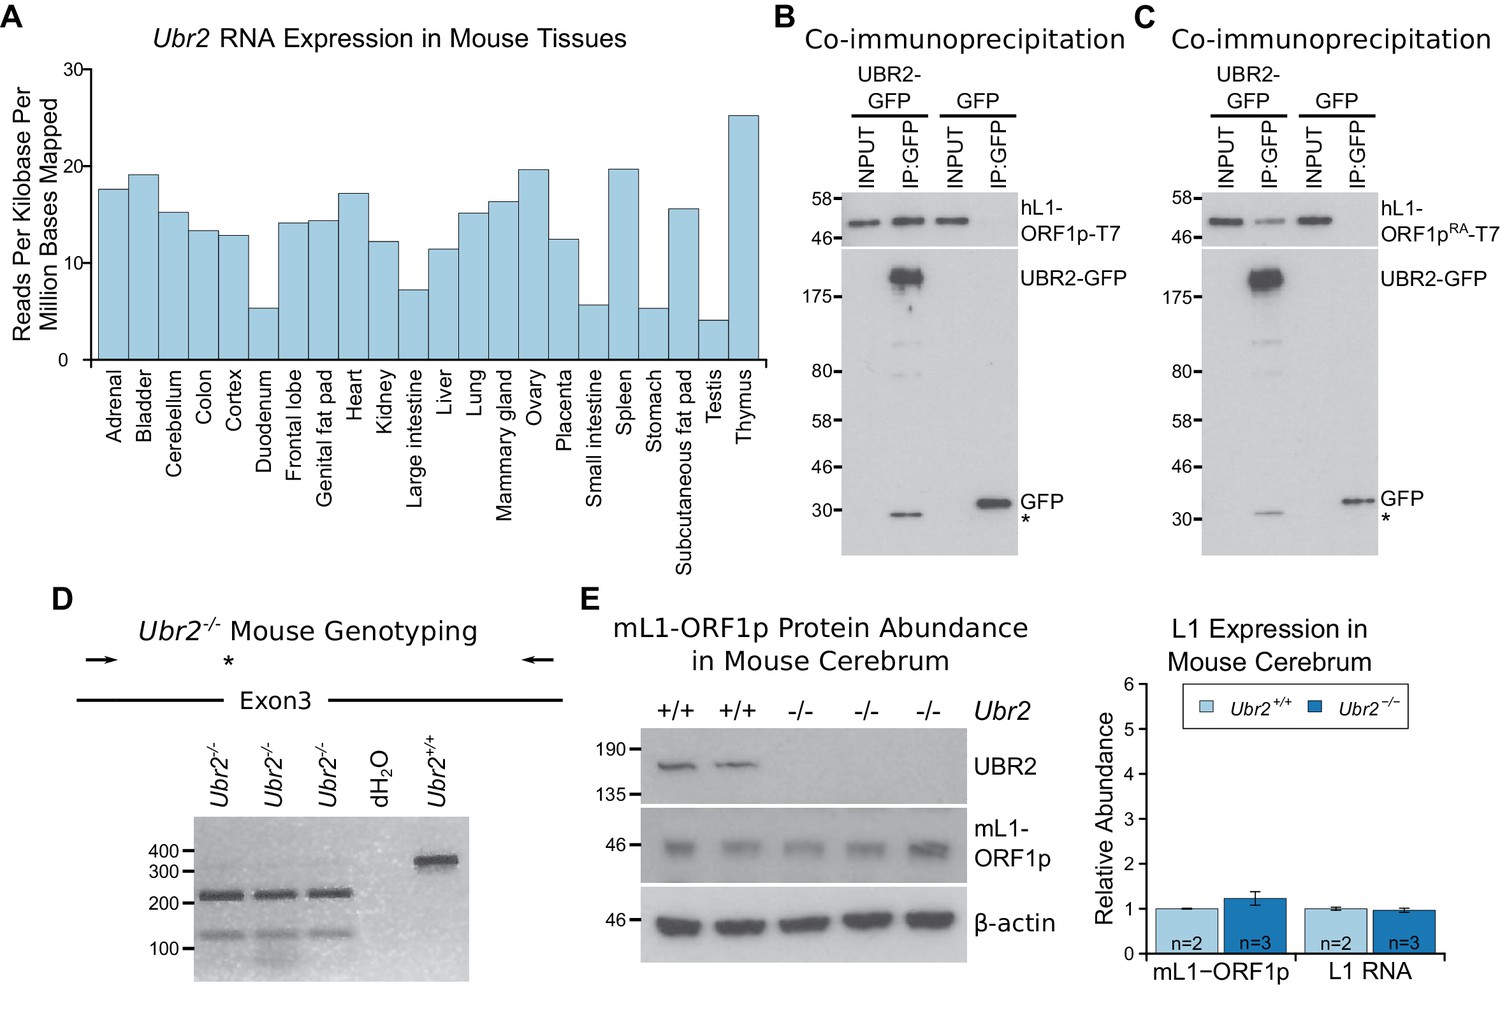
The ubiquitously-expressed E3 ubiquitin ligase UBR2 physically interacts with L1-ORF1p but does not regulate its abundance in the cerebrum.
(A) Ubr2 transcript abundance in multiple adult tissues was determined from ENCODE RNA sequencing data GSE36025 (Lin et al., 2014) by calculating the total number of reads mapped to the Ubr2 locus per million reads mapped in the dataset, and normalising this to the length of the Ubr2 locus. (B, C) Co-immunoprecipitations (co-IPs) from HEK293T cells co-transfected with T7 epitope-tagged hL1-ORF1p and mouse UBR2-GFP expression constructs. GFP alone was used as a negative control. (D) Genotyping of Ubr2−/− mice. An XbaI restriction site and premature stop codon (asterisk) are introduced into exon 3 of Ubr2 by CRISPR/Cas9, and mice genotyped by amplifying a region encompassing exon 3 (primers indicated by arrows) and digesting the PCR product with XbaI. Three Ubr2−/− mice, and Ubr2+/+ and distilled water (dH2O) controls are shown. (E) Western blots showing endogenous UBR2 and mL1-ORF1p expression in Ubr2+/+ and Ubr2−/− mouse cerebrum. β-actin was used as a loading control. Positions of epitope-tagged proteins and pre-stained molecular weight markers in kD are indicated. Quantification of endogenous mL1-ORF1p abundance and L1 RNA abundance relative to β-actin in Ubr2+/+ and Ubr2−/− mouse cerebrum is also shown. Relative abundance was normalized to the mean of the Ubr2+/+ control mice. Error bars indicate SEM, MW markers (kD for protein, bp for DNA) are shown beside blots and gels. No significant difference in either mL1-ORF1p or L1 RNA abundance was detected between wild-type and mutant tissue (t-test, p=0.4 for mL1-ORF1p; -test, p=0.6 for L1 RNA).
Figure 6—figure supplement 2

Tex19.1 expression is not detectable in brain.
qRT-PCR for Tex19.1 in brain from wild-type mice. Cerebrum and cerebellum were isolated at P16. Embryonic placenta (E12.5) was used as a positive control. RNA abundance is expressed relative to β-actin, expression in two independent animals is shown.
Figure 7 with 4 supplements

Tex19.1 negatively regulates mL1-ORF1p abundance and L1 mobilization in mouse ESCs.
(A) Mouse ESC lysates (input) were incubated with polyubiquitin-binding TUBE2 beads or control agarose beads and Western blotted for endogenous mL1-ORF1p. Non-specific binding of non-ubiquitylated mL1-ORF1p is detectable (asterisk), in addition to specific enrichment of polyubiquitylated mL1-ORF1p with TUBE2. (B) Western blot for endogenous mL1-ORF1p after treatment with 25 µM lactacystin proteasome inhibitor for the indicated times. β-actin is a loading control. (C) Western blot for endogenous mL1-ORF1p in Tex19.1+/+ and Tex19.1−/− mouse ESCs. mL1-ORF1p abundance (Western blot) and L1 RNA abundance (qRT-PCR using primers against ORF2) were quantified relative to β-actin and normalized to Tex19.1+/+ ESCs. Means ± SEM are indicated (1 ± 0 and 1.99 ± 0.36 for protein and 1 ± 0.19 and 1.07 ± 0.15 for RNA for Tex19.1+/+ and Tex19.1−/− respectively); *p<0.05; ns indicates not significant (t-test, p=0.049, 0.8 from left to right). (D) Neomycin-resistant colonies from L1 retrotransposition assays in Tex19.1+/+ and Tex19.1−/− ESCs. ESCs were transfected with LINE retrotransposition constructs carrying the mneoI indicator cassette and either synthetic mouse L1 (pCEPL1SM) or zebrafish LINE-2 (Zfl2.2) sequences, the number of neomycin-resistant colonies counted, and retrotransposition frequency calculated relative to Tex19.1+/+ ESCs transfected with pCEPL1SM. *p<0.05; ns indicates not significant (t-test, p=0.01, 0.3 from left to right); error bars indicate SEM.
Figure 7—figure supplement 1
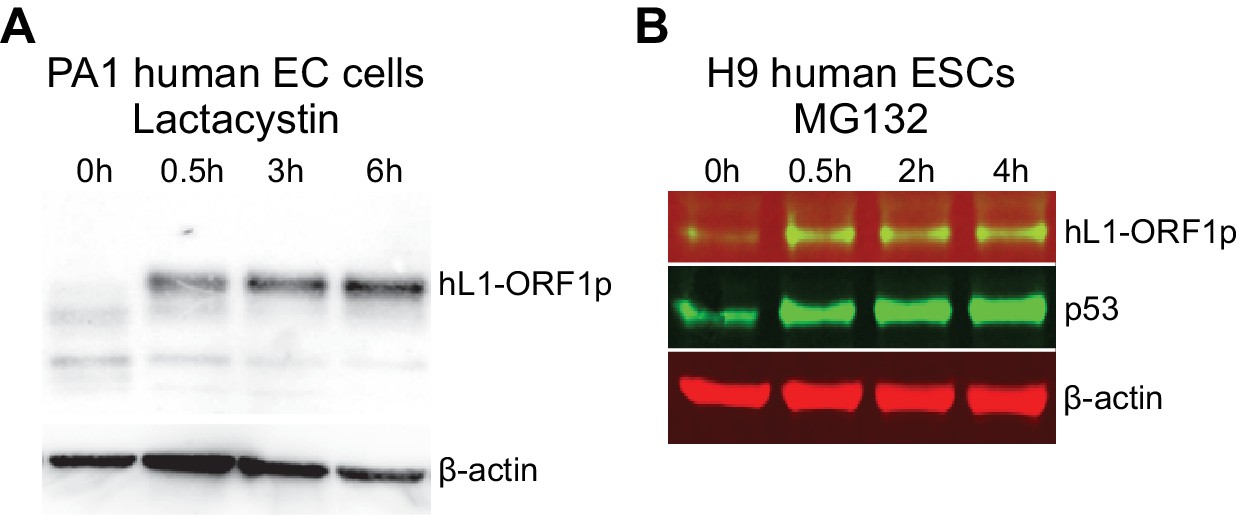
hL1-ORF1p abundance in human embryonal carcinoma cells and human ESCs increases in response to inhibition of the proteasome.
(A) Western blot showing abundance of endogenous hL1-ORF1p in PA-1 human embryonal carcinoma (EC) cells after addition of 25 µM lactacystin to inhibit the proteasome. β-actin is shown as a loading control. (B) Western blot showing abundance of endogenous hL1-ORF1p in H9 human ESCs after addition of 25 µM MG132 to inhibit the proteasome. p53 is a positive control and accumulates upon MG132 treatment, β-actin is shown as a loading control.
Figure 7—figure supplement 2
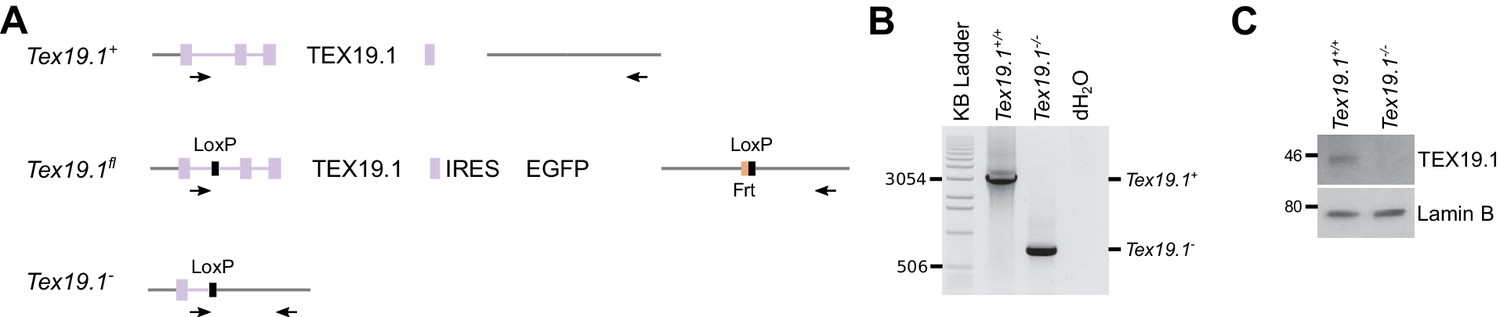
Generation and validation of Tex19.1−/− ESCs.
(A) Schematic diagram showing the Tex19.1 alleles generated in ESCs. The Tex19.1 locus is shown in purple, flanking DNA in grey. Introns are shown as lines, exons as rectangles, and the coding region as large rectangles. LoxP sites (black) and an internal ribosome entry site (IRES, blue) coupled to enhanced green fluorescent protein (EGFP, green) were introduced into the locus to generate a Tex19.1fl allele. This allele also contains an Frt site (orange) left over after excision of a neomycin resistance cassette. After treatment with Cre recombinase the entire Tex19.1 coding sequence is removed from the Tex19.1fl allele to generate Tex19.1-. Arrows indicate position of genotyping primers used in panel B. (B) PCR genotyping of Tex19.1−/− ESCs. Genomic DNA from Tex19.1+/+ ESCs, Tex19.1−/− ESCs or distilled water (dH2O) was used as a template for genotyping PCR using the primers shown in panel A. Migration of selected bands in the KB ladder (Invitrogen) is indicated. (C) Western blot for TEX19.1 and lamin B in Tex19.1+/+ and Tex19.1−/− ESCs. MW markers (kD) are indicated.
Figure 7—figure supplement 3
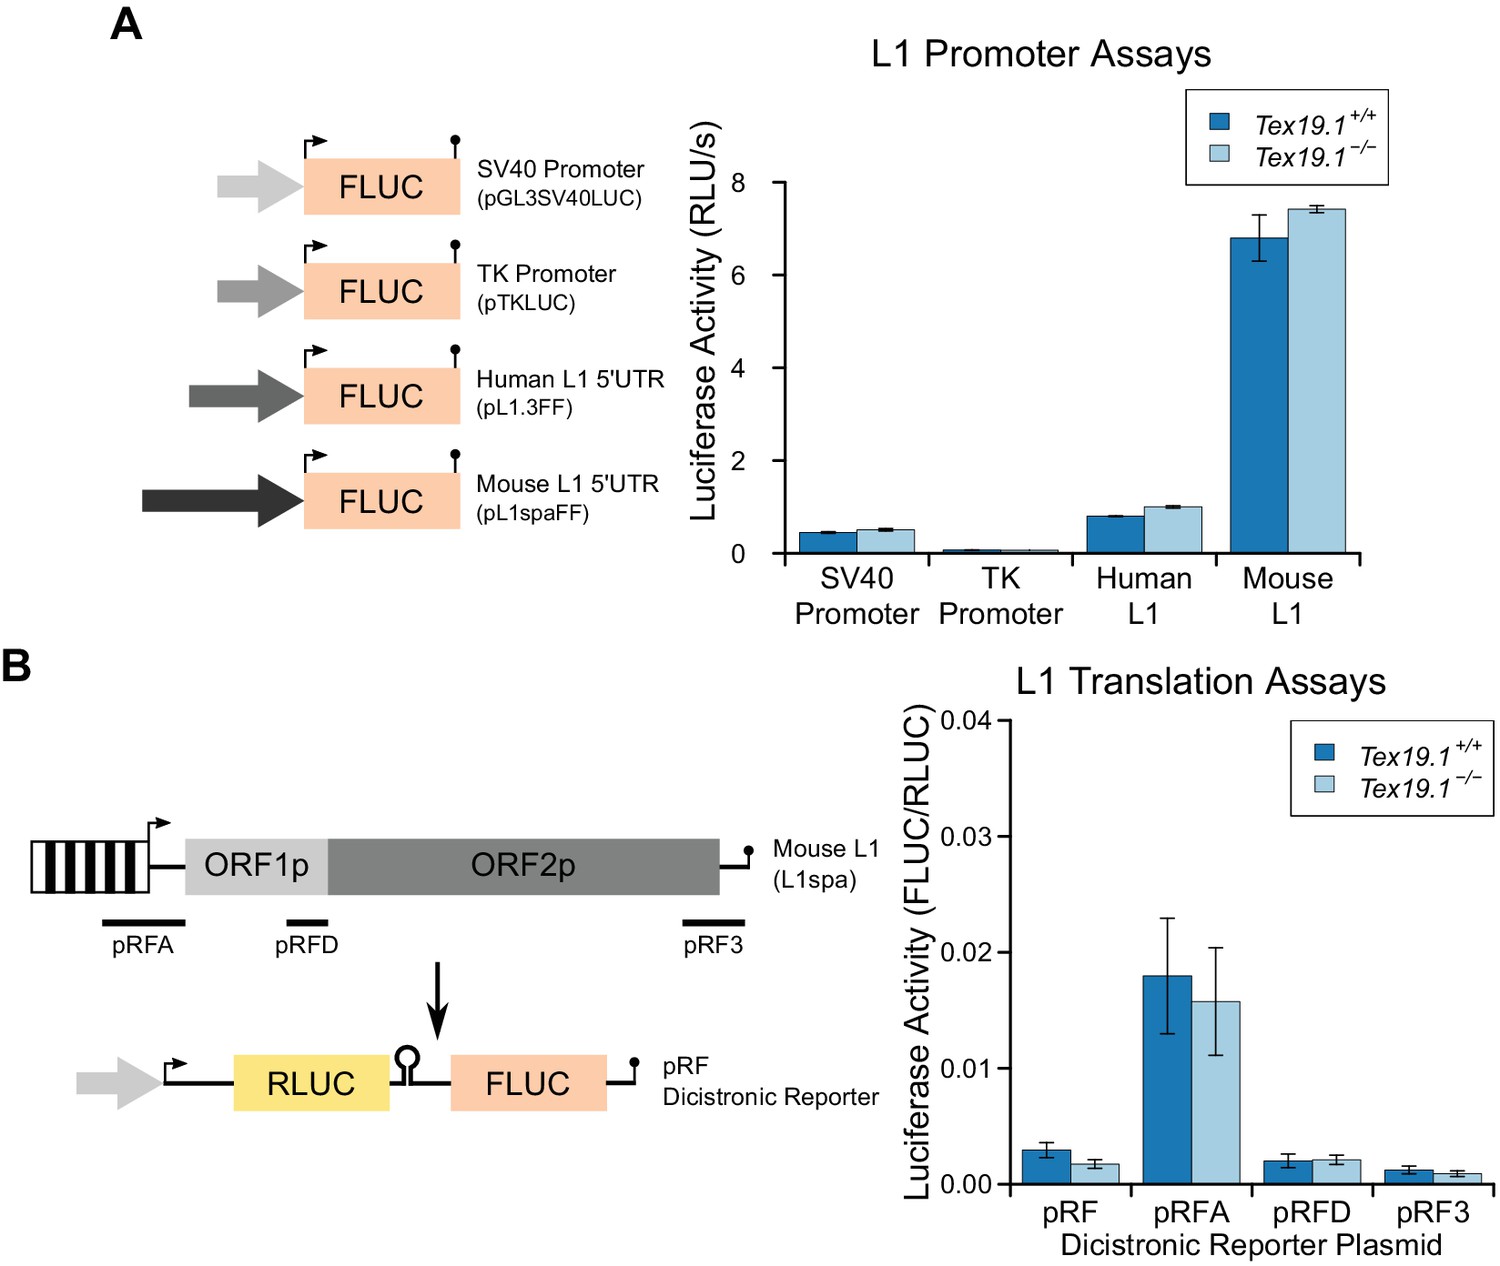
Loss of Tex19.1 does not affect L1 promoter or L1 translation reporter activity in mouse ESCs.
(A) Schematic diagram showing promoter-luciferase constructs containing indicated control or L1-derived promoters. Luciferase activity (relative light units per second) of these constructs after transfection into Tex19.1+/+ and Tex19.1−/− ESCs is shown. Luciferase activity was corrected for transfection efficiency and normalized to the SV40 promoter construct in control ESCs. Error bars indicate SEM for technical replicates of luciferase assays from the same cell lysates. (B) Schematic diagram showing translation-luciferase constructs. Regions of L1 (A: 400 bp upstream of ORF1p covering the 5' UTR; D: 200 bp upstream of ORF2p covering the intergenic region; 3: 312 bp from the 3' UTR) inserted in the pRF dicistronic reporter construct (Li et al., 2006) were transfected into Tex19.1+/− and Tex19.1−/− ESCs. The pRFD construct contains the ORF2p internal ribosome entry site that binds hnRNPL and nucleolin, cellular factors that restrict L1 (Peddigari et al., 2013). Luciferase acivity for these translation-luciferase constructs in Tex19.1+/− and Tex19.1−/− ESCs is shown. Firefly luciferase (FLUC) was measured relative to Renilla luciferase (RLUC). Data represents three replicate transfections for each construct, error bars represent SEM. There is no statistically significant difference in luciferase activity between Tex19.1−/− ESCs and controls for any of the pRF, pRFA, pRFD or pRF3 constructs (t-test, p=0.2, 0.8, 0.9, 0.5 respectively).
Figure 7—figure supplement 4
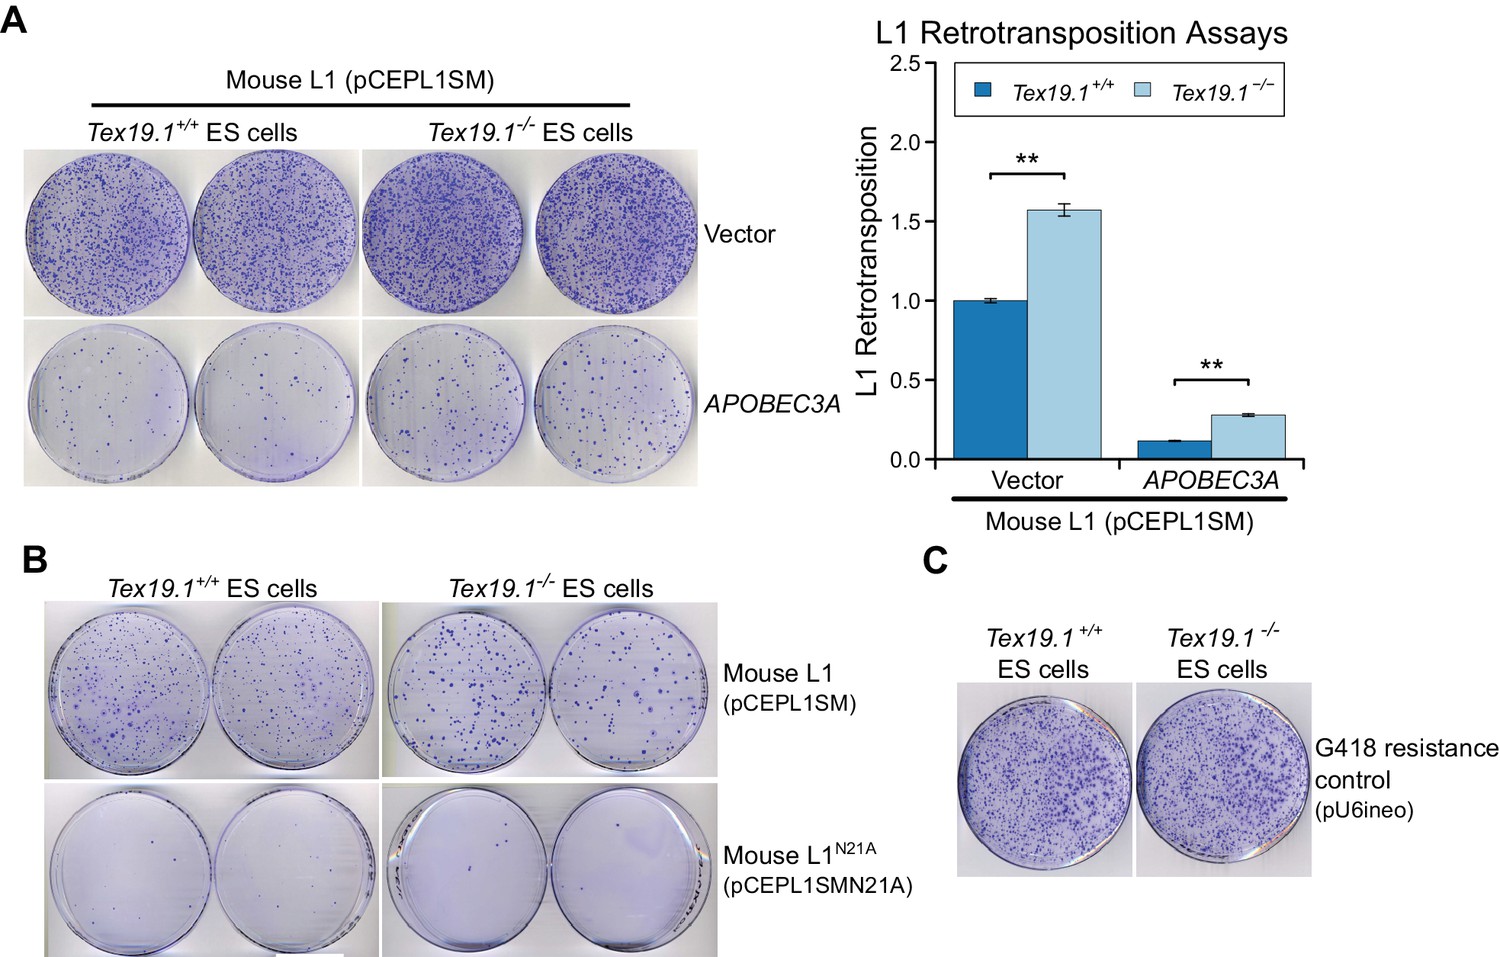
Tex19.1 restricts mobilization of engineered L1 constructs in mouse ESCs.
(A) Plates stained with 0.1% crystal violet showing G418-resistant colonies from L1 retrotransposition assays in Tex19.1+/+ and Tex19.1−/− ESCs. ESCs were co-transfected with a synthetic mouse L1 construct and either empty vector or the L1 restriction factor APOBEC3A. Retrotransposition frequency was calculated relative to Tex19.1+/+ ESCs transfected with empty vector. **p<0.01 (t-test, p=0.005, 0.003 from left to right); error bars indicate SEM. (B) Additional control for L1 retrotransposition assays in mouse ESCs. Plates stained with 0.1% crystal violet showing G418-resistant colonies from L1 retrotransposition assays. Engineered L1 constructs (pCEPL1SMN21A) carrying the N21A mutation in the endonuclease domain of ORF2p that impairs L1 mobilization (Alisch et al., 2006) have greatly reduced retrotransposition in both Tex19.1+/+ and Tex19.1−/− ESCs relative to codon-optimized L1 (pCEPL1SM). (C) Transfection efficiency controls for L1 retrotransposition assays in mouse ESCs. Tex19.1+/+ and Tex19.1−/− ESCs are able to form similar numbers of colonies when transfected with a control plasmid conferring G418 resistance (pU6ineo).
Figure 8 with 1 supplement
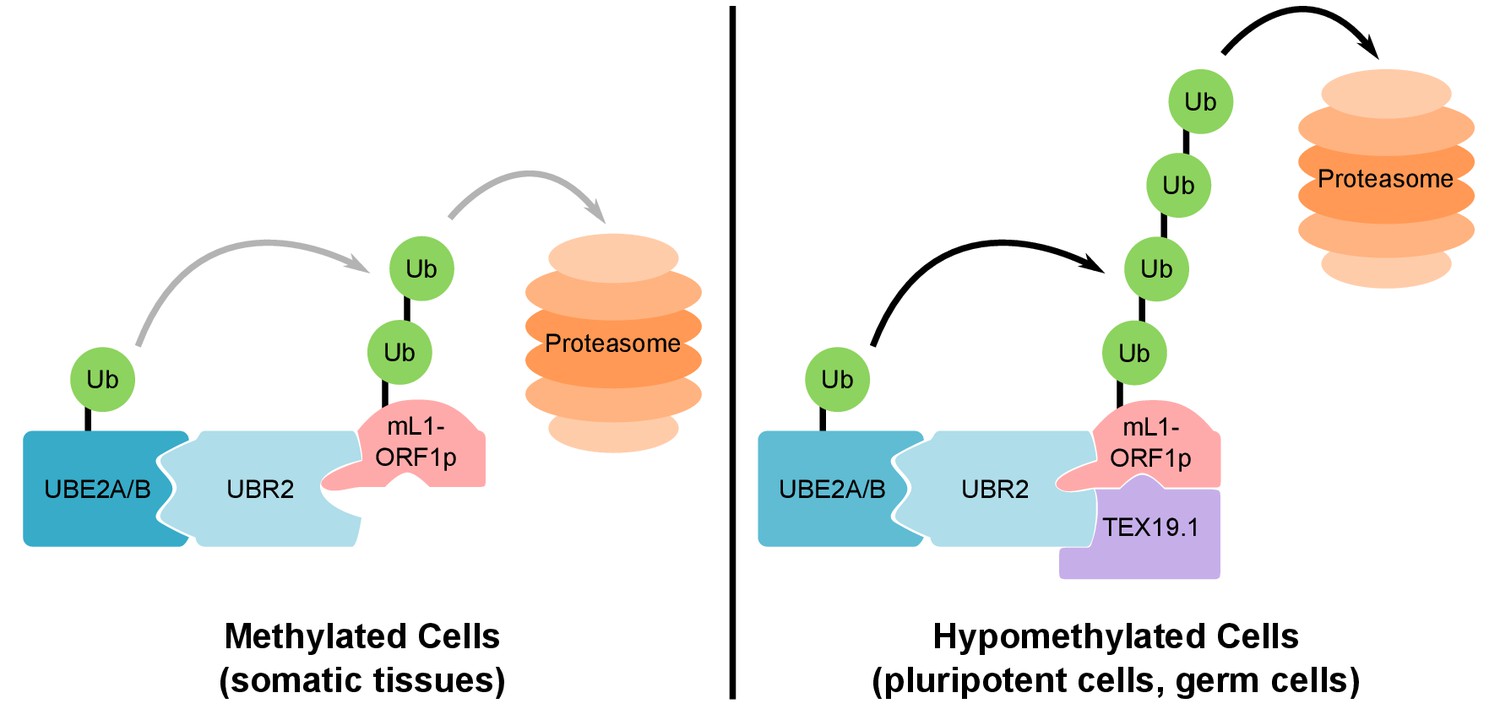
Model For UBR2 and TEX19.1-mediated polyubiquitylation of mL1-ORF1p.
In methylated somatic cells, the RING domain E3 ubiquitin ligase UBR2 and its cognate E2 ubiquitin conjugating enzyme UBE2A/B can interact with mL1-ORF1p and catalyse ubiquitylation and proteasome-dependent turnover of this protein. TEX19.1 in hypomethylated cells, including pluripotent cells and germ cells, interacts with both UBR2 and mL1-ORF1p, stimulating further polyubiquitylation and proteasome-dependent turnover of mL1-ORF1p. The interaction between TEX19.1 and UBR2 concomitantly inhibits the activity of UBR2 towards N-end rule substrates (Reichmann et al., 2017). This model does not exclude additional factors and/or mechanisms contributing to the effects of UBR2 and TEX19.1 on the stability of mL1-ORF1p.
Figure 8—figure supplement 1
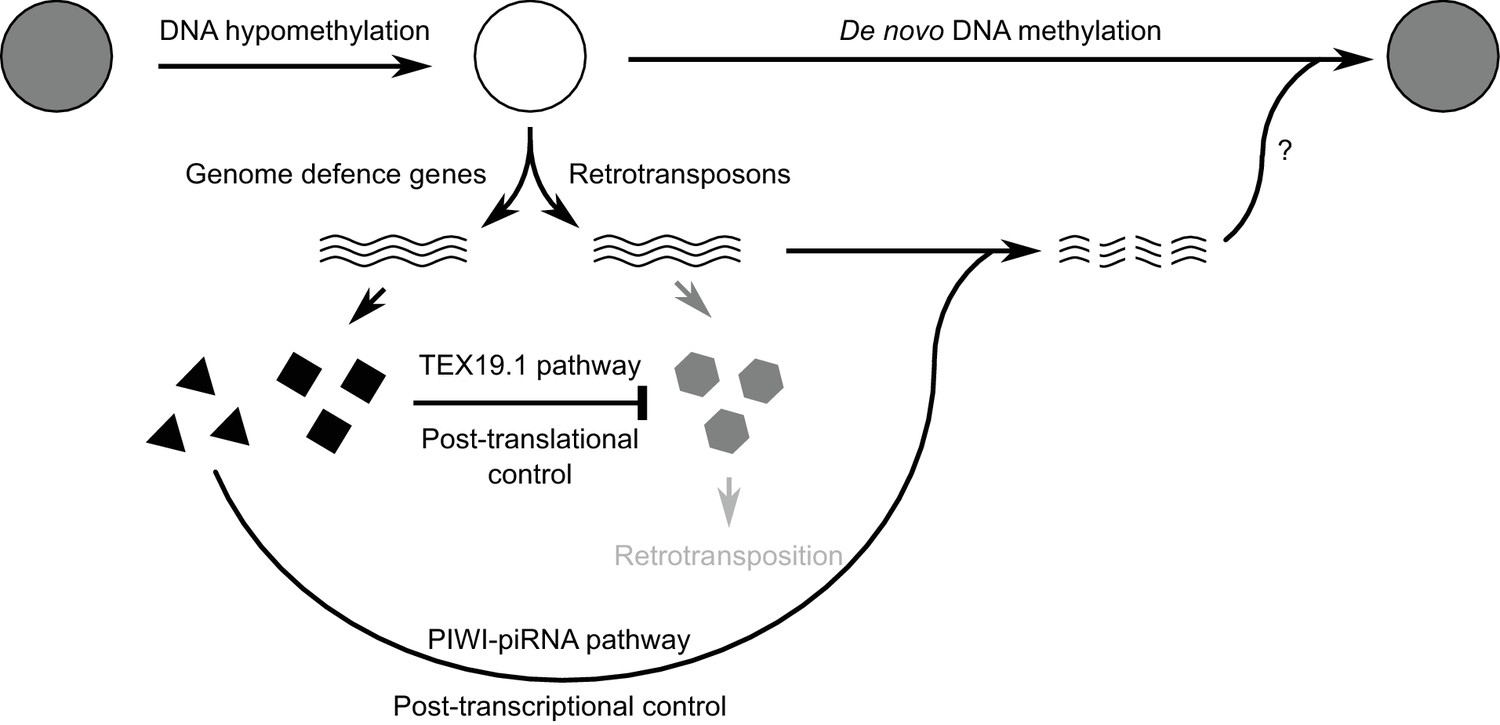
Model for retrotransposon regulation during epigenetic reprogramming in lineage-restricted germ cells.
Schematic diagram illustrating how post-translational control mechanisms can contribute to retrotransposon control and genomic stability in hypomethylated male germ cells. RNAs are indicated by wavy lines, proteins by small solid polygons.
Author response image 1
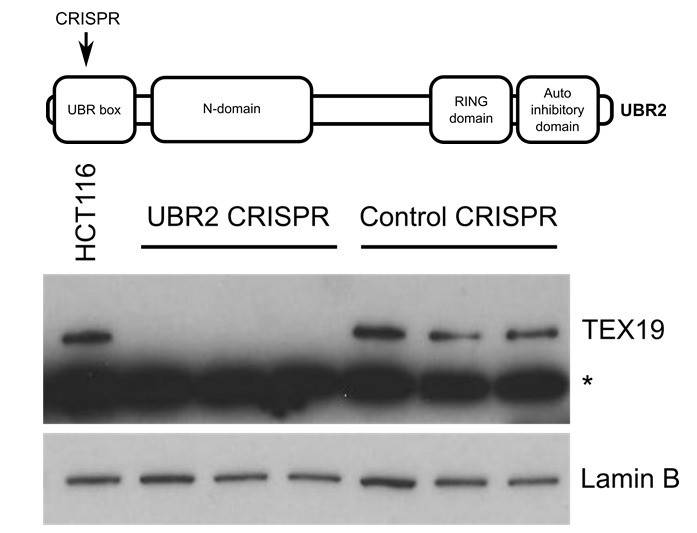
Western blot of endogenous TEX19 in UBR2 mutant and control HCT116 cells.
Parental HCT116 cells and three independent clones isolated from either UBR2 or control CRISPR genome editing experiments are shown. UBR2 CRISPR guides were directed against exon 2 of UBR2, and the three independent UBR2 mutant clones all have deletions in the UBR domain (top panel). Endogenous TEX19 protein is readily detected in parental and control CRISPR lines, but not in UBR2 mutant lines (bottom panel. A cross-reacting band detected with the TEX19 antibodies is marked with an asterisk, and antibodies to lamin B were used as a loading control.
Additional files
-
Supplementary file 1
Preliminary mass spectrometry data from TEX19.1-YFP immunoprecipitates.
Preliminary mass spectrometry data obtained from a single immunoprecipitation and mass spectrometry experiment from ESC cytoplasmic lysates. TEX19.1-YFP and YFP alone immunoprecipitations were run on a polyacrylamide gel and each gel lane cut into seven bands according to size (T1-T7). Proteins identified by mass spectrometry in TEX19.1-YFP immunoprecipitates, but not in YFP controls, are listed in the table. This preliminary list could contain proteins that interact non-specifically with the beads or YFP that are variably detected in YFP alone samples, and/or proteins that are variably present in TEX19.1-YFP samples that cannot be consistently reproduced under these experimental conditions. Proteins that were verified as TEX19.1 interactors in independent samples by Western blotting are listed in Supplementary file 2.
- https://doi.org/10.7554/eLife.26152.022
-
Supplementary file 2
Proteins identified in TEX19.1-YFP immunoprecipitates.
Proteins identified by mass spectrometry in TEX19.1-YFP immunoprecipitates from mouse ESC cytoplasmic lysates, but not in YFP controls. Only interactors verified by Western blotting (Figure 2) are listed. Queries matched indicates the number of MS/MS spectra that were matched to each protein, coverage indicates the percentage of target protein matched by MS/MS spectra.
- https://doi.org/10.7554/eLife.26152.023
-
Supplementary file 3
Oligonucleotides used in this study.
Lower case nucleotides in the repair template sequence indicate mutations relative to wild-type sequence.
- https://doi.org/10.7554/eLife.26152.024
-
Supplementary file 4
Plasmids used in this study.
Description of plasmids used in this study.
- https://doi.org/10.7554/eLife.26152.025
-
Supplementary file 5
Antibodies used for western blots.
List of antibodies, sources and dilutions used for Western blots.
- https://doi.org/10.7554/eLife.26152.026
Download links
A two-part list of links to download the article, or parts of the article, in various formats.
Downloads (link to download the article as PDF)
Open citations (links to open the citations from this article in various online reference manager services)
Cite this article (links to download the citations from this article in formats compatible with various reference manager tools)
Mobilization of LINE-1 retrotransposons is restricted by Tex19.1 in mouse embryonic stem cells
eLife 6:e26152.
https://doi.org/10.7554/eLife.26152


