Post-meiotic DNA double-strand breaks occur in Tetrahymena, and require Topoisomerase II and Spo11
- University of Vienna, Austria
- Tohoku University, Japan
- York University, Canada
- Ryerson University, Canada
Figures
Figure 1
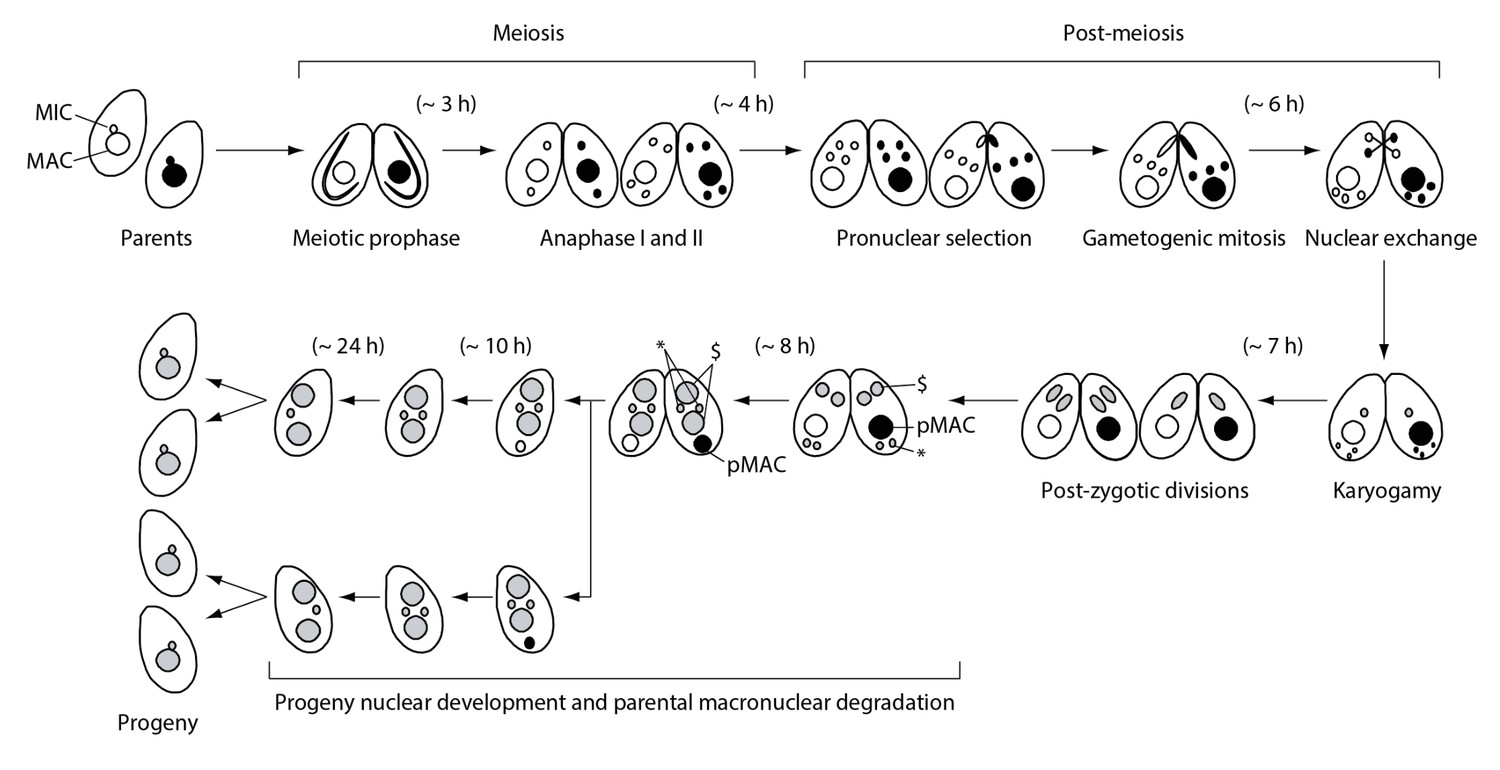
Nuclear events during wild-type Tetrahymena mating.
When starved cells of different mating types are mixed, they start mating and meiosis, and produce sexual progeny. MAC-macronucleus; MIC-micronucleus; $-progeny macronuclear anlagen; *-progeny MICs; pMAC-degrading parental macronucleus. Time (h) after mixing of cells is indicated.
Figure 2 with 1 supplement
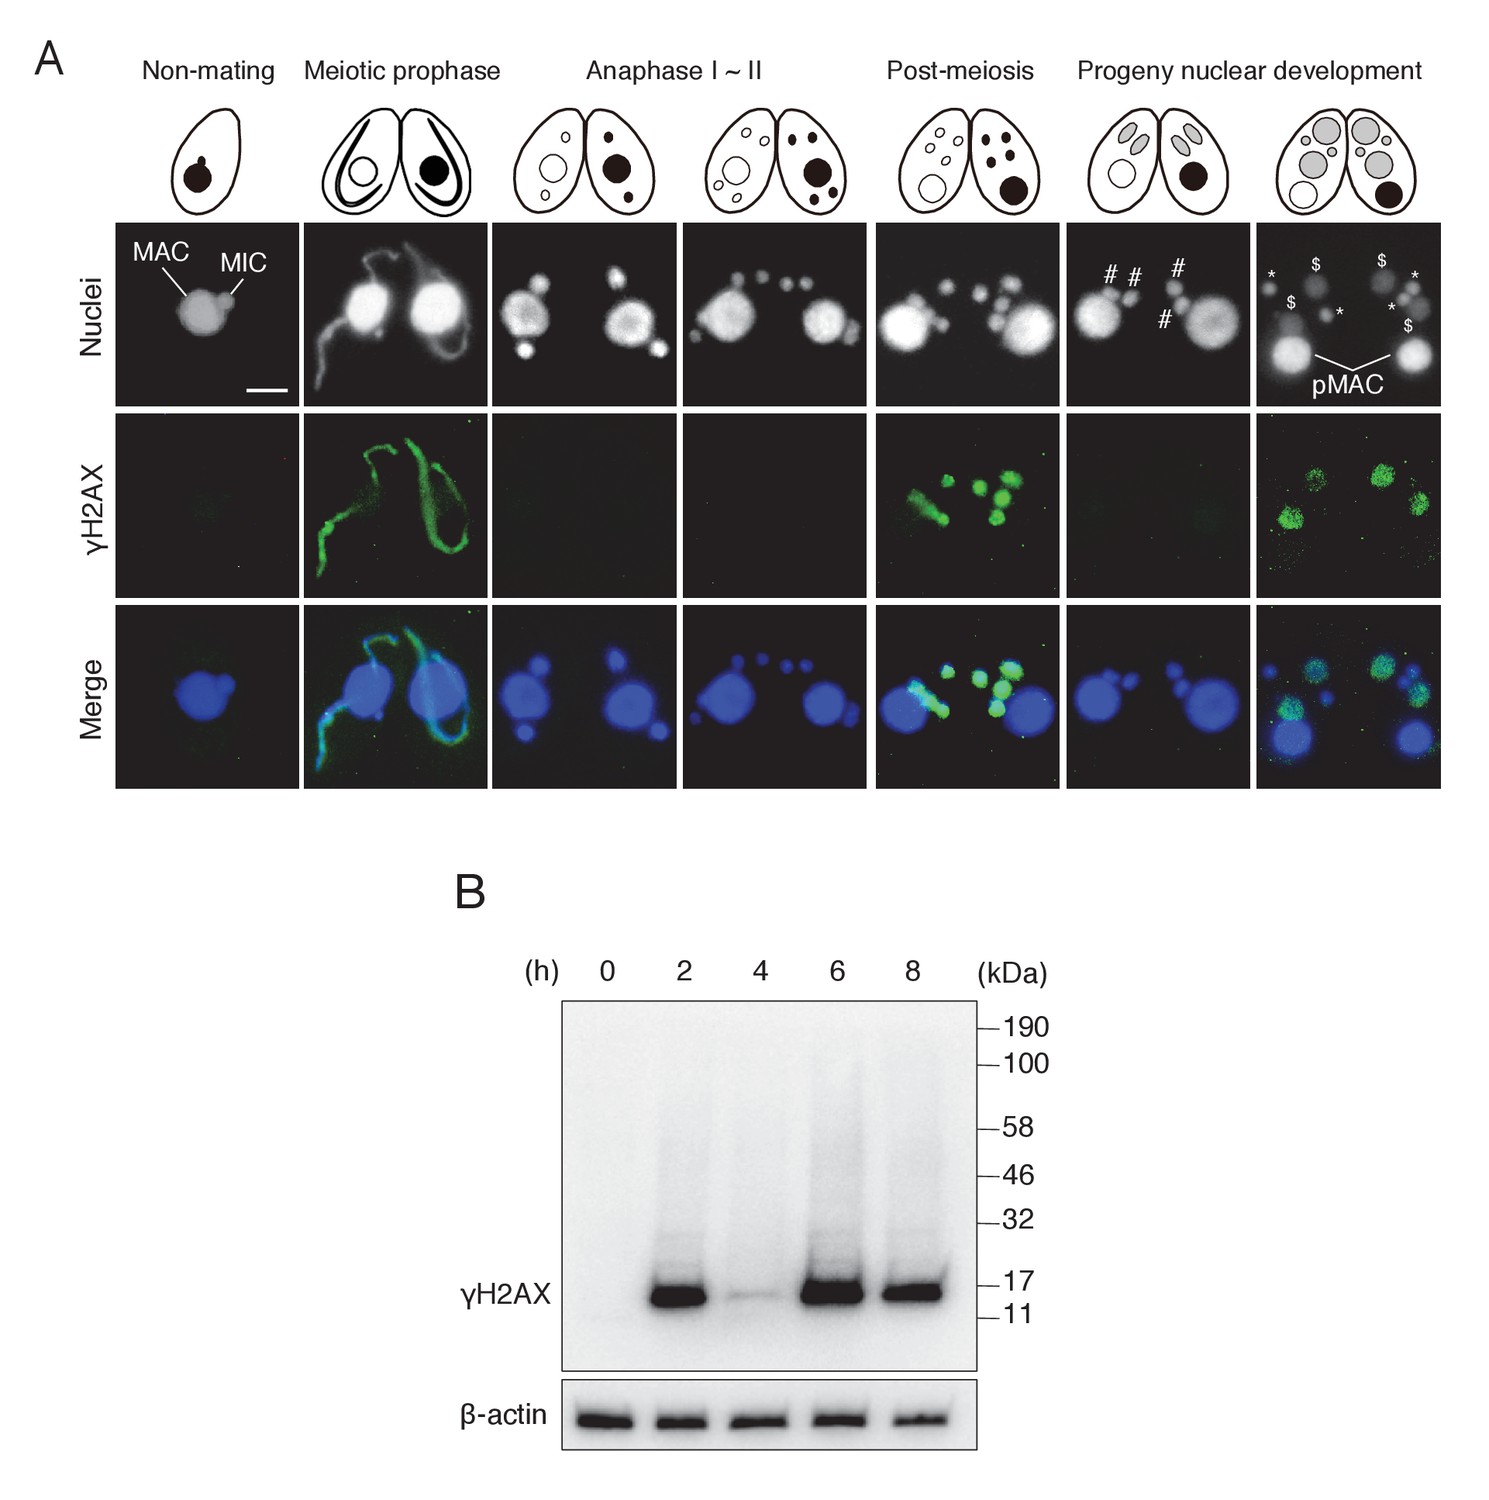
γH2AX foci formation, indicating histone H2AX phosphorylation, in Tetrahymena mating.
(A) γH2AX foci appear at three distinct time points—in elongating micronuclei at meiotic prophase—in pronuclei at the post-meiotic stage; and in the developing anlagen—but do not appear in parental MACs throughout mating. Cartoons illustrate the corresponding stages from Figure 1. Scale bar denotes 10 μm. MAC-macronucleus; MIC-micronucleus; #-differentiating zygotic nuclei; $-progeny macronuclear anlagen; *-progeny micronuclei; pMAC-degrading parental macronuclei. (B) Western blot analysis of γH2AX from different time points during mating. β-actin was the loading control. See also Figure 2—figure supplement 1.
Figure 2—figure supplement 1
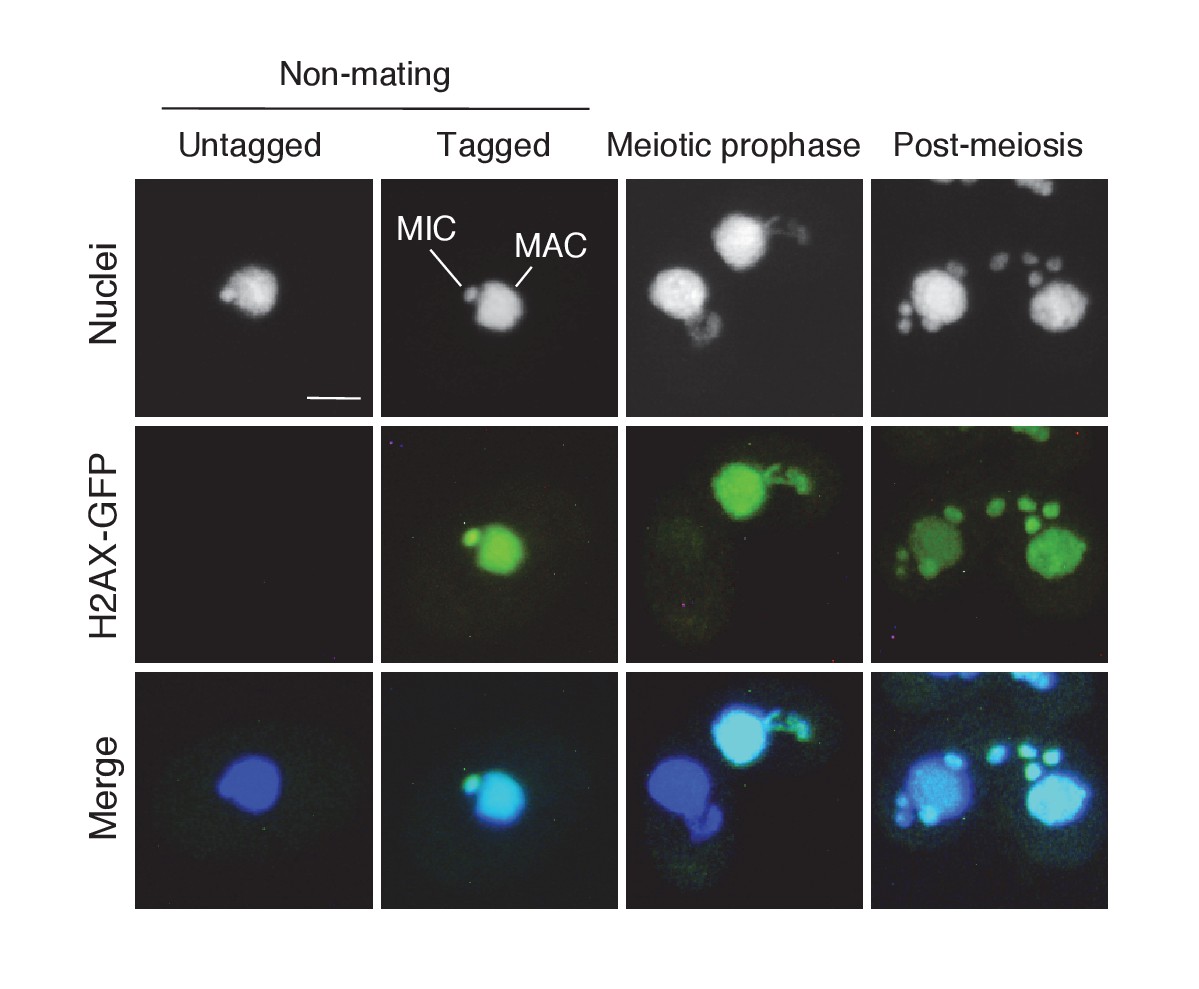
Subcellular localization of C-terminally GFP-tagged H2AX during the pre-zygotic stages.
Wild-type strain (left) and the tagged strain (right) were mated. Approximately 1 kb of the ORFs (5′) and downstream UTRs (3′) of the H2AX (TTHERM_00790790) genomic loci were amplified from SB210 genomic DNA using PrimeSTAR Max DNA Polymerase (Takara) and the following primers: H2AX 5′ forward – AGTCGAGCTCTGAAGGTGATTCGTCATTGATTG, reverse – AGTCGGATTCAAGGTCTTGAGAAGCTTGACCTC; H2AX 3′ forward – AGTCCTCGAGTATAATGTGGCAAGTCTAAGTCTG, reverse – AGTCGGTACCACCTATGTAGCAACGAGTCATTTAT. The 5′ ORF sequence does not contain a stop codon. Amplified PCR products were purified and integrated into the backbone vector pEGFP-NEO4 as described in Materials and methods. The resulting vector (pH2AX-EGFP-NEO4) was linearized with SacI plus KpnI before biolistic transformation into Tetrahymena. Indirect immunofluorescence to visualize the tagged protein was carried out as described in Materials and methods. Scale bar denotes 10 μm. MAC-macronucleus; MIC-micronucleus.
Figure 3 with 2 supplements
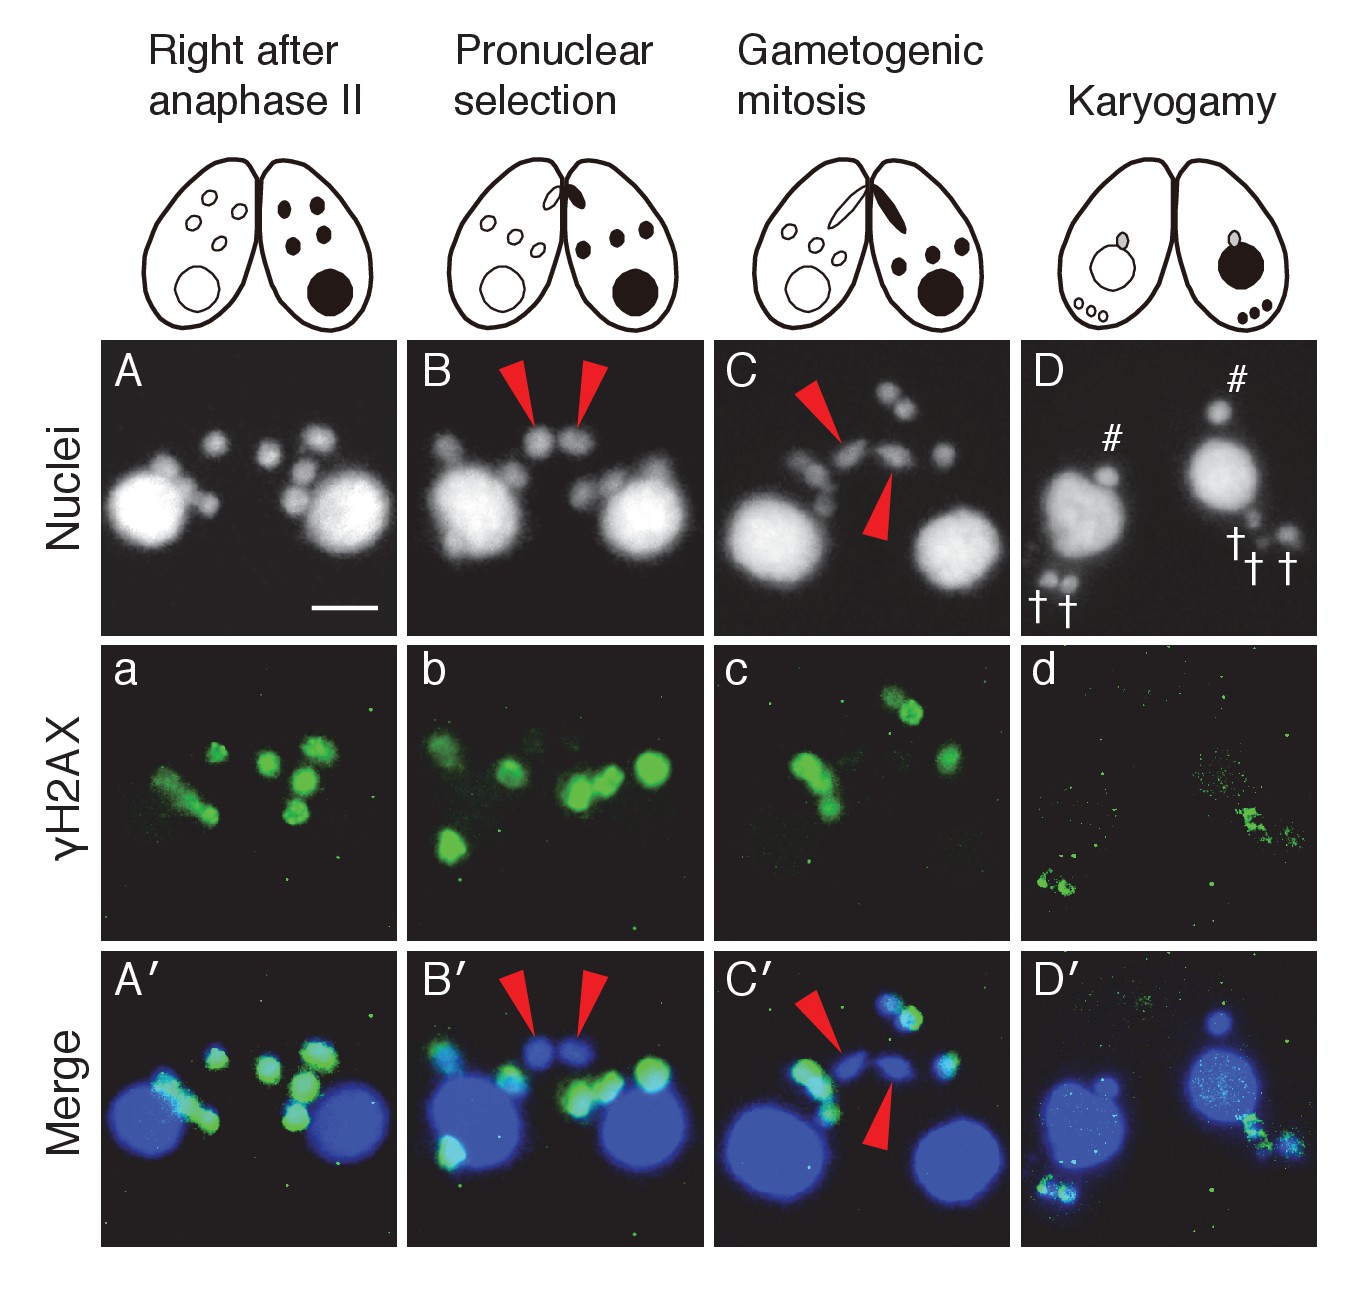
Post-meiotic γH2AX and its relation to gametogenic mitosis.
(A/a/A′) γH2AX is formed in all four pronuclei after completion of meiosis. (B/b/B′) A pronucleus (red arrowheads) becomes immunonegative for γH2AX. (C/c/C′) Soon thereafter, the pronucleus without γH2AX (red arrowheads) is selected to undergo gametogenic mitosis. (D/d/D′) The unselected pronuclei, in which γH2AX (†) persists, are degraded at the posterior region of the cytoplasm and eventually disappear by the karyogamy stage. #-zygotic nuclei. Scale bar denotes 10 μm. See also Figure 3—figure supplements 1 and 2.
Figure 3—figure supplement 1
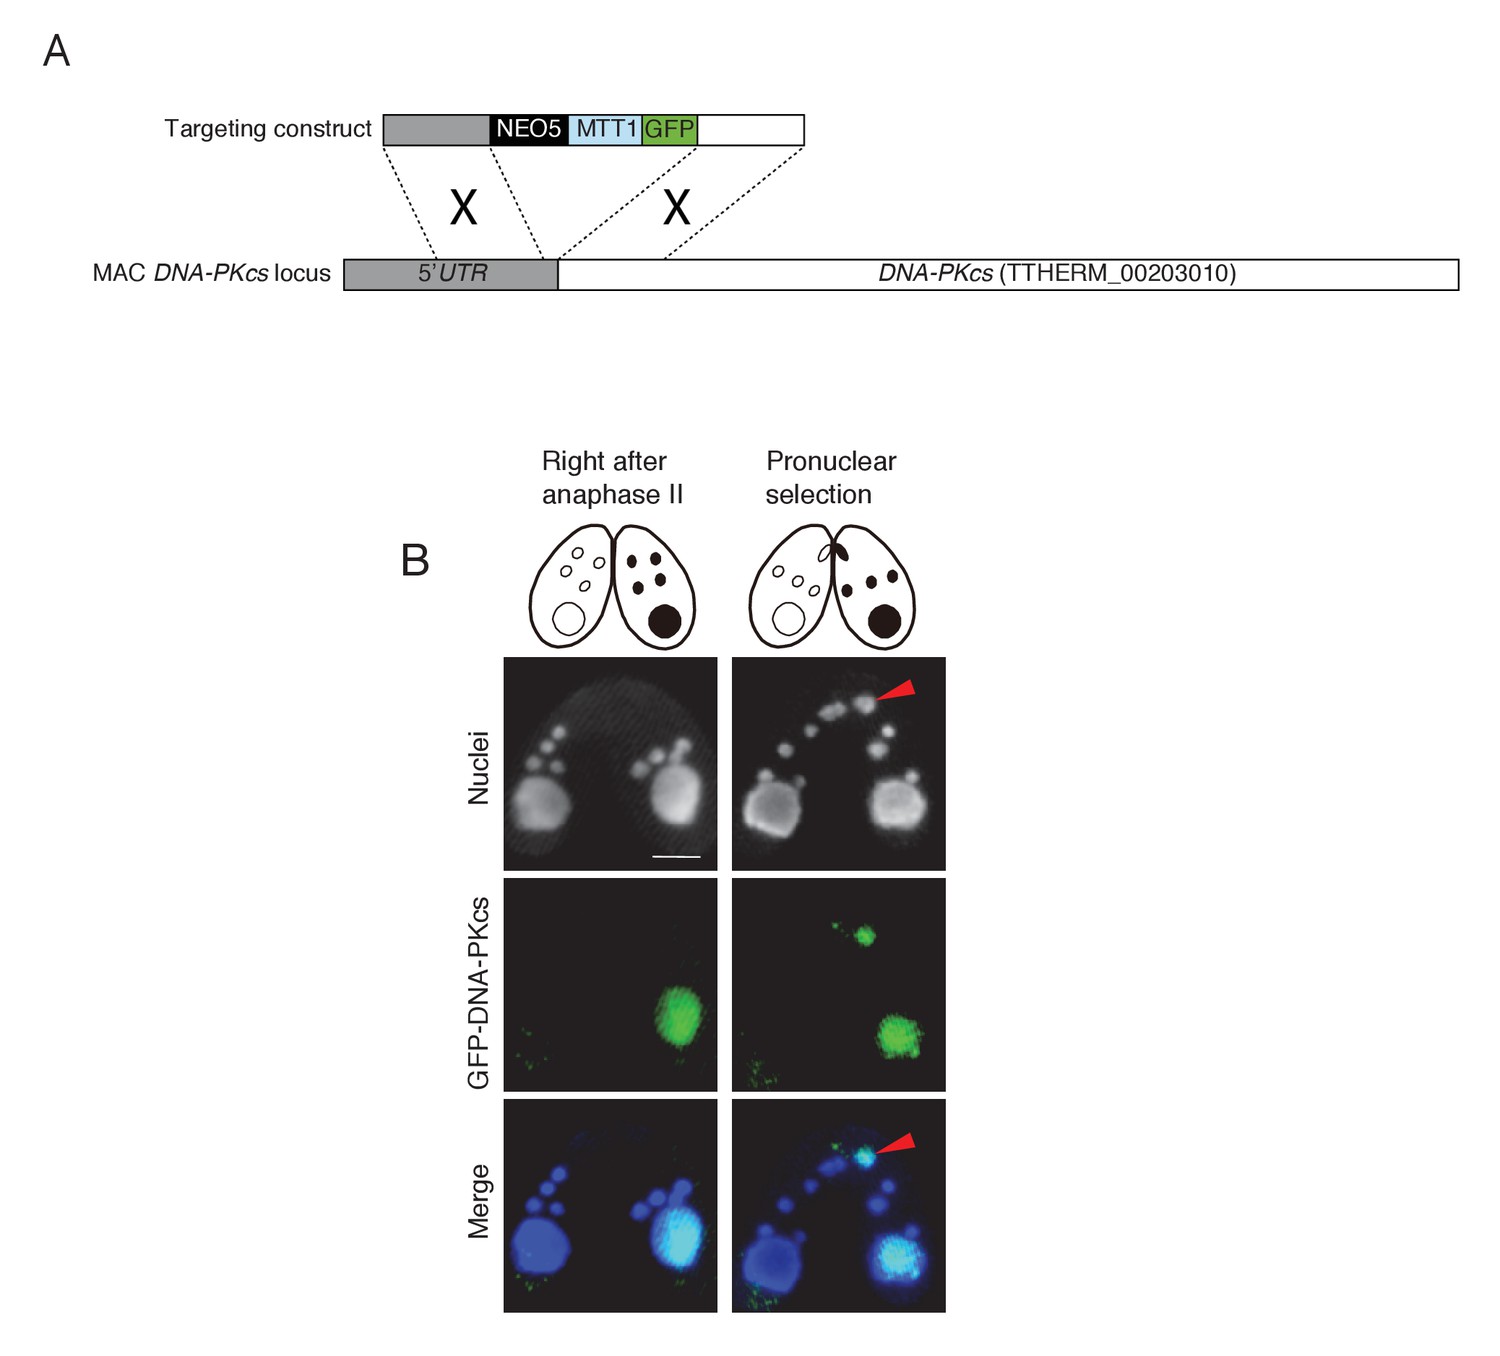
Possible involvement of NHEJ in PM-DSB repair.
(A) Construct for the ectopic expression of GFP-tagged DNA-PKcs (TTHERM_00203010). GFP under the cadmium-inducible MTT1 promoter was introduced into DNA-PKcs in the MAC. Approximately 1 kb of the DNA-PKcs 5′ UTR and ORF were amplified from SB210 genomic DNA using PrimeSTAR Max DNA Polymerase (TaKaRa) and the following primers: DNA-PKcs 5′ forward – AGTCGAGCTCACTTTAGCATTGGCTAATGCATG, reverse – AGTCGTCGACTTTTTAACGAATTCAAAAAAATAATAATAAGC; and DNA-PKcs 3′ forward – AGTCGGATCCATGTTAGAGCATTTACTTGAAAGCGC, reverse – AGTCGGTACCTGAGAATAAGCTGTCAACAC. Amplified forward and reverse target fragments were cloned into the SacI–SalI and BamHI–KpnI sites, respectively, of the backbone plasmid pBNMB1-EGFP (a gift from Dr Kazufumi Mochizuki, CNRS Institute of Human Genetics, Montpellier, France). The resulting vector (pEGFP-DNA-PKcs-NEO5) was linearized with SacI plus KpnI before biolistic transformation into Tetrahymena. (B) Localization of GFP-DNA-PKcs at the post-meiotic stage. Wild-type cells (left) were mated with tagged cells (right). Prior to pronuclear selection, DNA-PKcs localizes only to the MAC. Upon pronuclear selection, it appears in the selected pronucleus (red arrowhead). Scale bar denotes 10 μm.
Figure 3—figure supplement 2
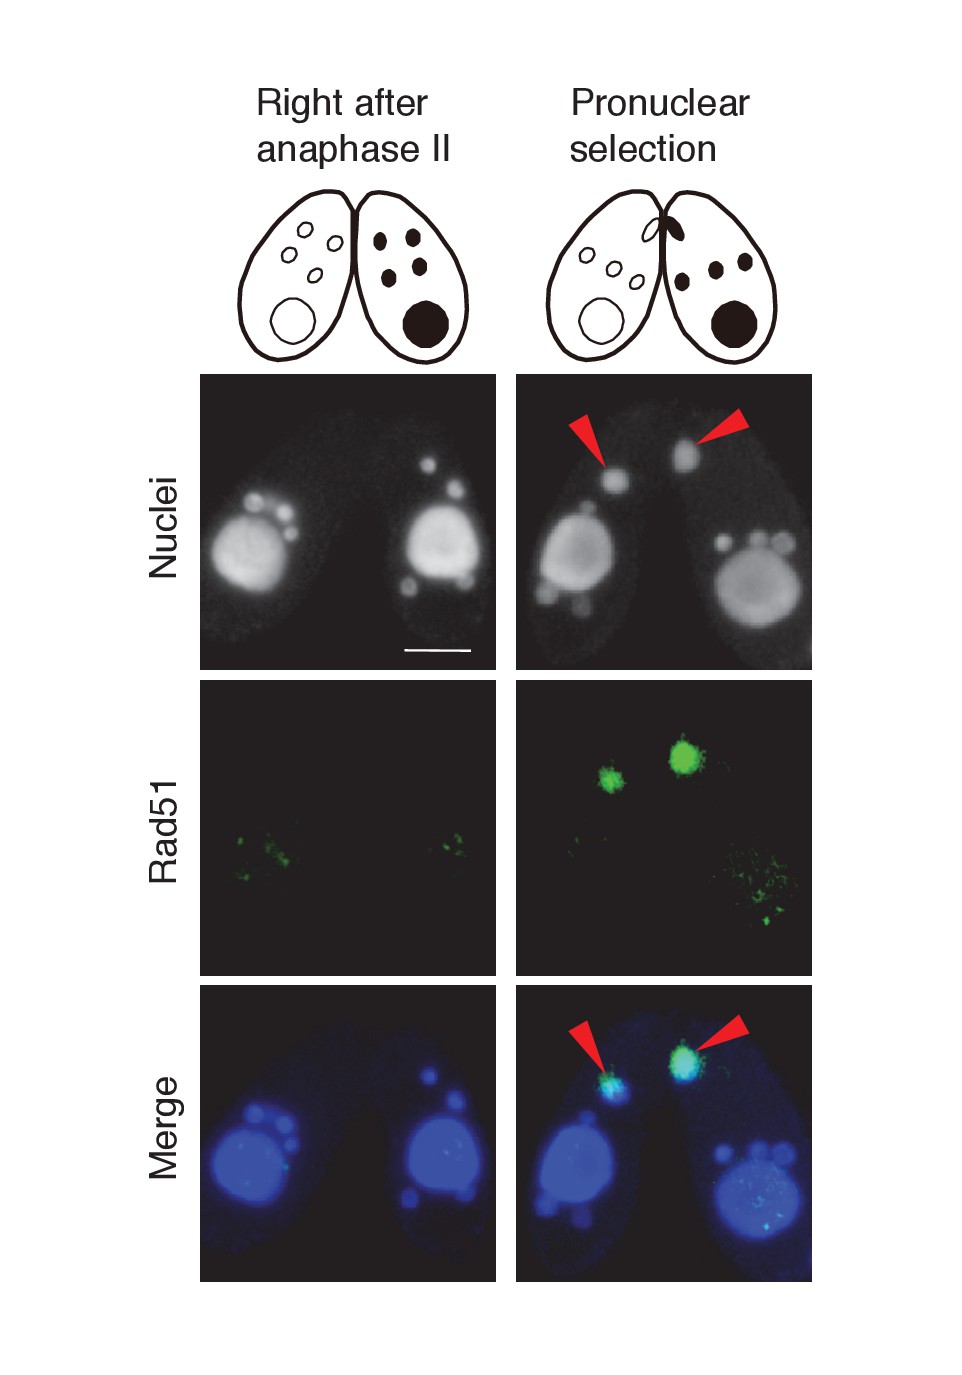
Possible involvement of recombination protein Rad51 in PM-DSB repair.
Mating wild-type cells at the post-meiotic stage were fixed and membrane-permeabilized as described previously (Howard-Till et al., 2011). Cells were incubated for overnight at 4°C with primary antibody that recognizes the Tetrahymena Rad51 (1:100; mouse monoclonal, Clone 51RAD01, NeoMarkers, Fremont, CA) (Howard-Till et al., 2011). After washing with PBS, cells were incubated with FITC-labeled goat anti-mouse (1:500; Merck Millipore) secondary antibody for 1 hr at room temperature in the dark. After washing with PBS, cells were stained with 1 μg/μl DAPI and observed under fluorescence microscopy. Rad51 is not expressed in any type of nuclei directly after anaphase II, and appears only in the selected pronucleus (red arrowheads) once pronuclear selection takes place. Scale bar denotes 10 μm.
Figure 4
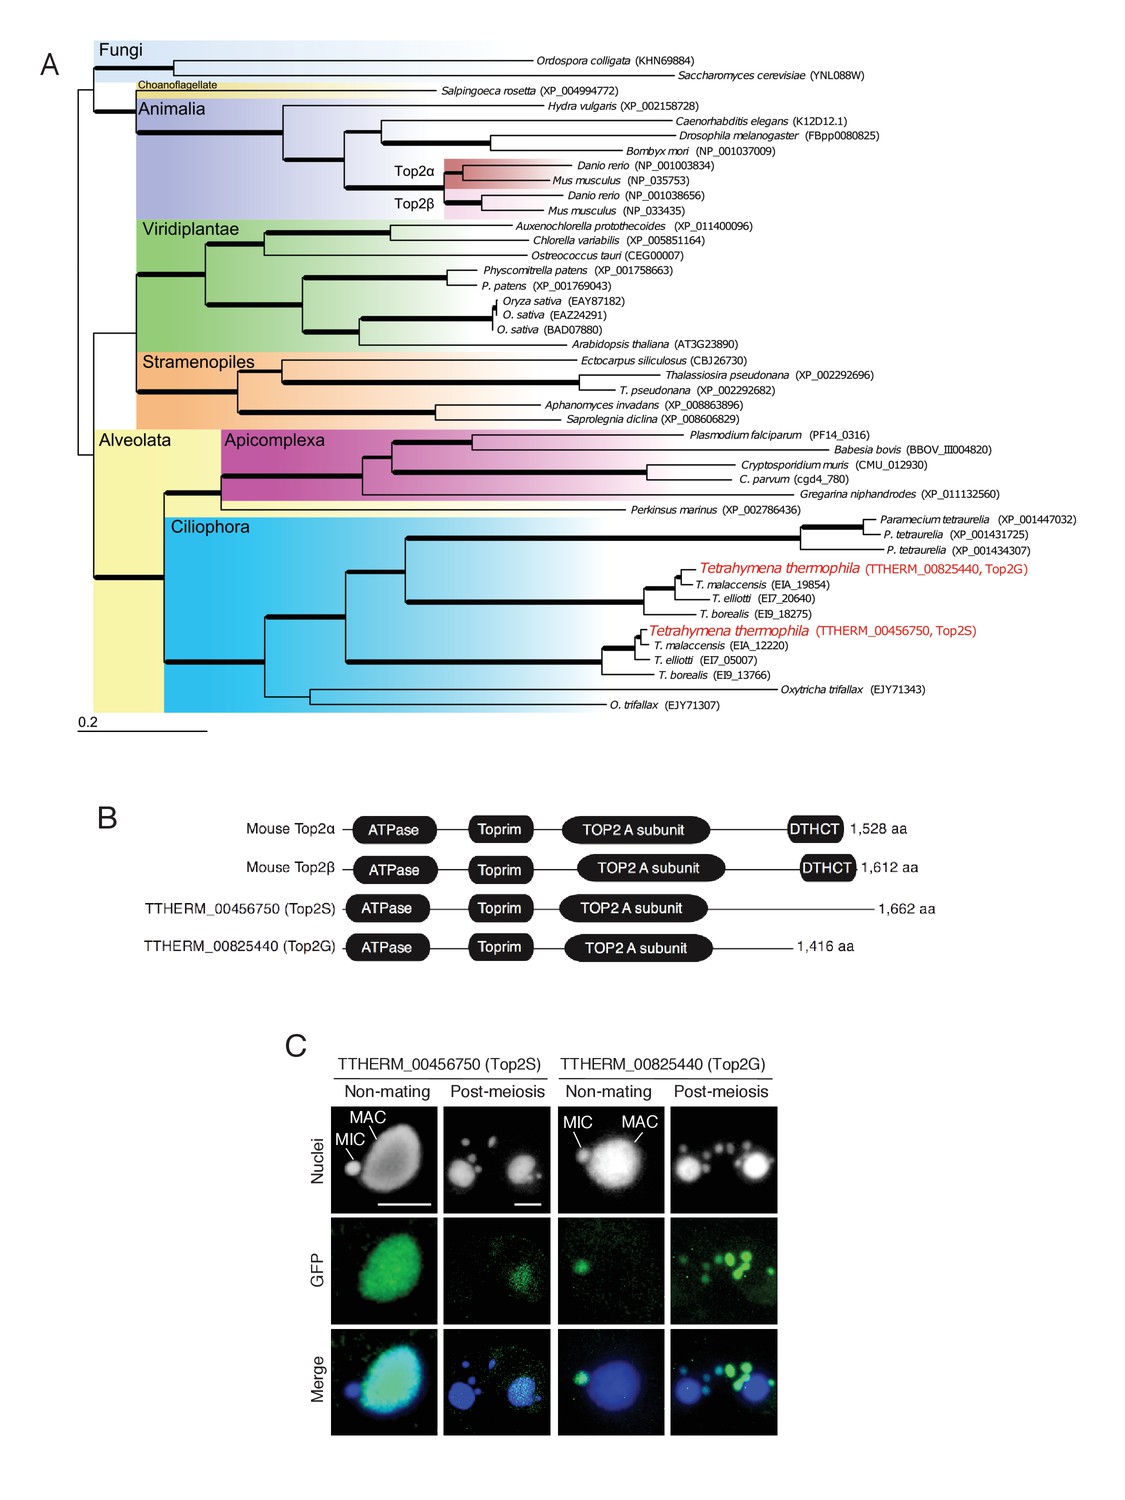
Conservation and expression pattern of Tetrahymena topoisomerase 2 (Top2) homologs.
(A) Phylogenetic tree of Top2 homologs. The tree was reconstructed with the maximum likelihood method (see Materials and methods). Accession numbers indicate protein sequences obtained from GenBank. Branch width represents the bootstrap value. Scale bar denotes 0.2 expected amino acid substitutions per site. (B) Comparison of conserved domains between mouse and Tetrahymena Top2 homologs. (C) Subcellular localization of C-terminally GFP-tagged Tetrahymena Top2 paralogs. Based on their localization, TTHERM_00456750p and TTHERM_00825440p were designated Top2S (Top2 in the somatic nucleus) and Top2G (Top2 in germline nucleus), respectively. In mating pairs, Top2G-GFP expressed in one of the mating partners (right) migrates to the pronucleus of the untagged cell (left), causing a weak signal. MAC-macronucleus, MIC-micronucleus. Scale bars denote 10 μm.
Figure 5
Role of Top2G in the post-meiotic stage.
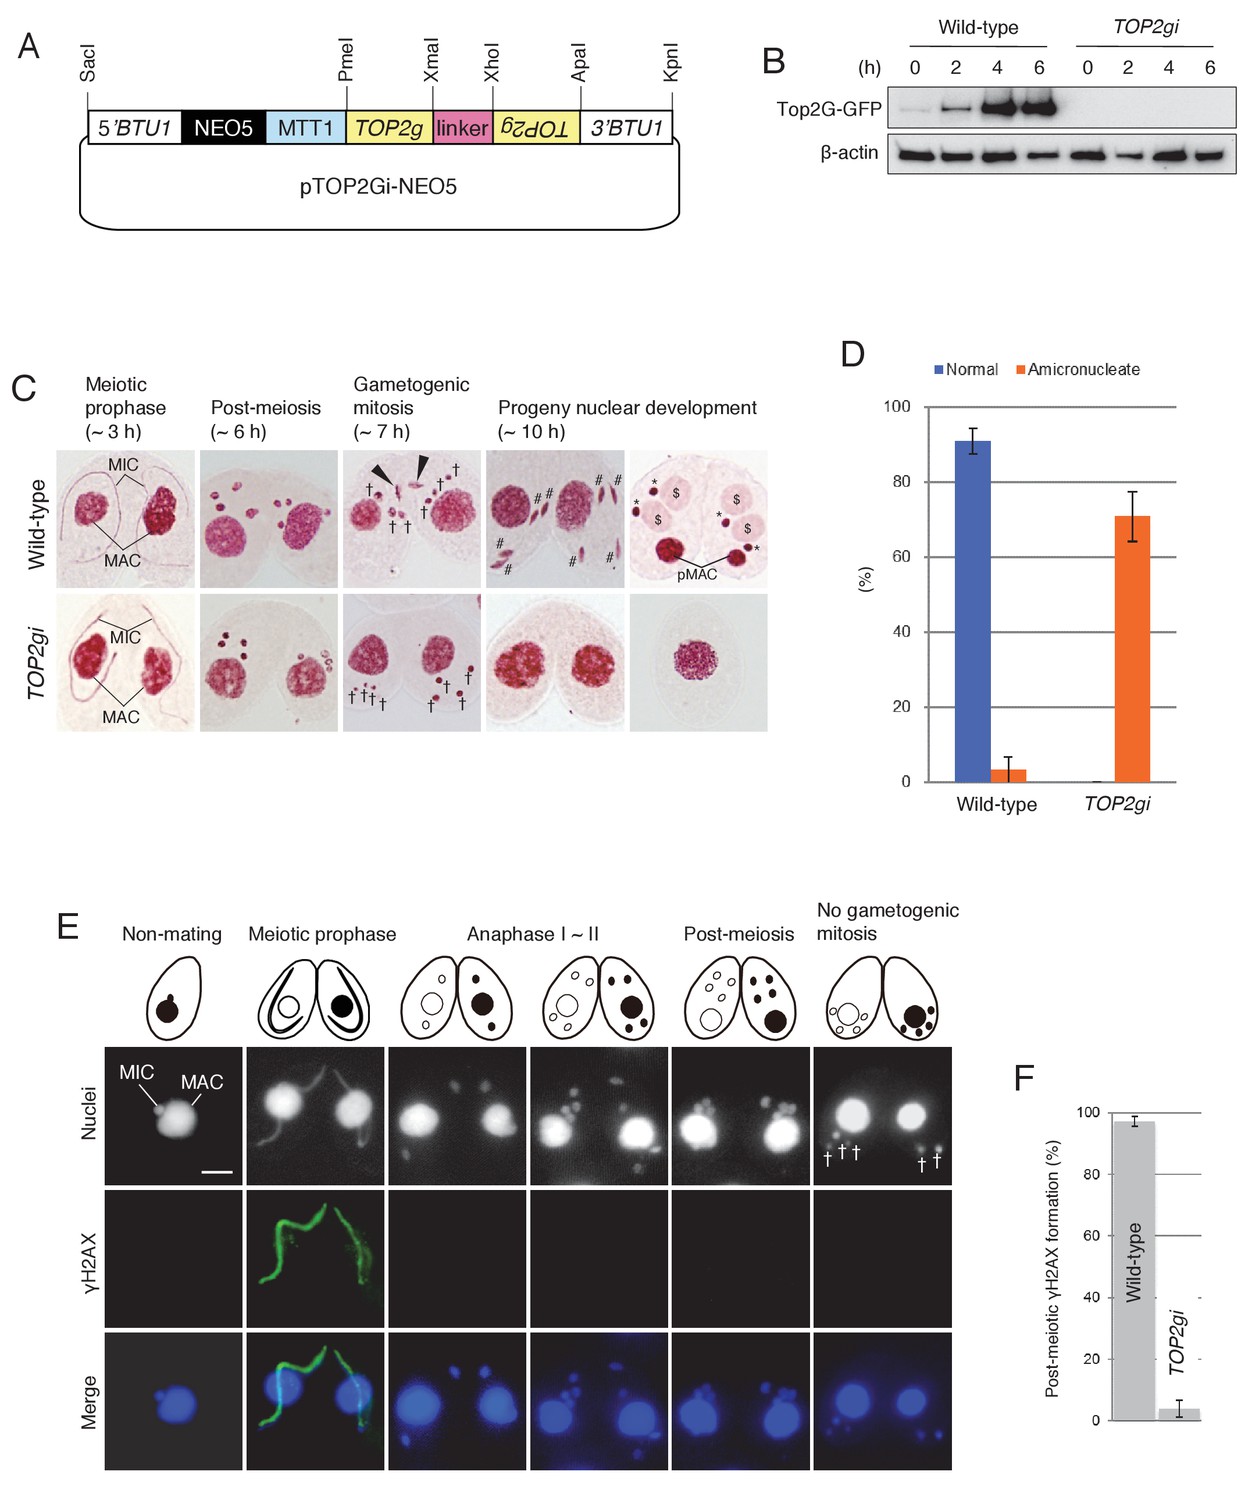
(A) Schematic representation of the pTOP2Gi-NEO5 knockdown vector used for Top2G RNAi. Hairpin RNA was produced under the control of the cadmium-inducible MTT1 promoter. This construct was integrated into the β-tubulin (BTU1) genomic locus by homologous recombination. (B) Western blotting of TOP2G-GFP in the wild-type and TOP2gi crosses to assess RNAi efficiency. β-actin was the loading control. (C) Acetic orcein staining of the wild-type (top) and TOP2gi (bottom) crosses. Gametogenic mitosis (black arrowheads) took place in the wild-type crosses but was not observed in the TOP2gi crosses. Wild-type crosses underwent progeny nuclear development by 10 hr, whereas TOP2gi crosses became amicronucleate and did not produce progeny nuclei. MAC-macronucleus; MIC-micronucleus; †-unselected pronuclei; #-differentiating zygotic nuclei; $-progeny macronuclear anlagen; *-progeny micronuclei; pMAC-degrading parental macronuclei. Time (h) after mixing starved cells of different mating types is indicated. (D) Percentage of wild-type and TOP2gi cells with progeny nuclei and amicronucleate cells at 10 hr. Columns and error bars represent the means and standard deviations (p<0.01 as calculated by Tukey HSD test) of four measurements. See also Figure 5–sourse data 1 for wild-type and TOP2gi crosses data. (E) Post-meiotic γH2AX formation is inhibited in TOP2gi crosses (compare with wild-type crosses in Figure 1A). Unselected pronuclei (†) assemble in the posterior region of the cytoplasm and are degraded. Scale bar denotes 10 μm. (F) Percentage of wild-type and TOP2gi post-meiotic cells with γH2AX formation in the pronuclei. Columns and error bars represent means and standard deviations (p<0.01, as calculated by Tukey’s HSD test) of four measurements. See also Figure 5–sourse data 2 for wild-type and TOP2gi crosses data.
-
Figure 5—source data 1
Normal development is significantly reduced in TOP2gi crosses.
- https://doi.org/10.7554/eLife.26176.010
-
Figure 5—source data 2
Post-meiotic γH2AX formation is significantly reduced in TOP2gi crosses.
- https://doi.org/10.7554/eLife.26176.011
Figure 6
Spo11 is required for the correct execution of post-meiotic events.
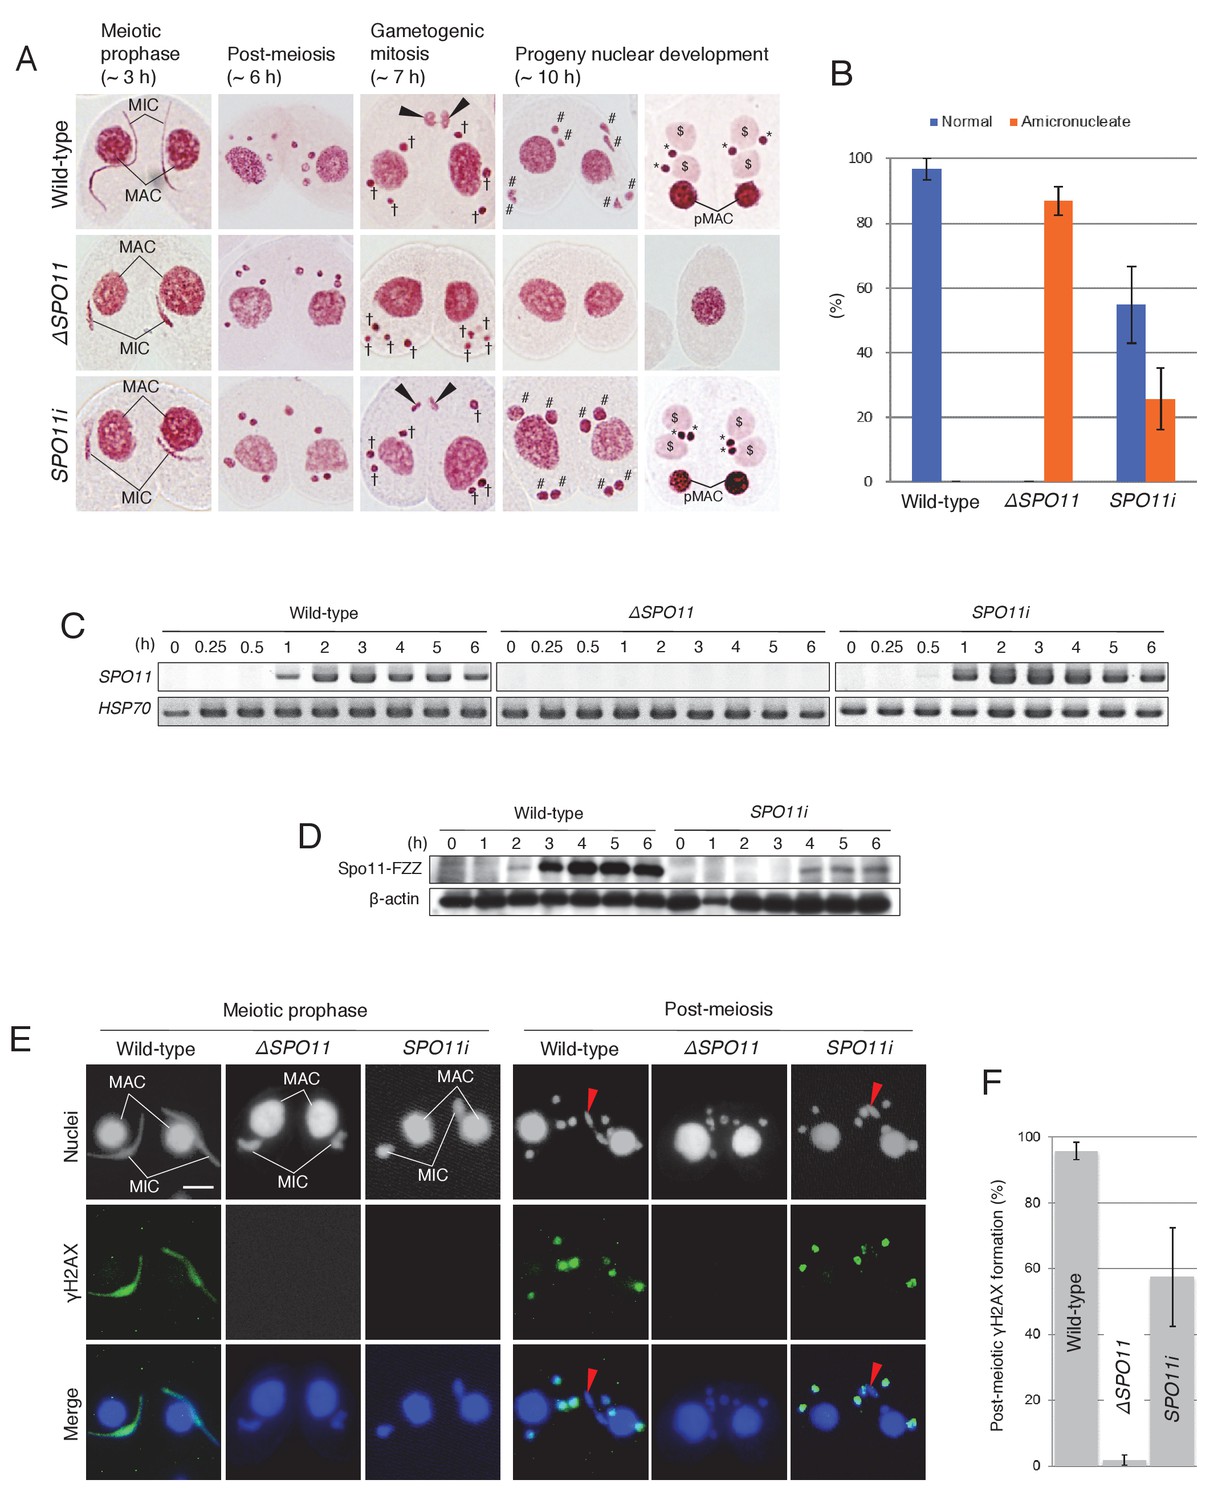
(A) Acetic orcein staining of wild-type (top), ΔSPO11 (middle), and SPO11i (bottom) crosses. Although ΔSPO11 crosses display the same post-meiotic phenotype as TOP2gi crosses (cells become amicronucleate and do not undergo gametogenesis; see Figure 4C), some SPO11i crosses behave in the same way as wild-type crosses by producing normal progeny nuclei via gametogenic mitosis (black arrowheads). MAC-macronucleus; MIC-micronucleus; †-unselected pronuclei; #-zygotic nuclei being differentiated; $-progeny macronuclear anlagen; *-progeny MICs; pMACs-degrading parental macronuclei. (B) Percentage of cells with progeny nuclei and amicronucleate cells at 10 hr. Columns and error bars represent means and standard deviations (p<0.01 as calculated by Tukey’s HSD test) of four measurements. See also Figure 6–sourse data 1 for data on wild-type, ΔSPO11, and SPO11i crosses. (C) RT-PCR quantitation of SPO11 transcription in wild-type, ΔSPO11, and SPO11i crosses. HSP70 was the loading control. Time (h) after mixing cells is indicated. (D) Western blotting of C-terminally FZZ-tagged Spo11 in wild-type and SPO11i crosses shows the impact of RNAi on SPO11-FZZ expression during the pre-zygotic period of mating. β-actin was the loading control. Time (h) after mixing cells is indicated. (E) SPO11 is involved in both meiotic and post-meiotic γH2AX formation. Although γH2AX foci are not seen at the meiotic or post-meiotic stages in ΔSPO11 crosses, post-meiotic γH2AX is formed normally in a subset of SPO11i crosses in which Spo11 is expressed at the post-meiotic stage (see Figure 5D). Red arrowheads indicate the selected pronuclei in gametogenic mitosis from which γH2AX has been lost. Scale bar denotes 10 μm. (F) Percentage of post-meiotic cells with γH2AX in the pronuclei. Columns and error bars represent means and standard deviations (p<0.01 as calculated by Tukey’s HSD test) of four measurements. See also Figure 6—source data 2 for data on wild-type, ΔSPO11, and SPO11i crosses.
-
Figure 6—source data 1
Normal development is significantly reduced in ΔSPO11 and SPO11i crosses.
- https://doi.org/10.7554/eLife.26176.013
-
Figure 6—source data 2
Post-meiotic γH2AX formation is significantly reduced in ΔSPO11 and SPO11i crosses.
- https://doi.org/10.7554/eLife.26176.014
Figure 7
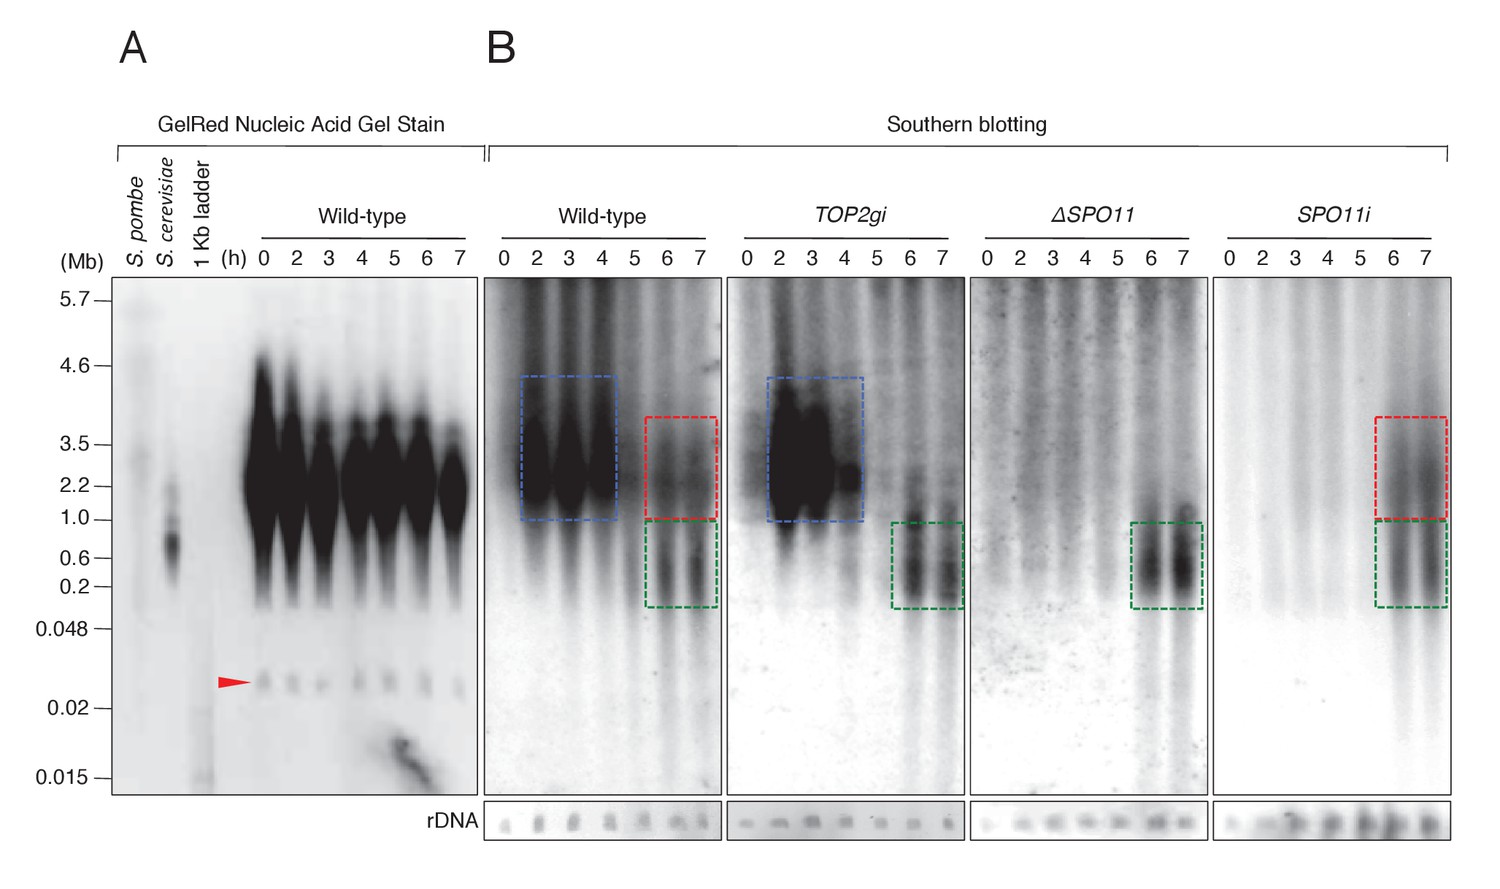
PFGE followed by Southern blotting provides direct evidence of post-meiotic DSBs.
(A) Example of a pulsed-field gel with stained DNA. The red triangle indicates rDNA, the loading control. (B) Southern blotting using the Tlr element as a germline-specific probe. Smear signals represent DSB-generated chromosome fragments in the meiotic MIC (blue squares) and pronuclei (red and green squares), whereas intact micronuclear chromosomes (25.0–35.0 Mb) did not enter the gel. Time (h) after mixing cells is indicated.
Figure 8 with 1 supplement
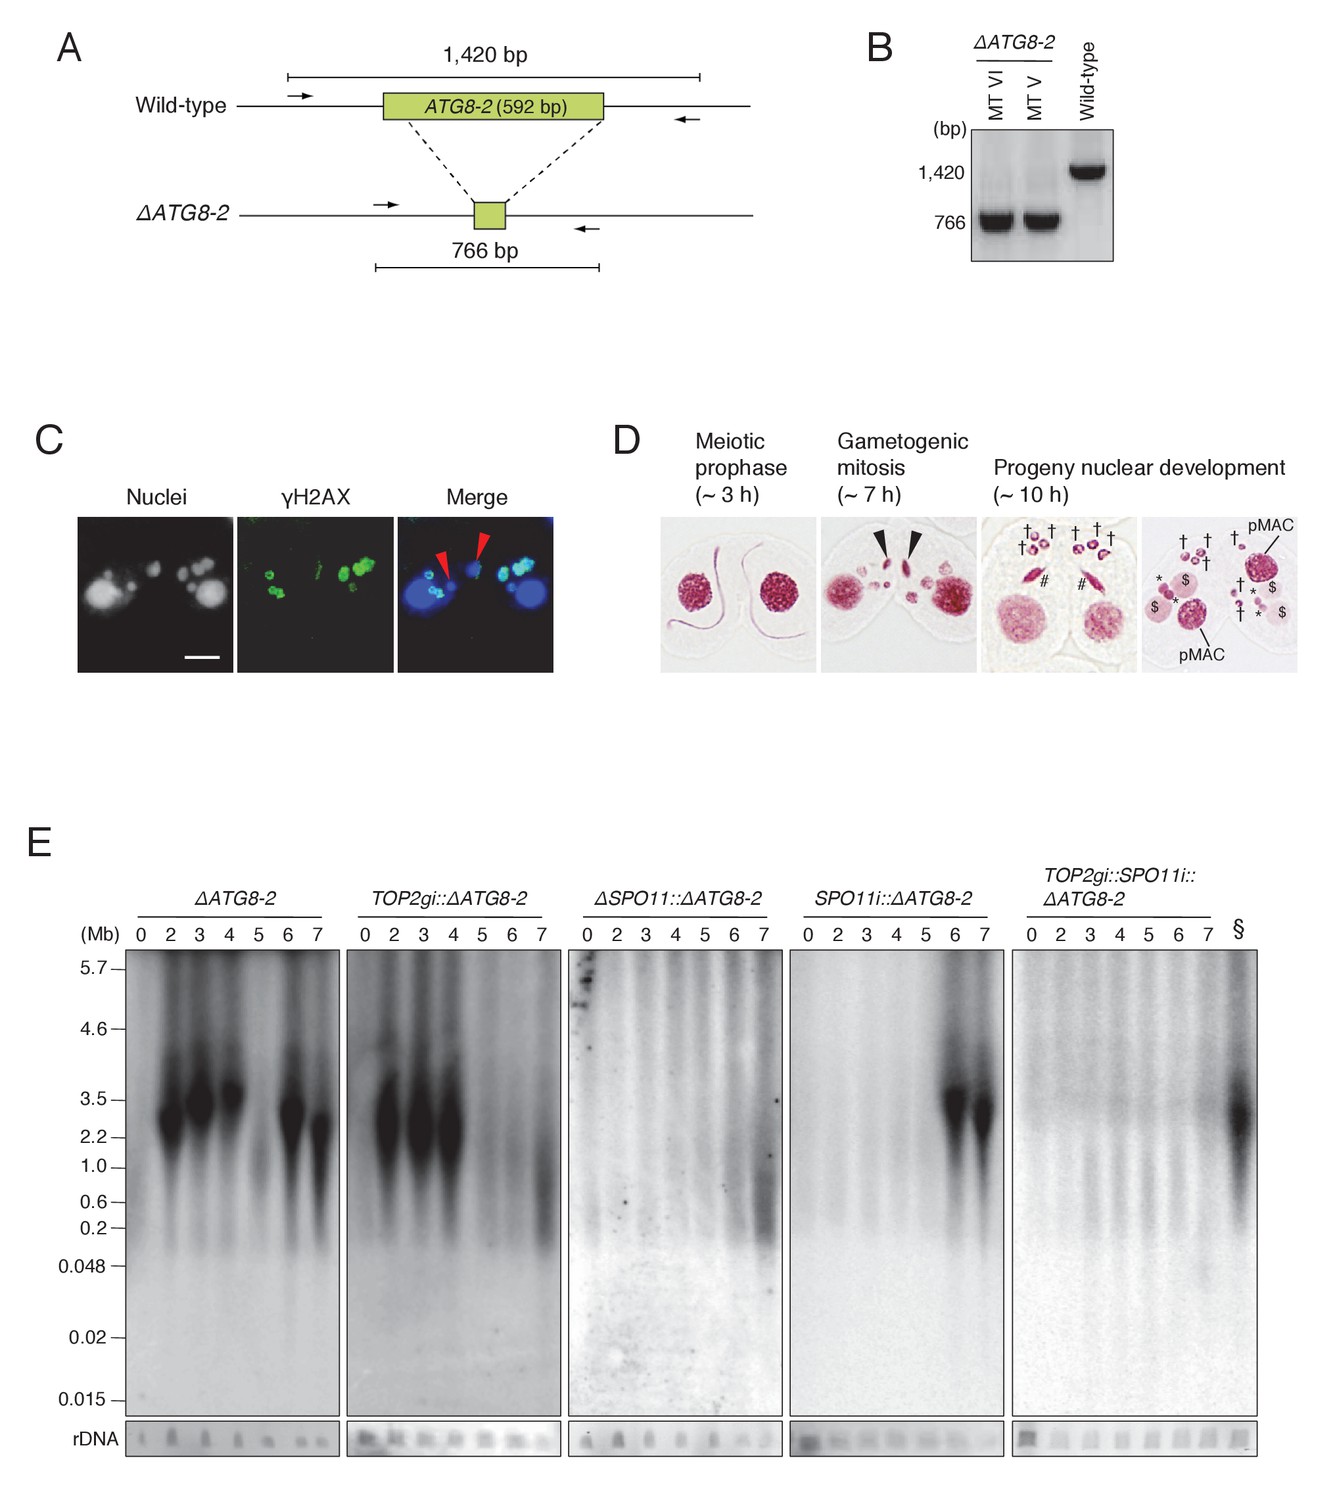
ATG8-2 gene knockout eliminates background DNA fragments resulting from autophagic degradation of unselected pronuclei.
(A) Schematic representation of ATG8-2 knockout strains by co-Deletion (as described in Hayashi and Mochizuki, 2015), confirmed by diagnostic PCR. The PCR primer set is indicated by arrows. (B) Only fragments from the deleted ATG8-2 genomic locus were amplified in ΔATG8-2 strains of two different mating types, while only fragments from the intact ATG8-2 genomic locus were amplified from the wild-type strain. (C) Post-meiotic γH2AX formation was not affected in the ΔATG8-2 crosses: gametogenic mitosis (red arrowheads) took place as in wild-type crosses (see Figure 2C/c/C′). Scale bar denotes 10 μm. (D) Acetic orcein staining of the ΔATG8-2 crosses shows that unselected pronuclei (†) are retained beyond gametogenic mitosis (black arrowheads) owing to attenuated autophagy. #-differentiating zygotic nuclei; $-progeny macronuclear anlagen; *-progeny MICs; pMACs-degrading parental macronuclei. (E) Southern hybridization of ΔATG8-2, TOP2gi::ΔATG8-2, ΔSPO11::ΔATG8-2, SPO11i::ΔATG8-2, and TOP2gi::SPO11i::ΔATG8-2 strains. The SPO11i::ΔATG8-2 strain (in which both meiotic and autophagic DSBs are eliminated) retains only the signal resulting from PM-DSBs. rDNA was the loading control. Time (h) after mixing cells is indicated. § indicates a SPO11i::ΔATG8-2 7 hr sample as the as the positive control for the ΔATG8-2::TOP2gi::SPO11i blot. See also Figure 8—figure supplement 1.
Figure 8—figure supplement 1
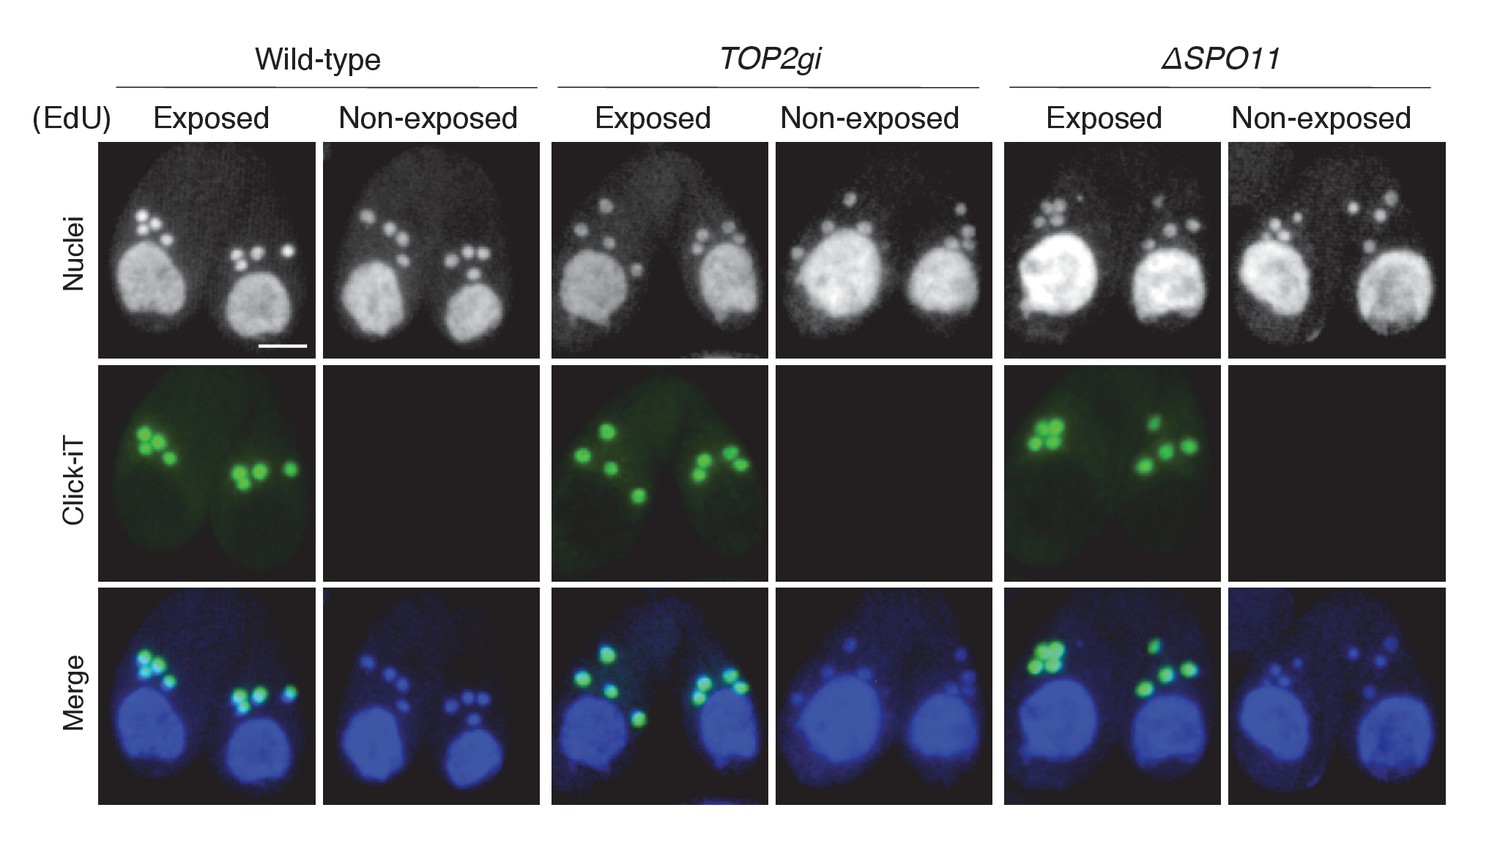
5-Ethynyl-2′-deoxyuridine (EdU) incorporation assay.
To visualize DNA synthesis immediately following meiotic anaphase II, mating cells at 5.5 hr after mixing were exposed to 20 μM EdU (Invitrogen, Carlsbad, CA) for 30 min, washed with 10 mM Tris (pH 7.4) to remove excess EdU, air dried on poly-l-lysine-coated glass slides, and soaked in 70% ethanol containing 15 mM glycine for 30 min at −20°C. After washing with PBS, slides were soaked in PBS containing 0.05% Tween-100 for 30 min at room temperature, washed again with PBS, and incubated with Click-iT reaction cocktail (Invitrogen) for 1 hr at 30°C in the dark. After a final washing step with PBS, cells were stained with DAPI and observed under fluorescence microcopy. Cells not exposed to EdU were negative controls. Scale bar denotes 10 μm.
Figure 9 with 1 supplement
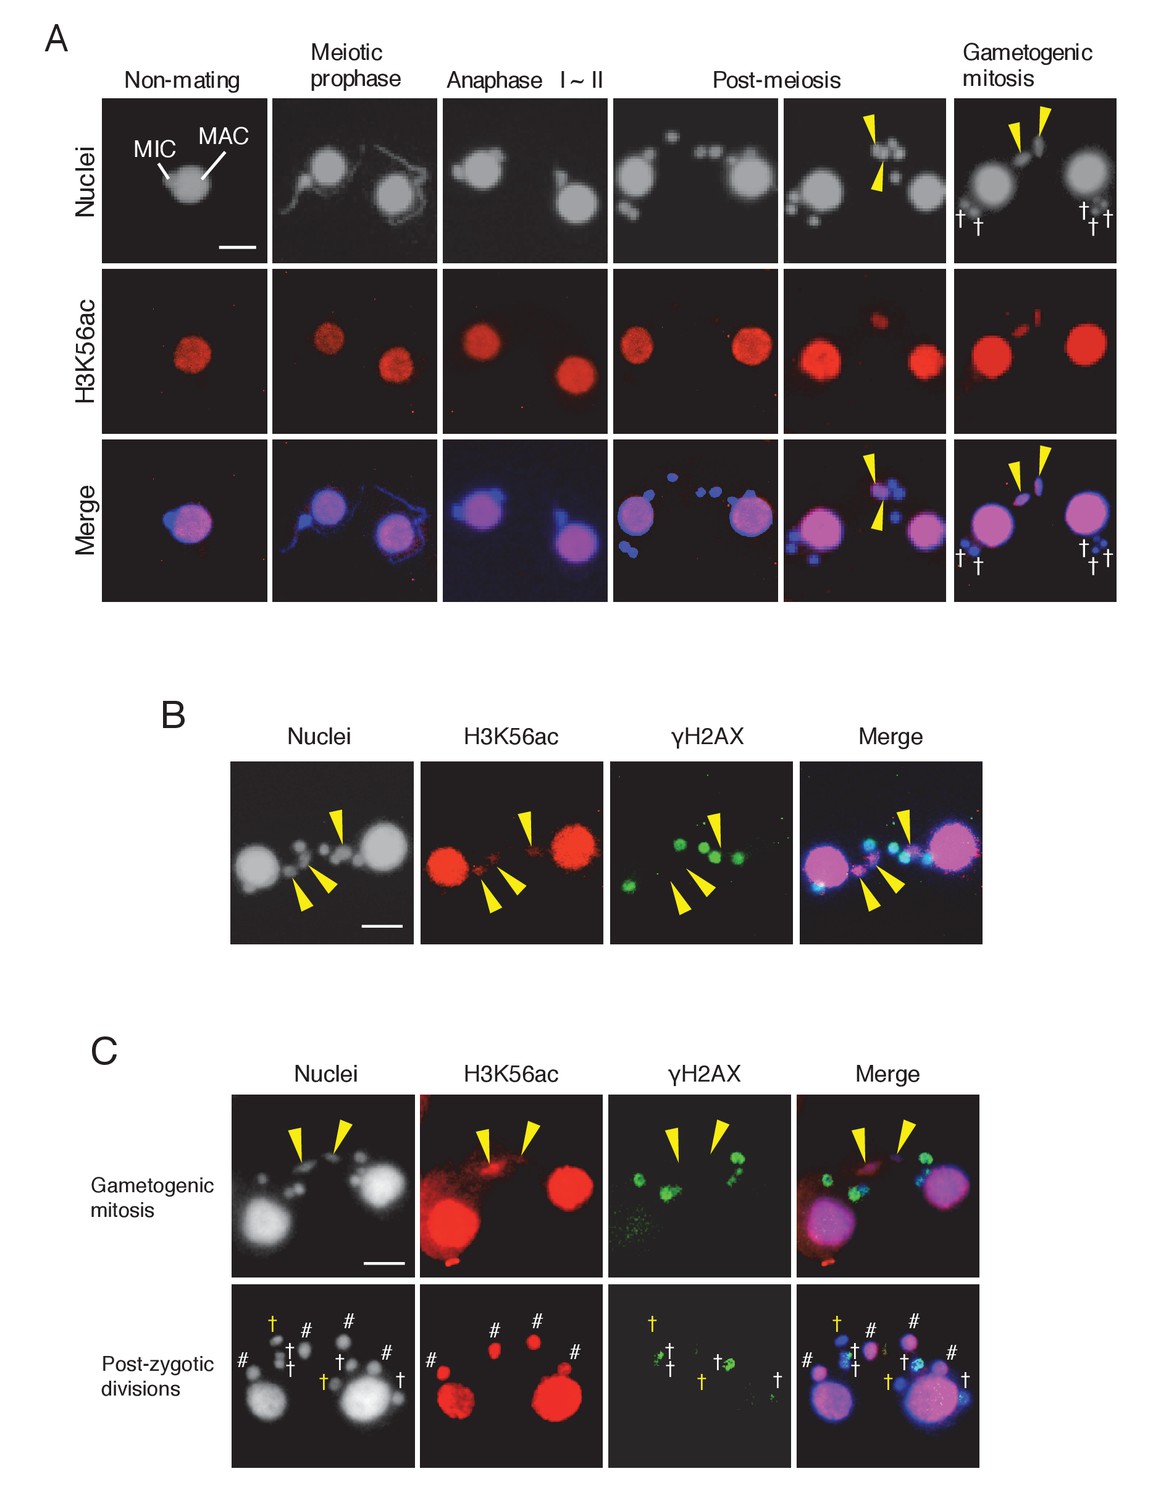
Histone H3 acetylation at lysine 56 (H3K56ac) is concomitant with H2AX dephosphorylation in the selected pronucleus.
(A) H3K56ac in the pre-zygotic period in the wild-type. The MAC was always H3K56ac positive, while the MIC only became H3K56ac positive as the pronucleus underwent gametogenic mitosis (yellow arrowheads). MAC-macronucleus; MIC-micronucleus, †-unselected pronuclei. (B) H3K56ac formation and H2AX dephosphorylation are coincident at the post-meiotic stage. The selected pronuclei undergoing gametogenic mitosis (yellow arrowheads) are H3K56ac-positive but γH2AX-negative. (C) H3K56 acetylation does not occur in persisting unselected nuclei in the ΔATG8-2 mutant, whereas γH2AX is reduced in some of the persistent unselected pronuclei (yellow †) in the post-zygotic period. In the selected pronucleus, H3K56ac formation and H2AX dephosphorylation are normal (yellow arrowheads). White †-unselected pronuclei with persistent γH2AX; #-differentiating zygotic nuclei. Scale bars denote 10 μm. See also Figure 9—figure supplement 1.
Figure 9—figure supplement 1
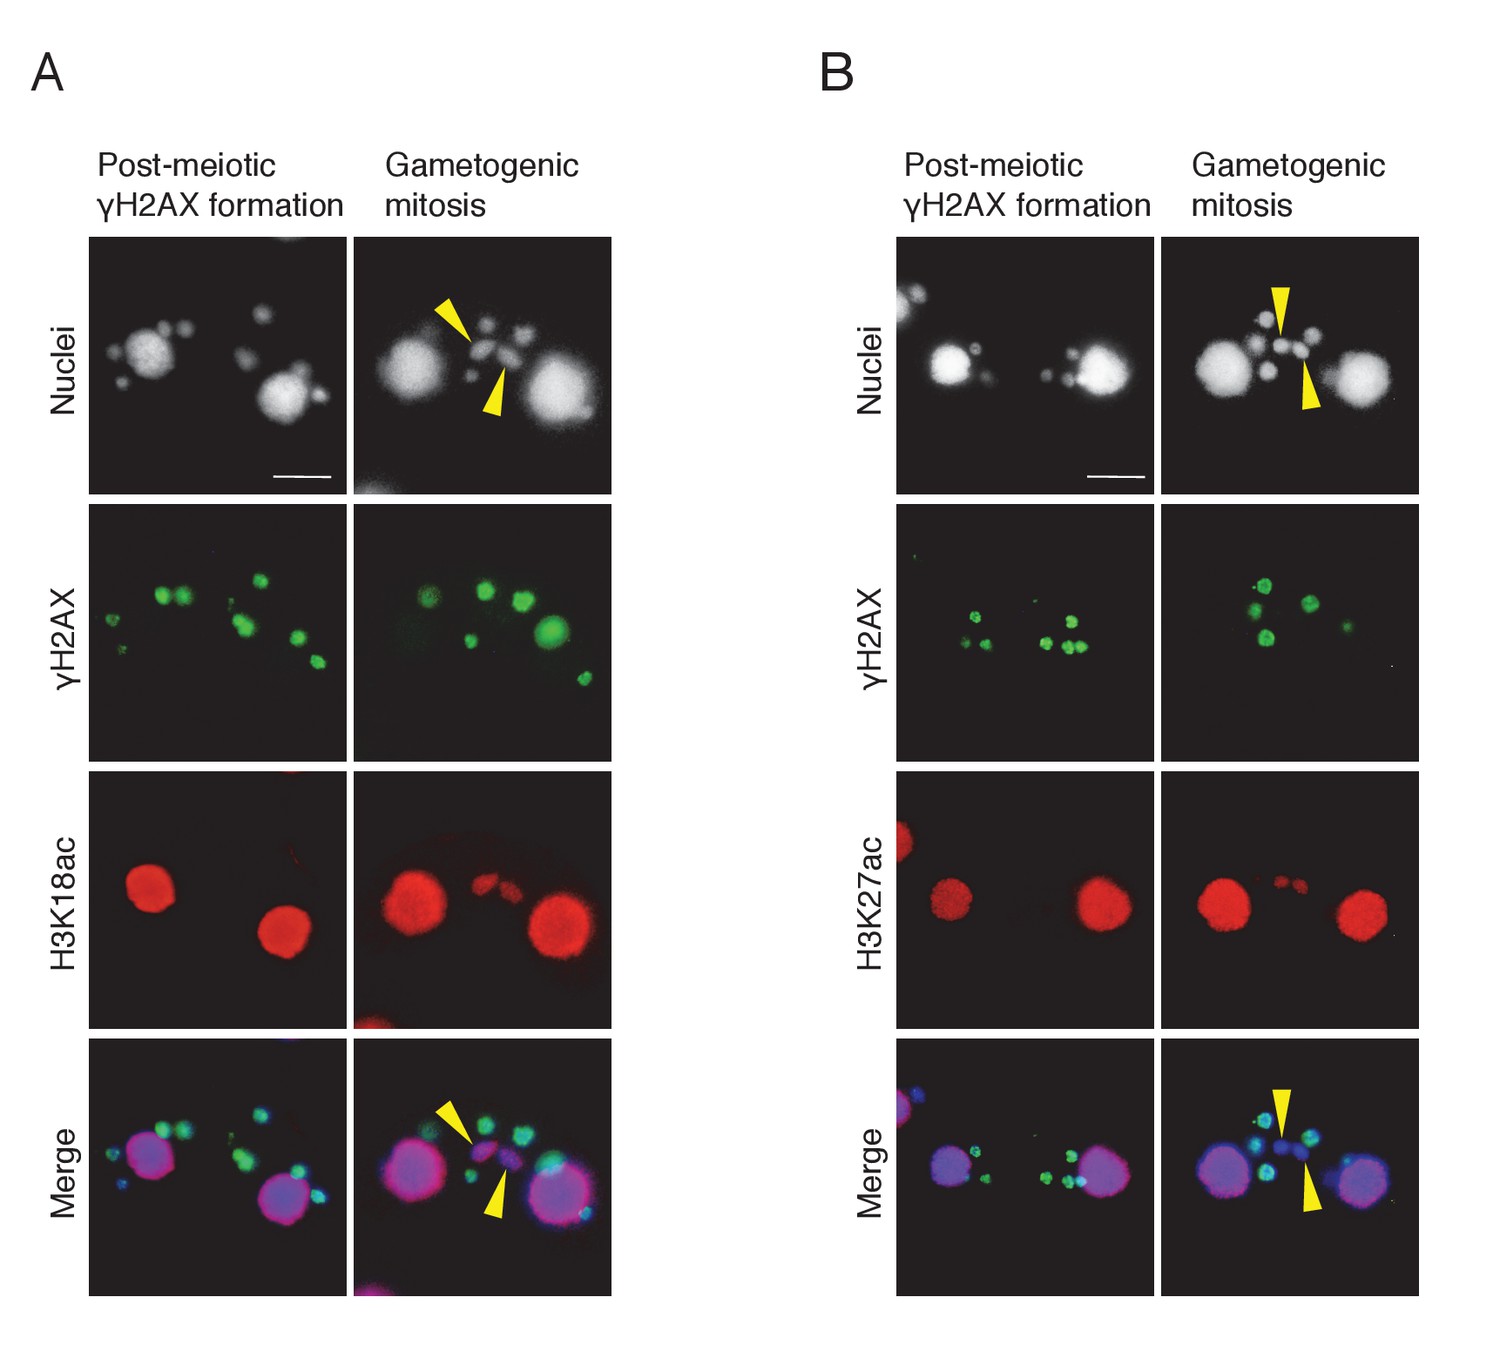
Histone H3 acetylation at sites other than H3K56 is coincident with H2AX dephosphorylation in the selected pronucleus.
Double immunostaining of γH2AX with H3K18ac (A) and H3K27ac (B). Cells were fixed and membrane-permeabilized as described in Materials and methods. Cells were spread onto slides coated with poly-l-lysine and air dried. After rehydration in PBS, cells were incubated with primary antibody for 2 hr at room temperature: anti-γH2AX antibody (1:500; mouse monoclonal; BioLegend), anti-H3K18ac (1:2000; rabbit polyclonal; Active Motif), or anti-H3K27ac (1:2000; rabbit polyclonal; Active Motif). After washing with PBS, cells were incubated with FITC-labeled goat anti-mouse (1:500) or Rhodamine-labeled goat anti-rabbit (1:2000; Merck Millipore) secondary antibody for 1 hr at room temperature in the dark. After washing with PBS, cells were stained with 1 μg/μl DAPI and observed under fluorescence microcopy. Yellow arrowheads indicate the selected pronuclei undergoing gametogenic mitosis. Scale bars denote 10 μm.
Figure 10
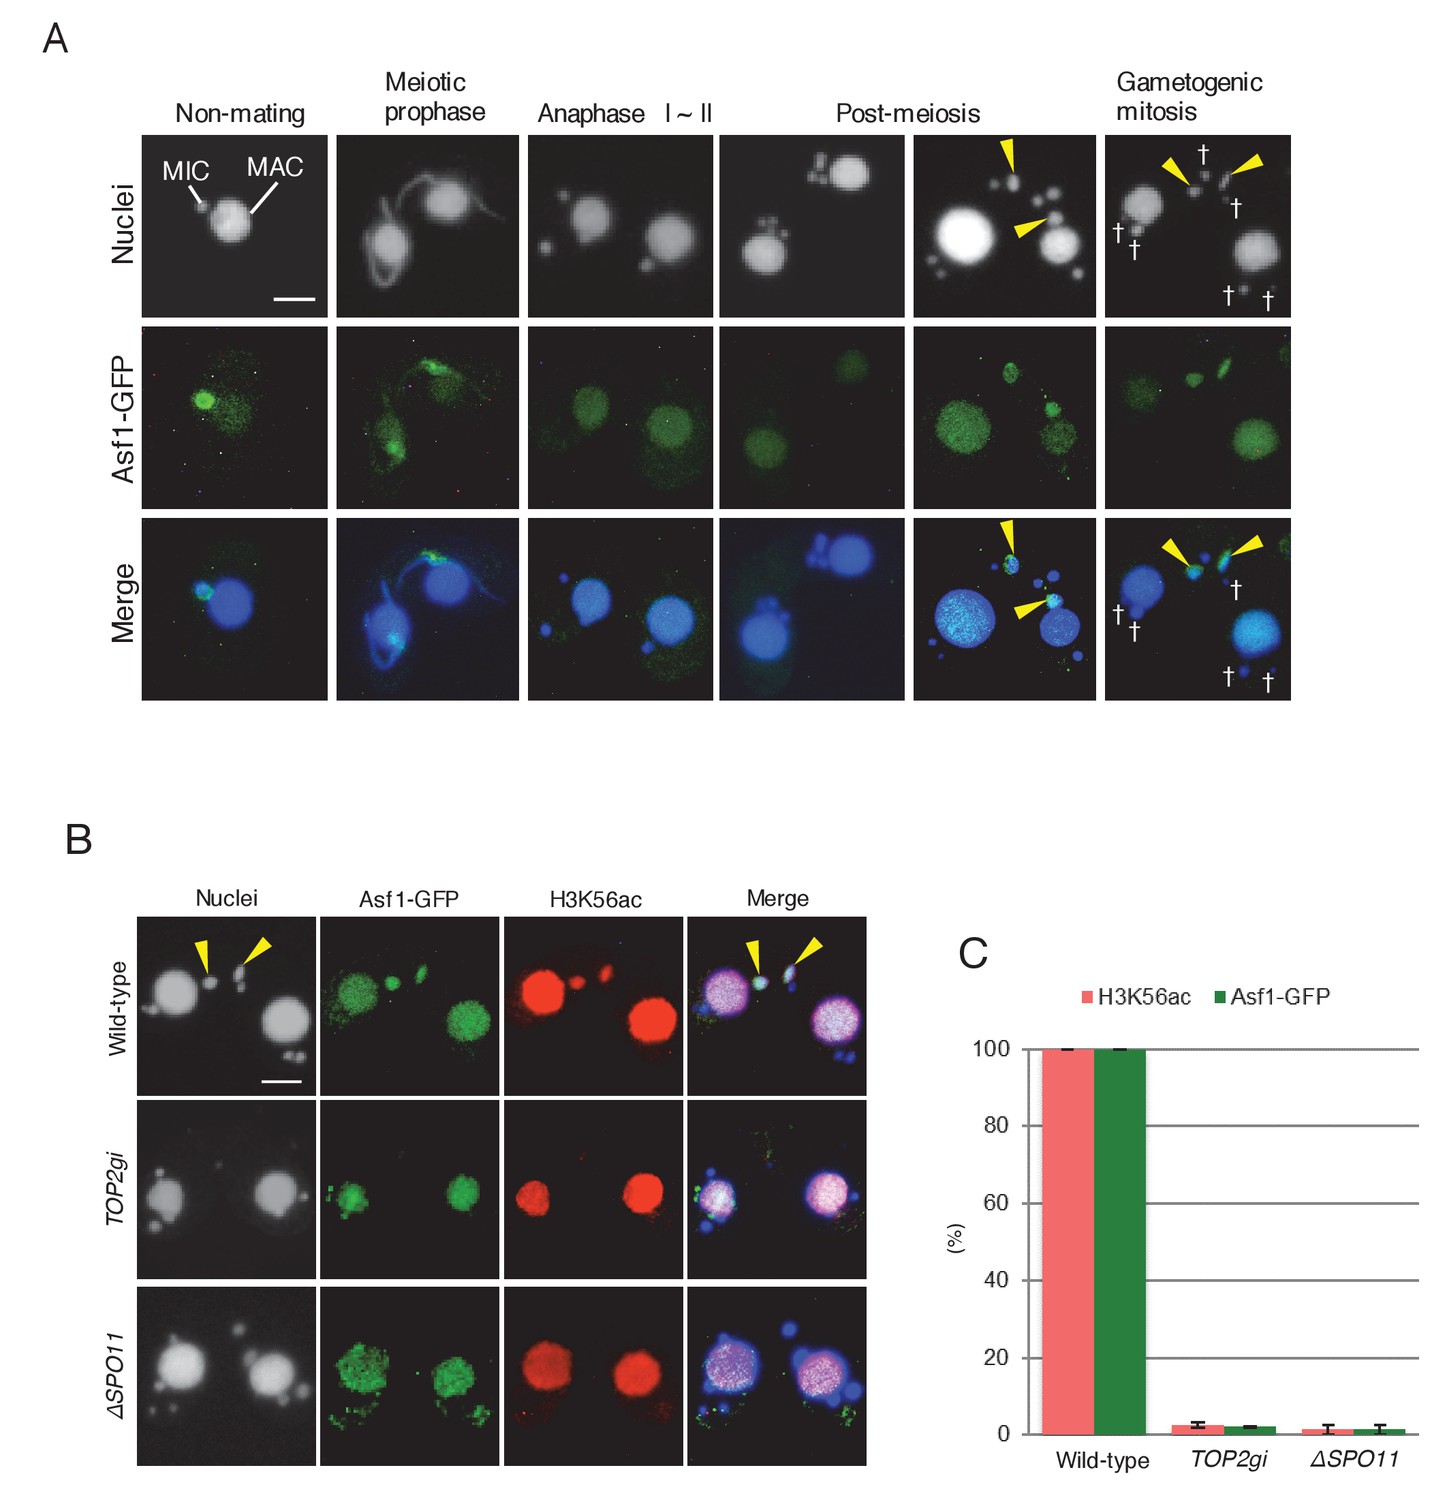
Histone chaperone Asf1 is specifically expressed in the selected pronucleus.
(A) Subcellular localization of C-terminally GFP-tagged Asf1 in the pre-zygotic mating stage in wild-type cells. Asf1 disappears from the MIC after meiotic prophase and reappears in the selected pronuclei undergoing gametogenic mitosis (yellow arrowheads). MAC-macronucleus; MIC-micronucleus; †-unselected pronuclei. (B) Asf1 and H3K56ac co-expression in the selected pronuclei is PM-DSB dependent. In wild-type crosses (top), selected pronuclei undergoing gametogenic mitosis (yellow arrowheads) are positive for both ASF1-GFP and H3K56ac. In contrast, both signals are absent in the TOP2gi (middle) and ΔSPO11 crosses (bottom), which do not form PM-DSBs (see Figure 6B and Figure 7E). Scale bars denote 10 μm. (C) Percentage of post-meiotic cells with H3K56ac and Asf1-GFP in the selected pronucleus. Columns and error bars represent the means and standard deviations (p<0.01 as calculated by Tukey’s HSD test) of four measurements. See also Figure 10—source data 1 for wild-type, TOP2gi, and ΔSPO11 crosses.
-
Figure 10—source data 1
Appearance of H3K56ac and Asf1-GFP is significantly reduced in TOP2gi and ΔSPO11 crosses.
- https://doi.org/10.7554/eLife.26176.021
Figure 11
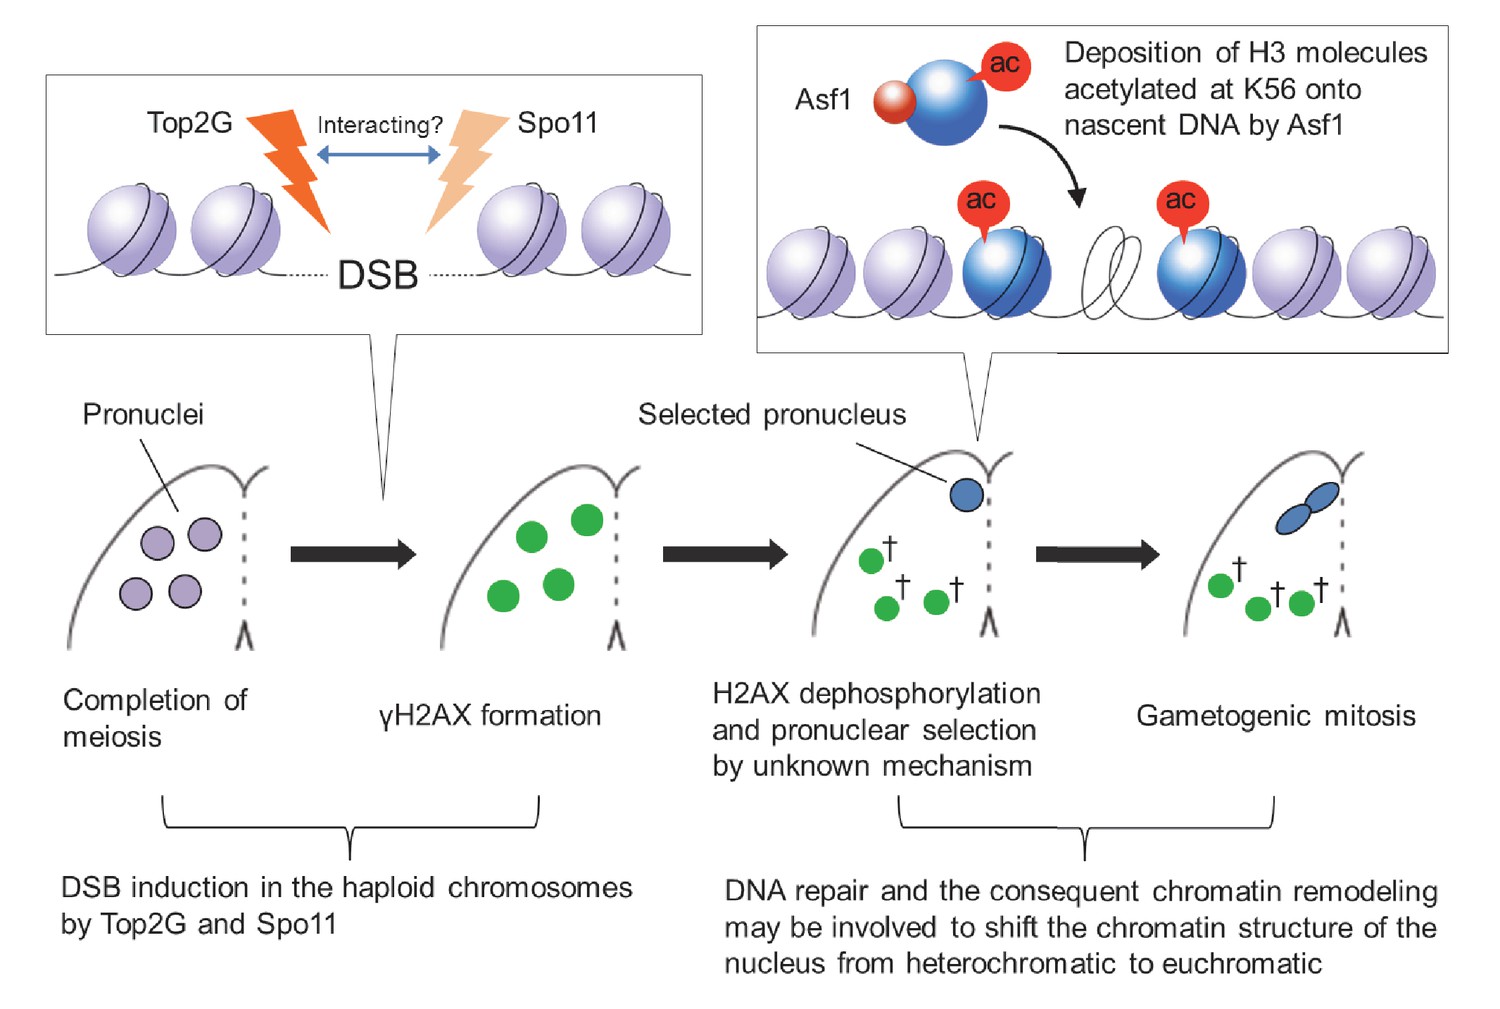
Model of post-meiotic events in Tetrahymena.
After completion of meiosis, PM-DSBs induced in pronuclei haploid chromosomes by Top2G and Spo11 trigger H2AX phosphorylation. H2AX dephosphorylation, probably indicating DNA repair, takes place together with the Asf1 localization and H3K56ac formation in the pronucleus that is selected for gametogenic mitosis via an unknown mechanism. In the selected pronucleus, the chromatin structure changes from heterochromatic to euchromatic prior to gametogenic mitosis. The unselected pronuclei (†) retaining γH2AX are eventually eliminated via autophagy.
Author response image 1

Co-Ip analysis of Top2G-GFP and Spo11-FZZ.
Mating Top2G-GFP and Spo11-FZZ expressing cells (107 cells) at meiotic prophase (3 h) and the post-meiotic stage (6 h) were collected by centrifugation following pretreatment with 0.5 mM PMSF (Roche Diagnostics, Indianapolis, IN) for 30 min at 30°C. Cells were resuspended in 1 ml homogenization buffer (150 mM NaCl, 1% Triton X-100 [Sigma-Aldrich], 2 mM PMSF, and Complete Protease Inhibitor Cocktail [Roche Diagnostics]), homogenized by gentle pipetting on ice, and clarified by centrifugation at 10,000 g for 15 min. The resulting lysate was incubated with 25 μl GFP-Trap magnetic agarose beads (ChromoTek, Planegg-Martinsried, Germany) or 1 μg anti-FLAG antibody bound to 25 μl Protein G magnetic agarose beads (GE Healthcare) for 1 h at 4°C. After three washes with homogenization buffer, the beads were incubated with 30 μl SDS sample buffer at 98°C for 2 min to elute bound proteins. Samples (15 μl) of eluted proteins were separated by SDS-PAGE. WCL: whole cell lysate, IP, immunoprecipitation fraction.
Download links
A two-part list of links to download the article, or parts of the article, in various formats.
Downloads (link to download the article as PDF)
Open citations (links to open the citations from this article in various online reference manager services)
Cite this article (links to download the citations from this article in formats compatible with various reference manager tools)
Post-meiotic DNA double-strand breaks occur in Tetrahymena, and require Topoisomerase II and Spo11
eLife 6:e26176.
https://doi.org/10.7554/eLife.26176


