Essential roles of Caspase-3 in facilitating Myc-induced genetic instability and carcinogenesis
- Duke University Medical Center, United States
Figures
Figure 1 with 7 supplements
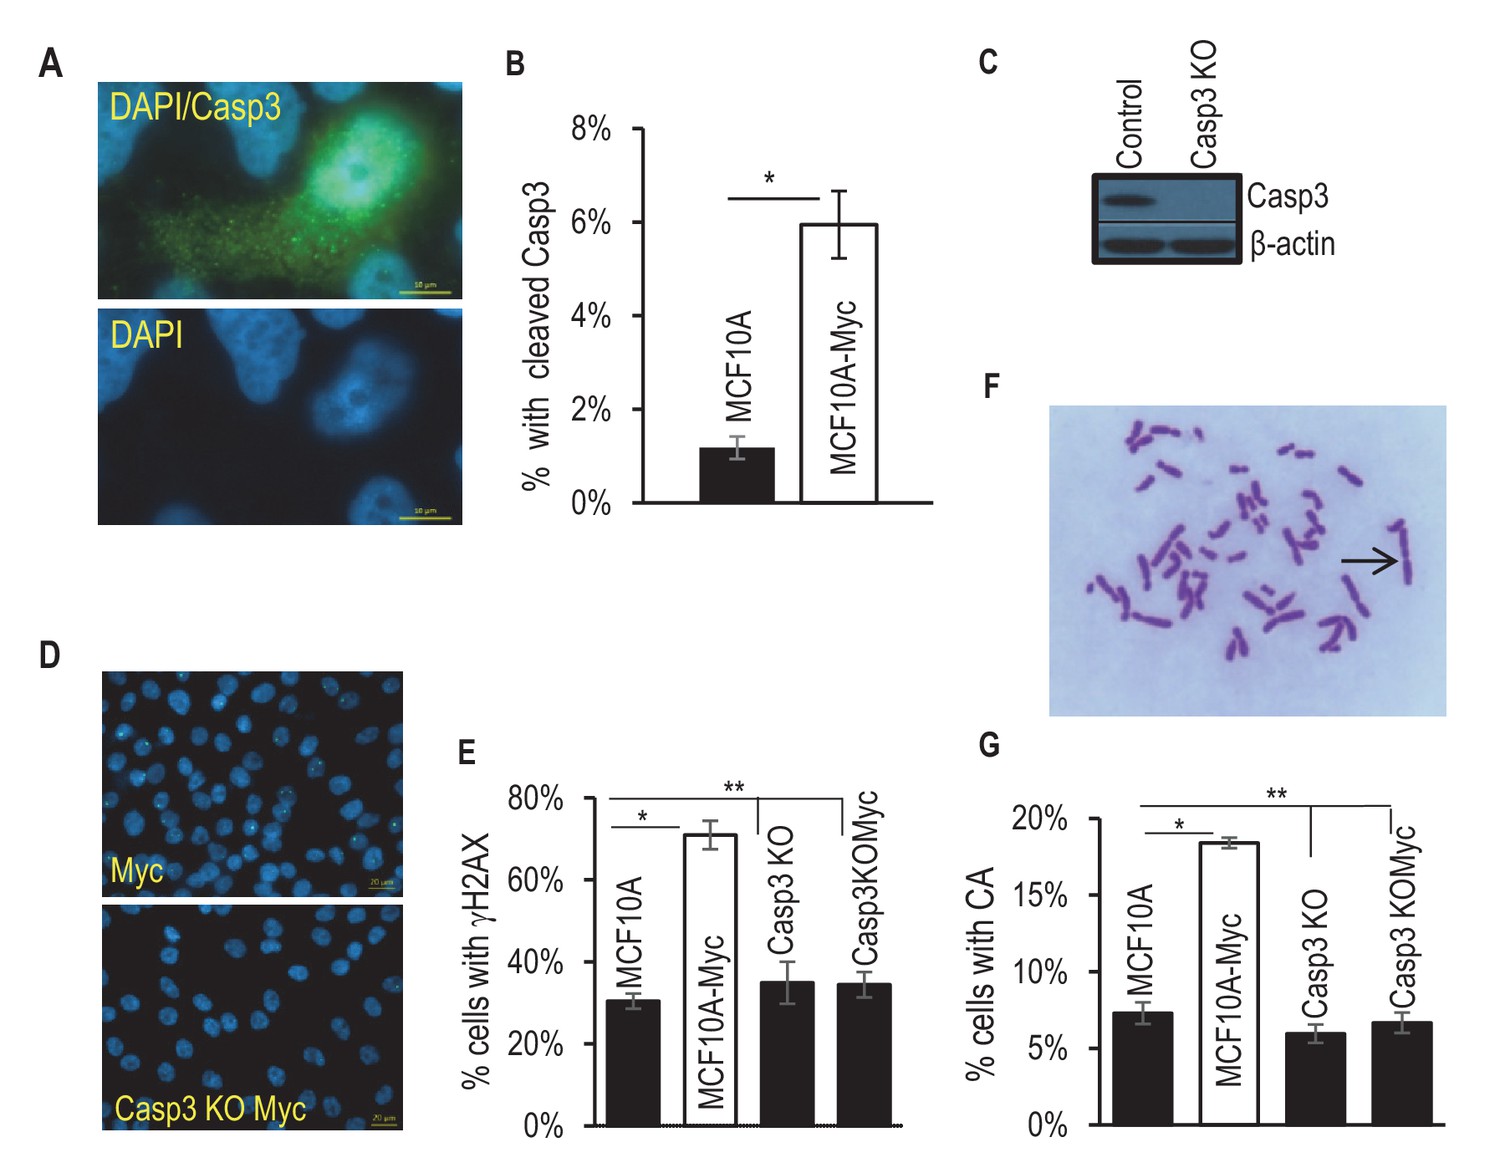
Requirement for Casp3 in Myc-induced genomic instability.
(A) Representative immunofluorescence staining of MCF10A cells with cleaved caspase 3 (green) and DAPI (blue). Scale bar represents 10 μm. (B) The proportion of nonapoptotic MCF10A cells presenting with normal nuclear morphology and cleaved caspase 3 signal. (C) Western blot analysis of Caspase-3 status in MCF10A cells with or without CASP3 gene knockout. (D) Representative immunofluorescence γH2AX foci (green) and DAPI staining in MCF10A cells with wild type (left panel) and CASP3KO. Scale bar represents 20 μm. (E) Fraction of cells which stained positive for a γH2AX foci in control and Casp3-deficient MCF10A with or without exogenous expression of Myc, n = 3. (F) A representative image of chromosome staining in MCF10A cells. A dicentric chromosome is indicated by an arrow. (G) Fraction of cells containing at least one chromosome aberration in control and Casp3-deficient MCF10A with or without exogenous expression of Myc. In B, E, and G, error bars represent standard error of the mean (SEM), * indicates a p value < 0.01, ** indicates a p value > 0.1, Student’s t-test, n = 3. For B, E, each data point was derived from the average of three triplicate groups of 150 cells each. In G, each data point was derived from the average of three triplicate groups of 50 cells each.
-
Figure 1—source data 1
Data for Figure 1B.
- https://doi.org/10.7554/eLife.26371.004
-
Figure 1—source data 2
Data for Figure 1E.
- https://doi.org/10.7554/eLife.26371.005
-
Figure 1—source data 3
Data for Figure 1G.
- https://doi.org/10.7554/eLife.26371.006
-
Figure 1—source data 4
Data for Figure 1—figure supplement 3A.
- https://doi.org/10.7554/eLife.26371.007
-
Figure 1—source data 5
Data for Figure 1—figure supplement 3B.
- https://doi.org/10.7554/eLife.26371.008
-
Figure 1—source data 6
Data for Figure 1—figure supplement 5.
- https://doi.org/10.7554/eLife.26371.009
-
Figure 1—source data 7
Data for Figure 1—figure supplement 6B.
- https://doi.org/10.7554/eLife.26371.010
-
Figure 1—source data 8
Data for Figure 1—figure supplement 6C.
- https://doi.org/10.7554/eLife.26371.011
-
Figure 1—source data 9
Data for Figure 1—figure supplement 7B.
- https://doi.org/10.7554/eLife.26371.012
-
Figure 1—source data 10
Data for Figure 1—figure supplement 7C.
- https://doi.org/10.7554/eLife.26371.013
Figure 1—figure supplement 1
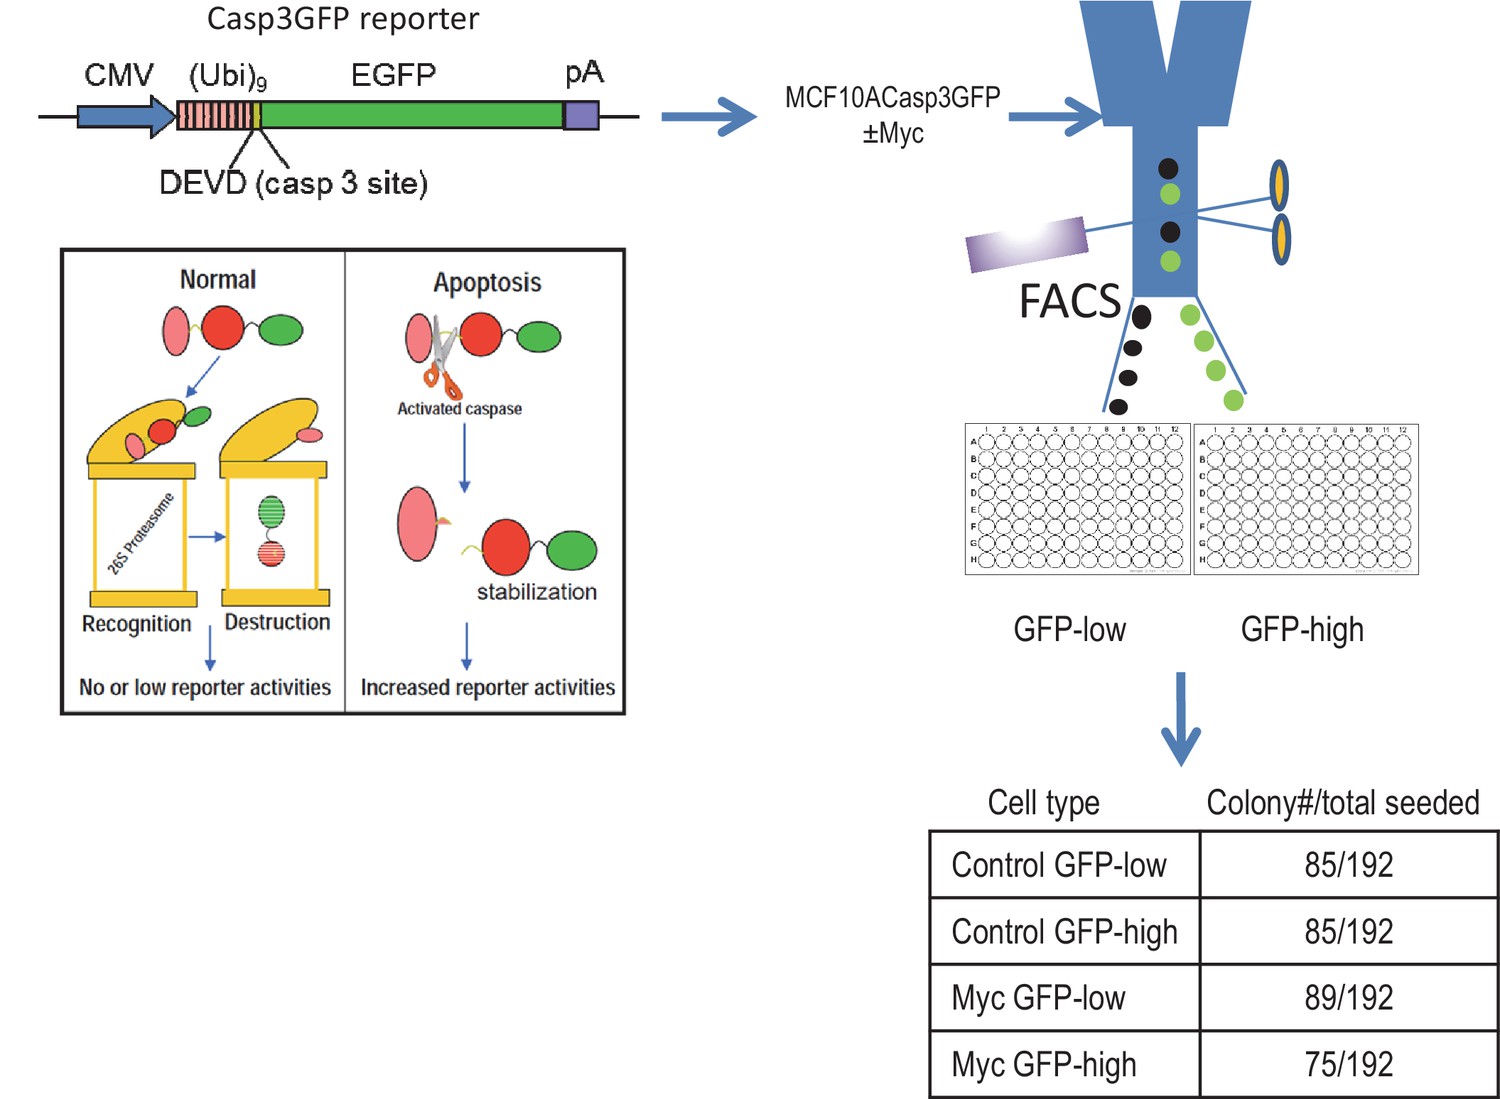
Clonogenic abilities of control and Myc-expressing MCF10A cells with high and low Casp3 reporter (Casp3GFP) activities after being individually sorted into 96-well plates by use of FAC based on their reporter activities.
https://doi.org/10.7554/eLife.26371.014
Figure 1—figure supplement 2
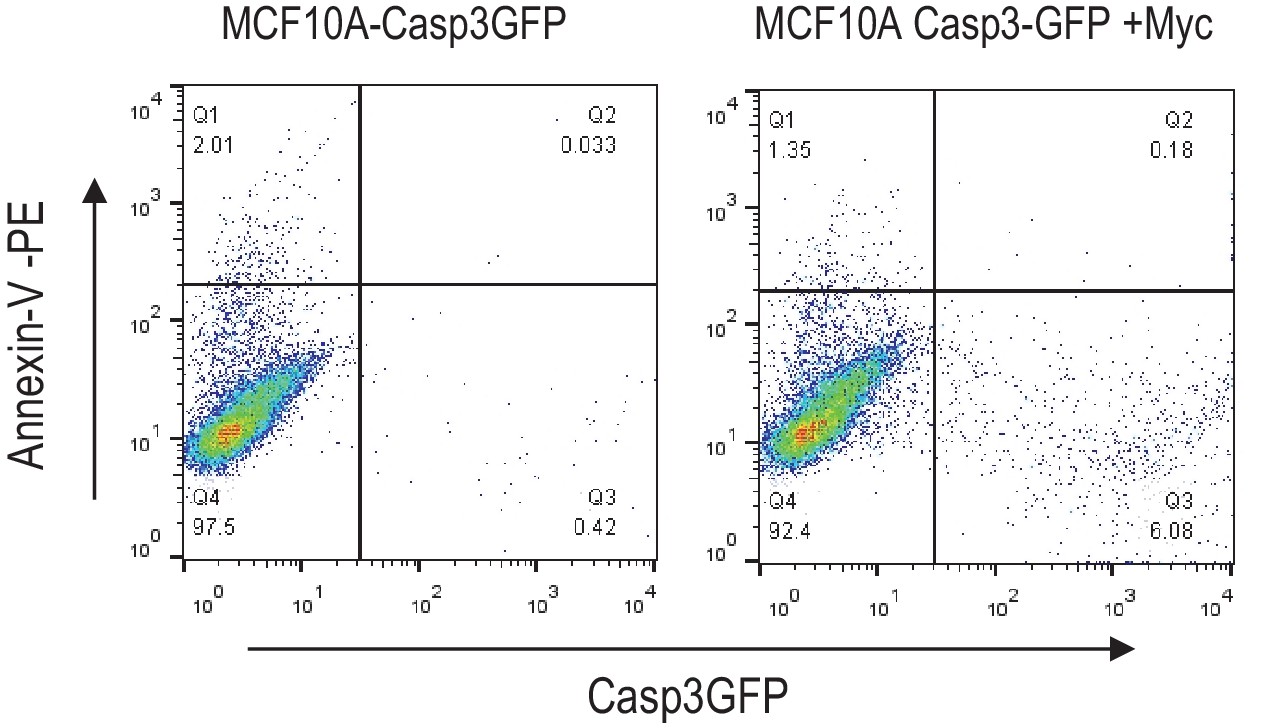
Flow cytometry analysis of annexin v-PE staining in Casp3-GFP transduced MCF10A cells with or without Myc expression.
There was not a significant increase in annexin V-high cells in Casp3-GFP high cells.
Figure 1—figure supplement 3
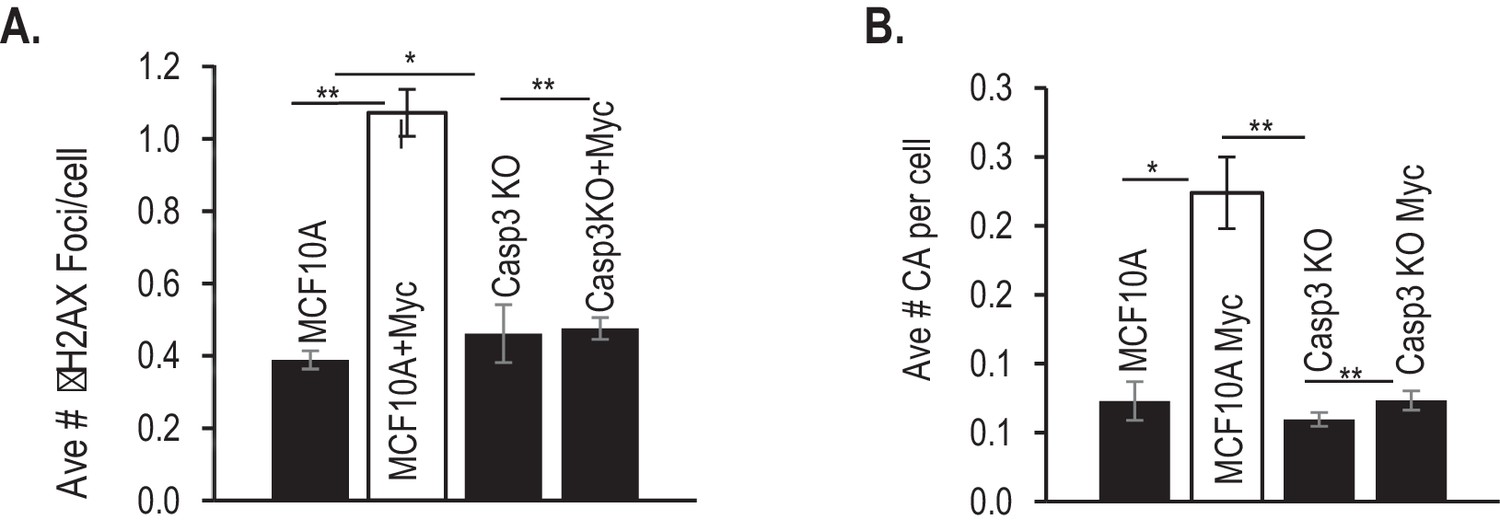
Additional data for the influence of Casp3 on Myc-induced genetic instability in MCF10A cells.
(A) Average number of γH2AX foci per cell in Myc-transduced MCF10A cells with or without CASP3 gene ablation. (B) Average number of chromosomal aberrations per cell in Myc-transduced MCF10A cells with or without CAPS3 gene ablation. Error bars represent standard error of the mean (SEM). *p>0.05; **p<0.05; Students t-test, n = 3. In A, each data point was derived from the average of three triplicate groups of 150 cells each. In B, each data point was derived from the average of three triplicate groups of 50 cells each.
Figure 1—figure supplement 4
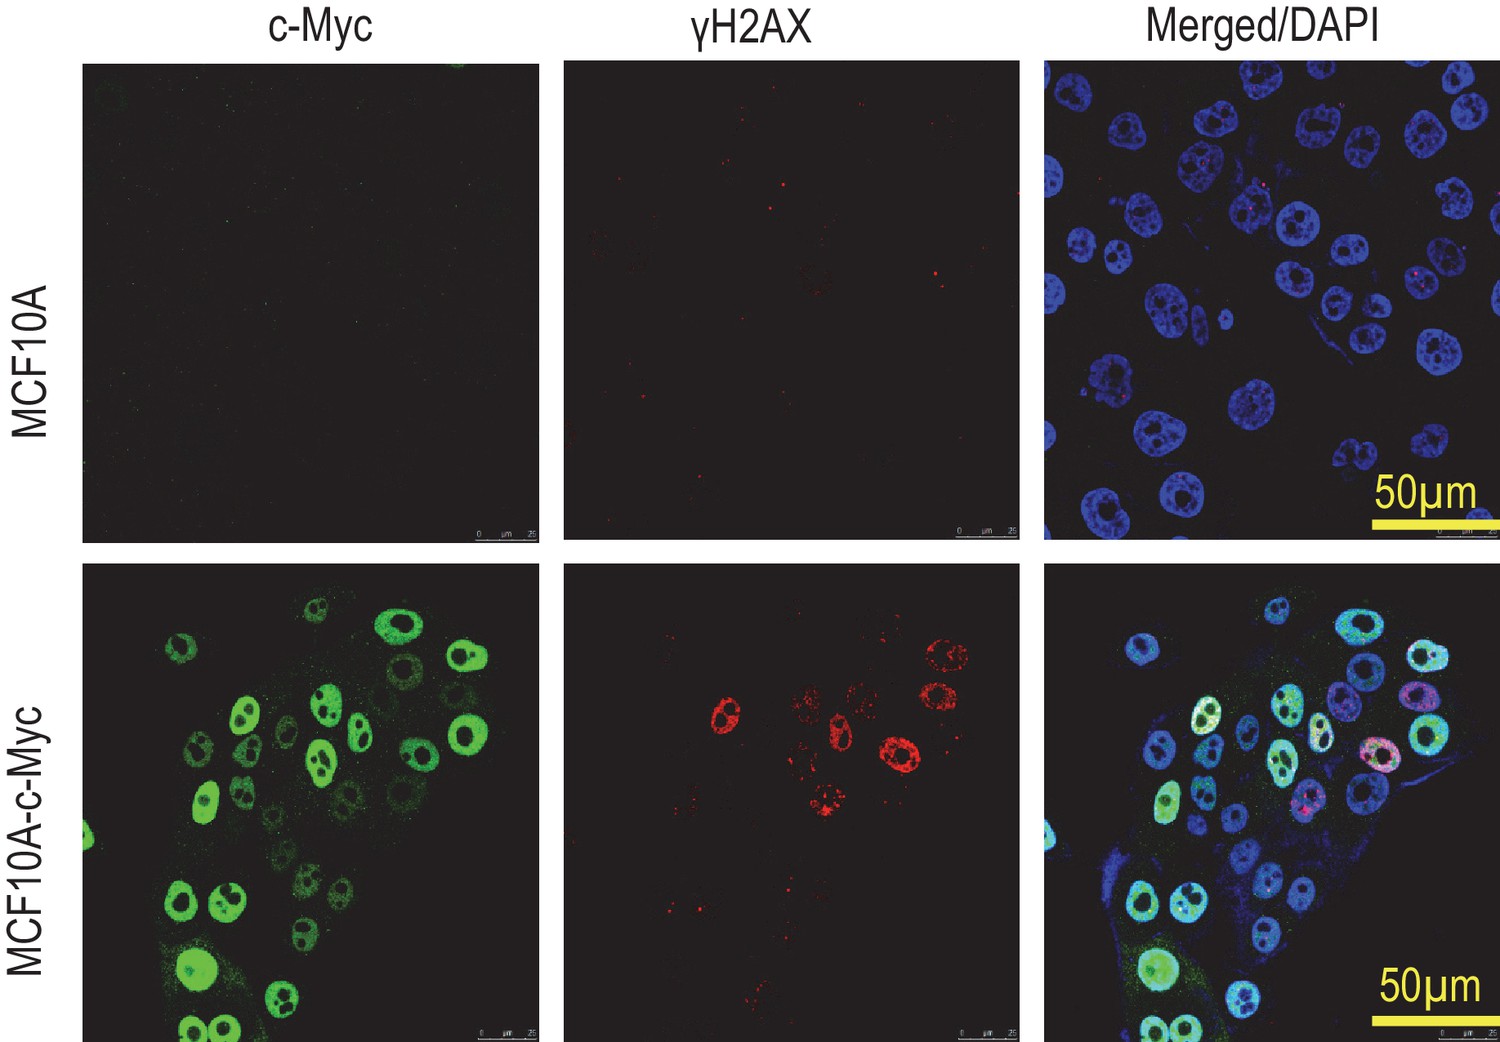
Immunofluorescence co-staining of vector control and Myc-transduced MCF10A cells.
Notice the heterogeneous nature of Myc expression.
Figure 1—figure supplement 5
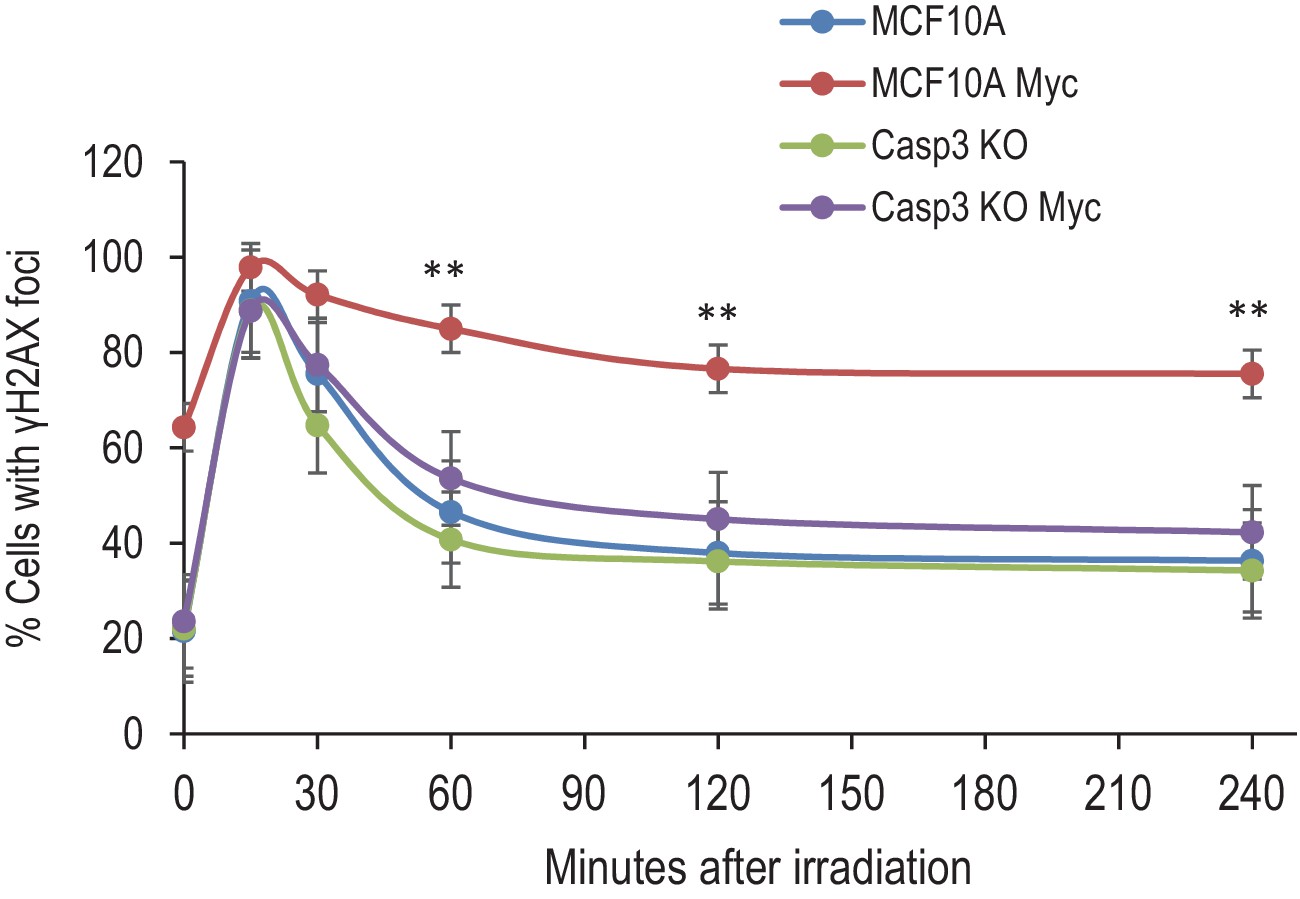
DNA double-strand repair kinetics in MCF10A cells with various genetic backgrounds.
Cells were synchronized and irradiated with 3Gys of X-rays. At different time points after radiation exposure, they were fixed and stained with fluorescence-labeled γH2AX antibody. The fraction of cells with γH2AX foci were then enumerated from fluorescence images. MCF10A Myc vs Casp3KO Myc, **p<0.001, n = 5, Student’s t-test.
Figure 1—figure supplement 6
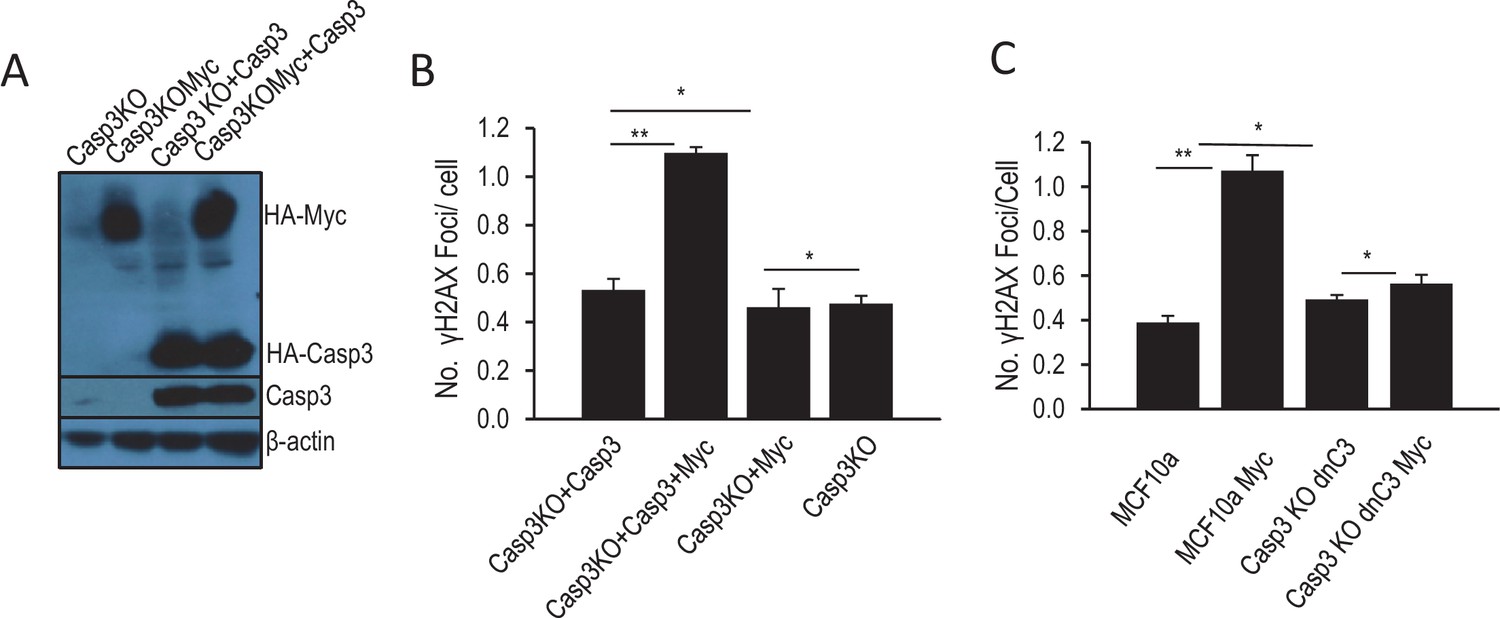
Additional data confirming the role of Casp3 in mediating Myc-induced genomic instability.
(A) Western blot confirmation of Myc over-expression and re-expression Casp3 in Casp3KO cells. (B) The effect of Casp3 re-expression on Myc-induced γH2AX foci in MCF10A-CASP3KO cells. (C) The effect of dominant-negative Casp3 (C163A mutation) on Myc-induced γH2AX foci in MCF10A-CASP3KO cells. Error bars represent standard error of the mean (SEM). *p>0.05; **p<0.05. In B and C, each data point was derived from the average of three triplicate groups of 150 cells each.
Figure 1—figure supplement 7

Role of Casp3 in Myc-induced genetic instability in BJ-1 human fibroblasts.
(A) Western blot showing CASP3 gene knockout in immortalized human BJ1 fibroblasts. (B) Quantitative estimate of Myc induced γH2AX foci in control and CASP3 knockout BJ1 fibroblasts. (C) Quantitative estimate of Myc-induced chromosomal aberrations in control and CAPS3 knockout BJ1 human fibroblast cells. In B, C, error bars represent SEM. *p>0.05, **p<0.001, Student’s t-test, n = 3. In B, each data point was derived from the average of three triplicate groups of 150 cells each. In C, each data point was derived from the average of three triplicate groups of 50 cells each.
Figure 2
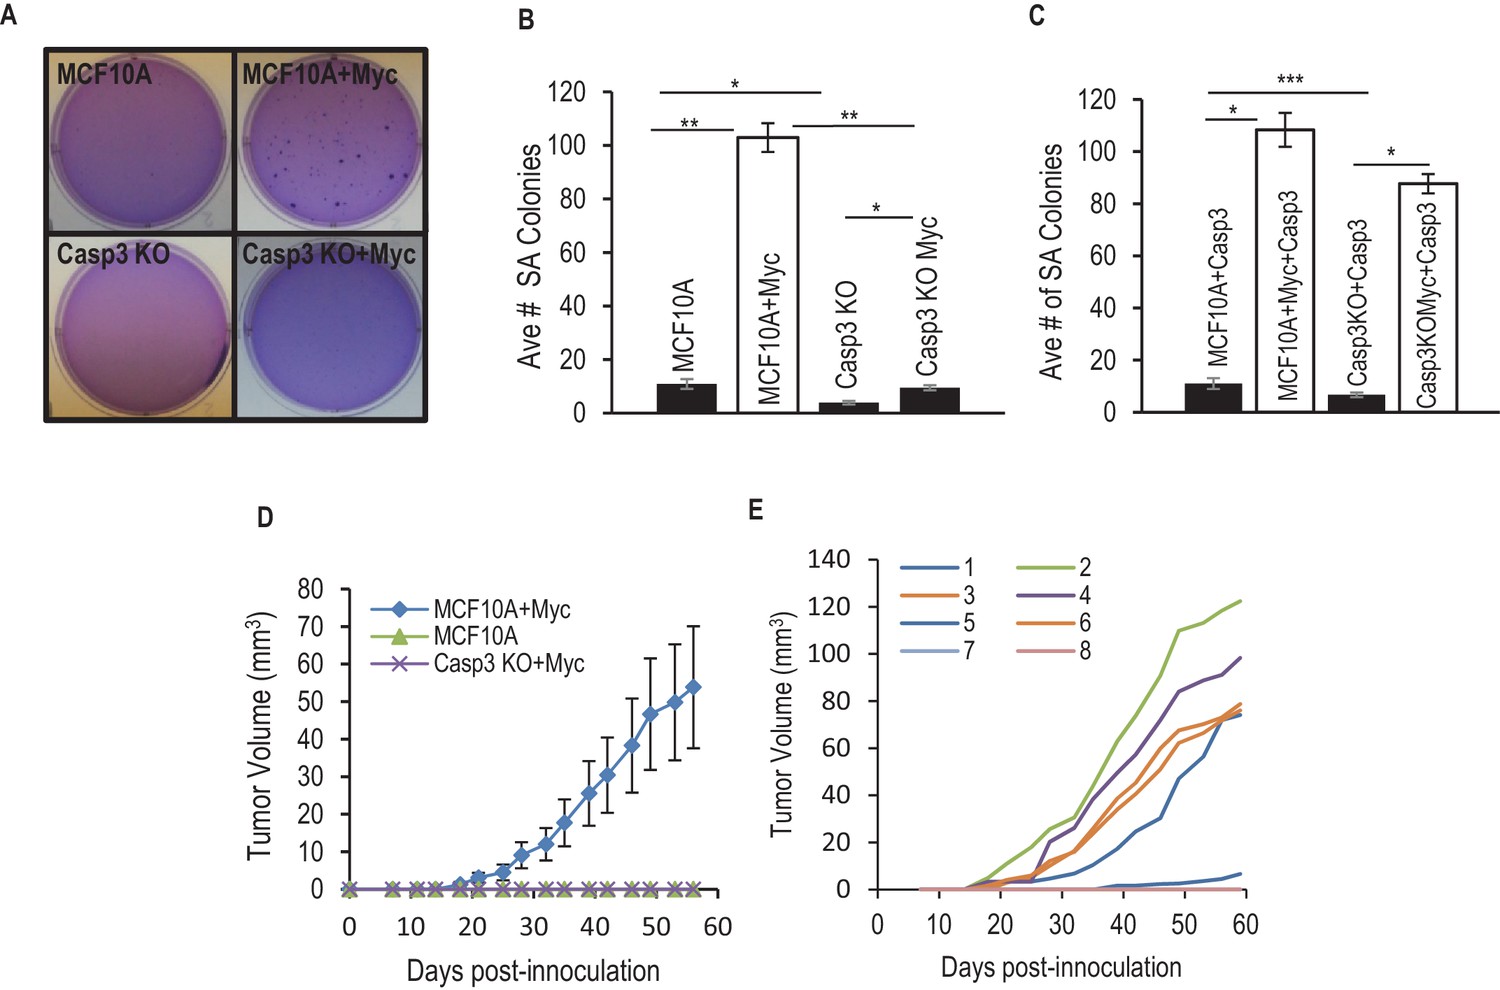
Requirement for Casp3 in Myc-induced transformation.
(A) Depicts colonies which grew in soft agar. (B) Average number of colonies in soft agar in control and Casp3-deficient cells with or without Myc expression. (C) Average number of colonies in soft agar in wild type and Casp3 knockout MCF10A cells with Casp3 re-expression in the absence or presence of Myc over-expression. (D) Tumor growth from control, Myc-overexpressing, and Casp3KO cells with Myc over-expressiong in nude mice. (E) Individual tumor sizes in nude mice form wild-type cells with Myc over-expression. The error bars in B, D, and E represent standard error of the mean (SEM). * Indicates p value < 0.001, ** indicates p value << 1e−5, *** indicates a p value > 0.1. Student’s t-test was used to calculate the p-values in B and C. N = 3 for B and C. N = 5 for D.
-
Figure 2—source data 1
Data for Figure 2B.
- https://doi.org/10.7554/eLife.26371.025
-
Figure 2—source data 2
Data for Figure 2C.
- https://doi.org/10.7554/eLife.26371.026
-
Figure 2—source data 3
Data for Figure 2D&E.
- https://doi.org/10.7554/eLife.26371.027
Figure 3 with 4 supplements
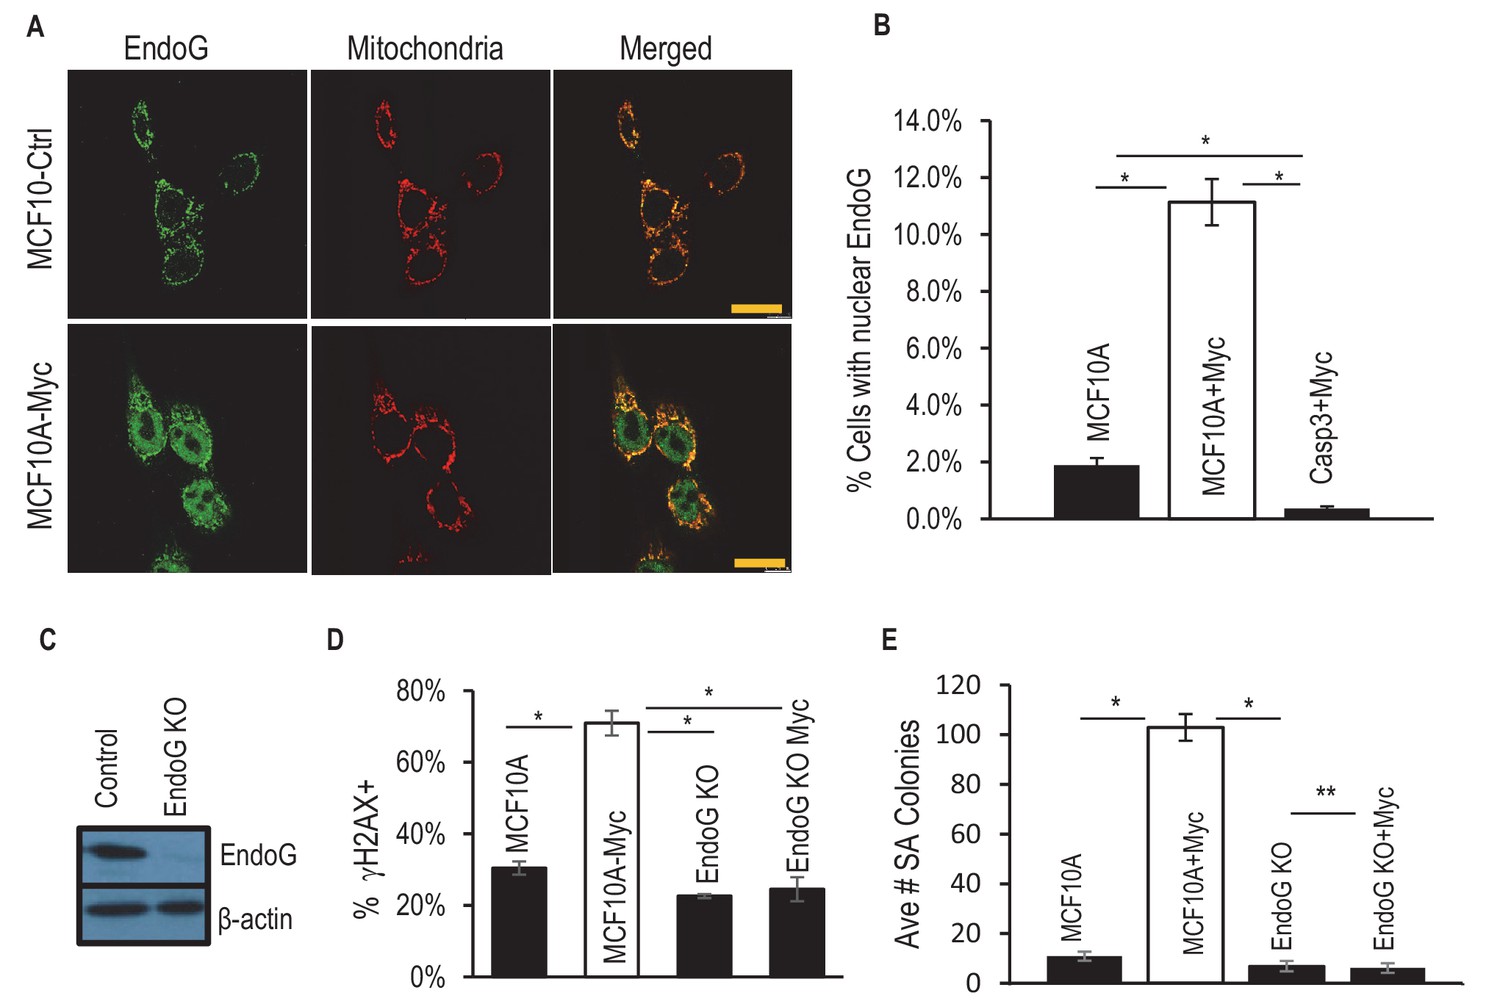
Requirement of EndoG in Myc-induced genomic instability and transformation.
(A) Immunofluorescence staining of of MCF10A with antibodies to EndoG (green), mitochondria (Orange) and DAPI (blue). Scale bar represents 20 μm. (B) Fraction of MCF10A cells with activated EndoG (EndoG signal within the nucleus). Error bar indicates SEM. (C) Western blot analysis fo EndoG expression in wild type or endoG knockout MCF10A cells. (D) Fraction of cells which stained positive for a γH2AX foci in control and EndoG-deficient MCF10A with or without exogenous expression of Myc. (E) Influence of endoG status on Myc-induced transformation of MCF10A cells, as indicted by soft agar (SA) colony formation. * Indicates p value < 0.001, **p>0.05. Student’s t-test in B, D, E. Error bars represent SEM. In B, D, each data point was derived from the average of three triplicate groups of 150 cells each. In E, n = 3.
-
Figure 3—source data 1
Data for Figure 3B.
- https://doi.org/10.7554/eLife.26371.029
-
Figure 3—source data 2
Data for Figure 3D.
- https://doi.org/10.7554/eLife.26371.030
-
Figure 3—source data 3
Data for Figure 3E.
- https://doi.org/10.7554/eLife.26371.031
-
Figure 3—source data 4
Data for Figure 3—figure supplement 1.
- https://doi.org/10.7554/eLife.26371.032
-
Figure 3—source data 5
Data for Figure 3—figure supplement 4.
- https://doi.org/10.7554/eLife.26371.033
Figure 3—figure supplement 1
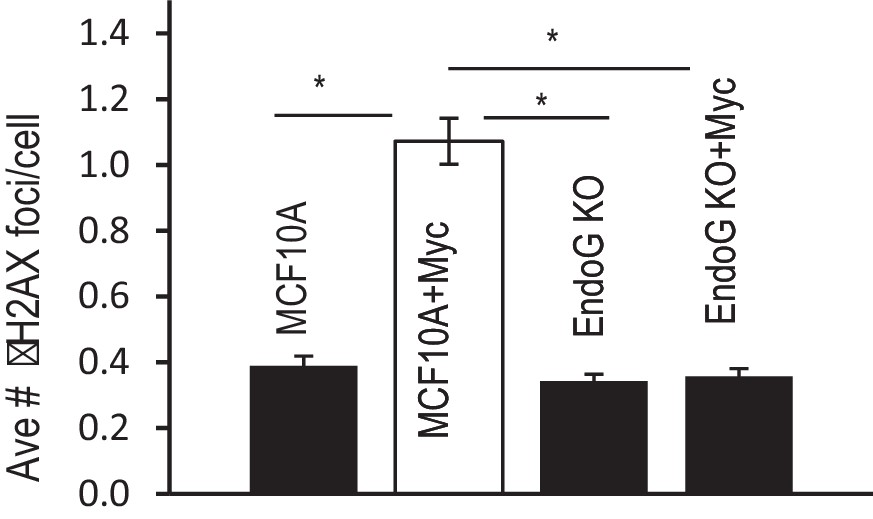
Additional data showing the average number of γH2AX foci per cell in control and EndoG deficient MCF10A cells with or without exogenous expression of Myc.
Error bar indicates SEM. * indicates p<0.01, Student’s t-test, n = 3. Each data point was derived from the average of three triplicate groups of 150 cells each.
Figure 3—figure supplement 2

Flow cytometry analysis of various MCF10A cells for PI and annexin V staining to quantitate the fraction of cell undergoing early (lower right quadrants), late (top right quadrants) apoptosis, and necrosis (top left quadrants).
https://doi.org/10.7554/eLife.26371.035
Figure 3—figure supplement 3
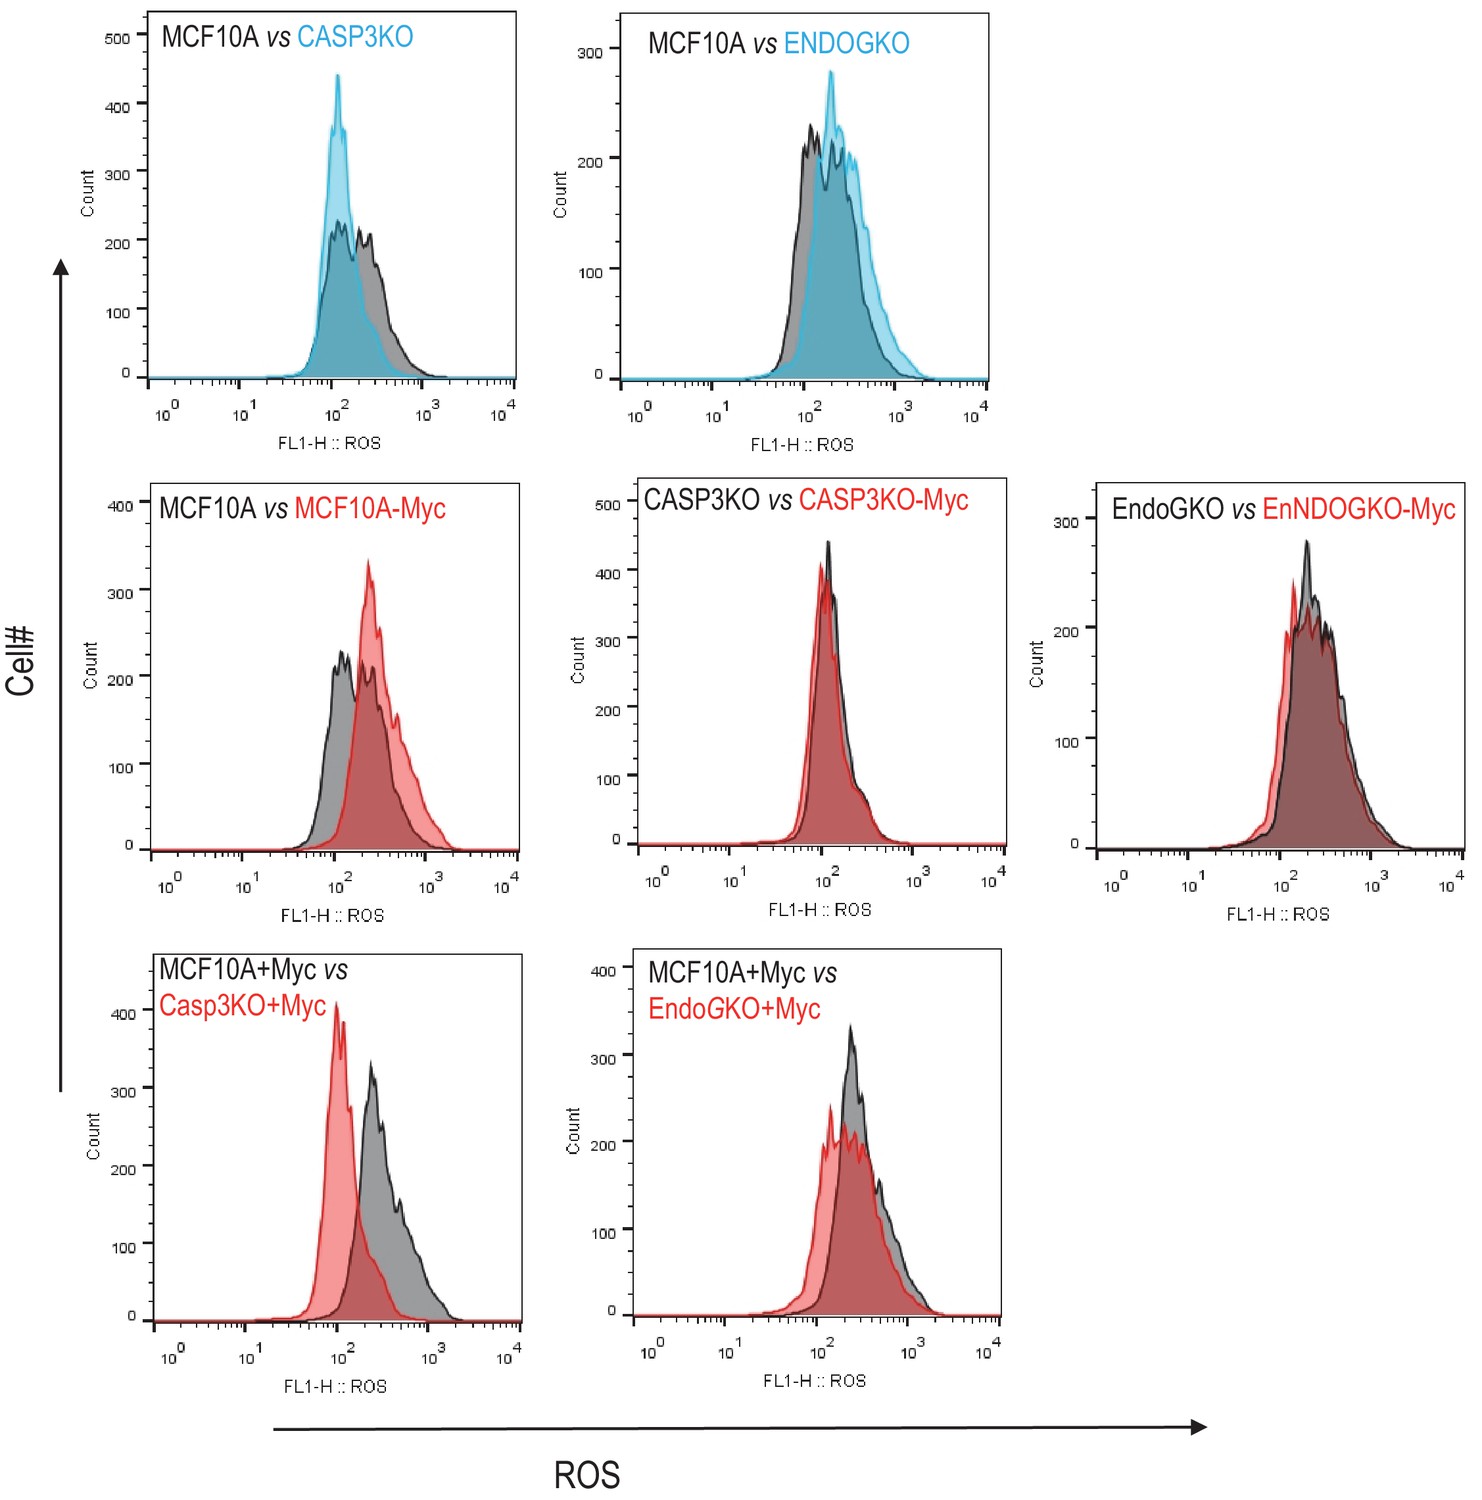
Flow cytometry level analysis of reactive oxygen species (ROS) levels in various MCF10A cells.
Top panels. ROS levels in MCF10A vs CASP3KO cells (left) and MCF10A vs ENDOGKO cells (right). Lower panels, ROS levels in wild type (left), CASP3KO (middle), and ENDOGKO (right) MCF10A cells with or without Myc expression.
Figure 3—figure supplement 4
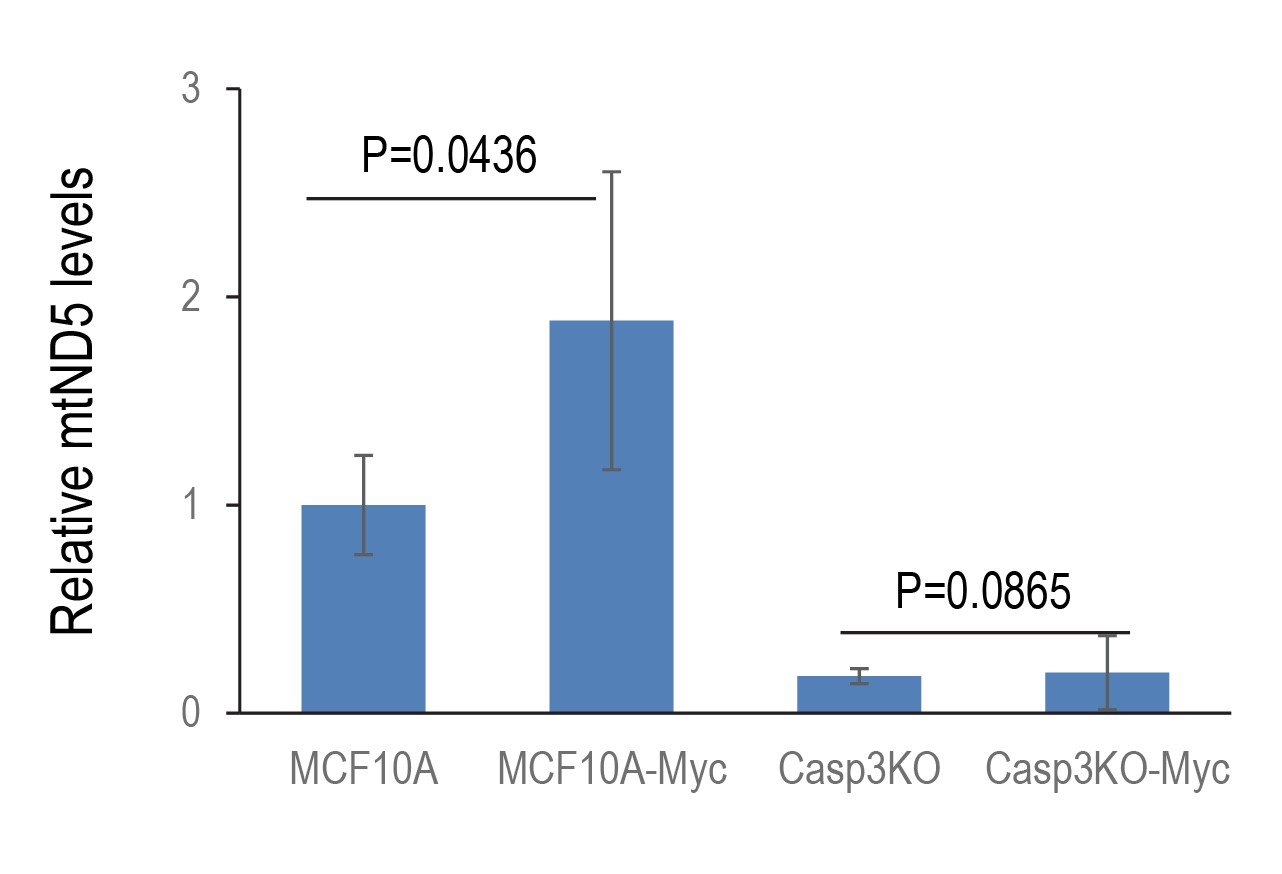
Relative levels of mitochondrial DNA that leaked into the cytoplasm in control as wells genetically modified MCF10A cells.
Cytoplasmic mtND5 of indicated cells were analyzed by use of quantitative RT-PCR. The levels of 18S rDNA were also determined to serve as genomic DNA control. Error bars represent standard error of the mean (SEM), n = 3, p values derived from Student’s t-test.
Figure 4
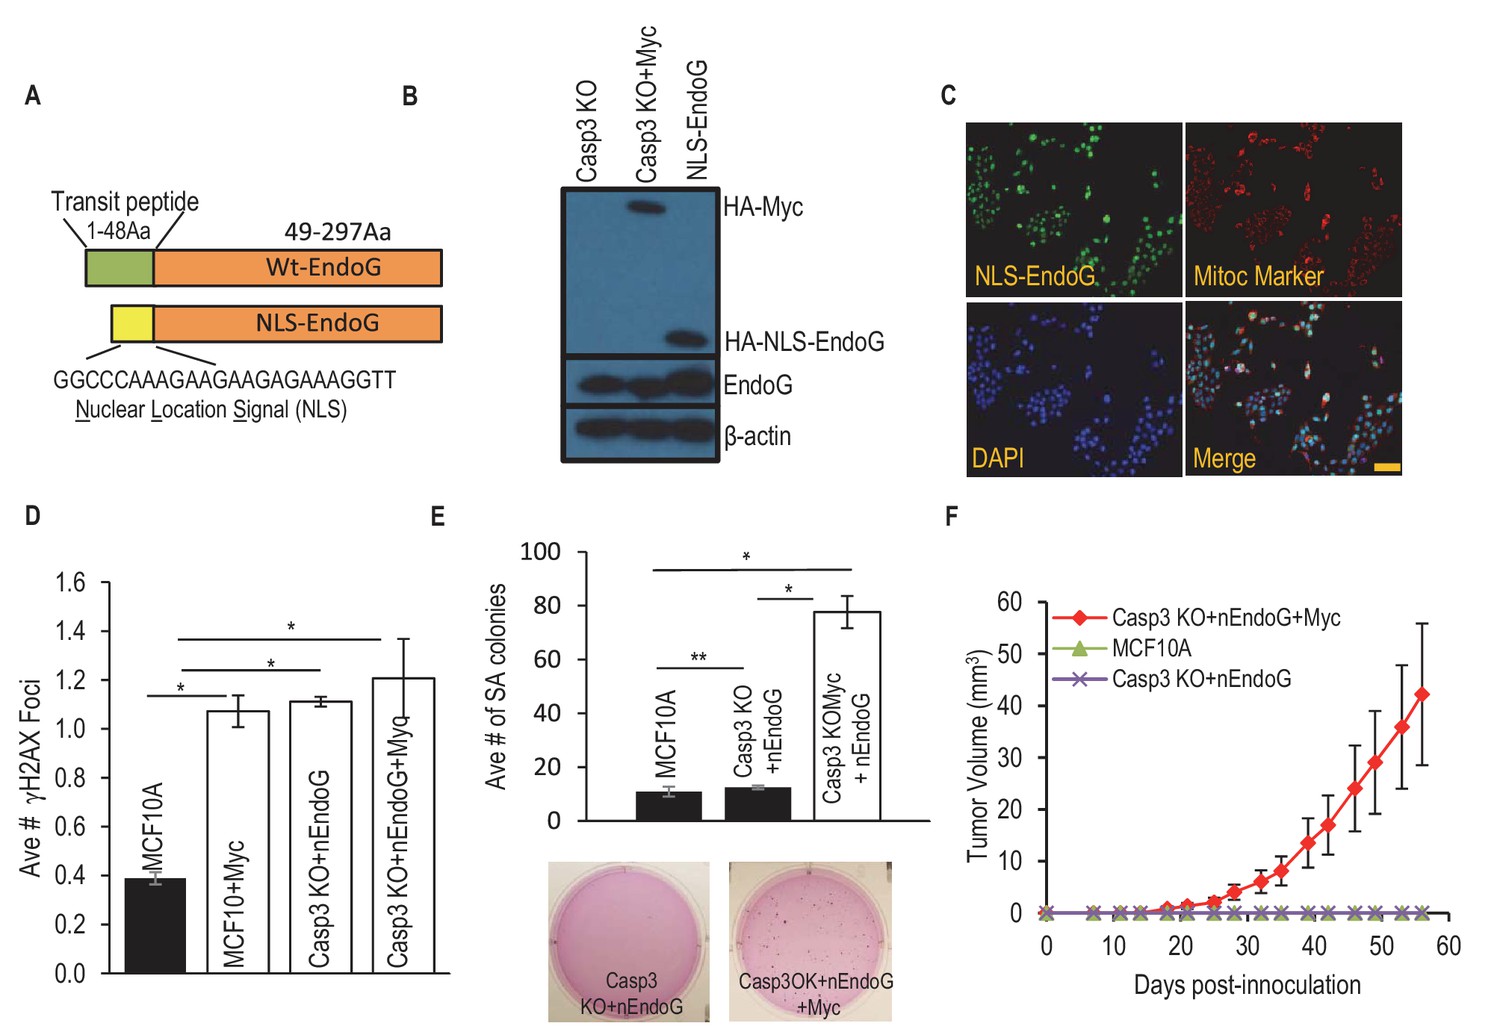
A nucleus-located EndoG restores Myc induced transformation in Casp3-deficient cells.
(A) A diagram showing a re-engineered endoG with a nucleus localization signal (NLS) at its tagged N-terminal. (B) Western blot demonstrating exogenous myc and NLS-EndoG expression by use of an anti-HA antibody. (C) Immunoflouresence staining of EndoG (green), mito marker (red), and DAPI (blue) in NLS-EndoG transduced CASP3KO cells. Scale bar indicates 20 µm. (D) Average number of γH2AX foci per cell in MCF10A with or without nEndoG in the absence or presence of Myc or Casp3KO. (E) The influence of nEndoG on soft agar formation in MCF10A-Casp3KO cells with or without Myc gene expression. (F) Xenograft tumor formation in nude mice from MCF10A-Casp3KO cells with NLS-EndoG (nEndoG) and/or Myc expression. In D, E, F error bars represent standard error of the mean (SEM), * indicates p value < 0.001 while ** Indicates p value > 0.1. Student’s t-test. In D, each data point was derived from the average of three triplicate groups of 150 cells each. In E, n = 3. In F, n = 5.
-
Figure 4—source data 1
Data for Figure 4D.
- https://doi.org/10.7554/eLife.26371.039
-
Figure 4—source data 2
Data for Figure 4E.
- https://doi.org/10.7554/eLife.26371.040
-
Figure 4—source data 3
Data for Figure 4F.
- https://doi.org/10.7554/eLife.26371.041
Tables
Table 1
Primary antibodies used in this study.
| Target protein | Antibody source | Clone information |
|---|---|---|
| γH2AX (Ser139) | Upstate Biotechnology | JBW301, Mouse mAb |
| Caspase-3 (full length) | Cell Signaling Technology | 8G10, Rabbit mAb |
| Caspase-3 (cleaved,Asp175) | Cell Signaling Technology | 5A1E, Rabbit mAb |
| EndoG | Chemicon | Rabbit polyclonal |
| HA epitope | Novus Biologicals | Goat polyclonal |
| β-Actin | Novus Biologicals | Mouse mAb |
| c-Myc | Cell Signaling Technology | Rabbit mAb |
| Mito Marker | Thermo Fisher Scientific | N/A |
Table 2
Single guided RNA (sgRNA) sequences used in this study.
| Gene | Accession | sgRNA oligo(5`−3`)* | Targeted exon |
|---|---|---|---|
| CASPASE3 | NC_000004 | CACCGcatacatggaagcgaatcaa AAACttgattcgcttccatgtatgC | Exon4 |
| CASPASE3 | NC_000004 | CACCGggaagcgaatcaatggactc AAACgagtccattgattcgcttccC | Exon4 |
| EndoG | NC_000009 | CACCGgggctgggtgcggtcgtcga AAACtcgacgaccgcacccagcccC | Exon1 |
| EndoG | NC_000009 | CACCGcgacttccgcgaggacgact AAACagtcgtcctcgcggaagtcgC | Exon1 |
-
*Capital letters: enzyme overhangs; non-capital letters: sgRNA target guide sequence.
Table 3
Mutations at target sequences in various CRISPR knockout MCF10A and BJ-1 hTERT cells.
| 5`……3` | Mutation | ||
|---|---|---|---|
| Casp3 KO | MCF10A | Clone1: AAAGATCATACATGGAAGCGAATCAATGGA - - - - - - - ATAT Casp3: AAAGATACTCTGGAATAT | 7 bp deletion |
| Casp3 KO | BJ-1hTERT | Clone28: AAAGATCATACATGGAAGCGAATCAATG - - - deletion-------- Casp3: AAAGATACTCTGGAATAT | 193 bp deletion |
| EndoG KO | MCF10A | Clone13: -------- deletion-------- EndoG: TGCCAGGCTTCGACCGCG | 169 bp deletion |
-
Note: Red: sgRNA sequence; Yellow: PAM sequence; Bold: insertion sequence; -: deletion sequence. In all cases, knockout clones that showed both clear absence of target protein expression and gene mutations were chosen. In addition, in most cases, only those clones with homozygous mutations (where both copies of the gene showed the same mutation) were chosen for convenience.
Download links
A two-part list of links to download the article, or parts of the article, in various formats.
Downloads (link to download the article as PDF)
Open citations (links to open the citations from this article in various online reference manager services)
Cite this article (links to download the citations from this article in formats compatible with various reference manager tools)
Essential roles of Caspase-3 in facilitating Myc-induced genetic instability and carcinogenesis
eLife 6:e26371.
https://doi.org/10.7554/eLife.26371


