Pirating conserved phage mechanisms promotes promiscuous staphylococcal pathogenicity island transfer
- University of Glasgow, United Kingdom
- University of Kufa, Iraq
- Instituto de Biomedicina de Valencia (IBV-CSIC) and CIBER de Enfermedades Raras, Spain
- Universidad CEU Cardenal Herrera, Spain
Figures
Figure 1 with 1 supplement

Induction of SaPIbov1 and SaPIbov5 by the ϕO11 dimeric Dut.
(A) SaPIbov1 and SaPIbov5 excision and replication following induction of the cloned ϕO11 dut gene. Strains JP6774 and JP11634, containing SaPIbov1 and SaPIbov5 respectively, were complemented with a plasmid expressing the 3xFLAG-tagged ϕO11 dimeric Dut. Samples were isolated at 0’ or 3 hr after induction with 0.5 μM CdCl2 and Southern blots were performed using a probe for the SaPIbov1/SaPIbov5 integrase. The upper band is ‘bulk’ DNA, including chromosomal, phage, and replicating SaPI. CCC indicates covalently closed circular SaPI DNA. In these experiments, as no helper phage was present, the excised and replicating SaPI DNA appears as part of the bulk DNA or as CCC molecules, rather than the linear monomers that are seen following helper phage-mediated induction and packaging. (B) Derepression of str transcription by ϕO11 Dut expression. The diagram represents a schematic of a blaZ transcriptional fusion generated in pJP674. β-lactamase assays were performed on strains containing pJP674 together with a pCN51-derived plasmid expressing the ϕO11 Dut (JP14818) or the empty pCN51 control (JP15105). Samples were taken after 5 hr in the absence or following induction with 5 μM Cadmium. All data is the result of five independent experiments. Error bars represent SEM. A 2-way ANOVA with Sidak's multiple comparisons test was performed to compare mean differences within rows. Adjusted p values were as follows: ϕO11 = 0.0004***, pCN51 = 0.9579ns. ns, not significant. (C) Affinity chromatography of the ϕO11 Dut for the His-tagged SaPIbov1 Stl. Strains were induced with 10 mM isopropyl-β-d-thiogalactoside (IPTG) and samples taken at 3 hr. Cells were disrupted and expressing proteins were applied to a Ni2+ column and eluted. Lane 2, elution fraction for His6-StlSaPIbov1 and DutΦO11 (JP14832). Lane 1, corresponding elution fraction for StlSaPIbov1 and DutΦO11 (JP14833, no His6-tag). Proteins were confirmed by Mass Spectrometry analysis.
-
Figure 1—source data 1
β-lactamase assay data and statistical analysis for the dimeric ΦO11 Dut.
- https://doi.org/10.7554/eLife.26487.005
Figure 1—figure supplement 1
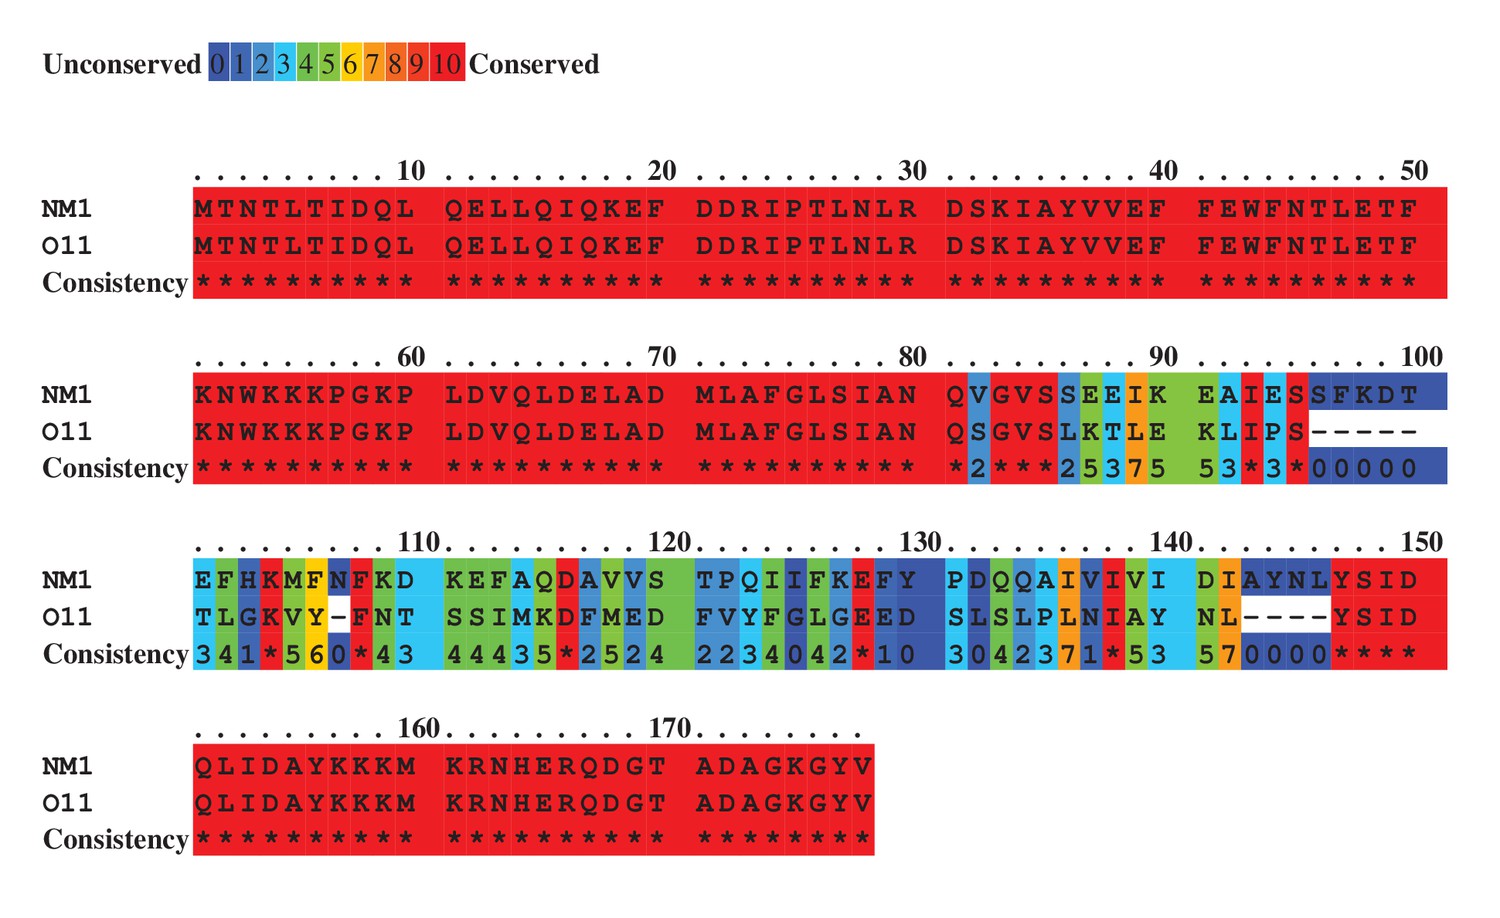
Sequence alignment for the ϕNM1 (accession number ABF73061) and ϕO11 (accession number EGA96175) dimeric dUTPases.
Colours indicate relative sequence conservation at each position, with red being most conserved and violet being least (adapted from alignment generated by PRALINE).
Figure 2 with 1 supplement
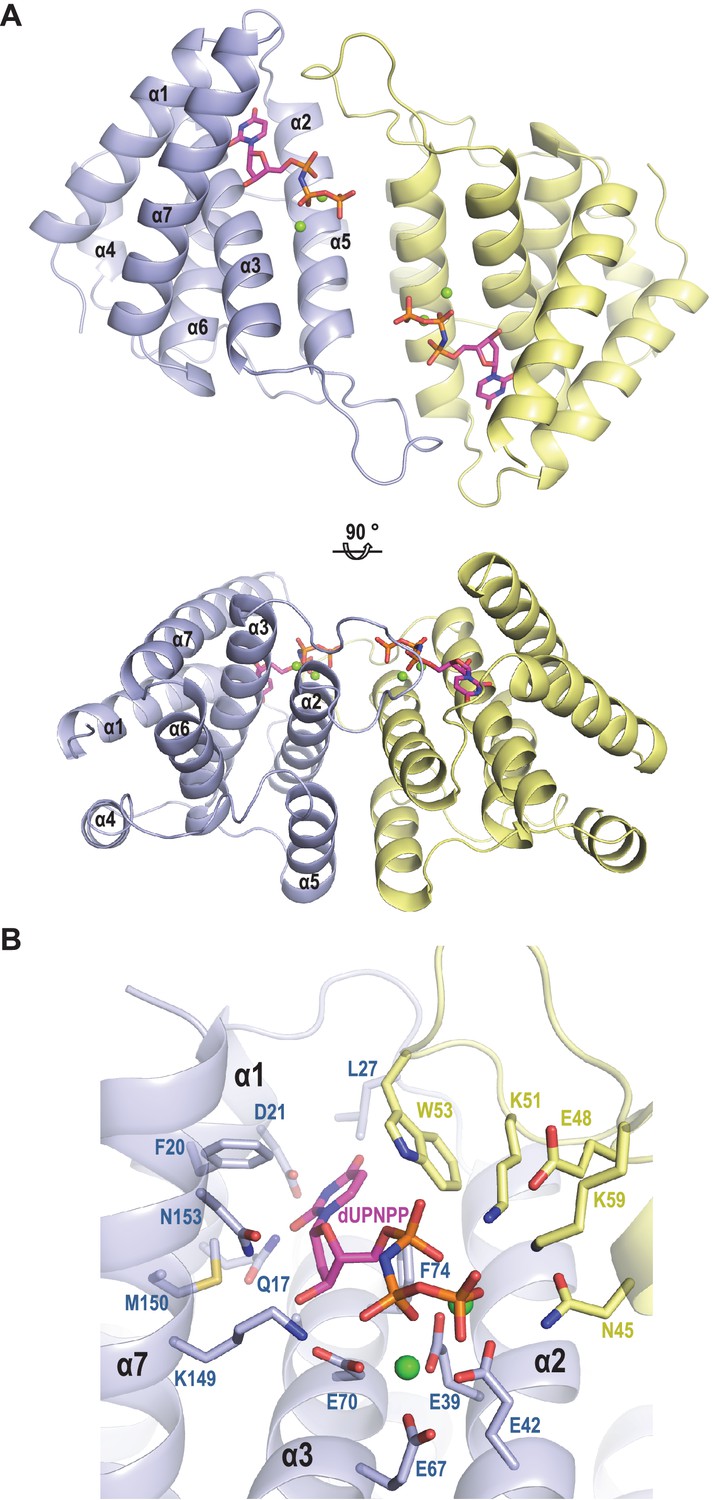
Structure of ϕO11 dimeric Dut.
(A) Cartoon representation the ϕO11 Dut dimer (protomer in blue and yellow). The secondary structural elements are numbered. A molecule of dUMPPNP and two Mg ions represented in stick and sphere, respectively, occupy the active centre of each protomer. Two orthogonal views of the dimer are shown. (B) Close view of ϕO11 Dut active centre. The substrate dUPNPP is represented in stick with carbon atoms in magenta. The residues interacting with the substrate are labelled and represented in stick with carbon atoms coloured according to the protomer to which they correspond. Nitrogen, oxygen, phosphorus atoms are coloured in dark blue, red and orange, respectively. The Mg ions are represented as green spheres.
Figure 2—figure supplement 1
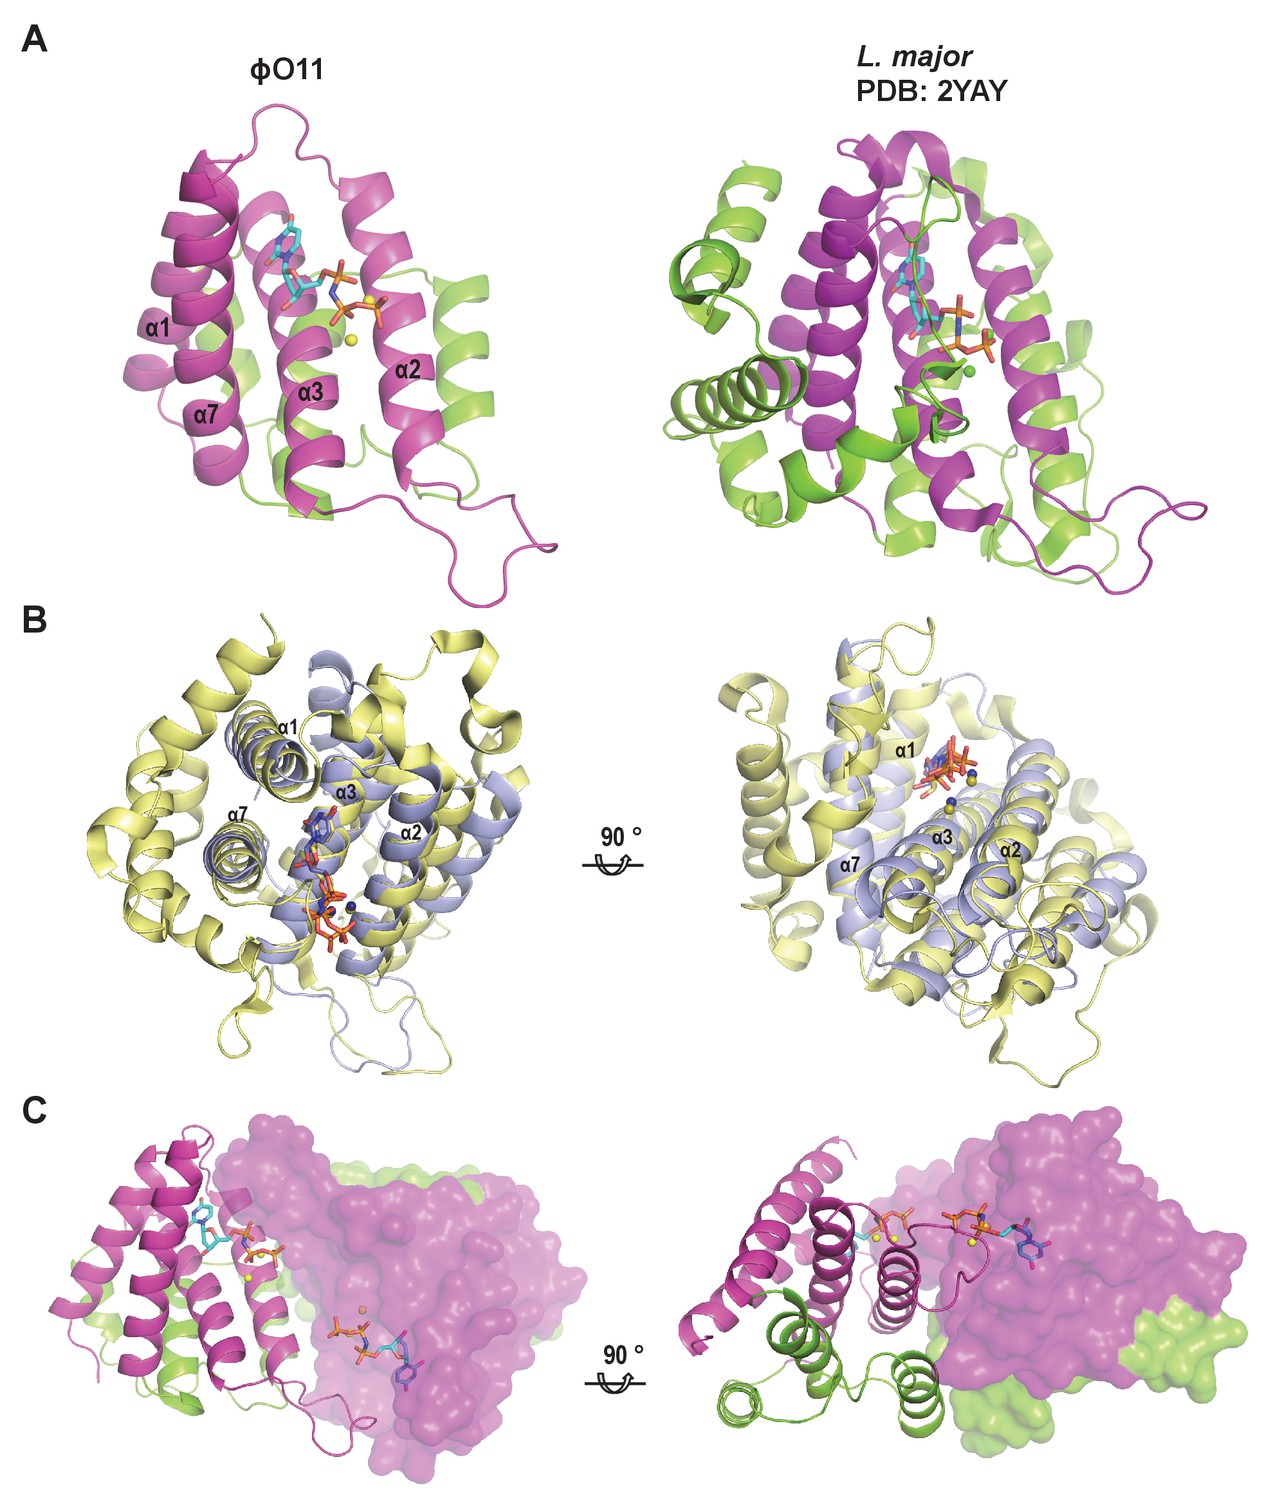
ϕO11 Dut represents a reduced version of dimeric Duts.
(A) Cartoon representation of protomers from ϕO11 and Leishmania major (PDB2YAY) dimeric Duts. The four helices defining the conserved structural core that generate the nucleotide-binding site in these dimeric Duts are coloured in magenta and the corresponding secondary structural elements are labelled in ϕO11. The variable regions in the dimeric Duts are coloured in green. The nucleotides bound in the active centres are represented in sticks. (B) Two orthogonal views of the superimposed ϕO11 (blue) and L. major (yellow) protomers showing the similar spatial disposition of the conserved structural core. (C) Two orthogonal views of the ϕO11 dimer (one protomer in cartoon and the other in surface) showing that the conserved structural core (coloured in magenta) is oriented in the same face of the molecule forming the active centres where two molecules of nucleotide are accommodated (shown in stick representation). The opposite face of the molecule is occupied by the variable protein regions (coloured in green).
Figure 3
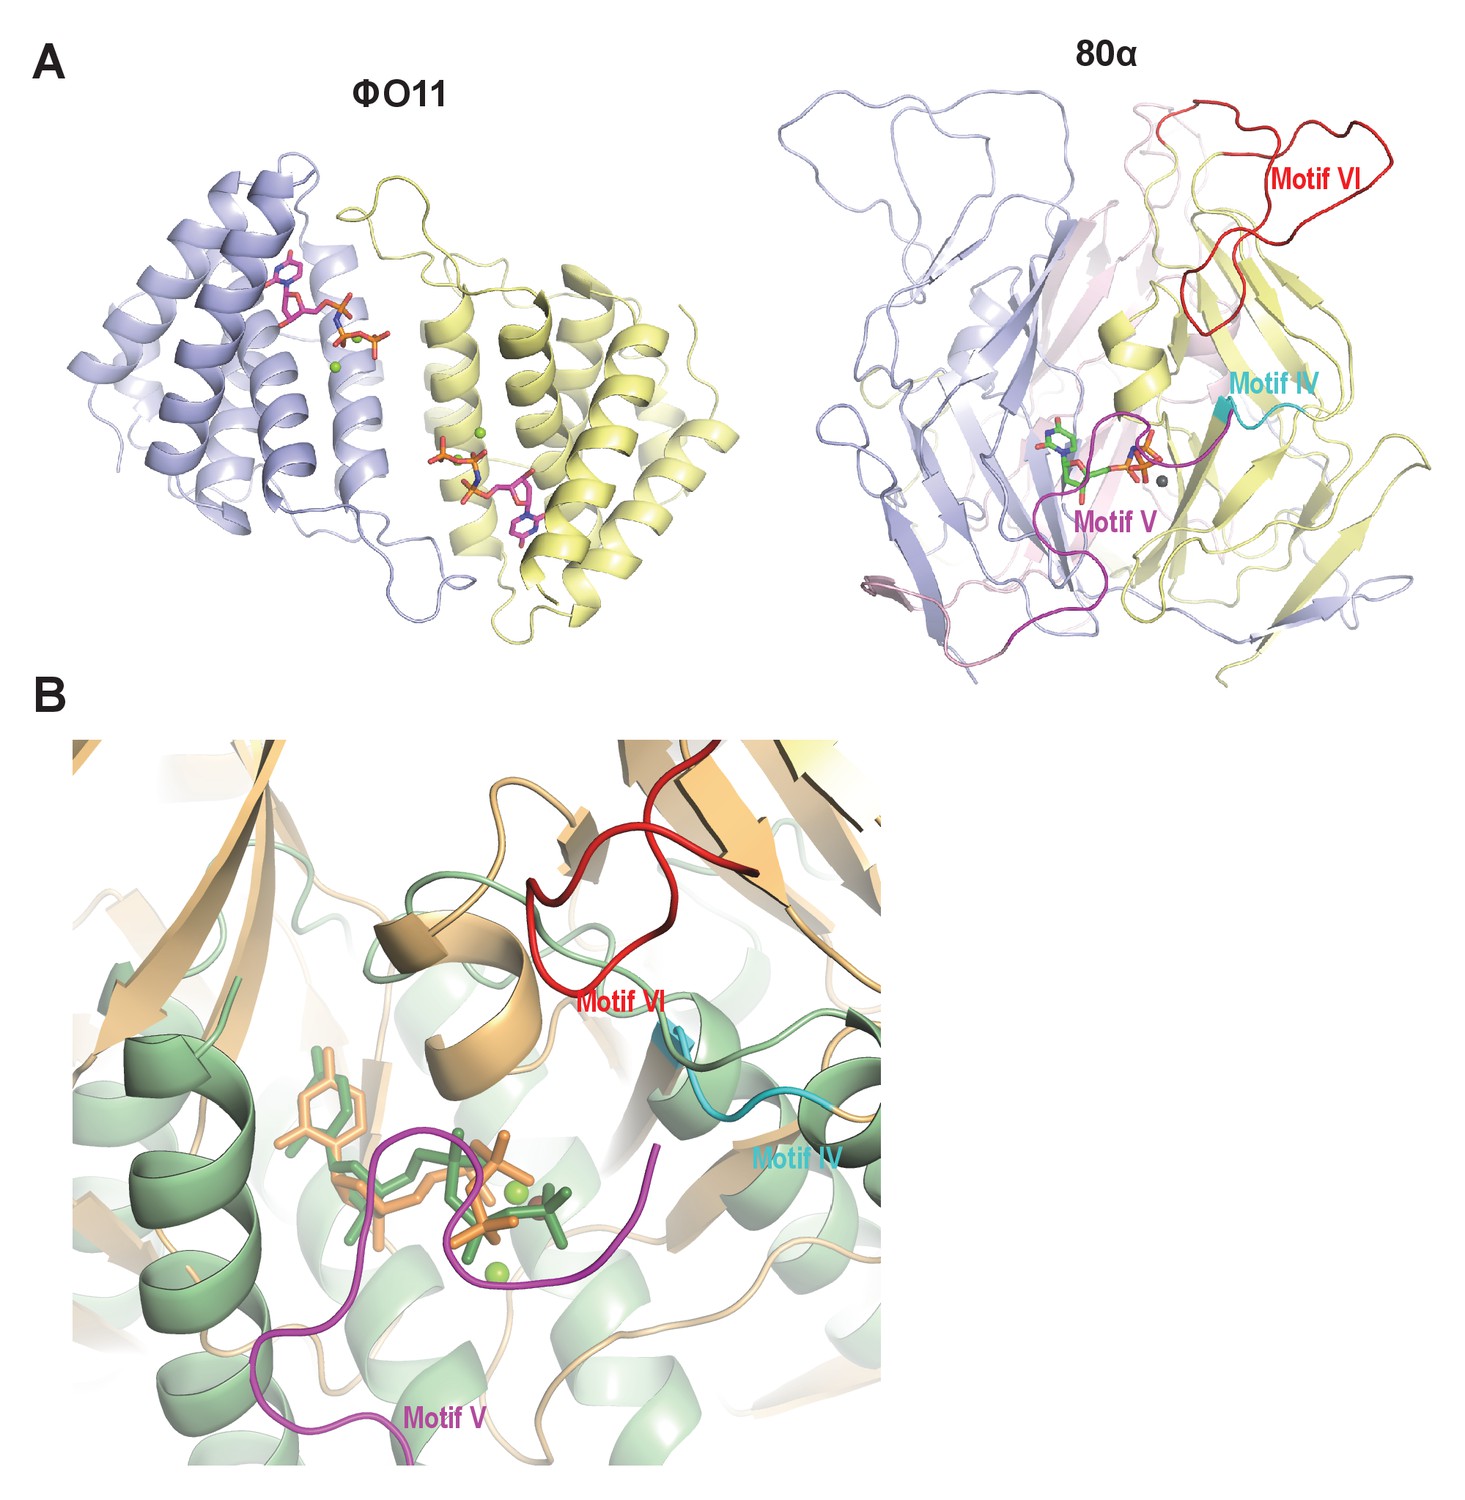
Dimeric and trimeric S. aureus phagic Duts present completely different folding.
(A) Cartoon representation of ϕO11 dimeric Dut (protomers coloured in blue and yellow) and 80α trimeric Dut (PDB 3ZEZ; protomers coloured in blue, yellow and pink) showing the difference in folding between dimeric (all-alpha) and trimeric (all-beta) Duts. The dUPNPP molecules in the active centres are represented in stick and the Mg ions as spheres. For clarity only one dUPNPP molecule is shown in the trimeric structure. The structural motifs implicated in Stl recognition for trimeric Duts (Maiques et al., 2016; Tormo-Más et al., 2013) are labelled and coloured in cyan, magenta and red for motif IV, V and VI, respectively. (B) Superimposition of dUPNPP molecules in the active centres of ϕO11 (green tones) and 80α (orange tones) shows that the bound nucleotide molecules acquire different conformations (stick representation), including the disposition of the Mg ions (sphere representation), and that the spatial arrangement of the structural elements conforming each active centre is essentially different. No structural element equivalent to the Stl binding motifs of 80α (coloured as in A) is observed in ϕO11.
Figure 4 with 1 supplement
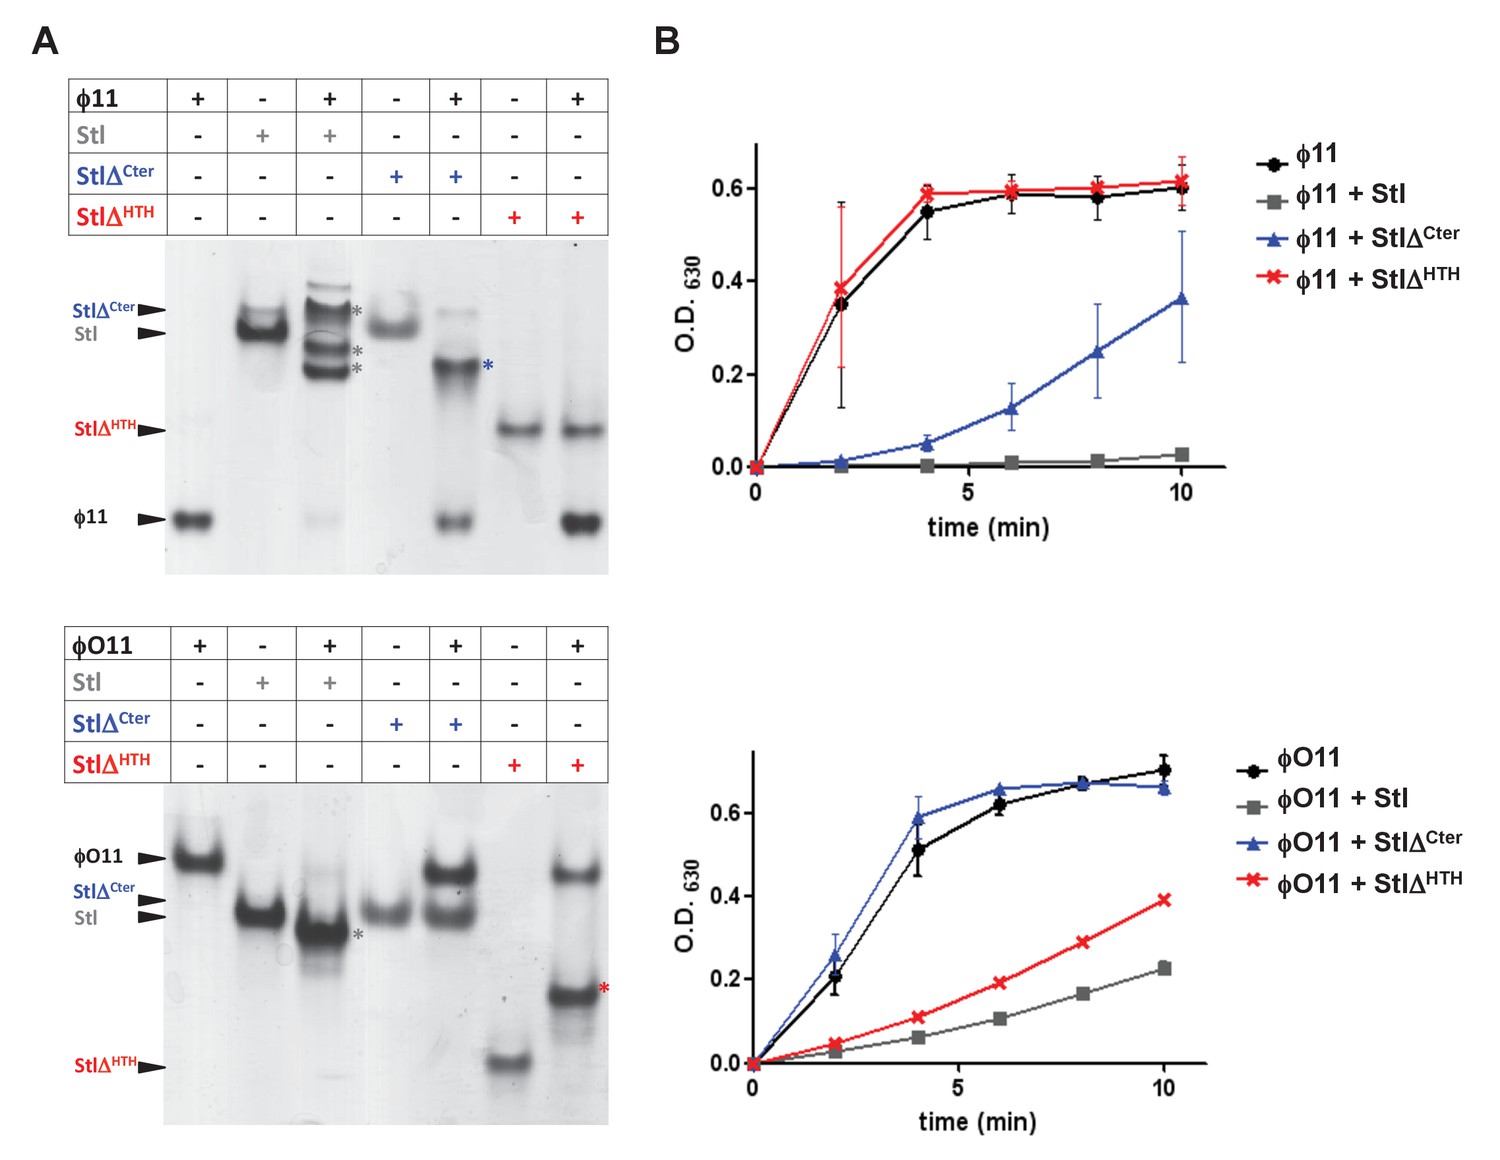
SaPIbov1 Stl has different regions to interact with the trimeric and dimeric Duts.
(A) Native gel mobility shift assays were used to test the binding capacity of ϕO11 dimeric and ϕ11 trimeric Duts with full-length and truncated versions of Stl. The appearance of bands with alternated migration with respect to the individual proteins (labelled by asterisk) indicates formation of a complex. (B) dUTPase activity for ϕO11 and ϕ11 was measured by malachite green assay in the presence and the absence of Stl variants. The reaction time-course is represented as the development of green colour (measured at 630 nm). Results are representative of three independent experiments.
Figure 4—figure supplement 1

Stl models and constructs design.
(A) Cartoon representation of SaPIbov1 Stl models produced by Phyre2 and I-Tasser servers. Both servers predict models with high α helical content that can be divided in to a N-terminal HTH domain (pink) and a C-terminal portion (light and dark blue) separated by a region of low complexity (magenta) as is predicted by the Metadisorder server. (B) Based on these predictions, two deletional Stl constructs were designed: StlΔHTH, lacking the N-terminal HTH domain, and StlΔCter lacking the C-terminal portion after the predicted disorder region.
Figure 5 with 4 supplements

Induction of SaPI2 by different phage-encoded SSAPs (recombinases).
A non-lysogenic derivative of strain RN4220 Δspa carrying SaPI2 was complemented with plasmids expressing different 3xFLAG-tagged SSAP proteins. One millilitre of each culture (optical density (OD)540nm=0.3) was collected 3 hr after treatment with 5 μM CdCl2 and used to prepare standard mini-lysates, which were resolved on a 0.7% agarose gel, Southern blotted and probed for SaPI2 DNA. The upper band is ‘bulk’ DNA, including chromosomal, phage, and replicating SaPI. CCC indicates covalently closed circular SaPI2 DNA. In these experiments, as no helper phage was present, the excised and replicating SaPI DNA appears as part of the bulk DNA or as CCC molecules, rather than the linear monomers that are seen following helper phage-mediated induction and packaging. The lower panel is a western blot probed with antibody to the FLAG-tag carried by the SSAP proteins. sak: 80α ORF16; sak4: ϕ52A ORF16; erf: ϕSLT ORF17; redβ: ϕN315 ORF SA1794; chi: chimeric 80α sak-ssb; pCN51: empty vector.
Figure 5—figure supplement 1
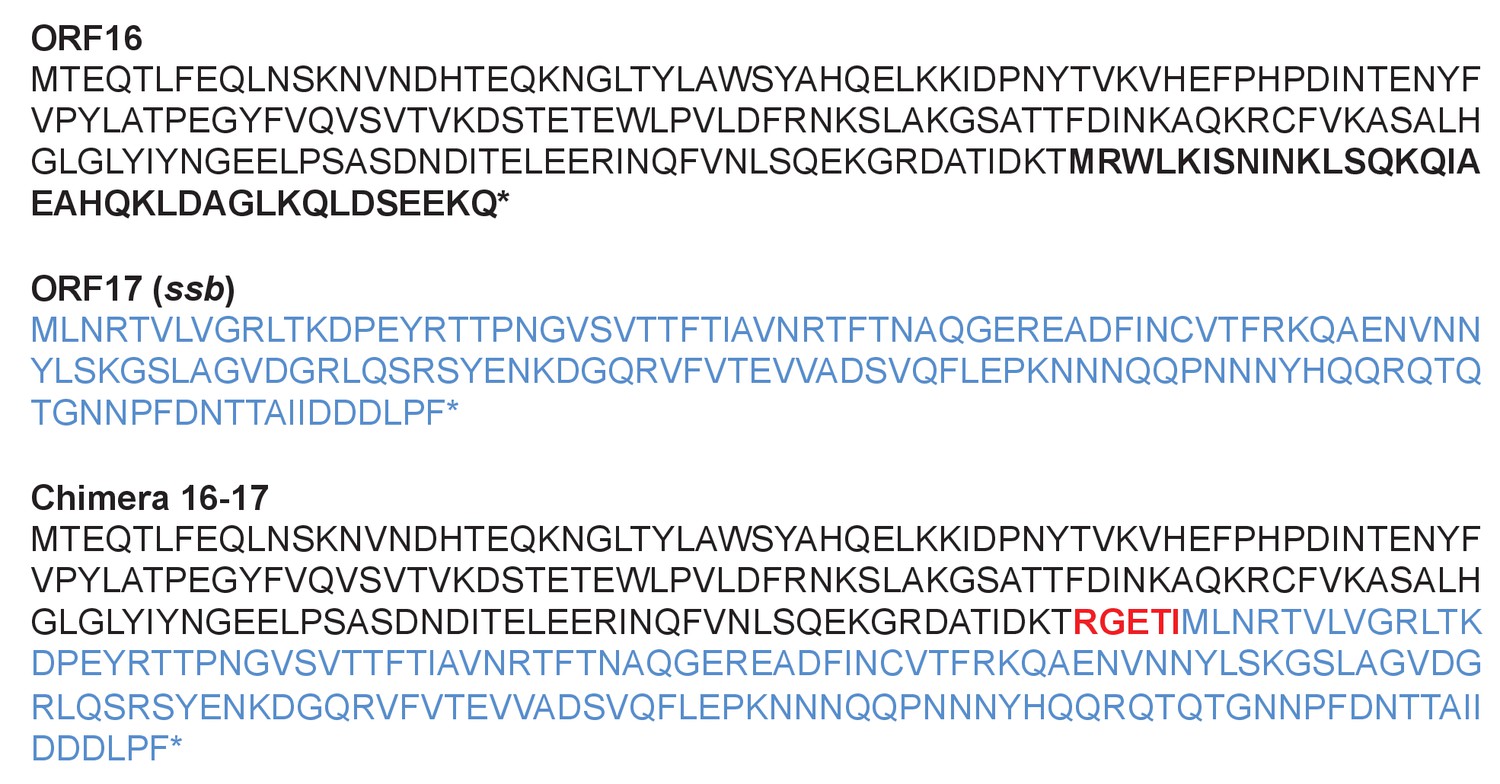
Sequence of the chimeric ORF16-17 protein.
Top: sequence of the ORF16 coded protein. The C-terminal part of the protein that is lost in the chimeric protein is highlighted in bold. Middle: Sequence of the Ssb (ORF17) protein. Bottom: Sequence of the chimeric protein. In red is shown the novel sequence generated as a consequence of the mutation, that serves to link the ORF16 and ORF17 encoded proteins.
Figure 5—figure supplement 2
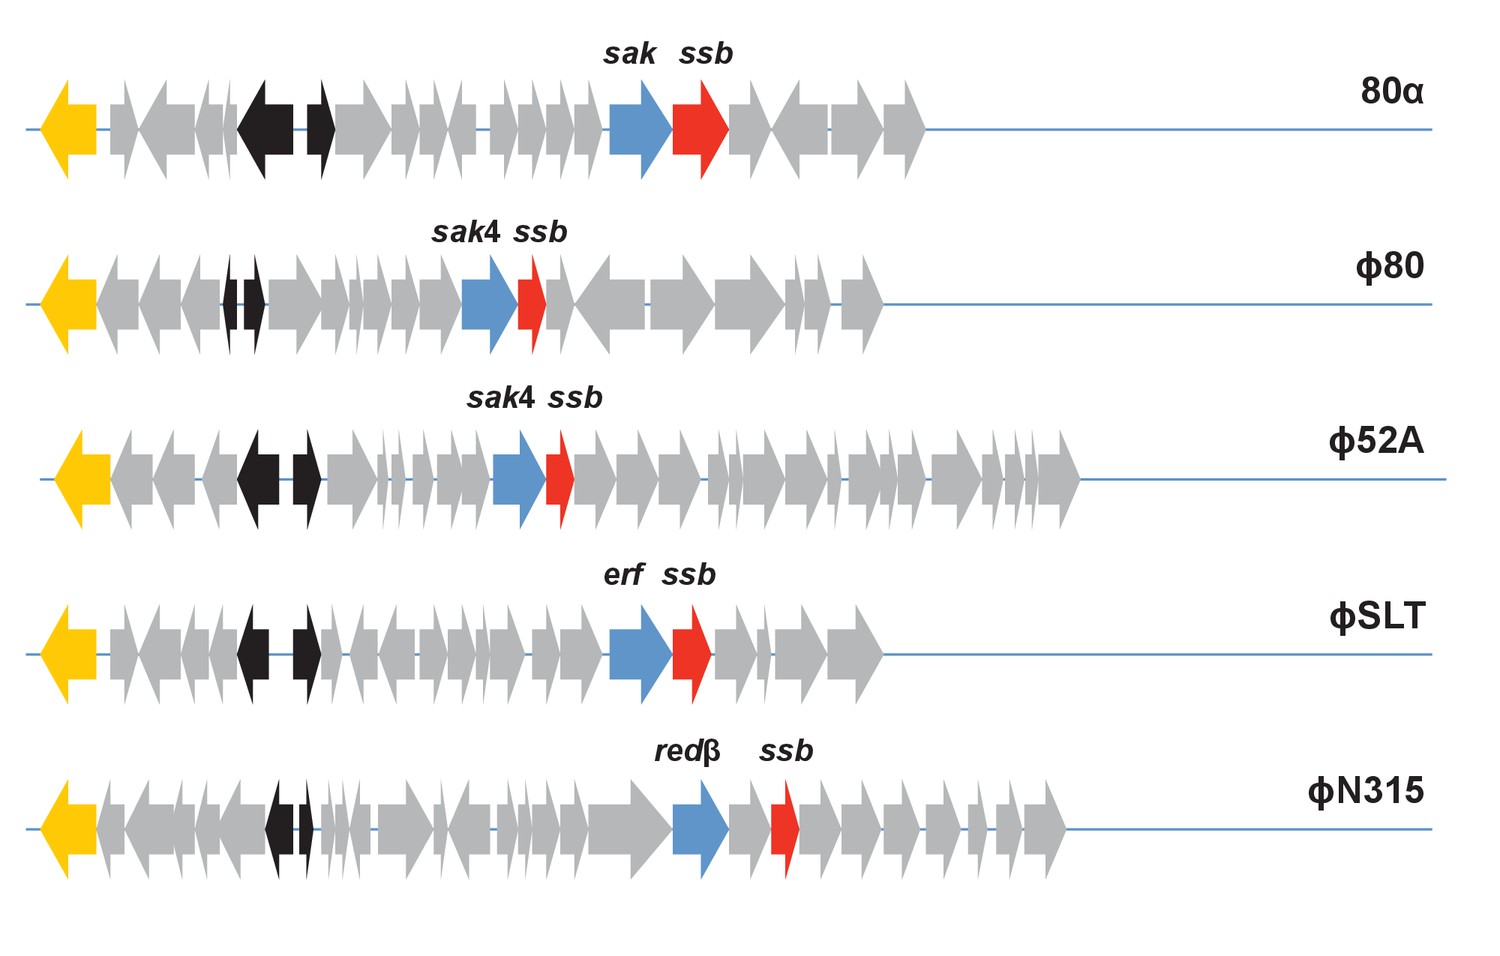
Localisation of the recombinase and ssb genes in different staphylococcal phage genomes.
The 5’ regions of phages 80α (NC_009526), ϕ80 (DQ908929), ϕ52A (AY954965), ϕSLT (AB045978) and ϕN315 (NC_004740) are shown. Yellow: integrase (int); black: regulatory module; blue: ssap genes; red: ssb genes; grey: other genes.
Figure 5—figure supplement 3

Alignment of predicted Sak (80α) and Sak4 (ϕ52A) staphylococcal phage SSAPs.
Colours indicate relative sequence conservation at each position, with red being most conserved and violet being least (adapted from alignment generated by PRALINE).
Figure 5—figure supplement 4
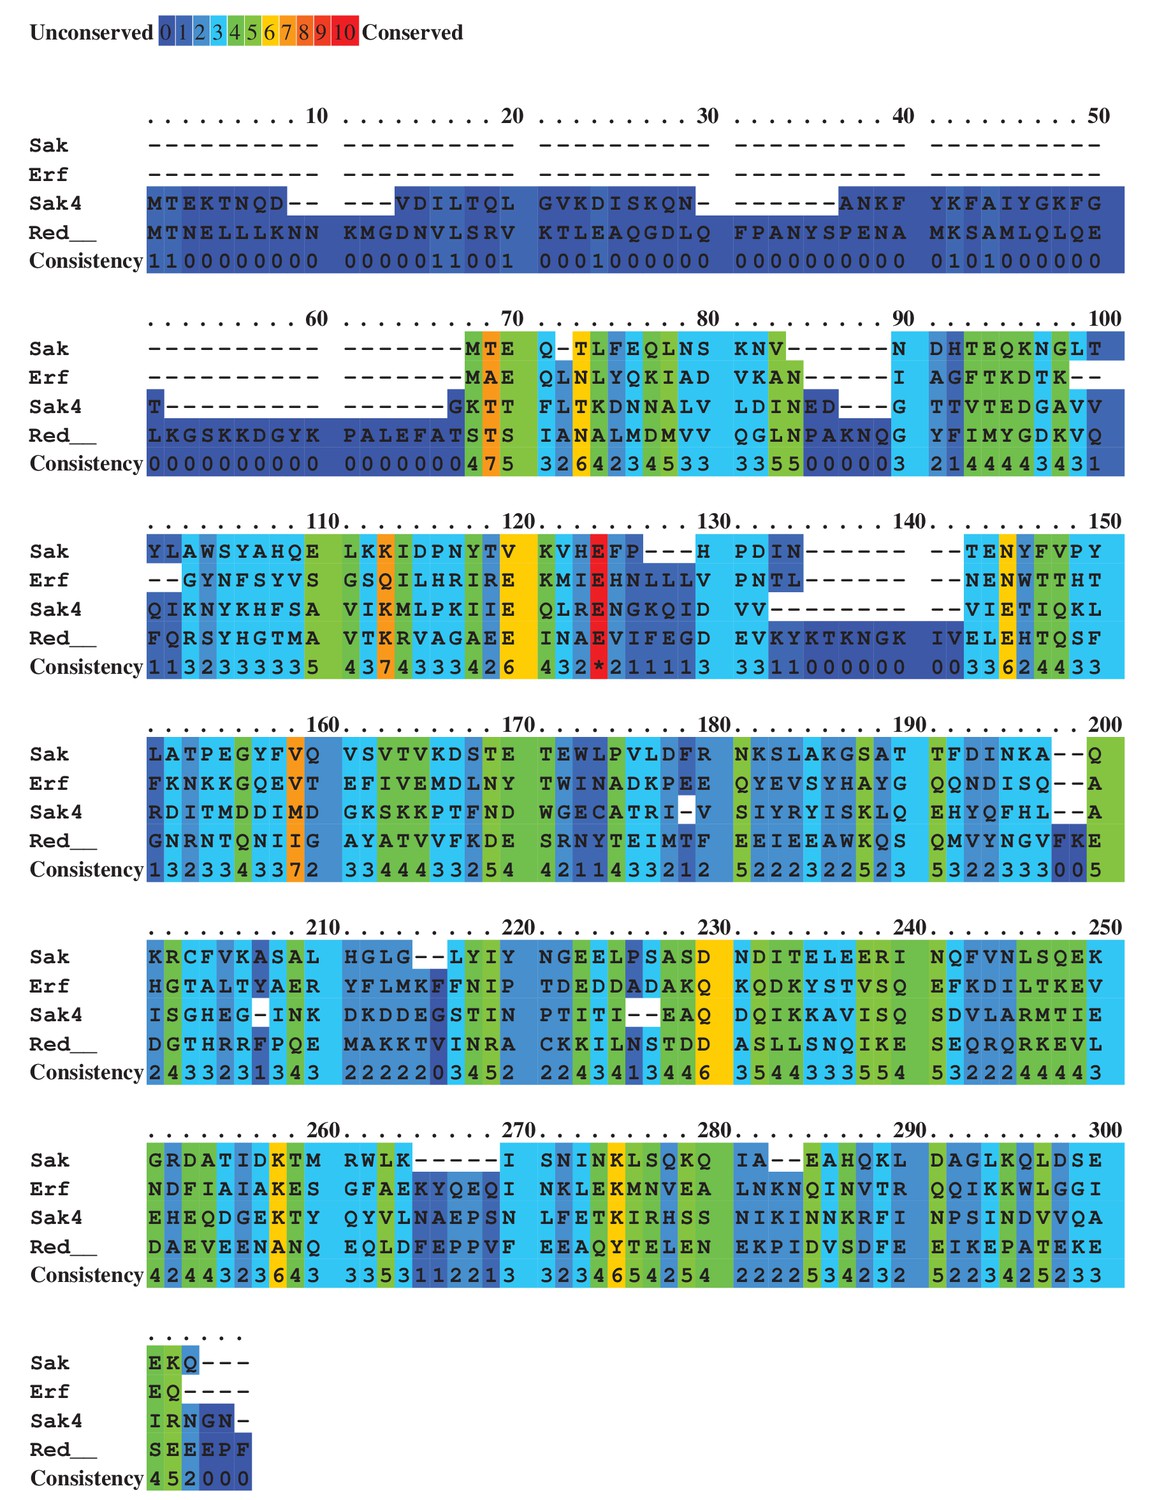
Alignment of predicted staphylococcal phage SSAPs.
Colours indicate relative sequence conservation at each position, with red being most conserved and violet being least (adapted from alignment generated by PRALINE).
Figure 6
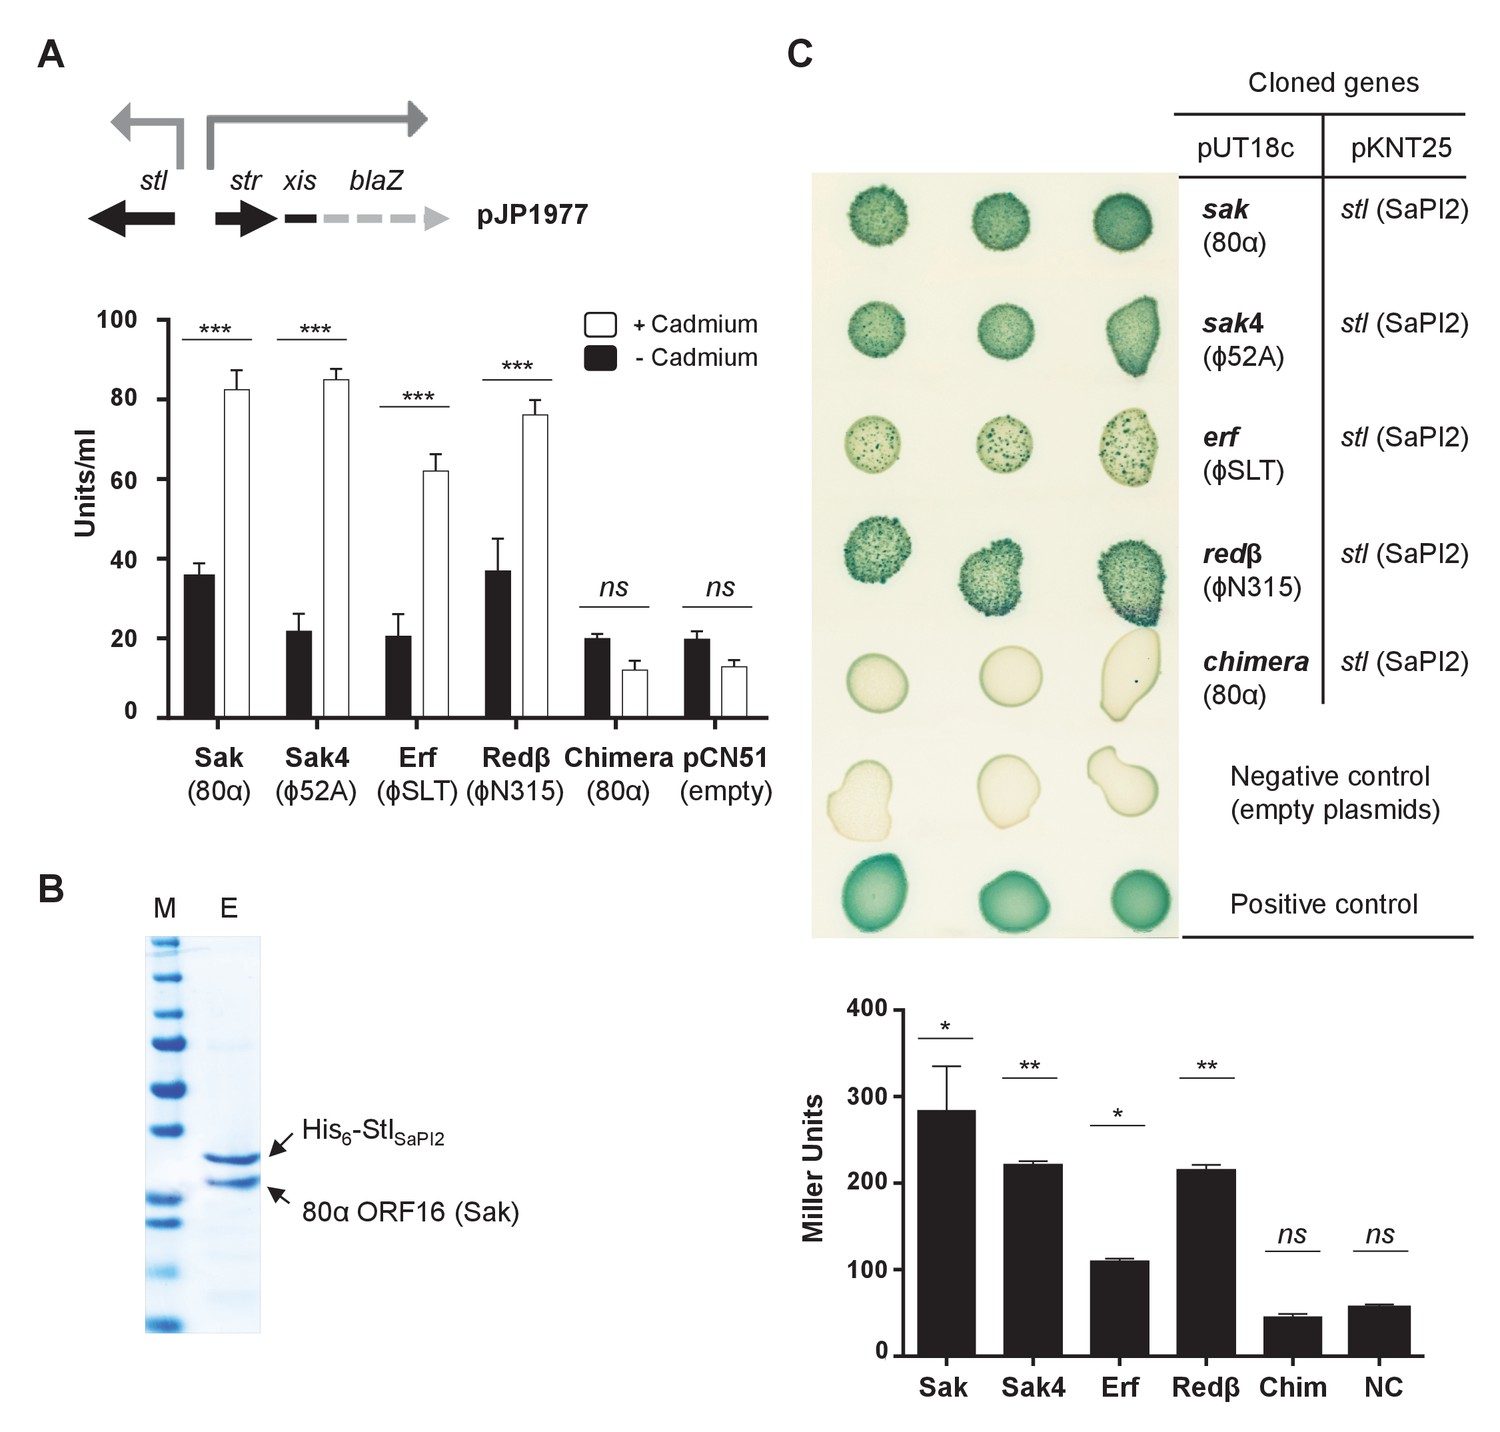
Phage SSAPs bind SaPI2 Stl protein.
(A) Derepression of str transcription by ssap expression. Top, schematic representation of the blaZ transcriptional fusion generated in plasmid pJP1977. Bottom, strains containing pJP1977- and pCN51-derivative plasmids expressing the different SSAPs under study were assayed for β-lactamase activity in the absence of or 3 hr after induction with 5 μM CdCl2. Samples were normalized for total cell mass. Experiment data is in triplicate. Error bars represent SEM. A 2-way ANOVA with Sidak's multiple comparisons test was performed to compare mean differences within rows. Adjusted p values were as follows: Sak = 0.0001***, Sak4 = 0.0001***, Erf = 0.0001***, Redβ=0.0001***, chimera = 0.999ns. ns, not significant. (B) Affinity chromatography of 80α Sak (ORF16) using His6–StlSaPI2. E. coli strain expressing the pair was isopropyl-β-D-thiogalactoside (IPTG)-induced and, after disruption of the cells, the expressed proteins were applied to a Ni2+ agarose column and eluted. The presence of the different proteins was monitored in the elute fraction (E) by Coomassie staining. M: molecular weight marker. (C) Bacterial adenylate cyclase-based two-hybrid (BACTH) analysis. Spots in each row represent three independent colonies. Plasmid combinations are indicated in the right columns. Bottom, quantification of the BACTH analysis after 2 hr of IPTG (5 mM) induction. Experiment data is in triplicate. Error bars represent SEM. A 1-way ANOVA with Sidak's multiple comparisons test was performed to compare mean differences within rows. Adjusted p values were as follows; Sak = 0.0221*, Sak4 = 0.0030**, Erf = 0.0158*, Redβ=0.0014**, chimera (Chim) = 0.1980ns. ns, not significant.
-
Figure 6—source data 1
β-lactamase assay data and statistical analysis for the recombinases.
- https://doi.org/10.7554/eLife.26487.017
-
Figure 6—source data 2
BACTH analysis data and statistical analysis for the recombinases.
- https://doi.org/10.7554/eLife.26487.018
Figure 7
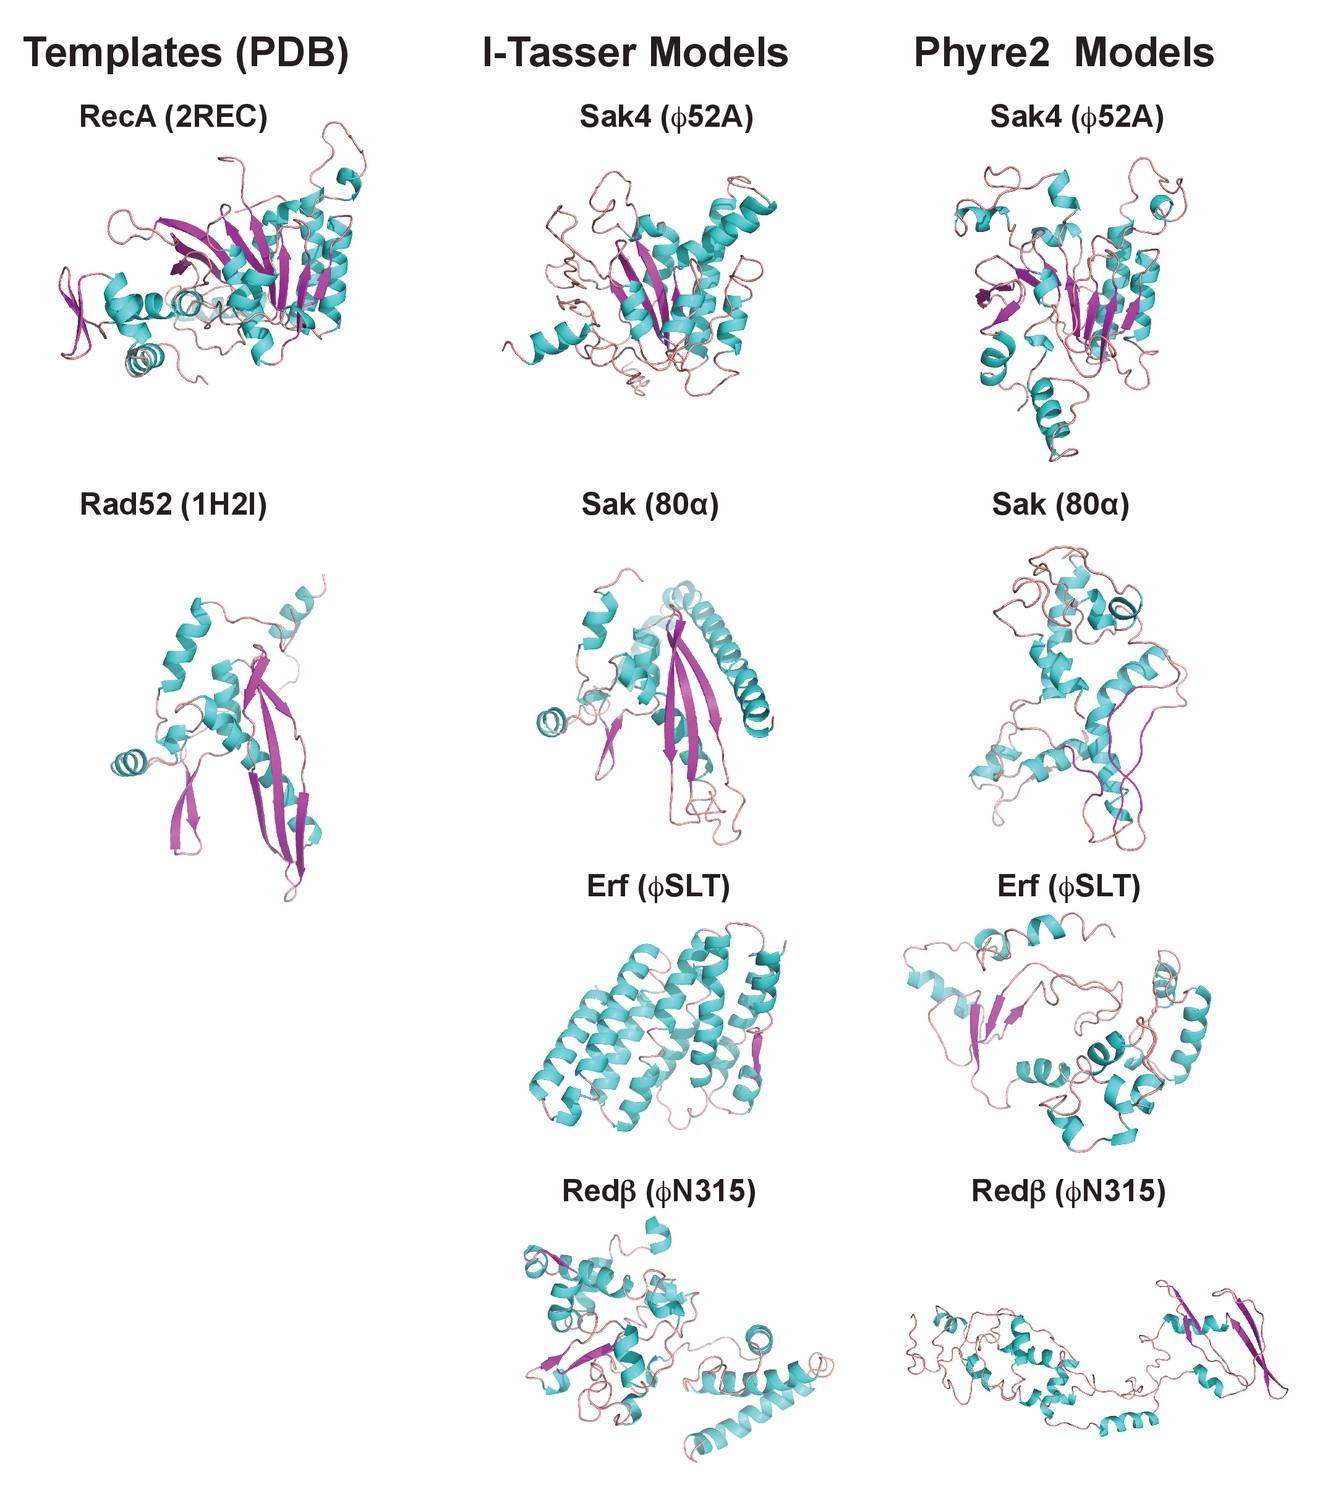
3D models for 80α, ϕSLT, ϕ52A and ϕN315 SSAPs.
Cartoon representation of 3D structures of 80α, ϕSLT, ϕ52A and ϕN315 phage recombinases generated by I-Tasser and Phyre2. Alpha helices, beta strands and loops are coloured in cyan, magenta and orange, respectively. The experimental structures of RecA from E. coli (PDB 2REC) proposed as structural homolog of the ϕ52A recombinase, and the human Rad52 recombinases (1H2I) proposed as structural homolog of 80α, ϕSLT, and ϕN315 recombinases are also presented for folding comparison.
Tables
Table 1
Dimeric and trimeric dUTPases induce PICIs from other species encoding SaPIbov1-like Stl repressorsa.
https://doi.org/10.7554/eLife.26487.020| Phage Duts | ||||
|---|---|---|---|---|
| Dimeric | Trimeric | |||
| ϕNM1 S. aureus | ϕO11 S. aureus | ϕIPLA6 S. epidermidis | ϕ11 S. aureus | |
| PICIs | ||||
| SaPIbov1 | ++ | ++ | ++ | +++ |
| ShoCI794_SEPI | ++ | ++ | ++ | +++ |
| ShaCI51-48 | + | + | + | + |
-
aResults are from 5 independent β-lactamase/Nitrocefin assay experiments, using the dual plasmid system described in the text. Levels of induction were based on the calculated units/ml with the following ranges: (-): no induction, <1 Units/ml; (+): low induction, 1–5 Units/ml; (++): moderate induction, 5–10 Units/ml; (+++): high induction, >10 Units/ml. A 2-way ANOVA with Sidak's multiple comparisons test was performed to compare mean differences within rows. The differences observed among the +,++or +++ samples, compared with the controls or the - samples, were in all cases statistically significant (p<0.05).
-
Table 1—source data 1
β-lactamase assay data and statistical analysis for the SaPIbov1 Stl homologues.
- https://doi.org/10.7554/eLife.26487.021
Table 2
Unrelated SSAPs differentially induce PICIs from other species encoding SaPI2-like Stl repressorsa.
https://doi.org/10.7554/eLife.26487.022| SSAPs | ||||||
|---|---|---|---|---|---|---|
| Sak (80α) S. aureus | Chimera (80α) S. aureus | Sak (PH15) S. epidermidis | Sak4 (52A) S. aureus | Erf (SLT) S. aureus | Redβ (N315) S. aureus | |
| PICIs | ||||||
| SaPI2 | ++ | - | ++ | +++ | ++ | + |
| SeCINIHLM095 | ++ | - | ++ | - | ++ | - |
| ShaCI137133 | ++ | - | ++ | - | - | - |
| ScCIUMC-CNS990 | - | - | - | +++ | - | - |
-
aResults are from 3 independent β-lactamase/Nitrocefin assay experiments, using the dual plasmid system described in the text. Levels of induction were based on the calculated units/ml with the following ranges: (-): no induction, <1 Units/ml; (+): low induction, 1–5 Units/ml; (++): moderate induction, 5–10 Units/ml; (+++): high induction,>10 Units/ml. A 2-way ANOVA with Sidak's multiple comparisons test was performed to compare mean differences within rows. The differences observed among the +,++or +++ samples, compared with the controls or the - samples, were in all cases statistically significant (p<0.05).
-
Table 2—source data 1
β-lactamase assay data and statistical analysis for the SaPI2 Stl homologues.
- https://doi.org/10.7554/eLife.26487.023
Additional files
-
Supplementary file 1
Crystallographic statistics of the ϕO11-dUPNPP structure.
- https://doi.org/10.7554/eLife.26487.024
-
Supplementary file 2
Templates and confidence values in SaPIbov1 Stl repressor models generated by I-Tassera and Phyre2b servers.
- https://doi.org/10.7554/eLife.26487.025
-
Supplementary file 3
SSAPs present in S. aureus phages.
- https://doi.org/10.7554/eLife.26487.026
-
Supplementary file 4
(A) Templates and confidence values in recombinase models generated by I-Tasser servera.
(B) Templates and confidence values in recombinase models generated by Phyre2 servera.
- https://doi.org/10.7554/eLife.26487.027
-
Supplementary file 5
(A) Phage-inducible chromosomal islands analysed in this study.
(B) Description and relationships between the PICI-encoded Stl repressorsa.
- https://doi.org/10.7554/eLife.26487.028
-
Supplementary file 6
Putative SaPI inducers are present in phages infecting species other than S. aureus.
- https://doi.org/10.7554/eLife.26487.029
-
Supplementary file 7
Inter-species PICI transfer.
- https://doi.org/10.7554/eLife.26487.030
-
Supplementary file 8
(A) Bacterial strains used in this study.
(B) Plasmids used in this study. (C) Oligonucleotide designs used in this study.
- https://doi.org/10.7554/eLife.26487.031
-
Transparent reporting form
- https://doi.org/10.7554/eLife.26487.032
Download links
A two-part list of links to download the article, or parts of the article, in various formats.
Downloads (link to download the article as PDF)
Open citations (links to open the citations from this article in various online reference manager services)
Cite this article (links to download the citations from this article in formats compatible with various reference manager tools)
Pirating conserved phage mechanisms promotes promiscuous staphylococcal pathogenicity island transfer
eLife 6:e26487.
https://doi.org/10.7554/eLife.26487


